Article

Towards a Better Understanding of Long-Term Self-Forming Dynamic Membrane Bioreactor (SFDMBR) Performance: Effect of Aeration Intensity

1
Shandong Provincial Key Laboratory of Water Pollution Control and Resource Reuse, Shandong Key Laboratory of Environmental Processes and Health, School of Environmental Science and Engineering, Shandong University, Qingdao 266237, China
2
College of Safety and Environmental Engineering, Shandong University of Science and Technology, Qingdao 266000, China
3
State Key Laboratory of Microbial Technology, Shandong University, Qingdao 266237, China
*
Author to whom correspondence should be addressed.
Water 2022, 14(10), 1561; https://doi.org/10.3390/w14101561
Submission received: 22 April 2022 / Revised: 9 May 2022 / Accepted: 11 May 2022 / Published: 12 May 2022
(This article belongs to the Section Wastewater Treatment and Reuse)

Abstract

:
This study aims to provide valuable new insights regarding the effect of aeration intensity on long-term self-forming dynamic membrane bioreactor (SFDMBR) performance and the associated mechanisms. Three identical SFDMBRs, with different aeration intensities (i.e., 200, 500 and 800 L/h), were operated in constant transmembrane (TMP) mode for 60 days. The best chemical oxygen demand (COD) removal performance was achieved at medium aeration intensity, owing to the enhanced COD removal contribution by the self-forming dynamic membrane (SFDM). As expected, the SFDM formation time was extended with increasing aeration intensity. Different from the initial short-term stage results, it was interestingly found that the SFDMBR operated at medium aeration intensity exhibited the best long-term filtration performance, followed in order by the SFDMBRs with low and high aeration intensity, respectively. Further analysis revealed that the governing fouling mechanism transited from biomass accumulation to the increase of specific resistance, as aeration intensity increased. The variation of SFDM-specific resistance was verified with particle size distribution (PSD) data and scanning electron microscopy (SEM) images. The long-term increasing rate of SFDM filtration resistance was consistent with both extracellular polymeric substances (EPS) content and the proteins/polysaccharides (PN/PS) ratio of SFDMs. Internal EPS production was enhanced in the thicker SFDM formed at a lower aeration intensity.

1. Introduction

As one attempt to make membrane bioreactors (MBRs) more affordable, self-forming dynamic membrane bioreactors (SFDMBRs) have emerged and turned out to be more cost-effective for treating various types of wastewaters [1,2,3,4,5]. The investment and operational costs of SFDMBRs are lower than those of MBRs, basically due to the use of coarse-pore materials, instead of microfiltration (MF)/ultrafiltration (UF) membranes, for solid-liquid separation. The insufficient solid–liquid separation efficiency of coarse-pore materials is successfully complemented by the sludge layers initially formed on them during filtration, termed as self-forming dynamic membranes (SFDMs) [6,7,8,9,10]. Compared with MF/UF membranes, the coarse-pore materials (e.g., nylon mesh and non-woven fabric) have a cheaper price, and the SFDMs possess lower filtration resistance and can be more easily cleaned/regenerated on-site [7,11,12]. The better economic applicability of SFDMBRs makes them of important practical meaning in developing countries/regions.
The overall performance of SFDMBRs is significantly affected by some important design parameters, such as aeration intensity, permeate flux, hydraulic retention time (HRT), and sludge retention time (SRT) [2,13,14,15]. Proper selection of design parameters is of key importance for optimizing SFDMBR performance. Among the various design parameters, aeration intensity has attracted great attention in both MBRs and SFDMBRs, since it directly affects not only the biodegradation process but also the membrane filtration process [13,16,17]. In particular, air scouring is the most important measure for membrane fouling control in MBR operation [18]. Different from the case of MBR only having a membrane fouling stage, the operation of SFDMBR includes two stages: the initial SFDM formation stage wherein the sludge deposition on coarse-pore materials is necessary and needed, and then the SFDM fouling stage wherein subsequent sludge deposition is unnecessary and better to be avoided [19]. The role of aeration is more complicated in SFDMBRs, taking into account the extra initial SFDM formation stage.
Thus far, the effect of aeration on SFDMBR performance was mainly investigated via short-term experiments for no more than 6 h (i.e., the initial SFDM formation stage) [6,13,14,20,21]. Efforts were focused on evaluating the effluent turbidity and filtration resistance of SFDMs at different aeration intensities. The decline rate of effluent turbidity generally slowed down with increasing aeration intensity [13,17,21]. However, the variation of filtration resistance with aeration intensity turned out to be complicated. In some cases, it increased with aeration intensity, whereas in other cases it decreased with increasing aeration intensity to a certain value and then increased [20,21]. Moreover, the effect of aeration on SFDM characteristics was rarely studied. Sabaghian et al. [14] investigated the effectiveness of the static mixer in the formation and filtration of SFDM at different aeration intensities. They found that aeration intensity significantly affected the mean particle size, soluble microbial products (SMPs), average thickness and porosity of SFDMs.
The findings of short-term experiments, though valuable, are not fully applicable to the long-term performance of SFDMBRs, due to the change in SFDM properties over time. Thus far, few efforts have been devoted to investigating the effect of aeration intensity on long-term SFDMBR performance and analyzing the associated mechanisms. In an early study, W. Fuchs et al. [22] investigated the average effluent concentration of chemical oxygen demand (COD) and suspended solids at two aeration intensities during a one-week SFDMBR operation. More effluent quality parameters were measured in a recent study investigating the SFDMBR performance at three aeration intensities [23]. However, the effect of the aeration intensity on SFDMBR performance remains unclear in terms of the role of SFDM in pollutant removal, the fouling-related characteristics in both mixed liquors and SFDMs, and the main mechanisms governing the increase of SFDM filtration resistance.
The main objective of this study was to contribute toward a better understanding of the effect of aeration intensity on the long-term performance of SFDMBRs. Three identical SFDMBRs were operated in constant transmembrane (TMP) mode at different aeration intensities for 60 days. The concentrations of COD and NH3-N in the supernatant were measured and compared with those in the effluent, so that the contribution of SFDM to pollutant removal at different aeration intensities could be evaluated. The respective contribution of biomass accumulation and specific resistance to the increase of SFDM filtration resistance was investigated with aeration intensity. The structure of SFDMs was illustrated with scanning electron microscopy (SEM) images. The particle size distribution (PSD) and extracellular polymeric substances (EPS) of both mixed liquors and SFDMs were analyzed, based on which the main mechanisms governing the long-term increase of SFDM filtration resistance at different aeration intensities were elucidated. Our results may provide valuable new insights regarding the effect of aeration intensity on long-term SFDMBR performance.

2. Materials and Methods

2.1. Experimental System and Operating Conditions

The experimental system consisted of three identical SFDMBRs operated in parallel at different aeration intensities (Figure 1). They were designated as SFDMBR-L, SFDMBR-M and SFDMBR-H, corresponding to the low (200 L/h), medium (500 L/h), and high (800 L/h) aeration intensity, respectively. The selection of the aeration intensity was according to its range (i.e., 120–1080 L/h) reported in the literature [17,22,23]. Each SFDMBR had an effective volume of 16 L, in which a flat-sheet filtration module was submerged for solid-liquid separation. The filtration module was made of coarse-pore polyester non-woven fabrics with a pore size of roughly 30 μm. Its effective filtration area is 0.12 m2. Aeration was done through the air diffuser installed right beneath the filtration module. The dissolved oxygen (DO) concentration was in the range of 2.5–7.5 mg/L with the corresponding energy consumption of 1.23–4.94 kWh/m3.
The seed sludge was taken from the aerobic tank in a local municipal wastewater treatment plant. It was acclimatized for around 40 d prior to the experiment. Synthetic municipal wastewater was used in this work. Its COD concentration was 320 ± 20 mg/L with a COD:N:P mass ratio of 100:10:1. The composition of synthetic municipal wastewater can be found in our previous work [19]. The feed flow rate was controlled by the water level sensor to maintain a constant water level in the SFDMBRs, i.e., 2 cm higher than the effluent outlet. The SFDMBRs were operated in constant transmembrane pressure (TMP) mode. Due to the low filtration resistance of SFDM formed on the filtration module, the required TMP (i.e., 2 cm hydraulic head) can be fully provided by the hydraulic head difference between the water level in the SFDMBR and the effluent outlet. Effluent pumps can thus be discarded in SFDMBR operation. Accordingly, the cost of the effluent pump and its energy consumption during operation can be saved.
The entire experimental period lasted 60 d. In constant TMP mode, the effluent flux of SFDMBRs would gradually decrease with operating time, due to the increase of SFDM filtration resistance. The SFDMBRs were thus operated in cycles according to flux variation. When the flux decreased to 15 L/m2·h, the productivity of SFDMBRs was considered unacceptably low and the cycle ceased. Physical cleaning was then carried out and the cleaned filtration module was used for the next cycle. The cycle time of SFDMBR, fundamentally determined by the increasing rate of SFDM filtration resistance, substantially varied with the change in aeration intensity.
The HRT and organic loading rate (OLR) were in the range of 5–7 h and 1.0–1.5 kg COD/m3 d, respectively. They were not constant because the effluent flux gradually decreased with time. The SRT was controlled constant at 20 d by withdrawing 0.8 L sludge from the SFDMBR every day. Accordingly, the mixed liquor suspended solid (MLSS) concentrations were around 5000–6000 mg/L.

2.2. Analytical Methods

2.2.1. Routine Measurements

The chemical oxygen demand (COD) and ammonium (NH3-N) concentrations in influent, supernatant, and effluent were measured according to the Standard Methods [24]. The supernatant was obtained by centrifuging the mixed liquor at 10,000 rpm for 10 min at 4 °C, followed by filtrating through a membrane of 0.45 μm. The permeate flux and turbidity were monitored using the volumetric method and a turbidity meter (2100Q, HACH, CO, USA), respectively.

2.2.2. SFDM Sample Collection

The filtration module was taken out from each SFDMBR at the end of the operation. The SFDMs (i.e., sludge layers) formed on the coarse-pore non-woven fabric were carefully scraped off by a clean plastic sheet and flushed with distilled water. The collected SFDM samples were placed on a magnetic blender (MYP11–2, Meiyinpu Instrument Incorporated, Shanghai, China) and well mixed for subsequent PSD and EPS analyses.

2.2.3. PSD and EPS Analysis of Mixed Liquor and SFDM Samples

The PSD was determined by a laser diffraction particle size analyzer (Mastersizer 2000, Malvern Instruments, Malvern, UK), which has a measurement range of 0.02–2000 μm.
The extraction of EPS from SFDMs and mixed liquors was conducted according to the cation exchange resin (Na+ form, Dowex, MI, USA) method, as described by Frølund et al. [25]. The samples (60 mL) were firstly taken and centrifuged at 3500 rpm for 15 min at room temperature. The sludge pellets were resuspended to their original volume using a buffer consisting of 2 mM Na3PO4, 4 mM NaH2PO4, 9 mM NaCl and 1 mM KCl at pH 7. Then, the sludge was transferred to an extraction beaker with buffer and the CER (70 g/g-MLSS) was added. The suspension was stirred for the selected stirring intensity (900 rpm) and extraction time (2 h). The selected EPS was harvested by centrifuging the sample of CER/sludge suspension for 15 min at 8000 rpm at room temperature in order to remove the CER and MLSS. The proteins and carbohydrates, the major EPS components under the investigated condition, were determined colorimetrically using the Lowry method with bovine serum albumin as a standard and the phenol–sulfuric acid method with glucose as a standard, respectively [26,27].

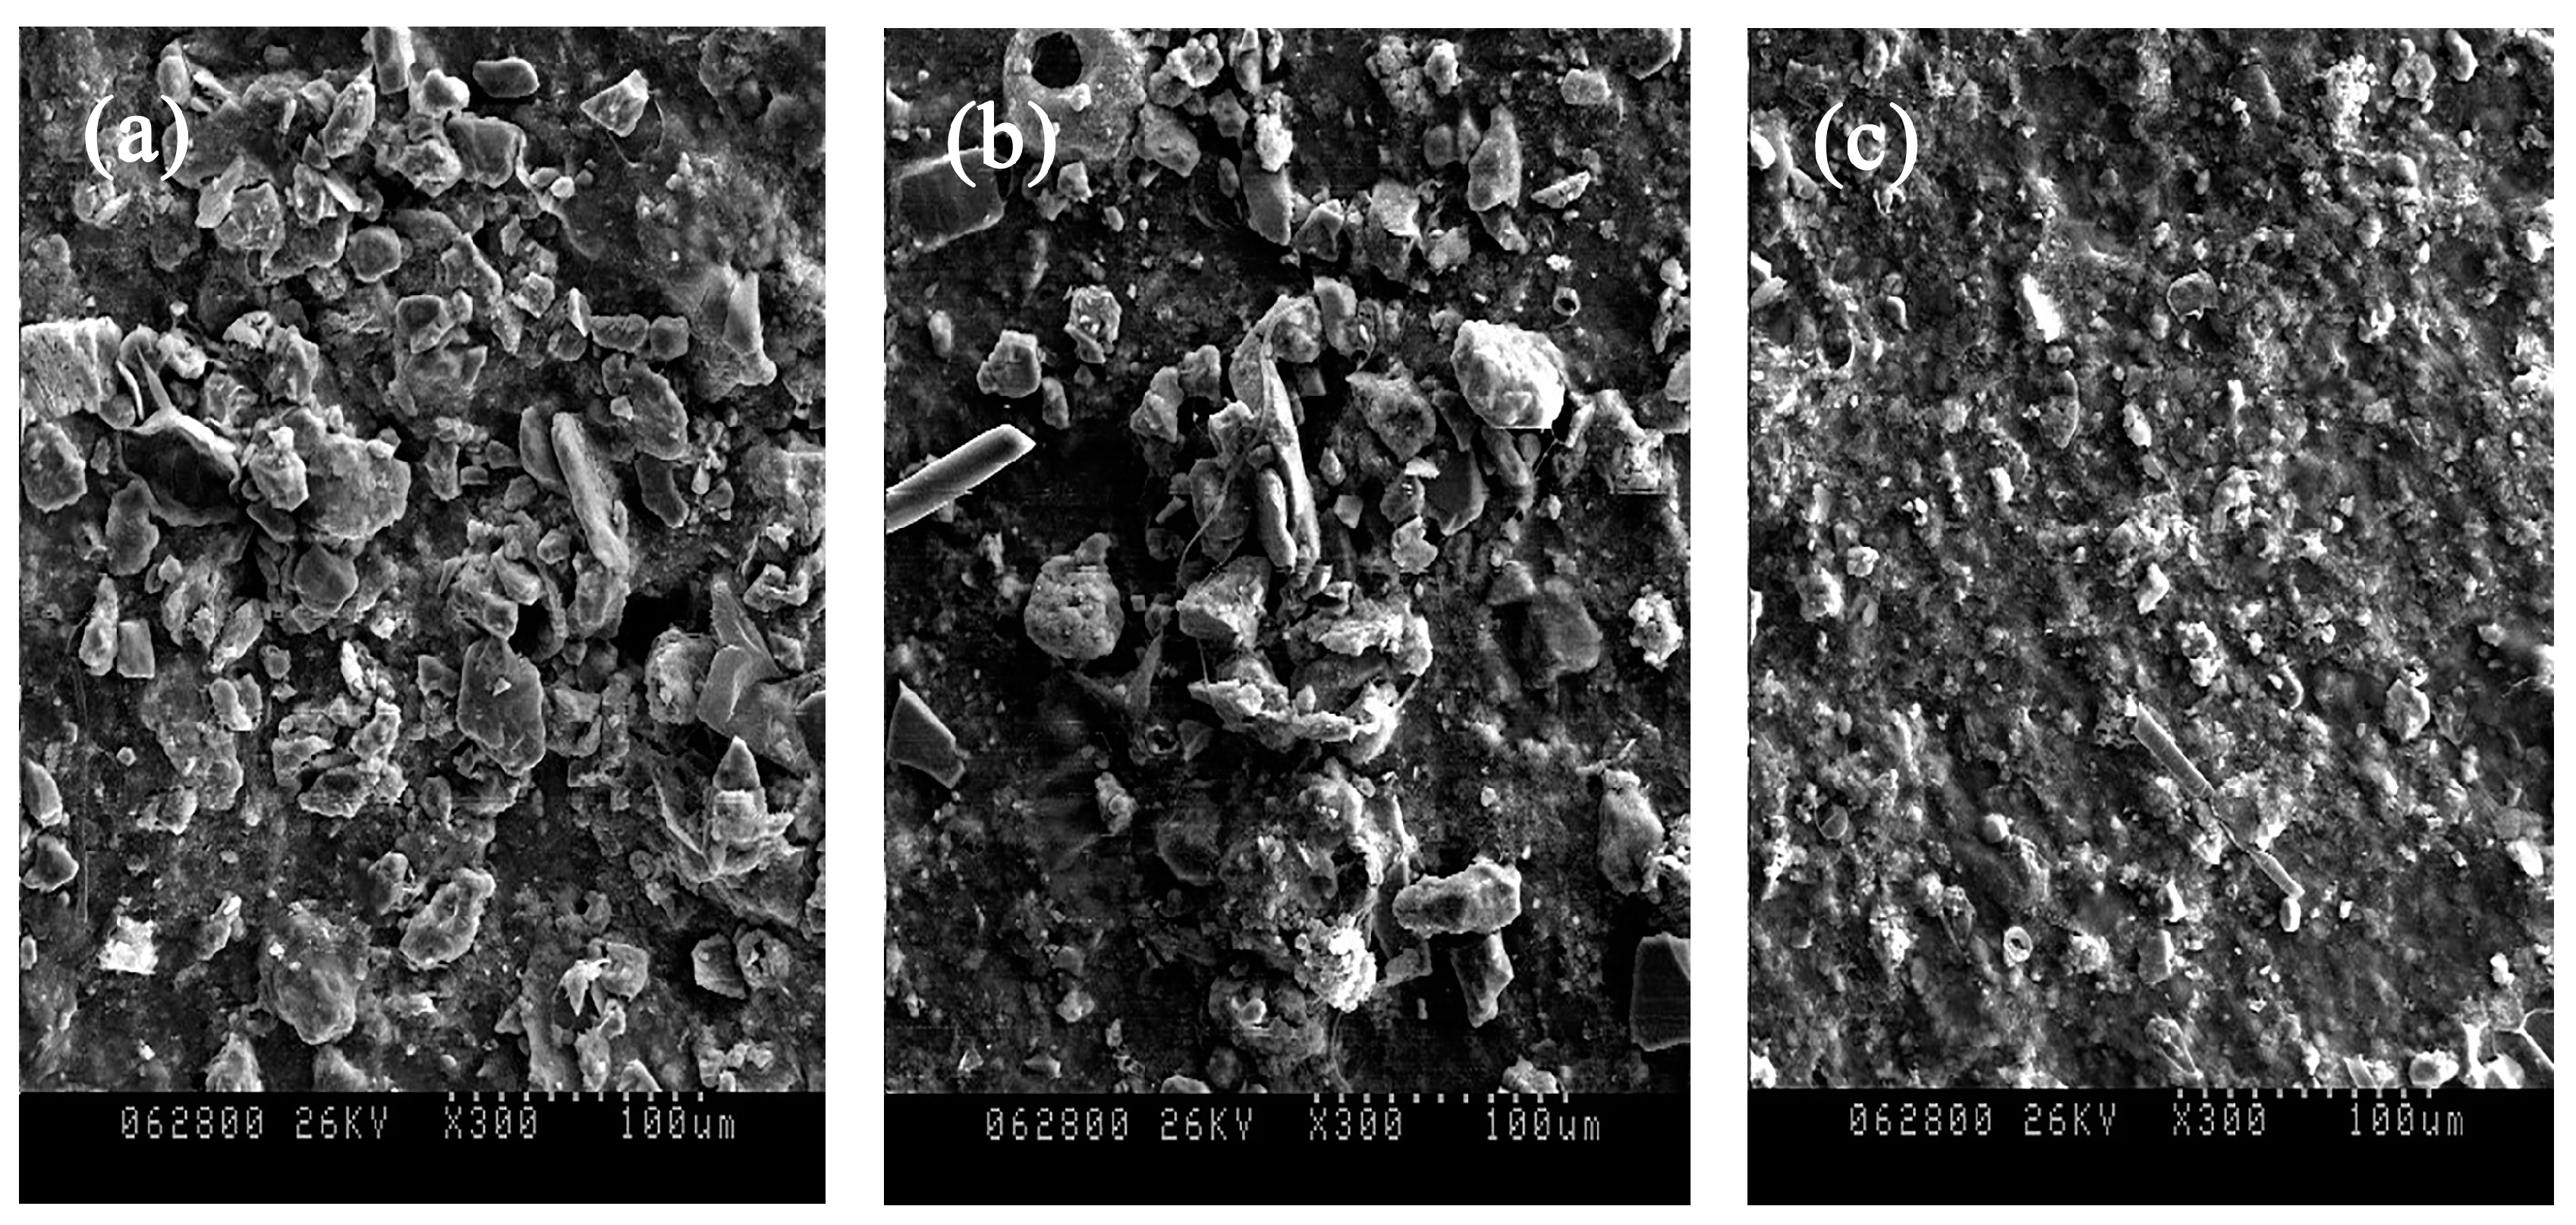
2.2.4. SEM Analysis of SFDM Samples

Several pieces of the coarse-pore non-woven fabric covered with SFDM were cut from the central area of the filtration module. They were firstly fixed by means of 2.0% glutaraldehyde in 0.1 M phosphate buffer at pH 7.2 for 2 h and then washed using phosphate buffer three for 10 min. The fixed samples were dehydrated with natural air-drying and coated with aurum–platinum alloy for SEM analysis (S-570, Hitachi, Tokyo, Japan).

2.2.5. Filtration Resistance, Specific Resistance and the Increasing Rate of Filtration Resistance

The resistance of the filtration module can be calculated according to Darcy’s law as follows [19]:
R t = Δ P μ J
where Rt is the total resistance of the filtration module (m−1), ΔP is the TMP (Pa), μ is the permeate viscosity (Pa·s), and J is the effluent flux (m3/m2·h).
The total resistance can be expressed as [19]:
R t = R m + R s
where Rm is the intrinsic resistance of coarse-pore non-woven fabrics (m−1), which was measured via clean water filtration tests, and Rs is the resistance of SFDM (m−1).
The specific resistance of SFDM at the end of the operation was determined using the following expression [28]:
α = R s m
where α is the specific resistance of SFDM (m/kg), m is the accumulated biomass of SFDM per unit membrane area (g/m2).
The increasing rate of filtration resistance was determined using the following expression [19]:
k R = Δ R Δ t = R t e R m Δ t
where kR is the increasing rate of SFDM filtration resistance, ΔR represents the increase of filtration resistance over the entire cycle (m−1), Δt is the cycle time of each SFDMBR, Rte is the final resistance of the filtration module measured at the end of a cycle (m−1). Since the Rte and Rm in each SFDMBR were similar to each other, the different kR values of SFDMBRs operated with different aeration intensities are solely determined by their cycle time. The lowest kR value corresponds to the longest cycle time achieved at the optimal aeration intensity.

3. Results and Discussion

3.1. Effect of Aeration Intensity on SFDMBR Performance

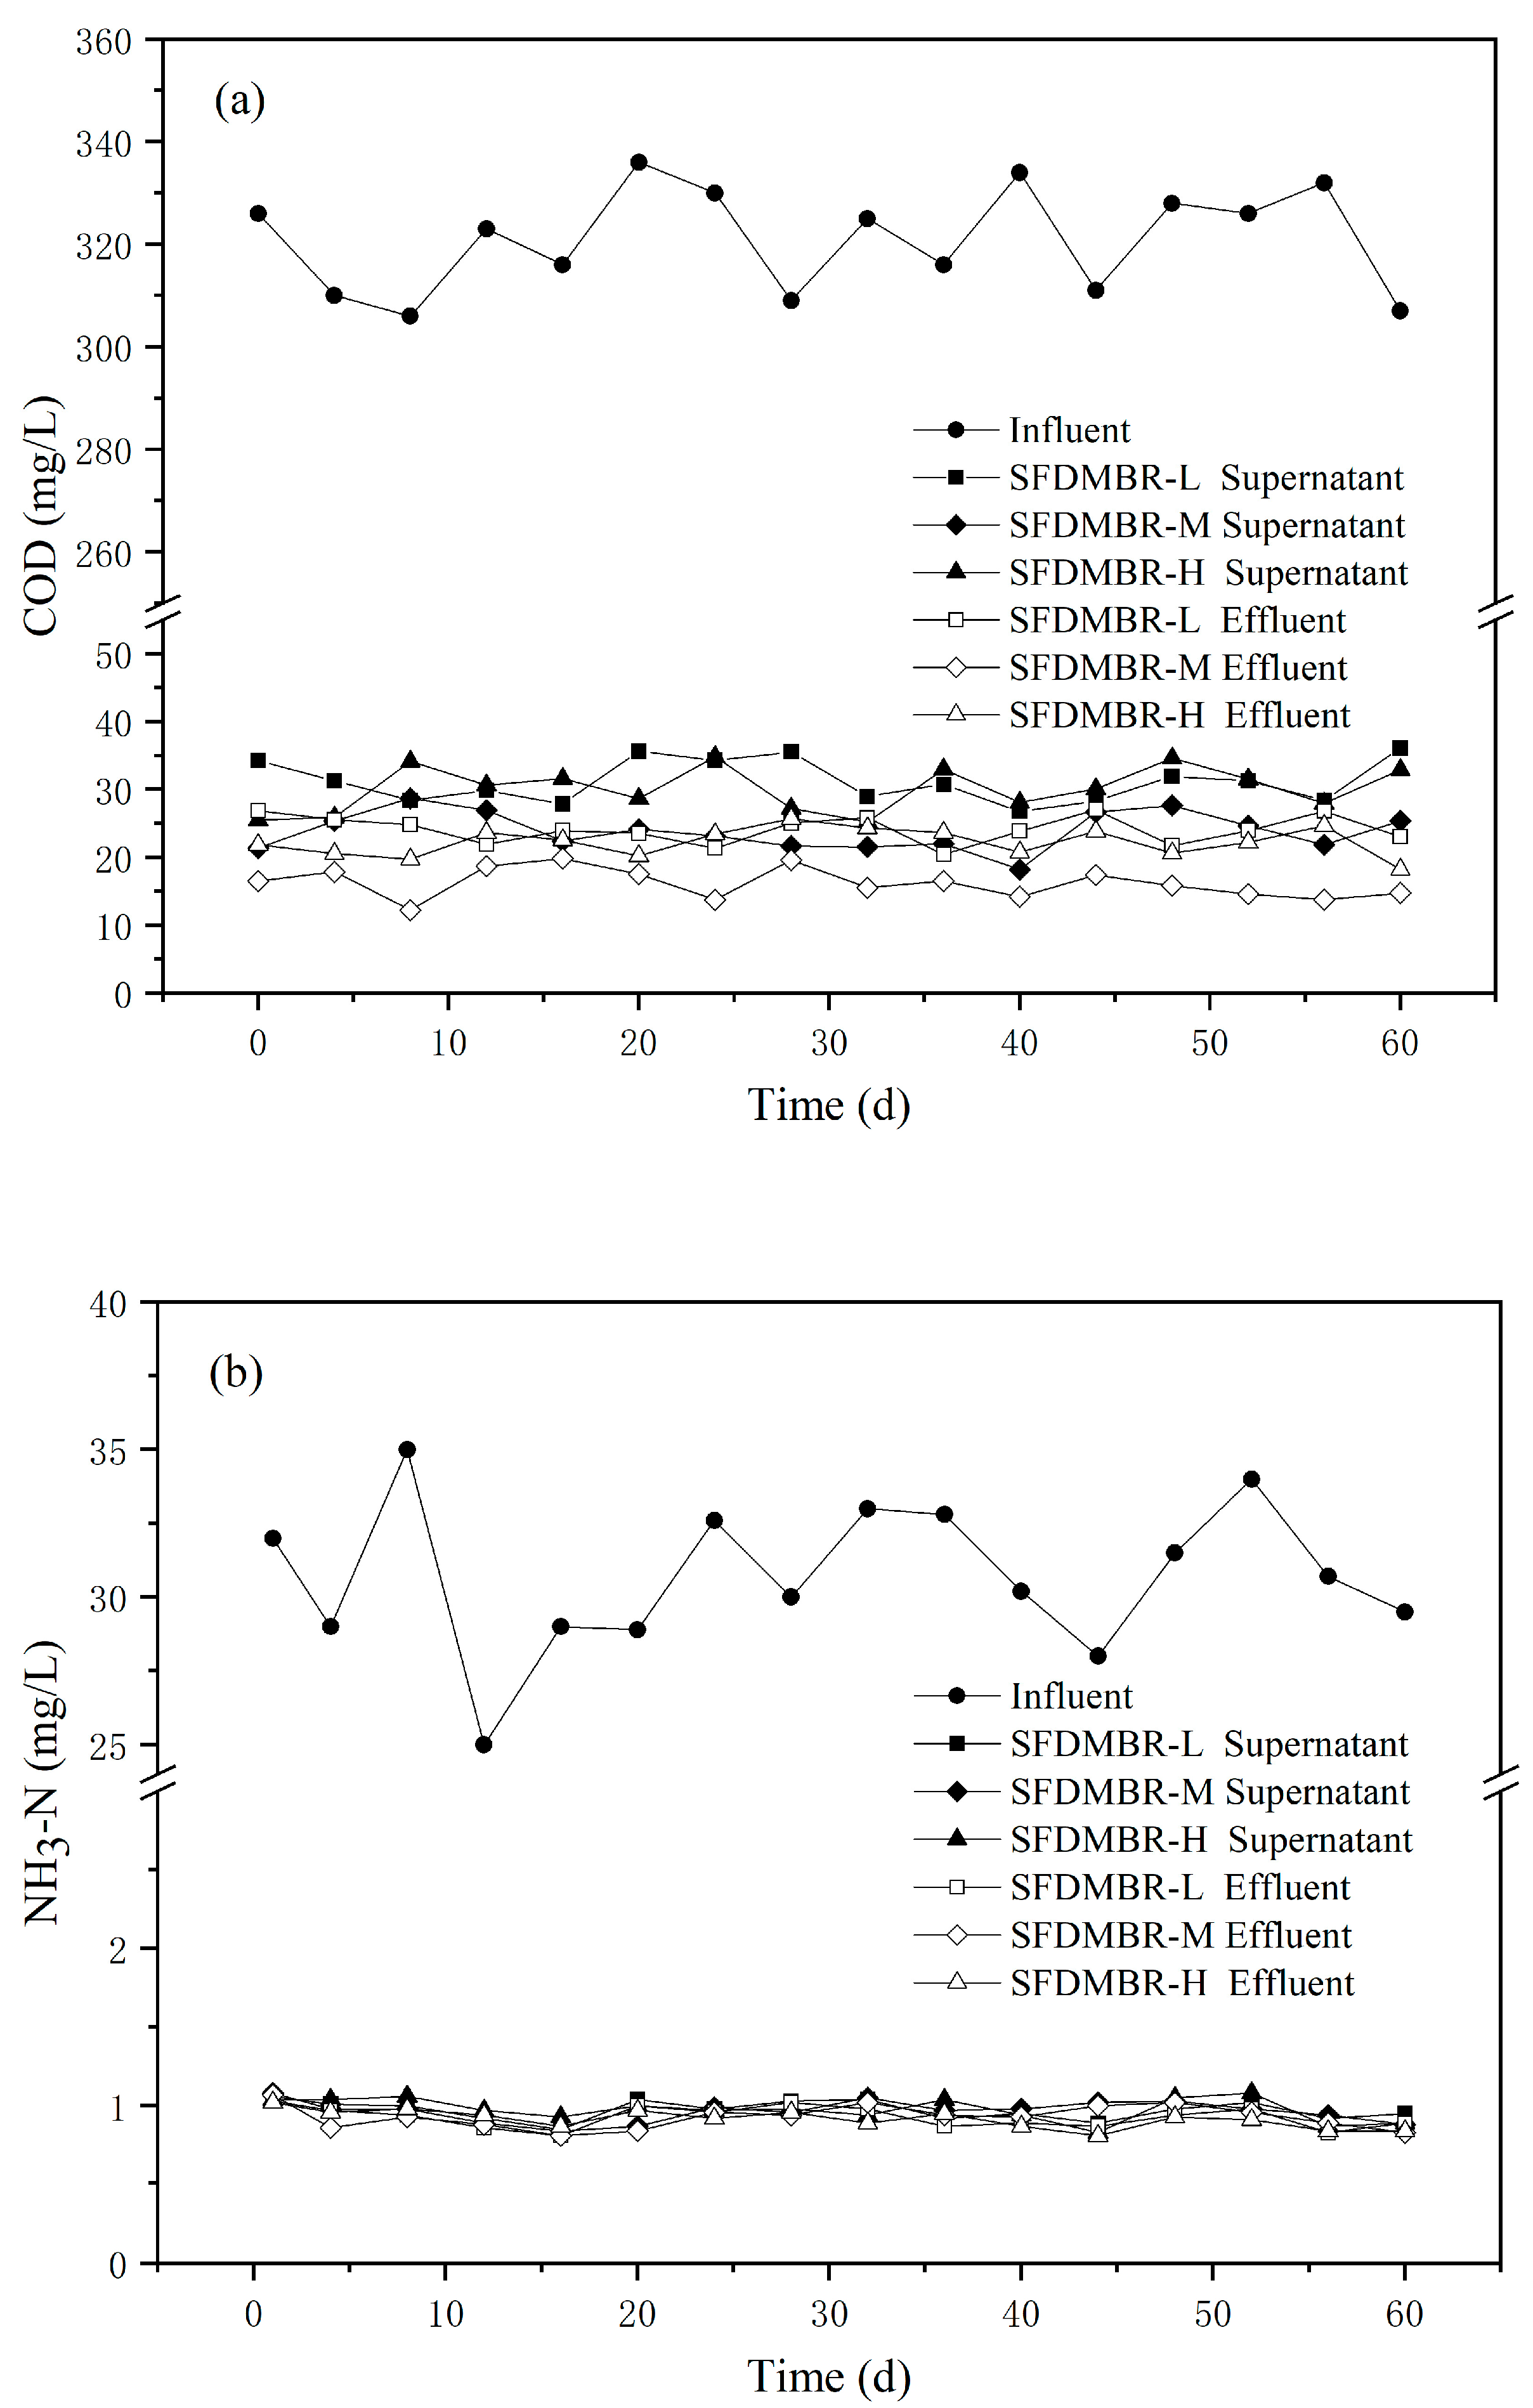
3.1.1. COD and NH3-N Removal Performance of SFDMBRs at Different Aeration Intensities

Figure 2 illustrates the removal performance of COD and NH3-N by SFDMBRs at three different aeration intensities over the entire operational period of 60 d. Apart from measuring their effluent concentrations, the supernatant concentrations of COD and NH3-N were monitored. Therefore, the contributions of SFDMs to the removal of COD and NH3-N at different aeration intensities can be evaluated, which has never been reported in the literature. It can be seen from Figure 2a that the effluent COD concentrations of all three SFDMBRs were maintained at a low level around 20 mg/L throughout the experimental period. The average effluent COD concentrations of the SFDMBR-L, SFDMBR-M and SFDMBR-H were 24.12, 16.17 and 22.26 mg/L, corresponding to the removal efficiencies of 92.48%, 94.96% and 93.06%, respectively. It seems that the SFDMBRs generally achieve excellent COD removal efficiency, regardless of aeration intensity, and the best performance occurs at medium aeration intensity.
Moreover, it was noted that effluent COD concentrations were always significantly lower than supernatant COD concentrations. As reported in previous studies, the reduction of COD concentration after passing through the SFDM demonstrates the important role of SFDM in COD removal [1,29,30]. It has been reported that SFDMs can remove COD not only by physical interception, such as conventional MF/UF membranes, but also via biodegradation owing to a large amount of biomass in SFDMs [1,31]. The average contributions of SFDMs to the removal of COD were calculated to be 22.77%, 32.25% and 26.12% for SFDMBR-L, SFDMBR-M, and SFDMBR-H, respectively. Similar to the trend observed for the overall COD removal efficiency, the best SFDM performance in terms of COD removal also occurred at medium aeration intensity. Different overall COD removal efficiencies observed at three aeration intensities are therefore probably attributed to the SFDMs with different properties.
Under the investigated condition, the aeration intensity at either too high (800 L/h) or too low (200 L/h), adversely affected COD removal efficiency. At high aeration intensity, biomass deposition onto the filtration module would be better prevented, resulting in a thinner SFDM [14]. It is, therefore, speculated that the SFDM formed at the highest aeration intensity may be too thin with reduced interception capacity. On the contrary, the lowered aeration intensity may result in a thicker SFDM with reduced bio-logical activities, due to nutrient/oxygen transfer limitations. The reduction in the interception of thinner SFDM or biodegradation of thicker SFDM would weaken the SFDM contribution to COD removal. The medium aeration intensity, therefore, turned out to be the best option, at which condition the SFDM was formed with a suitable thickness in terms of COD removal. The properties of SFDMs will be further examined, considering their critical importance in evaluating the effect of aeration intensity on SFDMBR performance.
It is noteworthy, however, that the variation of COD removal efficiency with aeration intensity would also be affected by effluent turbidity. Recently, Carlo Salerno et al. [23] reported that average effluent COD concentrations were roughly the same at the relatively low aeration intensity of 150 and 250 mL/min, but significantly increased as the aeration intensity increased to 500 mL/min. The effluent turbidity, meanwhile, exhibited a similar trend. The increased effluent COD concentration may be attributed to the increased effluent turbidity at the highest aeration intensity. This is, however, not the case in our study, wherein the effluent turbidity was low at all aeration intensities. The stable low effluent turbidity maintained throughout the cycle time will be discussed later.
Figure 2b shows the influent, supernatant and effluent concentrations of NH3-N at three different aeration intensities. The effluent NH3-N concentrations were very low, i.e., around 1 mg/L. This indicates that SFDMBRs achieve nearly complete nitrification. Carlo Salerno et al. [23] also reported the low effluent NH3-N concentrations (i.e., <1 mg/L) from SFDMBRs at three different aeration intensities. Moreover, it was found that the effluent NH3-N concentrations were roughly the same as supernatant NH3-N concentrations in all cases. This means that SFDMs have a limited effect on NH3-N removal. Our findings are consistent with those reported in the literature [30]. The removal of NH3-N by SFDMs was in the range of 3.63–4.21%. The negligible contribution of SFDMs to NH3-N removal is mainly attributed to the low molecular weight of NH3-N, the size of which is far smaller than the pore size of SFDM with a molecular weight cut-off over 1000 kDa.

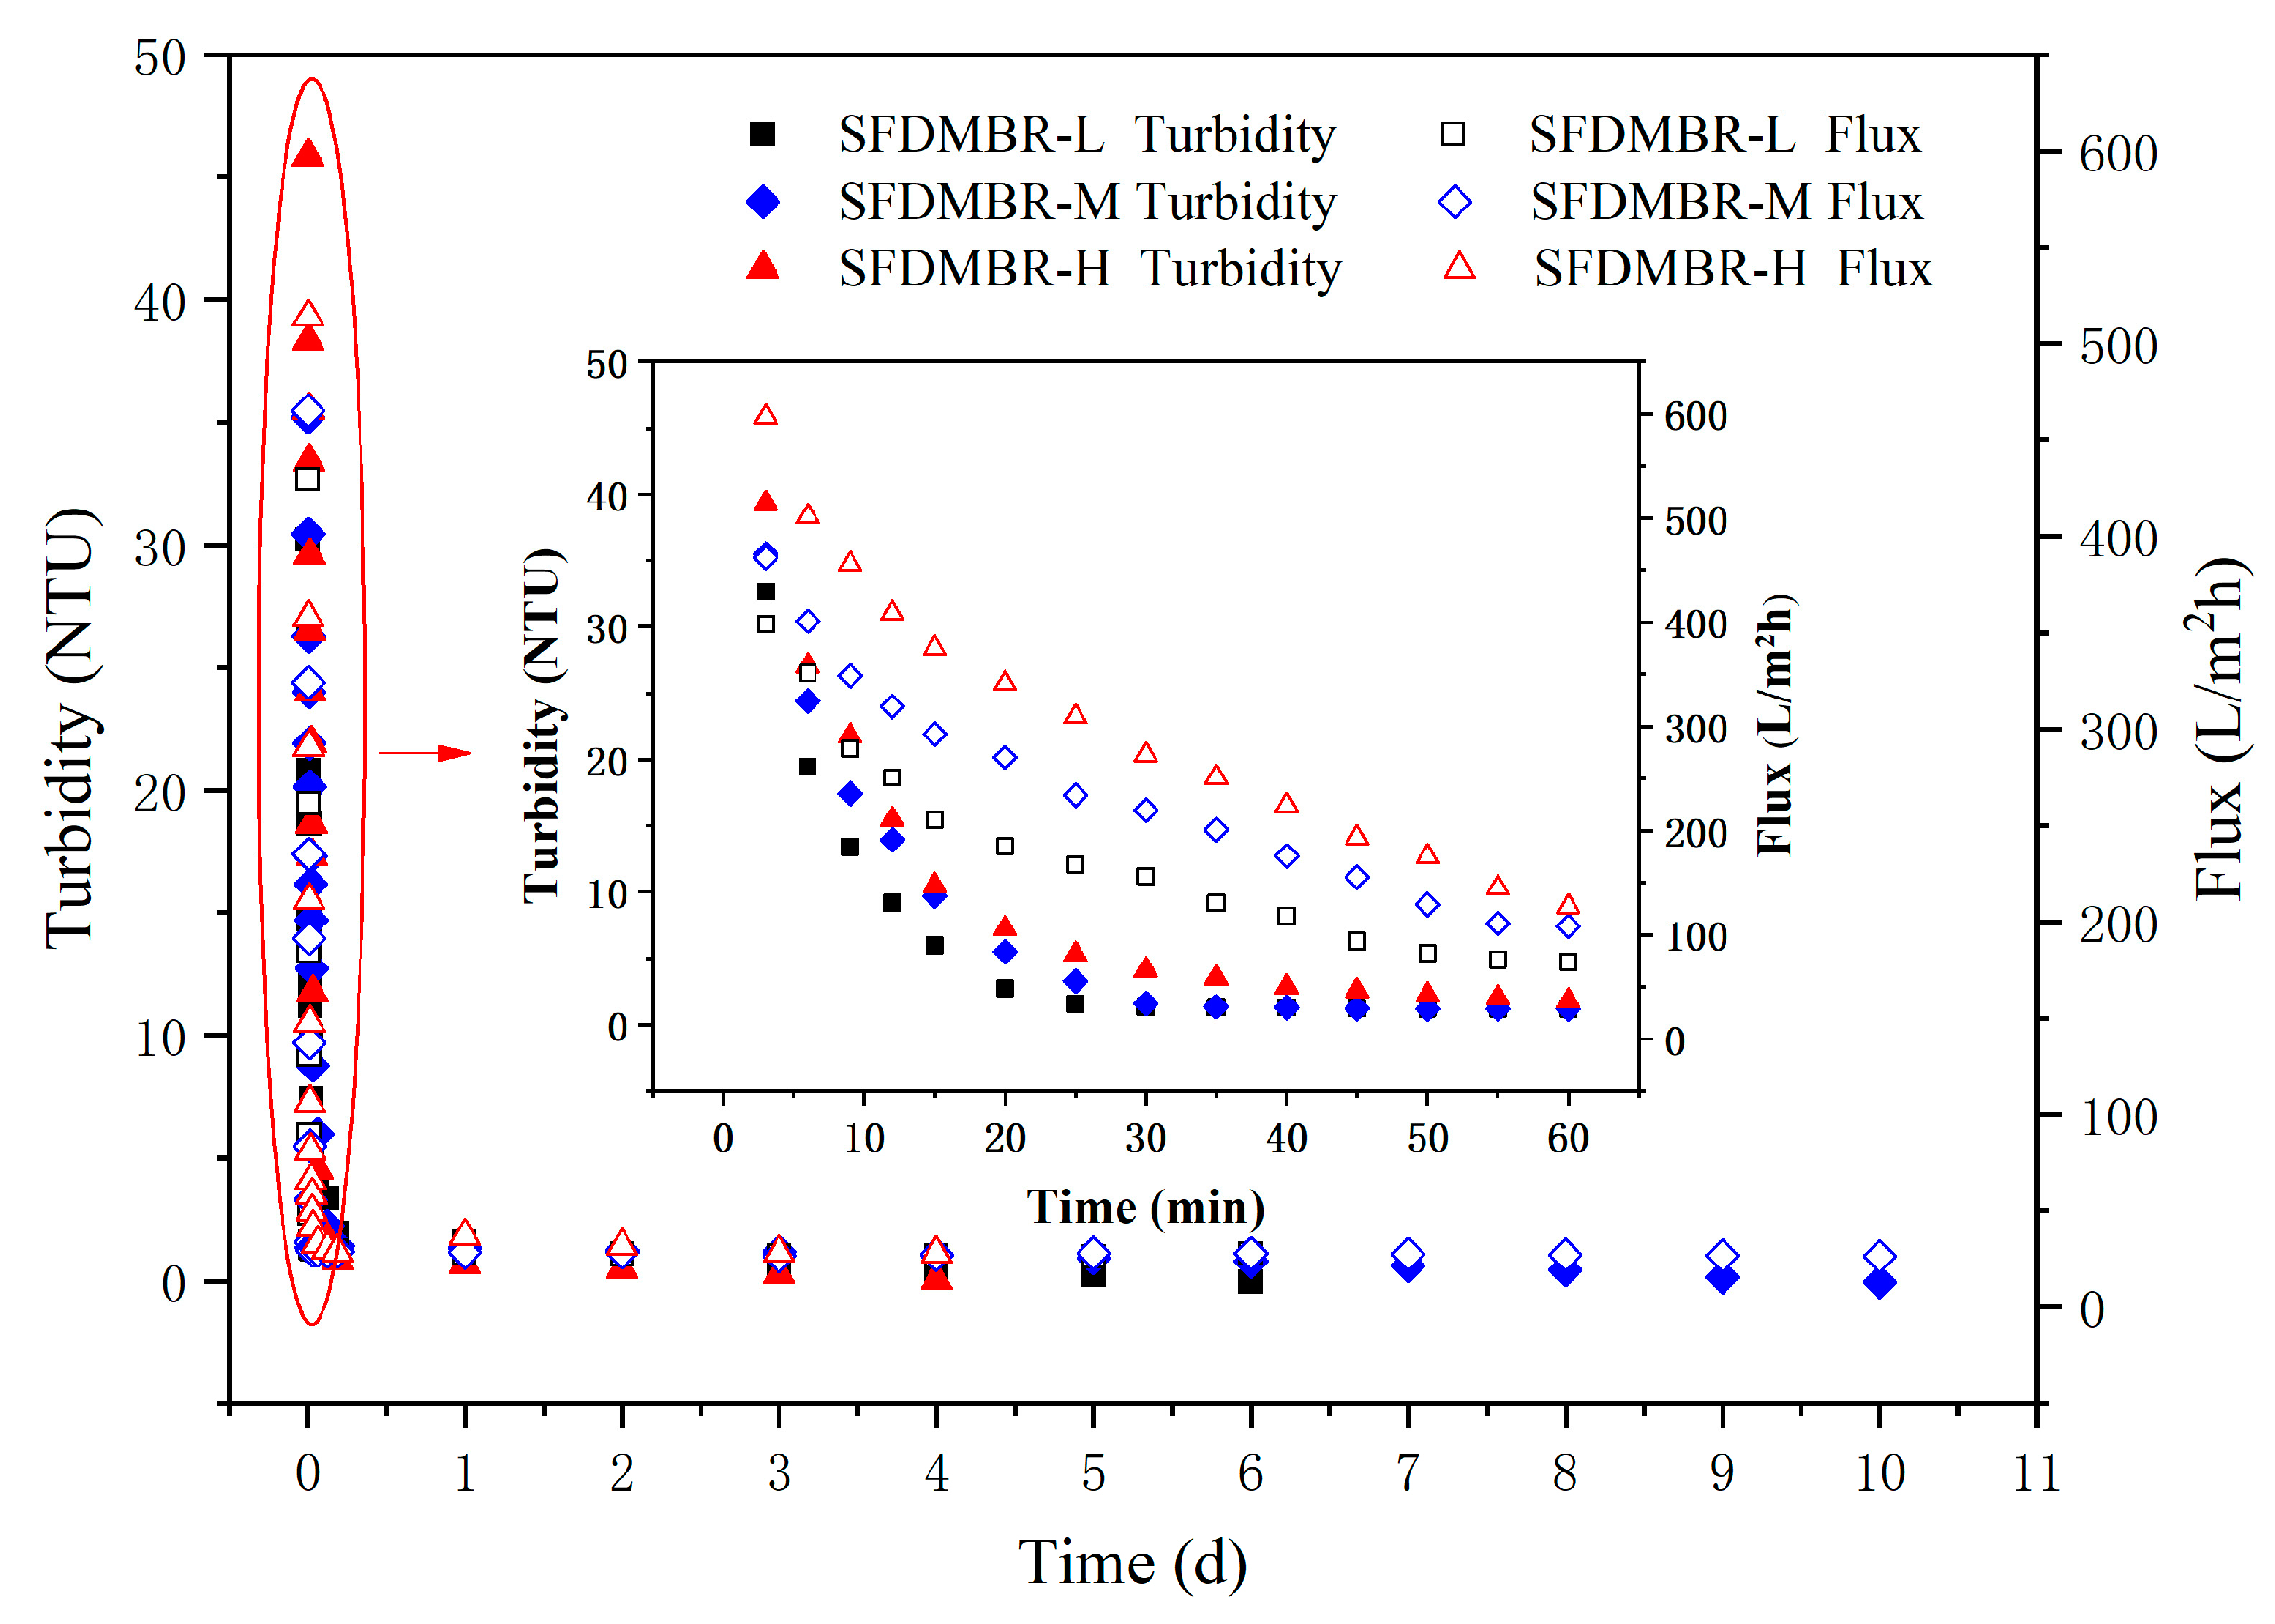
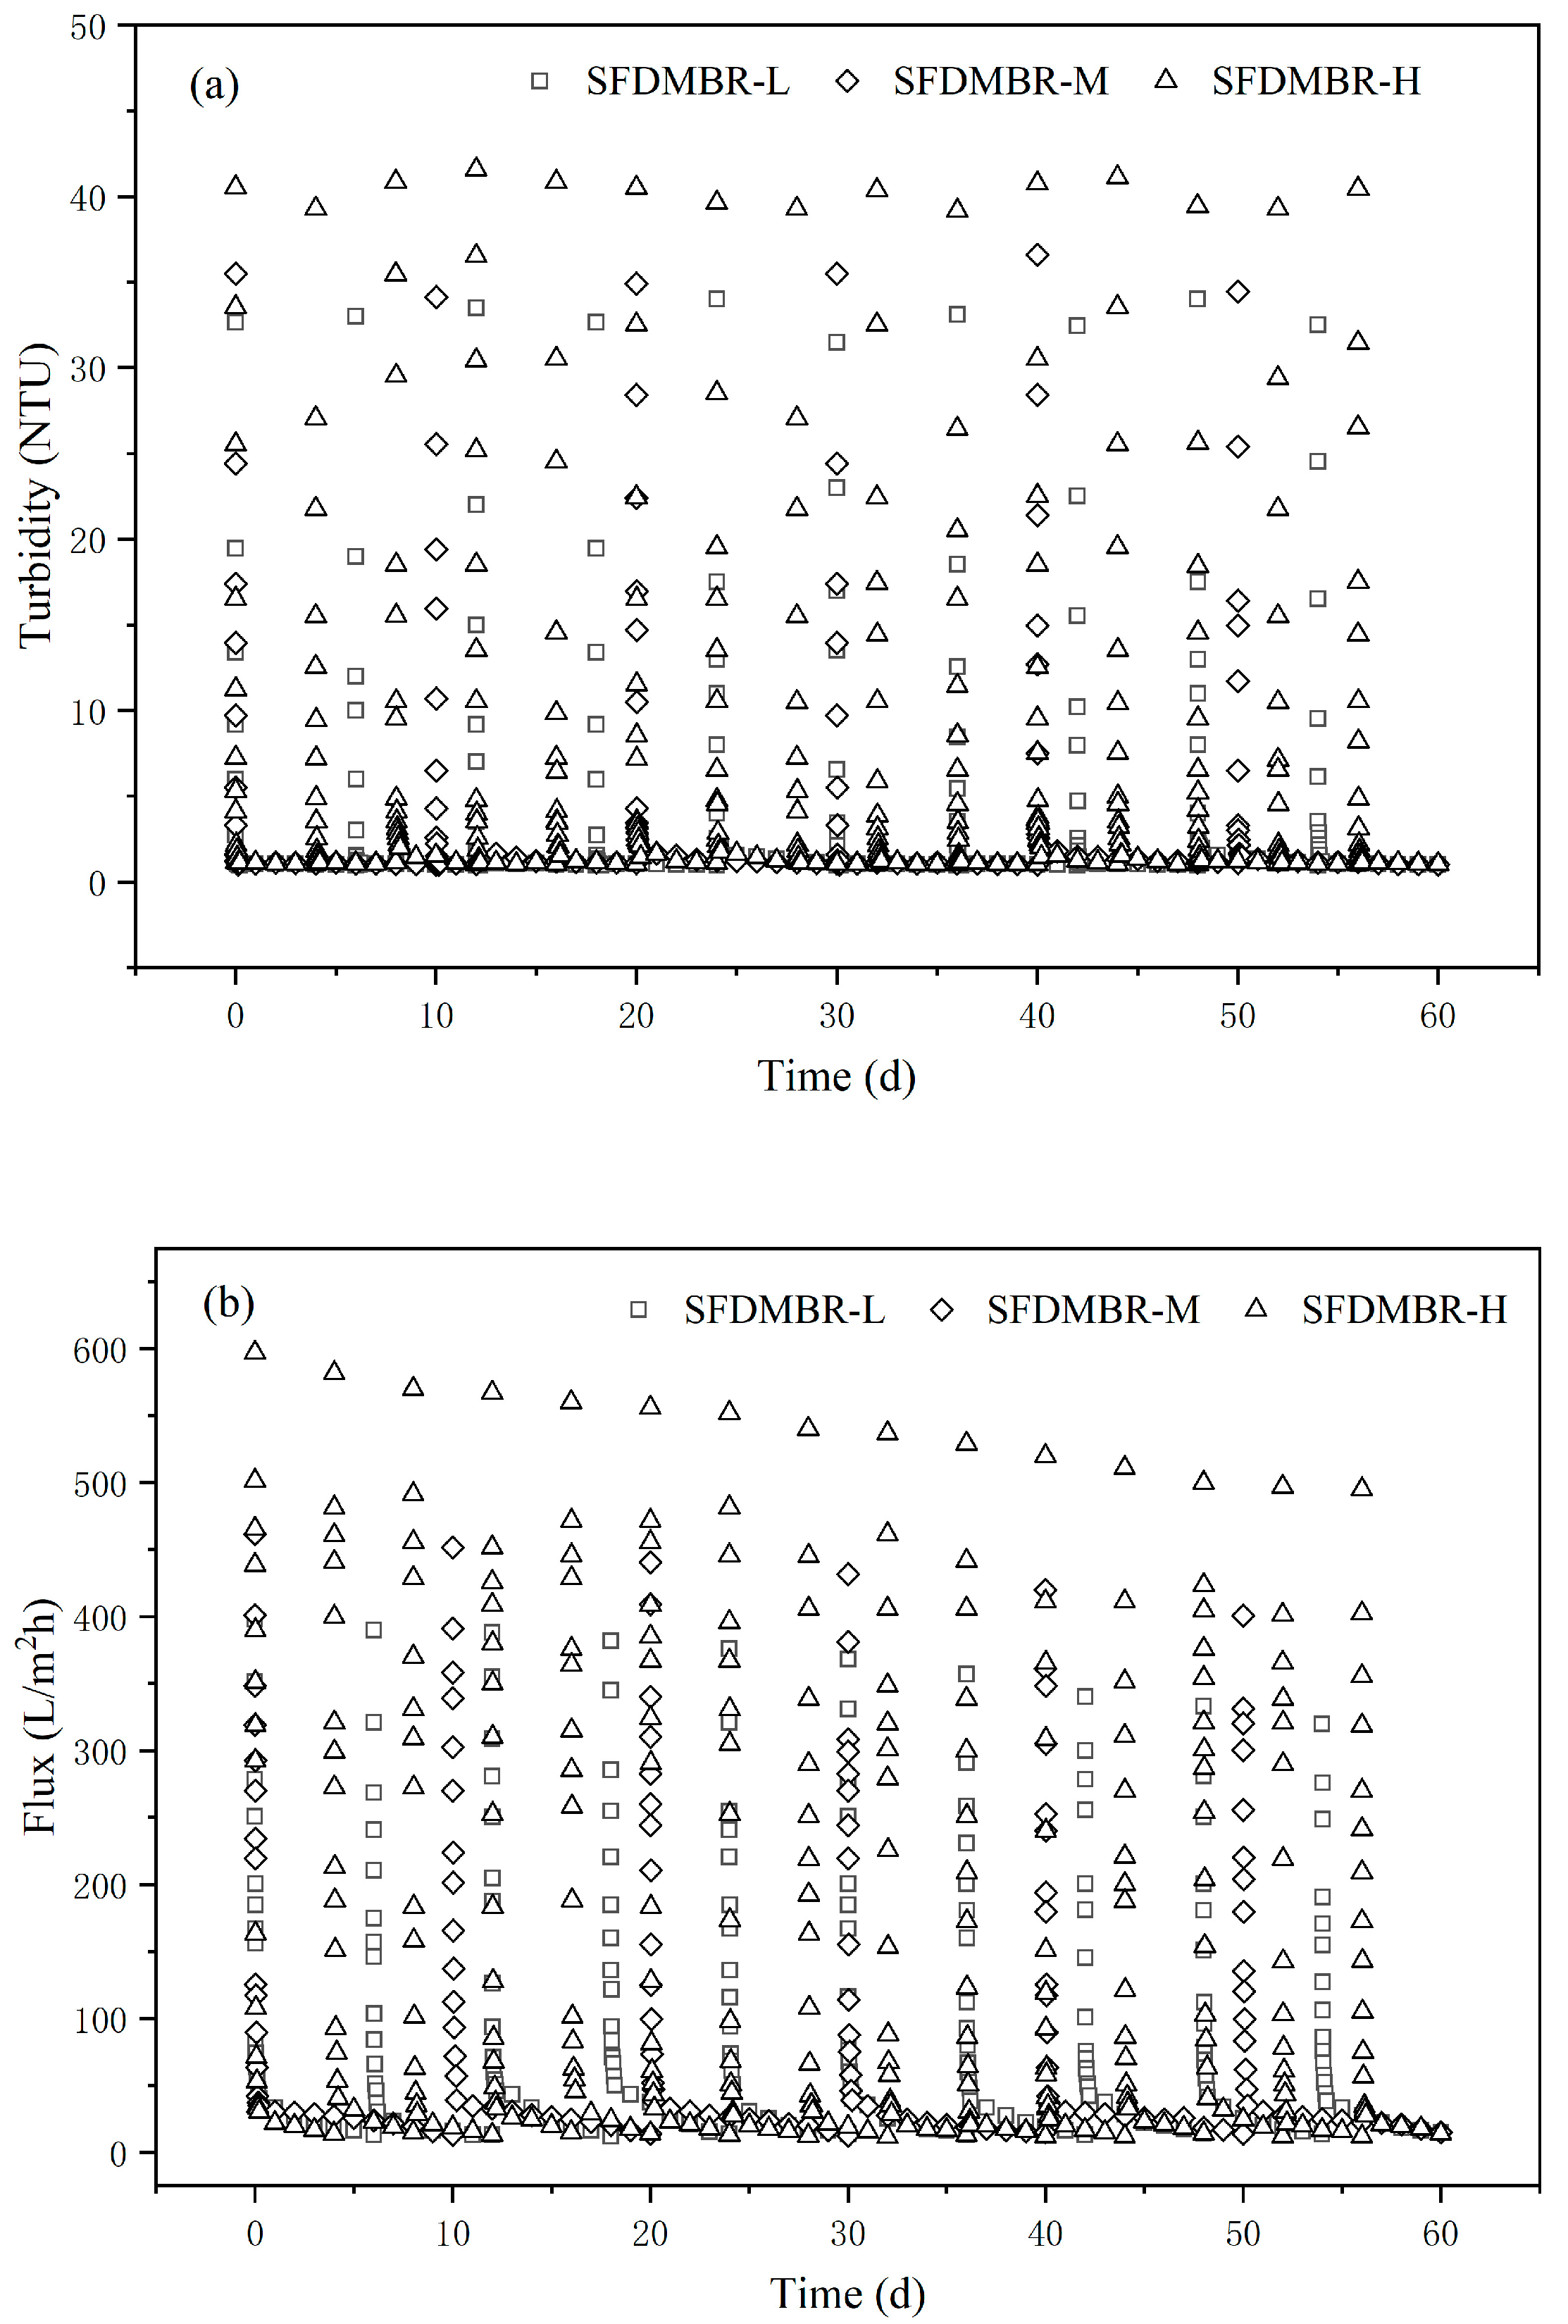
3.1.2. Filtration Performance of SFDMBRs at Different Aeration Intensities

Figure 3 shows the filtration performance of SFDMBRs regarding effluent turbidity and permeate flux at different aeration intensities. Over the 60-d operation, there were 10, 6 and 15 cycles, corresponding to the cycle time of 6, 10 and 4 d, for SFDMBR-L, SFDMBR-M and SFDMBR-H, respectively. The duration of the SFDMBR operation cycle, determined by the increasing rate of SFDM filtration resistance, substantially varied with the aeration intensity. This indicates that the aeration intensity would have a significant effect on the long-term increase of SFDM filtration resistance. It can be seen that, regardless of aeration intensity, the variation of both effluent turbidity and permeate flux exhibited the same trend in all cycles, i.e., an initial fast sharp decline followed by a slow gradual decrease. Since filtration performance is always the major concern for SFDMBR operation, the variation of effluent turbidity and permeate flux at different aeration intensities in one operation cycle is further illustrated in Figure 4 for a more detailed analysis.
It can be seen from Figure 4, the decline rate of effluent turbidity slowed down with the increase in aeration intensity. In general, the dynamic membrane is considered successfully formed when the effluent turbidity is lower than 2 NTU. The effluent turbidity of SFDMBR-L decreased fastest, reaching below 2 NTU at 25 min, followed by SFDMBR-M and SFDMBR-H, in which the formation time of SFDMs were 35 and 60 min, respectively. Short SFDM formation time would reduce the amount of unqualified effluent and therefore is highly desirable in practical application. The slow decrease of effluent turbidity with increasing aeration intensity is in agreement with previous studies [6,21]. It is attributed partly to the increased crossflow velocity hindering sludge particle deposition, and partly to the increased portion of small particles that cannot be effectively intercepted for SFDM formation. This PSD of the mixed liquor measured at different aeration intensities will be presented and discussed later.
It was noted that the effluent turbidity was maintained below 2 NTU all the way to the end of the cycle. This is inconsistent with the previous studies reporting that the effluent turbidity increased in the later SFDMBR operation stage [23,32]. In previous studies, the SFDMBRs were operated in a constant flux operation mode, in which the TMP of SFDM continuously increased due to membrane fouling. The effluent turbidity increased after a certain period of time, which was attributed to the particles dissociated from the SFDM, due to its breakage at high TMP. However, those are not the case for SFDMBR operation in the constant TMP mode employed in this study. The stable low effluent turbidity maintained throughout the cycle time seems to be an advantage of constant TMP operation mode.
As shown in Figure 4, similar to the variation trend of turbidity, the permeate flux experienced a sudden drop at the very beginning and then reached a pseudo-steady state for several days. The SFDMBR operation ceased when the permeate flux went below 15 L/m2 h. No efforts have yet been devoted to understanding the effect of aeration intensity on the long-term permeate flux behavior of SFDMBR operated in constant TMP mode. In our case, it was found that the declining rate of permeate flux substantially varied with the aeration intensity. The slowest declining rate of permeate flux appeared in SFDMBR-M, corresponding to the longest cycle time of 10 d. The declining rate of permeate flux increased in order for SFDMBR-L and SFDMBR-H, corresponding to the cycle time of 6 d and 4 d, respectively. The decline of permeate flux is essentially caused by the increase of SFDM filtration resistance, which is analyzed in the following section.

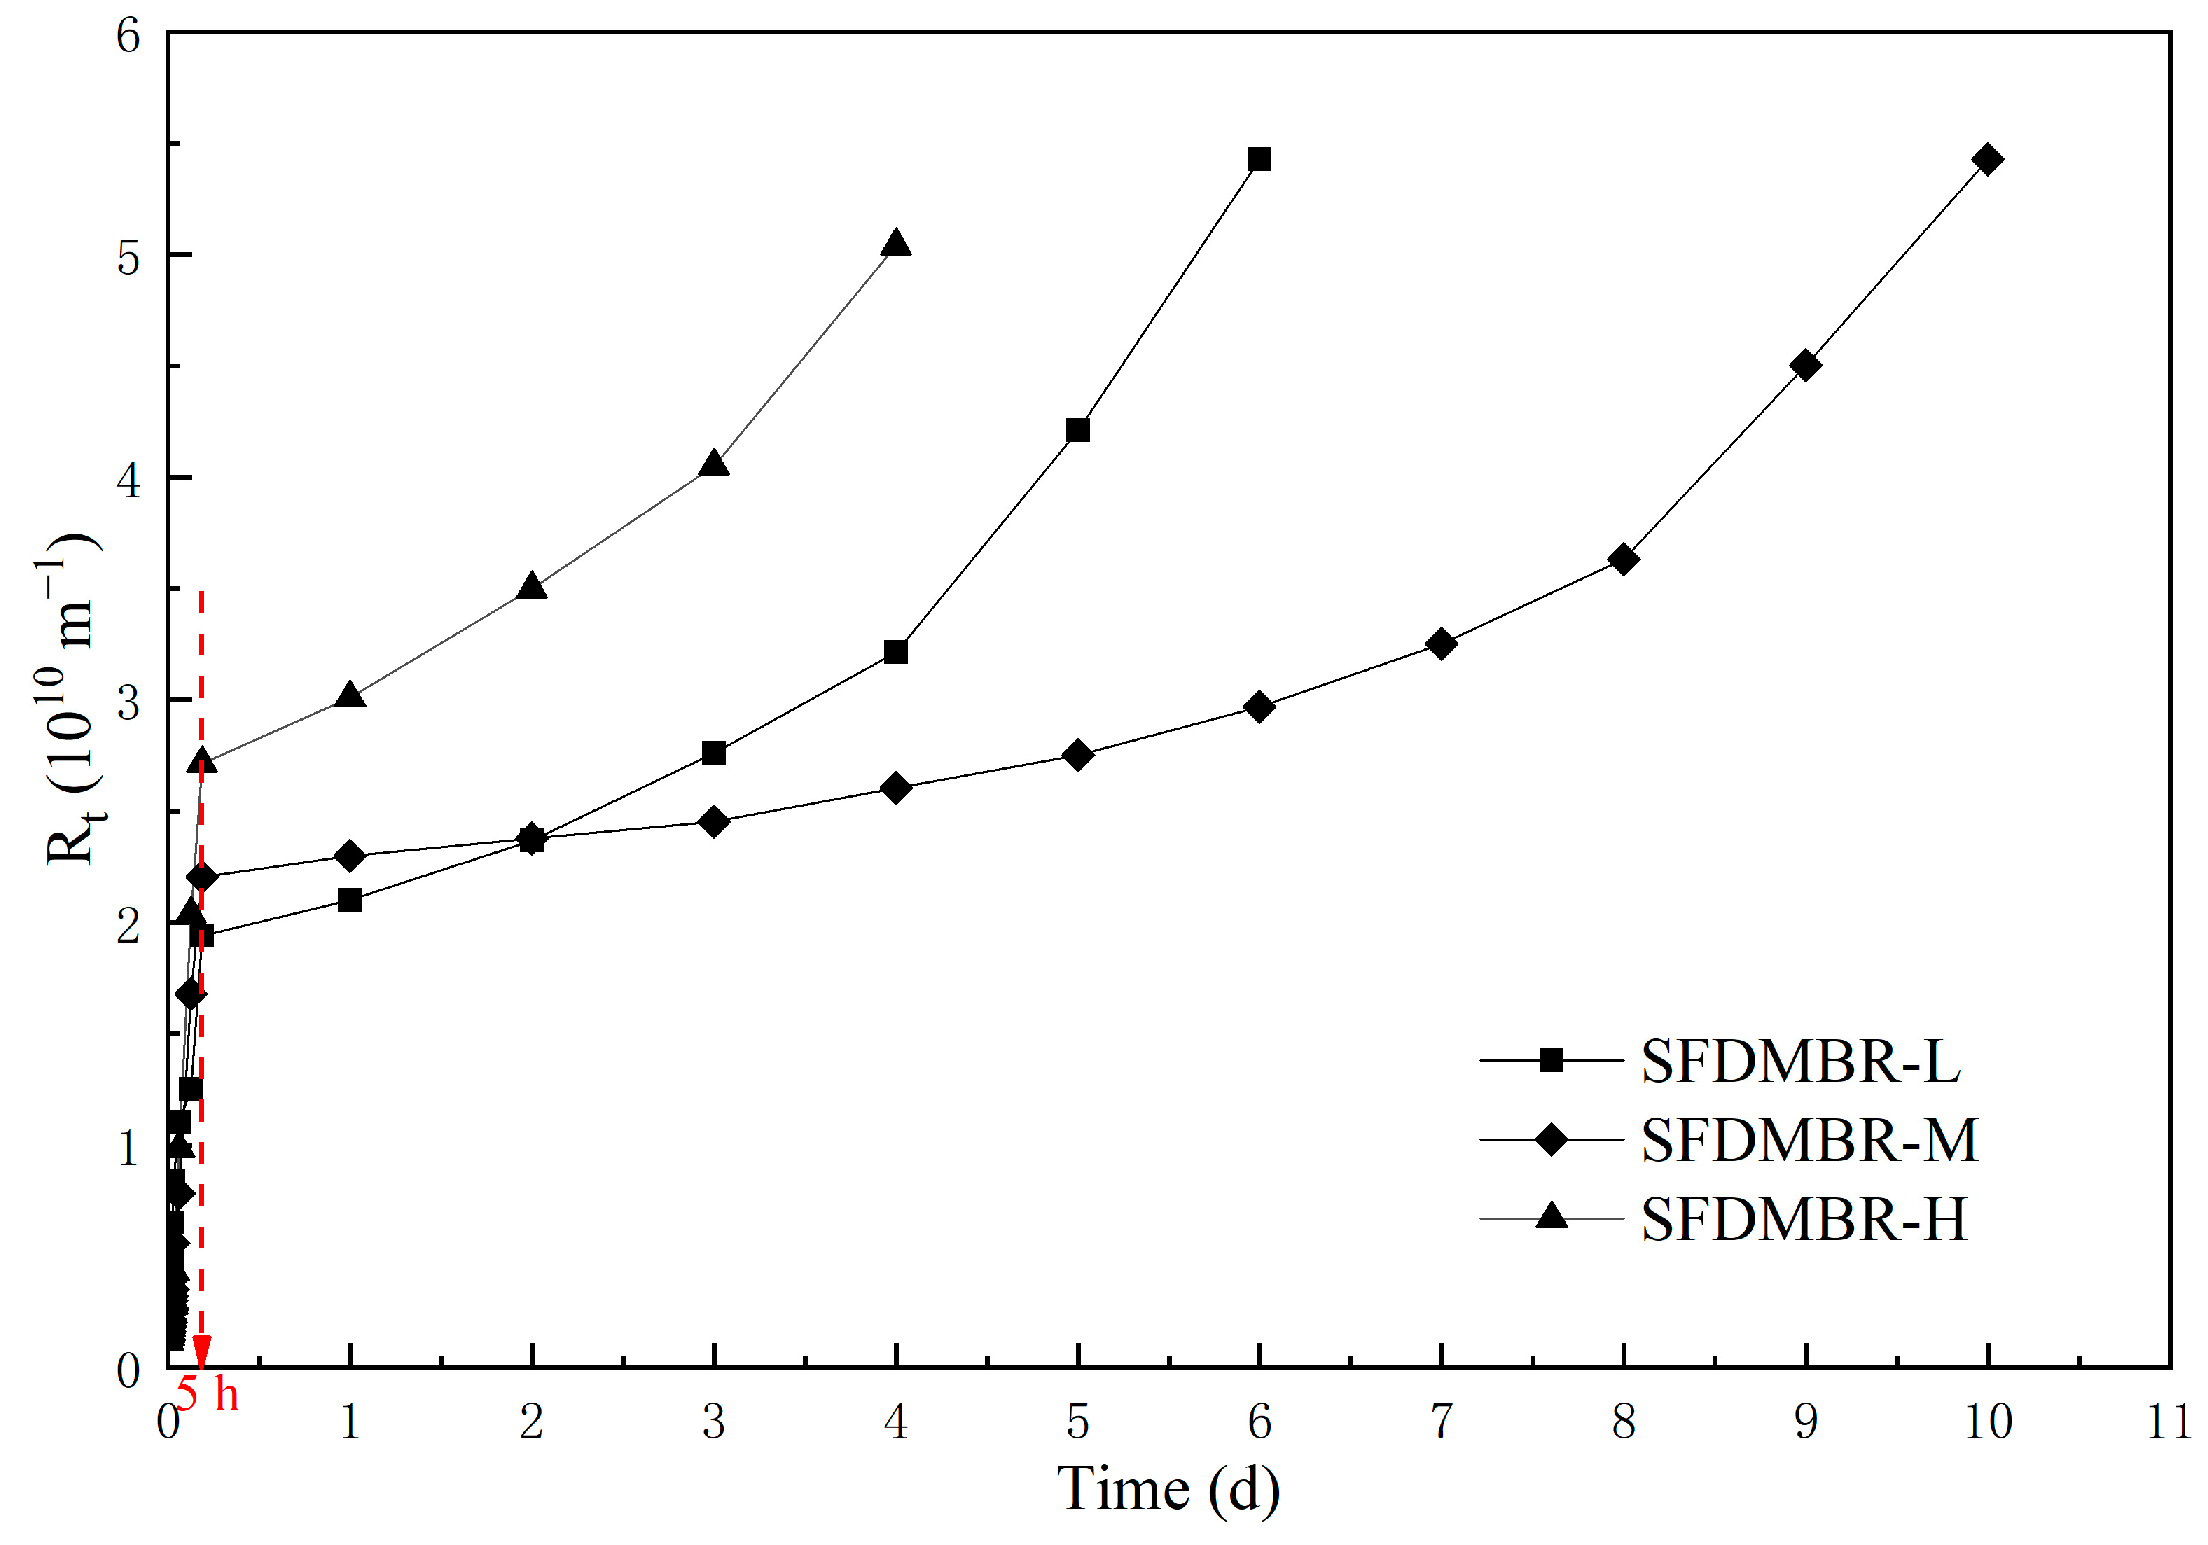
3.2. Effect of Aeration Intensity on SFDM Filtration Resistance

Figure 5 shows the variation of SFDM filtration resistance, calculated according to Equation (1), during one operation cycle at different aeration intensities. It was noted that the values of SFDM filtration resistances were no more than 6 × 10¹⁰ m−1 until the end of the cycle, remarkably lower than those of MF/UF membranes in the range of 1012–1014 m−1 [33]. The low filtration resistance of SFDMs made SFDMBR operation more cost-effective. Corresponding to the trend of flux variation, the SFDM filtration resistance rose steeply in the initial stage (0–5 h) and then gradually increased for several days. At the end of the initial stage, the SFDM resistances of SFDMBR-L, SFDMBR-M and SFDMBR-H were calculated to be 1.94 × 10¹⁰, 2.21 × 10¹⁰ and 2.71 × 10¹⁰ m−1, respectively. The value of initial SFDM resistance is found to be positively correlated with the increase in aeration intensity. This is consistent with the results of some previous short-term experimental studies [14,17]. The higher initial SFDM resistance to increased aeration intensity is mainly attributed to the increased number of small particles and EPS, resulting from the more severe aeration-induced shear stress.
However, as shown in Figure 5, although the initial SFDM filtration resistance in SFDMBR-L was the lowest, its subsequent increasing rate was higher than that in SFDMBR-M. The increasing rate of SFDM filtration resistance (kR) in SFDMBR-L, SFDMBR-M and SFDMBR-H were calculated to be 8.40 × 10⁹, 5.42 × 10⁹ and 1.36 × 10¹⁰ m−1·d−1, respectively. The SFDMBR-M, rather than SFDMBR-L, exhibited the longest cycle time of 10 d. This indicates that the value of initial SFDM filtration resistance obtained from the short-term experiment cannot be regarded as a reliable indicator of the long-term SFDM filtration performance. Since the SFDM filtration resistance is basically the product of the accumulated biomass and the specific resistance, both were further determined for more detailed insights into the long-term increasing rate of SFDM filtration resistance at different aeration intensities.
It can be seen from Table 1, the accumulated biomass of SFDMs was measured to be 41.56, 27.21 and 14.14 g/m2 for SFDMBR-L, SFDMBR-M and SFDMBR-H, respectively. It decreased with the increase in aeration intensity. This may be attributed to the enhanced crossflow velocity over the surface of the filtration module at higher aeration intensity, hindering the deposition and accumulation of biomass during long-term SFDM filtration. Meng et al. [16] measured the accumulated biomass on MF membranes in MBRs under different aeration intensities and observed a similar trend. In contrast, the specific resistances of SFDMs, calculated according to Equation (3), were found to be increased with the increase in aeration intensity.
The opposite trend with aeration intensity, regarding the accumulated biomass and specific resistance of SFDMs, implies that the governing mechanism (i.e., the accumulation of biomass vs. the increase of specific resistance) for the increase of SFDM filtration resistance is substantially different at different aeration intensities. More specifically, the accumulation of biomass was the governing mechanism for the increase of SFDM filtration resistance in SFDMBR-L, whereas the increase of specific resistance dominated the increase of SFDM filtration resistance in SFDMBR-H. It should be noted that the contribution of biomass accumulation to the increase of SFDM filtration resistance would be significantly underestimated in short-term experiment studies, due to the limit of time. The lowest increasing rate of SFDM filtration resistance in SFDMBR-M benefits from the balance between the accumulation of biomass and the increase of specific resistance. The specific resistance of SFDM is fundamentally related to its composition and structure, which are analyzed in the following sections for a better understanding of the effect of aeration intensity on SFDM properties.

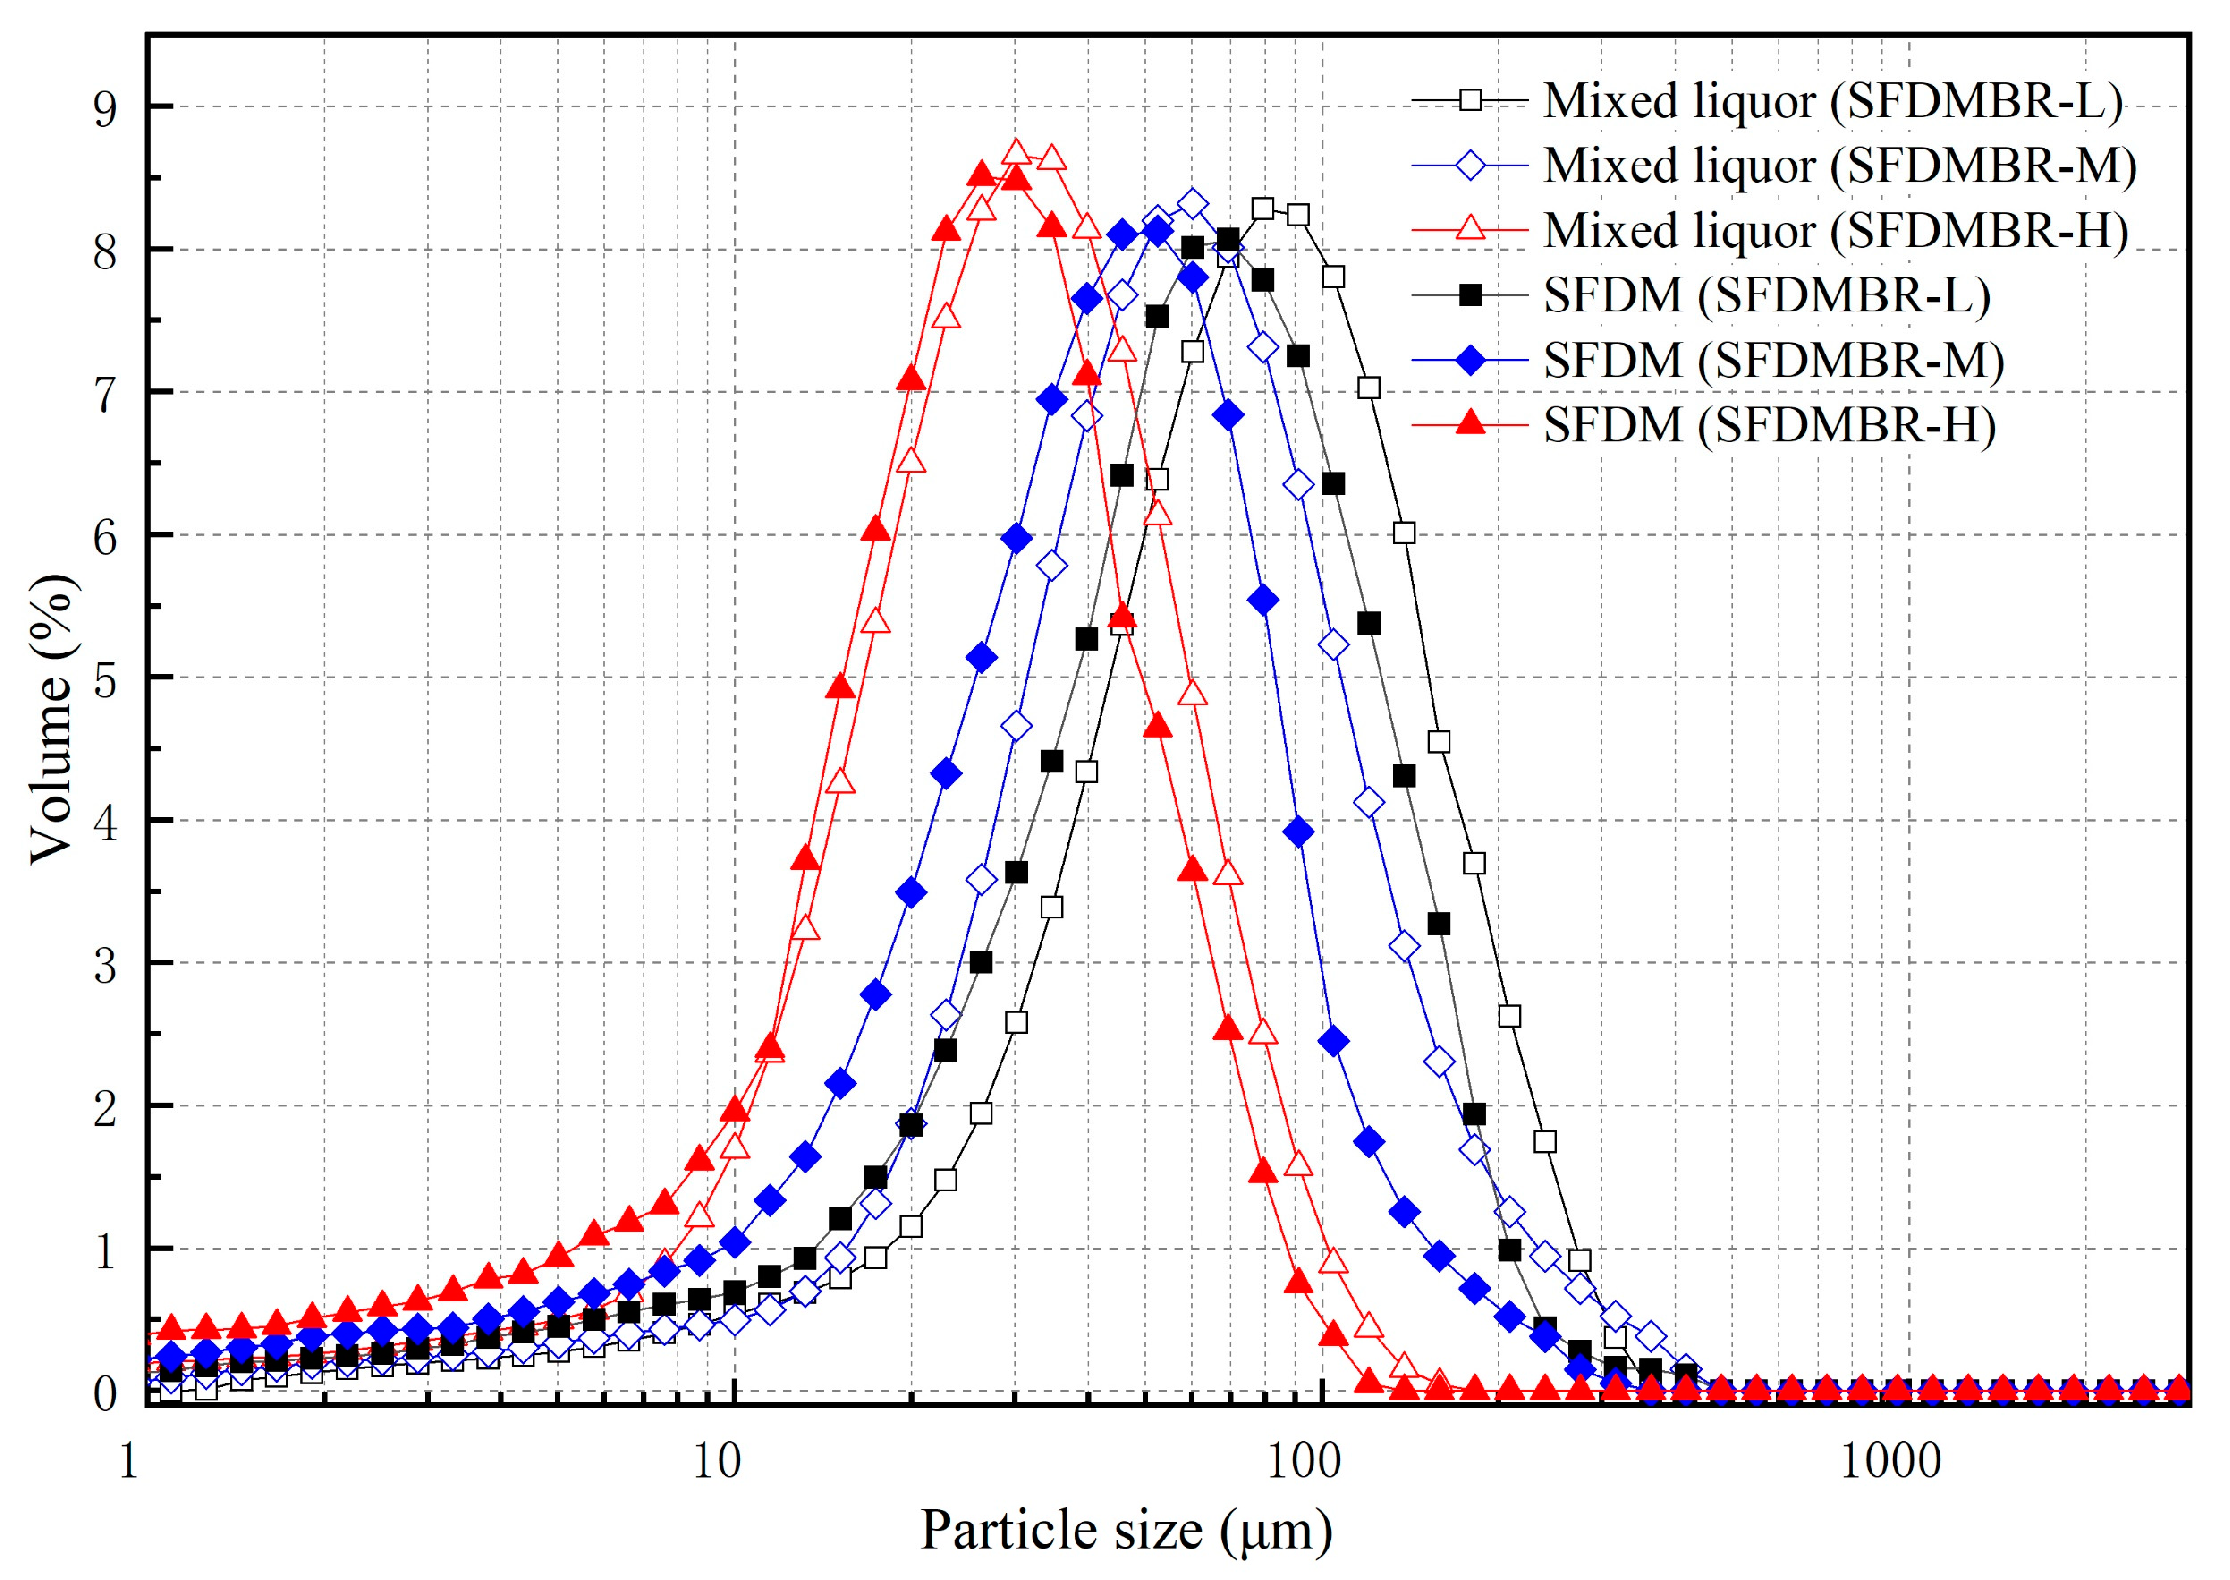
3.3. Effect of Aeration Intensity on Particle Size Distribution and SFDM Structure

According to the Carmen–Kozeny equation [34] shown below, the specific resistance of SFDMs is essentially dependent on their mean particle size and porosity, both of which are fundamentally related to the particle size distribution of SFDMs.
α = 180 ( 1 ε ) ρ d p 2 ε 3
where ρ is the particle density (kg/m3) of SFDMs, dp is the mean particle diameter (μm) of SFDMs, and ε is the porosity of SFDMs.
Figure 6 shows the PSDs of mixed liquors and SFDMs in SFDMBRs at different aeration intensities. It can be seen that, as aeration intensity increased, the PSD of both mixed liquor and SFDM became narrower, with the peak shifting to the low-value end. The mean particle size (Mps) of mixed liquors in SFDMBR-L, SFDMBR-M and SFDMBR-H were calculated to be 87.4, 70.8, and 34.0 μm, respectively. The decrease in Mps of mixed liquors with increasing aeration intensity is readily expected, taking into account the intensified shear force exerted on the sludge particles at higher aeration intensity.
The Mps of SFDMs in SFDMBR-L, SFDMBR-M and SFDMBR-H were calculated to be 70.7, 49.1, and 28.3 μm, respectively. Similar to the trend of Mps of mixed liquors, the Mps of SFDMs decreased as aeration intensity increased. The variation of Mps of SFDMs is consistent with the change in the specific resistance of SFDMs. This verifies that the increased specific resistance of SFDMs at higher aeration intensity is mainly attributed to their reduced Mps. It has been reported that the particles of smaller sizes would form denser SFDM with higher specific resistance [35].
In addition, the Mps of SFDMs were found to be lower than that of the mixed liquors in all cases. This implies that the small particles are more preferably accumulated in SFDMs. The differences in Mps between mixed liquors and SFDMs in SFDMBR-L, SFDMBR-M and SFDMBR-H were calculated to be 16.7, 21.7, and 5.7 μm, respectively. The largest difference appeared in SFDMBR-M, followed in order by SFDMBR-L and SFDMBR-H. This is consistent with the order of the cycle time of SFDMBR operated at different aeration intensities, i.e., SFDMBR-M (10 d) > SFDMBR-L (6 d) > SFDMBR-H (4 d). This implies that the difference in Mps between mixed liquors and SFDMs would be increasingly enlarged with extended operation time. The results obtained from short-term experiments, therefore, cannot fully represent those yielded by long-term SFDMBR operation.
The SFDMs formed at different aeration intensities were subjected to SEM analysis, so that their structure can be visually observed. It can be seen from Figure 7, the structure of SFDMs in SFDMBR-L, SFDMBR-M and SFDMBR-H was significantly different from each other. The SFDM formed in SFDMBR-L had an uneven surface with a lot of large particles and therefore exhibited a loose structure with high porosity. As aeration intensity increased, the number of large particles and the surface roughness of SFDMs in SFDMBR-M and SFDMBR-H significantly reduced in order. The SFDM formed in SFDMBR-H exhibited the densest structure with the lowest porosity. The porosity of the SFDM structure decreased with increasing aeration intensity. According to the Carmen–Kozeny equation, the third power of porosity is inversely proportional to the specific resistance. Therefore, the higher porosity would result in a lower SFDM-specific resistance. The variation of SFDM porosity is therefore inversely consistent with the change of SFDM specific resistance at different aeration intensities.

3.4. Effect of Aeration Intensity on Extracellular Polymeric Substances

EPS are widely acknowledged as the major compounds related to membrane fouling [36]. Their amount and composition of mixed liquors and SFDMs were, for the first time, measured in SFDMBRs at different aeration intensities. It can be seen from Table 2 that protein (PN), rather than polysaccharides (PS), was the major EPS component in all cases. This is consistent with previous SFDMBR studies wherein the amount of protein in EPS is 2.1~5.5 times more than that of polysaccharides [15]. With increasing aeration intensity, the EPS content of mixed liquor increased accordingly. This may be attributed to (1) the more vigorous metabolism of aerobic microorganisms under high aeration intensity that would accelerate the secretion and autolysis of microbial cells, making a larger number of EPS released, and (2) the decreased particle size of aerobic microorganisms under high aeration intensity, since the small particles may have higher EPS content than large particles [37].
It was noted that EPS contents of SFDMs were higher than those of mixed liquors, regardless of aeration intensity. The higher EPS contents of SFDMs may be attributed partly to the selective deposition/accumulation of particles rich in EPS from the mixed liquor (i.e., external source), and partly to the release of EPS by the microorganisms in SFDMs (i.e., internal source) during long-term operation. In addition, it was interestingly found that the EPS content of SFDMs, unlike that of mixed liquor, did not monotonously increase with increasing aeration intensity. The SFDM in SFDMBR-M, rather than SFDMBR-L, had the lowest EPS content, although its mixed liquor had a higher EPS content than that in SFDMBR-L. This implies that, as aeration intensity decrease, the internal source of EPS production would make a more important contribution to the total EPS content of SFDMs. As shown in Table 1, the SFDM formed in SFDMBR-L had the largest amount of biomass, making more internal EPS production expectable. Moreover, the SFDM would be thicker as the deposited biomass increase. The microorganisms in the inner zone of SFDM may release more EPS, due to the limited supply of oxygen and substrates. The EPS content of SFDMs followed the order of SFDMBR-M < SFDMBR-L < SFDMBR-H, which is consistent with the increasing rate of the SFDM filtration resistance. This indicates that the EPS content of SFDMs may serve as an indicator of SFDM fouling behavior. It should be noted that the EPS production may be inhibited when treating industrial wastewaters containing toxic substances. The variation of EPS content with aeration intensity thus may be less significant. In such conditions, it should be cautious for the use of EPS content indicating SFDM fouling behavior.
Apart from EPS content, the ratio of proteins/polysaccharides (PN/PS) has been reported to be closely related to the increase of membrane filtration resistance [28]. It can be seen from Table 2 that, similar to the EPS content, the PN/PS ratio in SFDMs is higher than that in mixed liquors at all aeration intensities. Previous studies indicated that polysaccharide was generally considered a hydrophilic substance, while the protein was more hydrophobic [29]. The higher PN/PS ratio in SFDMs is thus attributed to the favorable deposition and accumulation of proteins. The PN/PS ratio of SFDMs in different SFDMBRs followed the same order as the EPS content of SFDMs, consistent with the increasing rate of SFDM filtration resistance with aeration intensity.

4. Conclusions

In this study, the effect of aeration intensity on long-term SFDMBR performance and the associated mechanisms were investigated in three identical SFDMBRs operated in constant TMP mode for 60 days. The SFDMBR operated at medium aeration intensity and exhibited the best performance in terms of COD removal efficiency and SFDM filtration behavior. The enhanced COD removal efficiency was attributed to the increased contribution by SFDMs. As aeration intensity increased, the governing mechanisms for SFDM fouling transited from the accumulation of biomass to the increase of specific resistance. The long-term increasing rate of SFDM filtration resistance was consistent with both EPS content and the PN/PS ratio of SFDMs.

Author Contributions

Conceptualization, F.S., Q.P. and S.L.; methodology, F.S., H.W. and Q.P.; formal analysis, F.S., H.W. and Q.P.; writing—original draft preparation, F.S., H.W. and Q.P.; writing—review and editing, S.L., J.Z. and X.W.; supervision, S.L.; project administration, S.L. and J.Z.; funding acquisition, S.L. and X.W. All authors have read and agreed to the published version of the manuscript.

Funding

This work was supported by the National Key Research and Development Program of China (No. 2021YFC3200602), the Shandong Provincial Key Research and Development Program (Major Scientific and Technological Innovation Project) (No. 2020CXGC011406 & No. 2019JZZY010411), the Fundamental Research Funds of Shandong University (2017JC024), the Department of Science and Technology of Shandong Province (BS2009SW001), the Natural Science Foundation of Shandong Province (ZR2010EQ019), and the Independent Innovation Foundation of Shandong University (2010TS040).

Conflicts of Interest

The authors declare no conflict of interest.

References

  1. Fan, B.; Huang, X. Characteristics of a self-forming dynamic membrane coupled with a bioreactor for municipal wastewater treatment. Environ. Sci. Technol. 2002, 36, 5245–5251. [Google Scholar] [CrossRef] [PubMed]
  2. Wang, C.; Chen, W.; Hu, Q.; Ji, M.; Gao, X. Dynamic fouling behavior and cake layer structure changes in nonwoven membrane bioreactor for bath wastewater treatment. Chem. Eng. J. 2015, 264, 462–469. [Google Scholar] [CrossRef]
  3. Hu, Y.; Wang, X.C.; Tian, W.; Ngo, H.H.; Chen, R. Towards stable operation of a dynamic membrane bioreactor (DMBR): Operational process, behavior and retention effect of dynamic membrane. J. Membr. Sci. 2016, 498, 20–29. [Google Scholar] [CrossRef]
  4. Vergine, P.; Salerno, C.; Berardi, G.; Pollice, A. Sludge cake and biofilm formation as valuable tools in wastewater treatment by coupling Integrated Fixed-film Activated Sludge (IFAS) with Self Forming Dynamic Membrane BioReactors (SFD-MBR). Bioresour. Technol. 2018, 268, 121–127. [Google Scholar] [CrossRef] [PubMed]
  5. Kumar Khuntia, H.; Hameed, S.; Janardhana, N.; Chanakya, H. Greywater treatment in aerobic bio-reactor with macropore mesh filters. J. Water Process. Eng. 2019, 28, 269–276. [Google Scholar] [CrossRef]
  6. Kiso, Y.; Jung, Y.J.; Ichinari, T.; Park, M.; Kitao, T.; Nishimura, K.; Min, K.S. Wastewater treatment performance of a filtration bio-reactor equipped with a mesh as a filter material. Water Res. 2000, 34, 4143–4150. [Google Scholar] [CrossRef]
  7. Meng, F.; Chae, S.R.; Drews, A.; Kraume, M.; Shin, H.S.; Yang, F. Recent advances in membrane bioreactors (MBRs): Membrane fouling and membrane material. Water Res. 2009, 43, 1489–1512. [Google Scholar] [CrossRef]
  8. Ren, X.; Shon, H.K.; Jang, N.; Lee, Y.G.; Bae, M.; Lee, J.; Cho, K.; Kim, I.S. Novel membrane bioreactor (MBR) coupled with a nonwoven fabric filter for household wastewater treatment. Water Res. 2010, 44, 751–760. [Google Scholar] [CrossRef] [Green Version]
  9. Saleem, M.; Alibardi, L.; Cossu, R.; Lavagnolo, M.C.; Spagni, A. Analysis of fouling development under dynamic membrane filtration operation. Chem. Eng. J. 2017, 312, 136–143. [Google Scholar] [CrossRef]
  10. Li, L.; Xu, G.; Yu, H.; Xing, J. Dynamic membrane for micro-particle removal in wastewater treatment: Performance and influencing factors. Sci. Total Environ. 2018, 627, 332–340. [Google Scholar] [CrossRef]
  11. Xiong, J.; Fu, D.; Singh, R.P. Self-adaptive dynamic membrane module with a high flux and stable operation for the municipal wastewater treatment. J. Membr. Sci. 2014, 471, 308–318. [Google Scholar] [CrossRef]
  12. Pollice, A.; Vergine, P. Self-forming dynamic membrane bioreactors (SFD MBR) for wastewater treatment: Principles and applications. In Advanced Membrane Separation Processes for Sustainable Water and Wastewater Management-Case Studies and Sustainability Analysis; Mannina, G., Pandey, A., Larroche, C., Ng, H.Y., Ngo, H.H., Eds.; Elsevier: Amsterdam, The Netherlands, 2020; pp. 235–258. [Google Scholar]
  13. Rezvani, F.; Mehrnia, M.R.; Poostchi, A.A. Optimal operating strategies of SFDM formation for MBR application. Sep. Purif. Technol. 2014, 124, 124–133. [Google Scholar] [CrossRef]
  14. Sabaghian, M.; Mehrnia, M.R.; Esmaieli, M.; Nourmohammadi, D. Influence of static mixer on the formation and performance of dynamic membrane in a dynamic membrane bioreactor. Sep. Purif. Technol. 2018, 206, 324–334. [Google Scholar] [CrossRef]
  15. Huang, J.; Wu, X.; Cai, D.; Chen, G.; Li, D.; Yu, Y.; Petrik, L.F.; Liu, G. Linking solids retention time to the composition, structure, and hydraulic resistance of biofilms developed on support materials in dynamic membrane bioreactors. J. Membr. Sci. 2019, 581, 158–167. [Google Scholar] [CrossRef]
  16. Meng, F.; Yang, F.; Shi, B.; Zhang, H. A comprehensive study on membrane fouling in submerged membrane bioreactors operated under different aeration intensities. Sep. Purif. Technol. 2008, 59, 91–100. [Google Scholar] [CrossRef]
  17. Sabaghian, M.; Mehrnia, M.R.; Esmaieli, M.; Noormohammadi, D. Formation and performance of self-forming dynamic membrane (SFDM) in membrane bioreactor (MBR) for treating low-strength wastewater. Water Sci. Technol. 2018, 78, 904–912. [Google Scholar] [CrossRef]
  18. Fan, F.S.; Zhou, H.D. Interrelated effects of aeration and mixed liquor fractions on membrane fouling for submerged membrane bioreactor processes in wastewater treatment. Environ. Sci. Technol. 2007, 41, 2523–2528. [Google Scholar] [CrossRef]
  19. Liang, S.; Qu, L.; Meng, F.; Han, X.; Zhang, J. Effect of sludge properties on the filtration characteristics of self-forming dynamic membranes (SFDMs) in aerobic bioreactors: Formation time, filtration resistance, and fouling propensity. J. Membr. Sci. 2013, 436, 186–194. [Google Scholar] [CrossRef]
  20. Chang, W.-K.; Hu, A.Y.-J.; Horng, R.-Y.; Tzou, W.-Y. Membrane bioreactor with nonwoven fabrics as solid–liquid separation media for wastewater treatment. Desalination 2007, 202, 122–128. [Google Scholar] [CrossRef]
  21. Poostchi, A.A.; Mehrnia, M.R.; Rezvani, F.; Sarrafzadeh, M.H. Low-cost monofilament mesh filter used in membrane bioreactor process: Filtration characteristics and resistance analysis. Desalination 2012, 286, 429–435. [Google Scholar] [CrossRef]
  22. Fuchs, W.; Resch, C.; Kernstock, M.; Mayer, M.; Schoeberl, P.; Braun, R. Influence of operational conditions on the performance of a mesh filter activated sludge process. Water Res. 2005, 39, 803–810. [Google Scholar] [CrossRef] [PubMed]
  23. Salerno, C.; Vergine, P.; Berardi, G.; Pollice, A. Influence of air scouring on the performance of a Self Forming Dynamic Membrane BioReactor (SFD MBR) for municipal wastewater treatment. Bioresour. Technol. 2017, 223, 301–306. [Google Scholar] [CrossRef] [PubMed]
  24. APHA. Standard Methods for the Examination of Water and Wastewater, 20th ed.; American Public Health Association: Washington, DC, USA, 1998.
  25. Frolund, B.; Palmgren, R.; Keiding, K.; Nielsen, P.H. Extraction of extracellular polymers from activated sludge using a cation exchange resin. Water Res. 1996, 30, 1749–1758. [Google Scholar] [CrossRef]
  26. Lowry, O.; Rosebrough, N.; Farr, A.L.; Randall, R. Protein Measurement with the Folin Phenol Reagent. J. Biol. Chem. 1951, 193, 265–275. [Google Scholar] [CrossRef]
  27. Dubois, M.; Gilles, K.A.; Hamilton, J.K.; Rebers, P.A.; Smith, F. Colorimetric method for determination of sugars and related substances. Anal. Chem. 1956, 28, 350–356. [Google Scholar] [CrossRef]
  28. Sun, F.; Zhang, N.; Li, F.; Wang, X.; Zhang, J.; Song, L.; Liang, S. Dynamic analysis of self-forming dynamic membrane (SFDM) filtration in submerged anaerobic bioreactor: Performance, characteristic, and mechanism. Bioresour. Technol. 2018, 270, 383–390. [Google Scholar] [CrossRef]
  29. Lee, W. Sludge characteristics and their contribution to microfiltration in submerged membrane bioreactors. J. Membr. Sci. 2003, 216, 217–227. [Google Scholar] [CrossRef]
  30. Chen, F.; Wen, X.; Huang, X.; Wu, Y. Function of dynamic membrane in self-forming dynamic membrane coupled bioreactor. Water Sci. Technol. 2005, 51, 107–114. [Google Scholar] [CrossRef]
  31. Ersahin, M.E.; Tao, Y.; Ozgun, H.; Spanjers, H.; van Lier, J.B. Characteristics and role of dynamic membrane layer in anaerobic membrane bioreactors. Biotechnol. Bioeng. 2016, 113, 761–771. [Google Scholar] [CrossRef]
  32. Guan, D.; Dai, J.; Watanabe, Y.; Chen, G. Changes in the physical properties of the dynamic layer and its correlation with permeate quality in a self-forming dynamic membrane bioreactor. Water Res. 2018, 140, 67–76. [Google Scholar] [CrossRef]
  33. Lin, H.J.; Xie, K.; Mahendran, B.; Bagley, D.M.; Leung, K.T.; Liss, S.N.; Liao, B.Q. Sludge properties and their effects on membrane fouling in submerged anaerobic membrane bioreactors (SAnMBRs). Water Res. 2009, 43, 3827–3837. [Google Scholar] [CrossRef] [PubMed]
  34. Park, P.K.; Lee, C.H.; Lee, S. Determination of cake porosity using image analysis in a coagulation-microfiltration system. J. Membr. Sci. 2007, 293, 66–72. [Google Scholar] [CrossRef]
  35. Meng, F.; Zhang, H.; Yang, F.; Zhang, S.; Li, Y.; Zhang, X. Identification of activated sludge properties affecting membrane fouling in submerged membrane bioreactors. Sep. Purif. Technol. 2006, 51, 95–103. [Google Scholar] [CrossRef]
  36. Zhang, H.F. Impact of Soluble Microbial Products and Extracellular Polymeric Substances on Filtration Resistance in a Membrane Bioreactor. Environ. Eng. Sci. 2009, 26, 1115–1122. [Google Scholar] [CrossRef]
  37. Lin, H.; Liao, B.Q.; Chen, J.; Gao, W.; Wang, L.; Wang, F.; Lu, X. New insights into membrane fouling in a submerged anaerobic membrane bioreactor based on characterization of cake sludge and bulk sludge. Bioresour. Technol. 2011, 102, 2373–2379. [Google Scholar] [CrossRef]
Figure 1. Schematic diagram of experimental setup.
Water 14 01561 g001
Figure 2. (a) COD and (b) NH3-N concentrations of influent, supernatant and effluent in SFDMBR-L, SFDMBR-M and SFDMBR-H, respectively.
Water 14 01561 g002
Figure 3. Variations of (a) effluent turbidity and (b) permeate flux in SFDMBR-L, SFDMBR-M and SFDMBR-H, respectively.
Water 14 01561 g003
Figure 4. Variations of effluent turbidity and permeate flux during one operation cycle in SFDMBR-L, SFDMBR-M and SFDMBR-H, respectively.
Water 14 01561 g004
Figure 5. Variation of filtration resistance during one operation cycle in SFDMBR-L, SFDMBR-M and SFDMBR-H, respectively.
Water 14 01561 g005
Figure 6. Particle size distributions of mixed liquors and SFDMs in SFDMBR-L, SFDMBR-M and SFDMBR-H, respectively.
Water 14 01561 g006
Figure 7. SEM images of SFDMs in (a) SFDMBR-L, (b) SFDMBR-M and (c) SFDMBR-H, respectively.
Water 14 01561 g007
Table 1. Accumulated biomass and specific resistance of SFDMs at different aeration intensities.
Rs (1010 m−1)M (SS g/m2)Specific Resistance (109 m/kg)
SFDMBR-L5.4341.561.31
SFDMBR-M5.4227.212.00
SFDMBR-H5.0314.143.56
Table 2. EPS contents of mixed liquors and SFDMs at different aeration intensities.
SFDM (mg/g SS)Mixed Liquor (mg/g SS)
PNPSEPSPN/PSPNPSEPSPN/PS
SFDMBR-L118.90 ± 13.723.74 ± 5.6142.64 ± 18.95.0076.63 ± 9.818.67 ± 5.395.30 ± 14.24.10
SFDMBR-M99.20 ± 12.321.46 ± 5.2120.66 ± 17.14.6287.06 ± 7.519.63 ± 4.2106.69 ± 12.94.44
SFDMBR-H150.7 ± 20.424.51 ± 4.7175.21 ± 24.36.1497.74 ± 8.821.86 ± 4.9119.60 ± 13.24.69
Publisher’s Note: MDPI stays neutral with regard to jurisdictional claims in published maps and institutional affiliations.

