
A Multidisciplinary Approach for Groundwater Potential Mapping in a Fractured Semi-Arid Terrain (Kerdous Inlier, Western Anti-Atlas, Morocco)

 , ,
, ,  ,
,  ,
,  ,
, 
Abstract
:1. Introduction
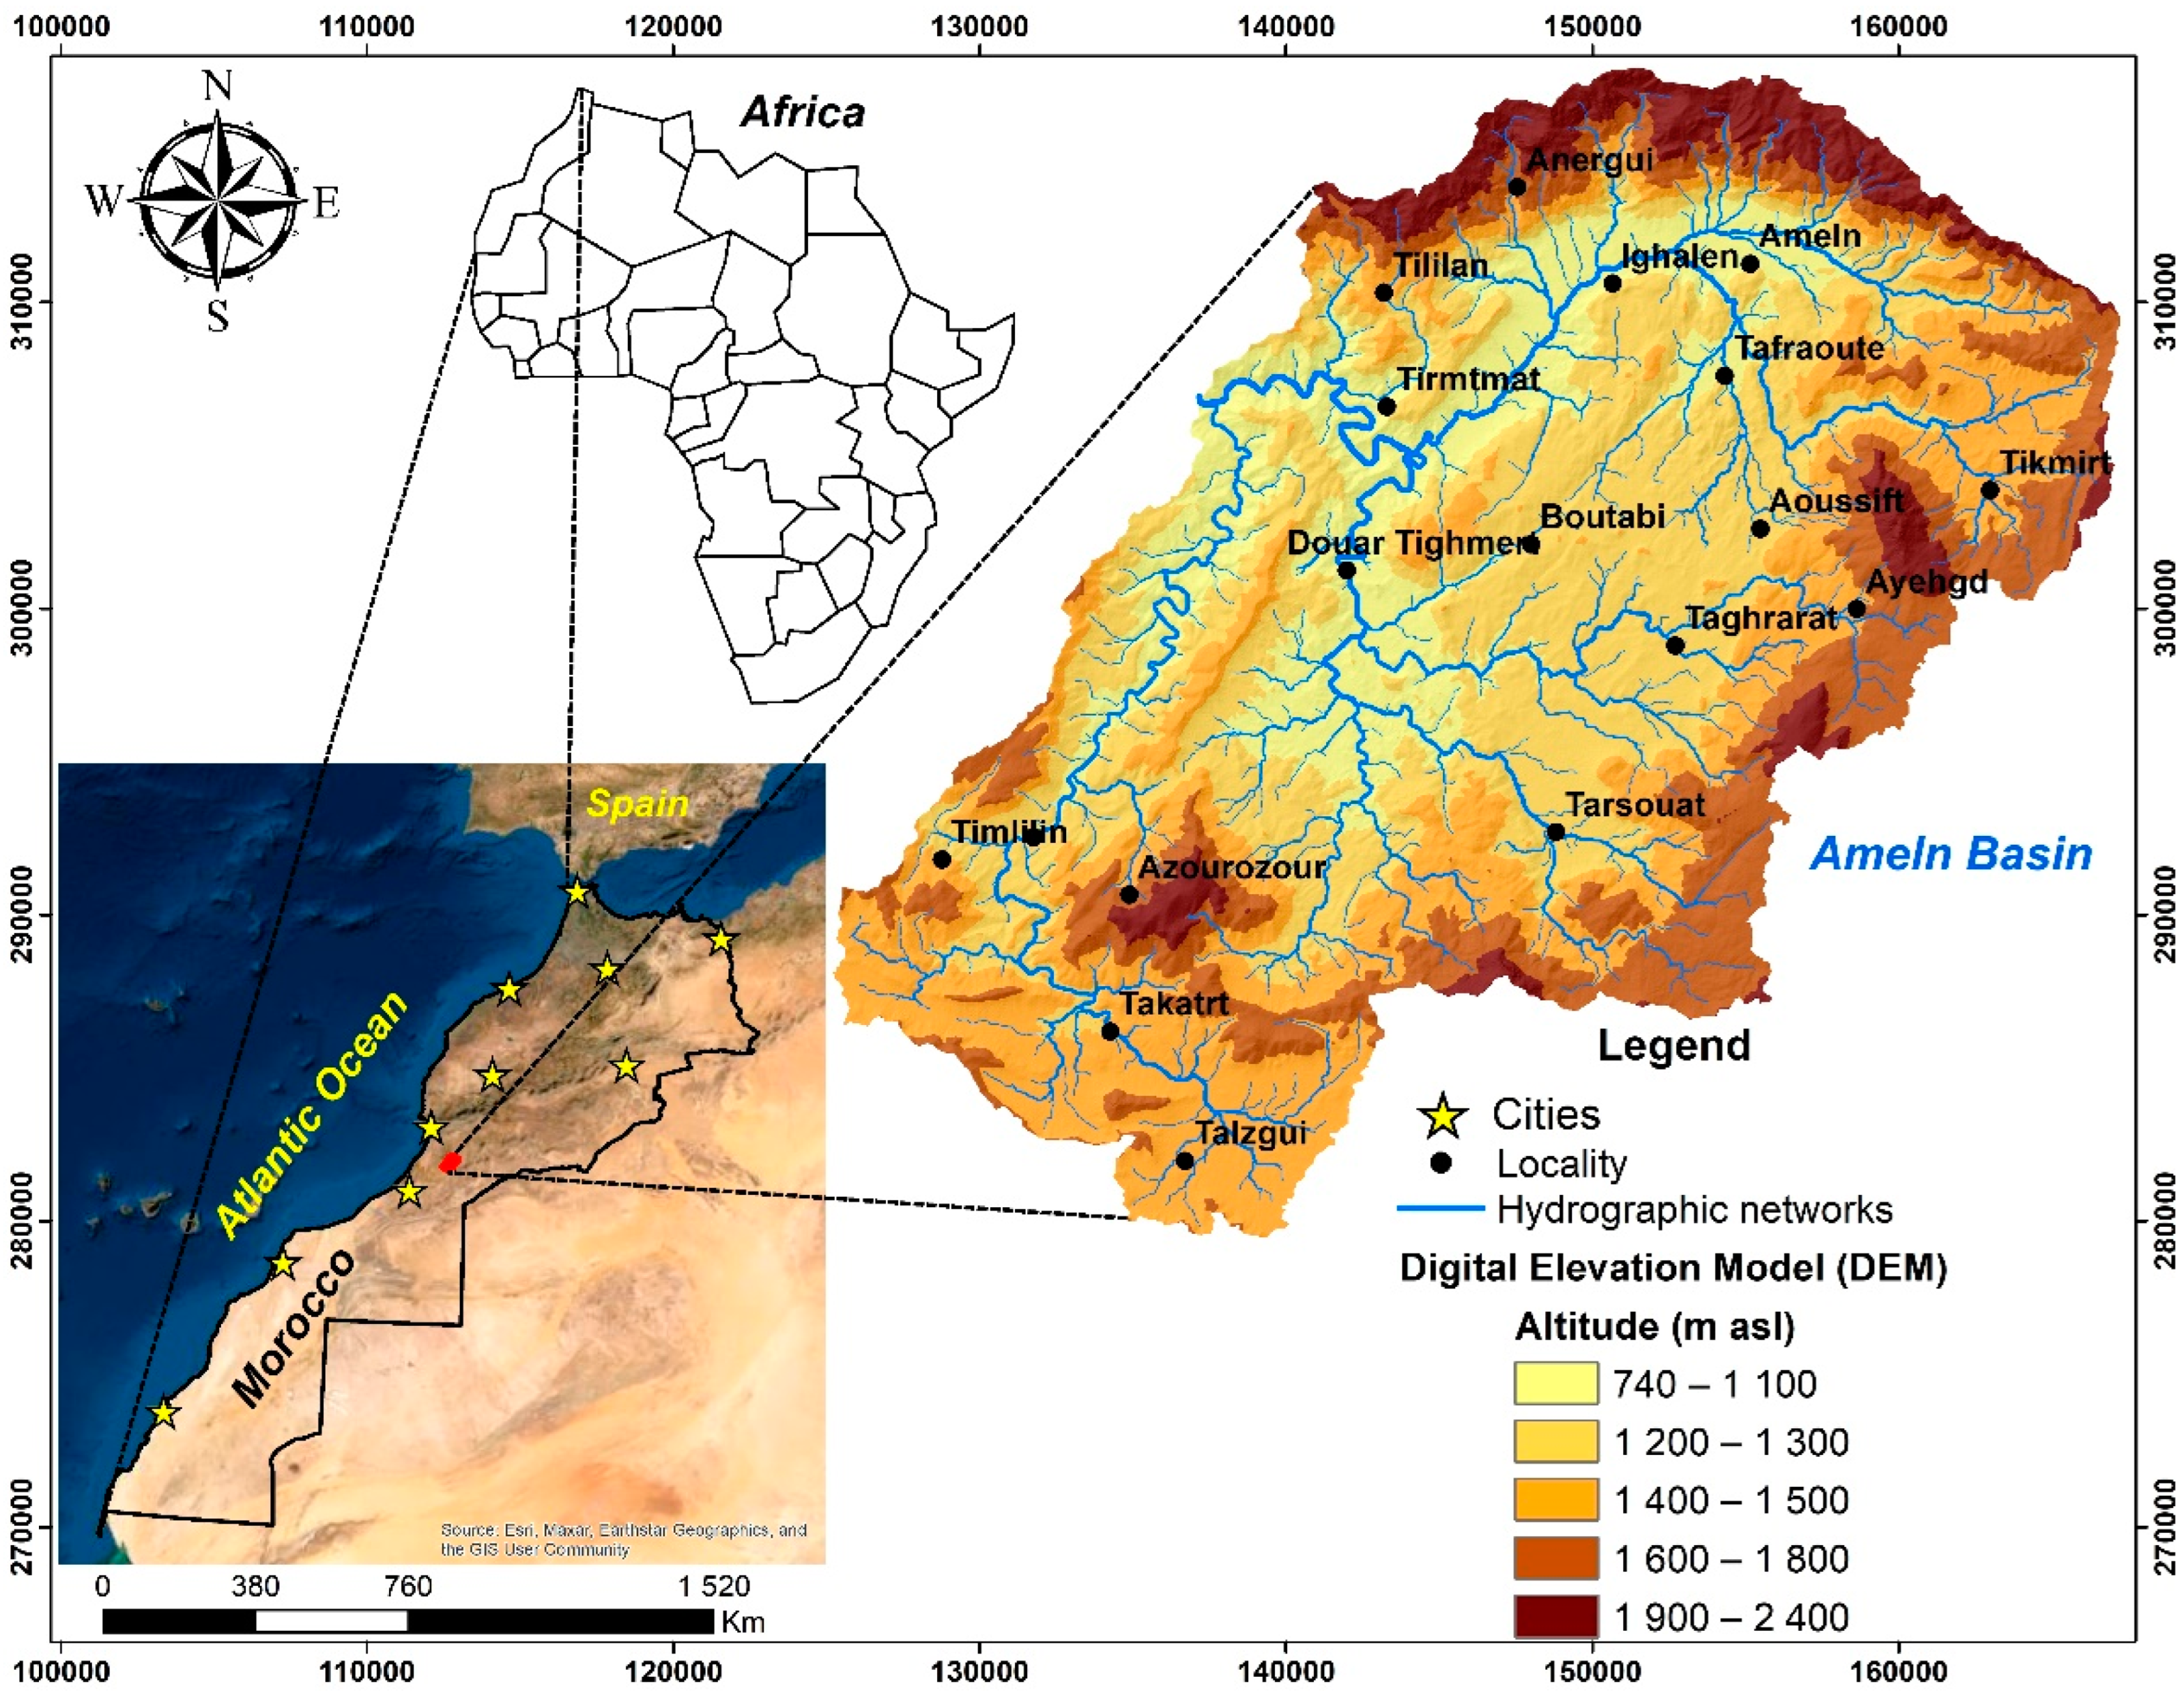
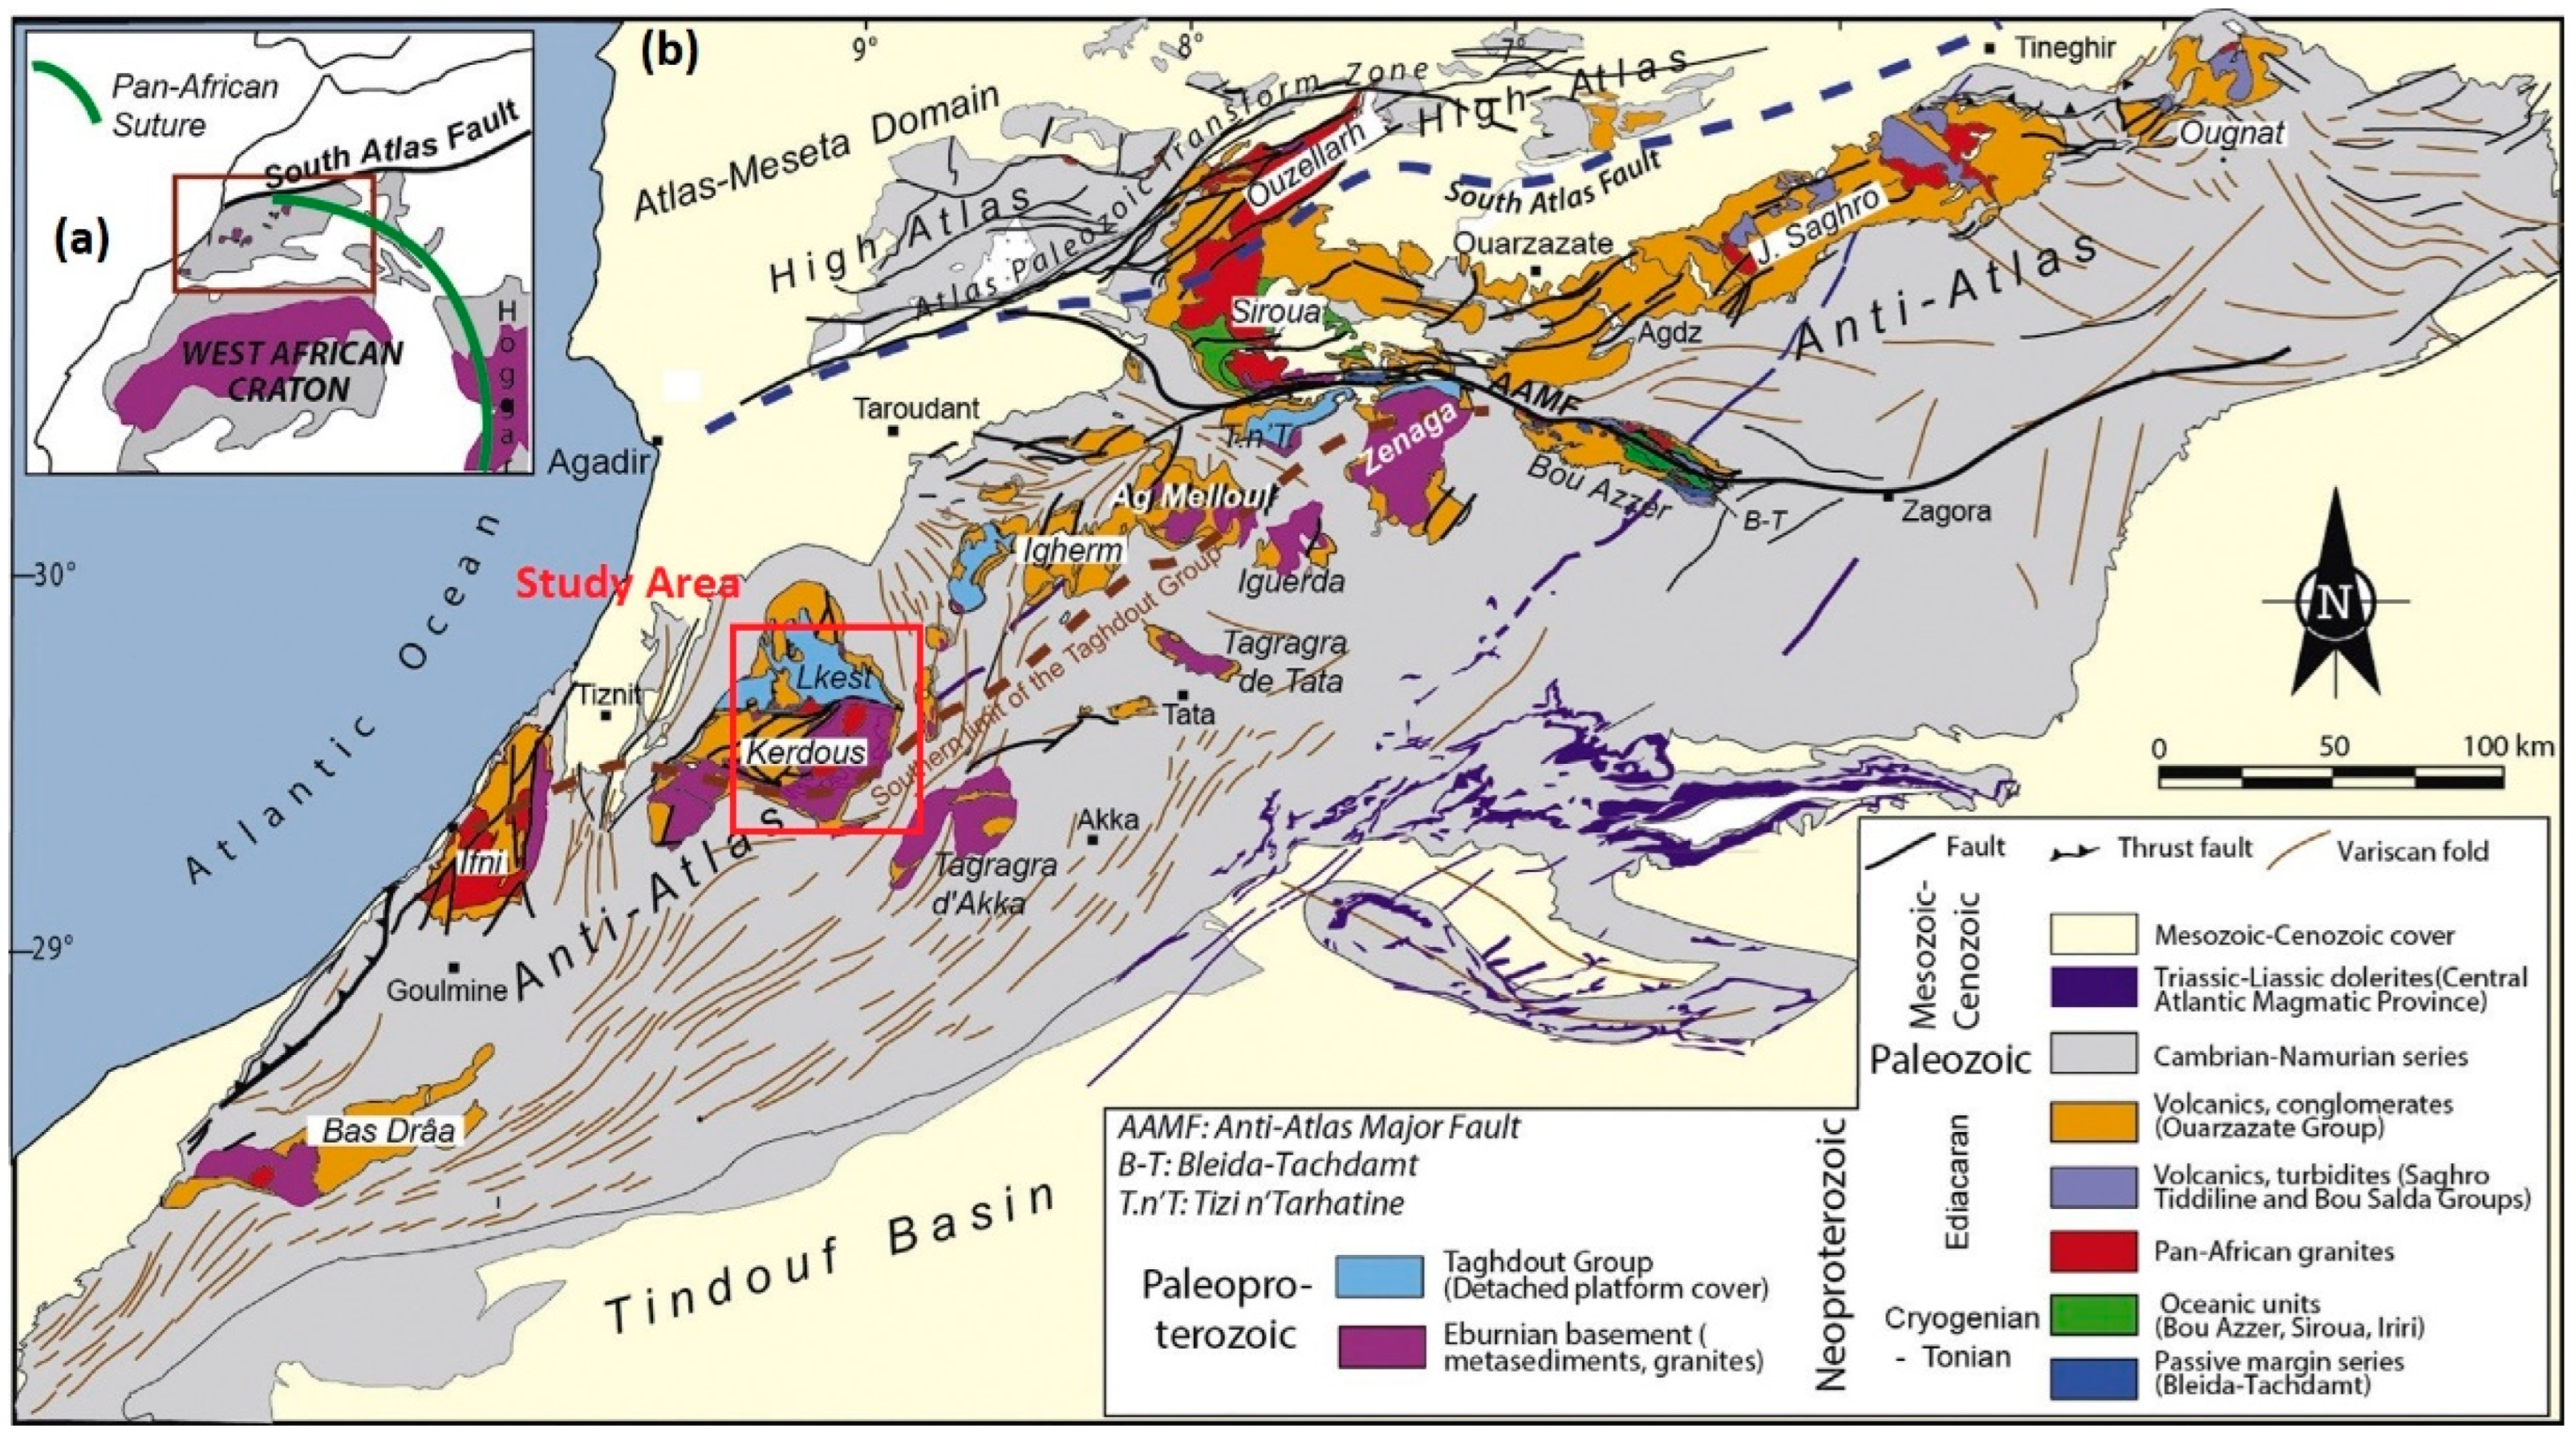
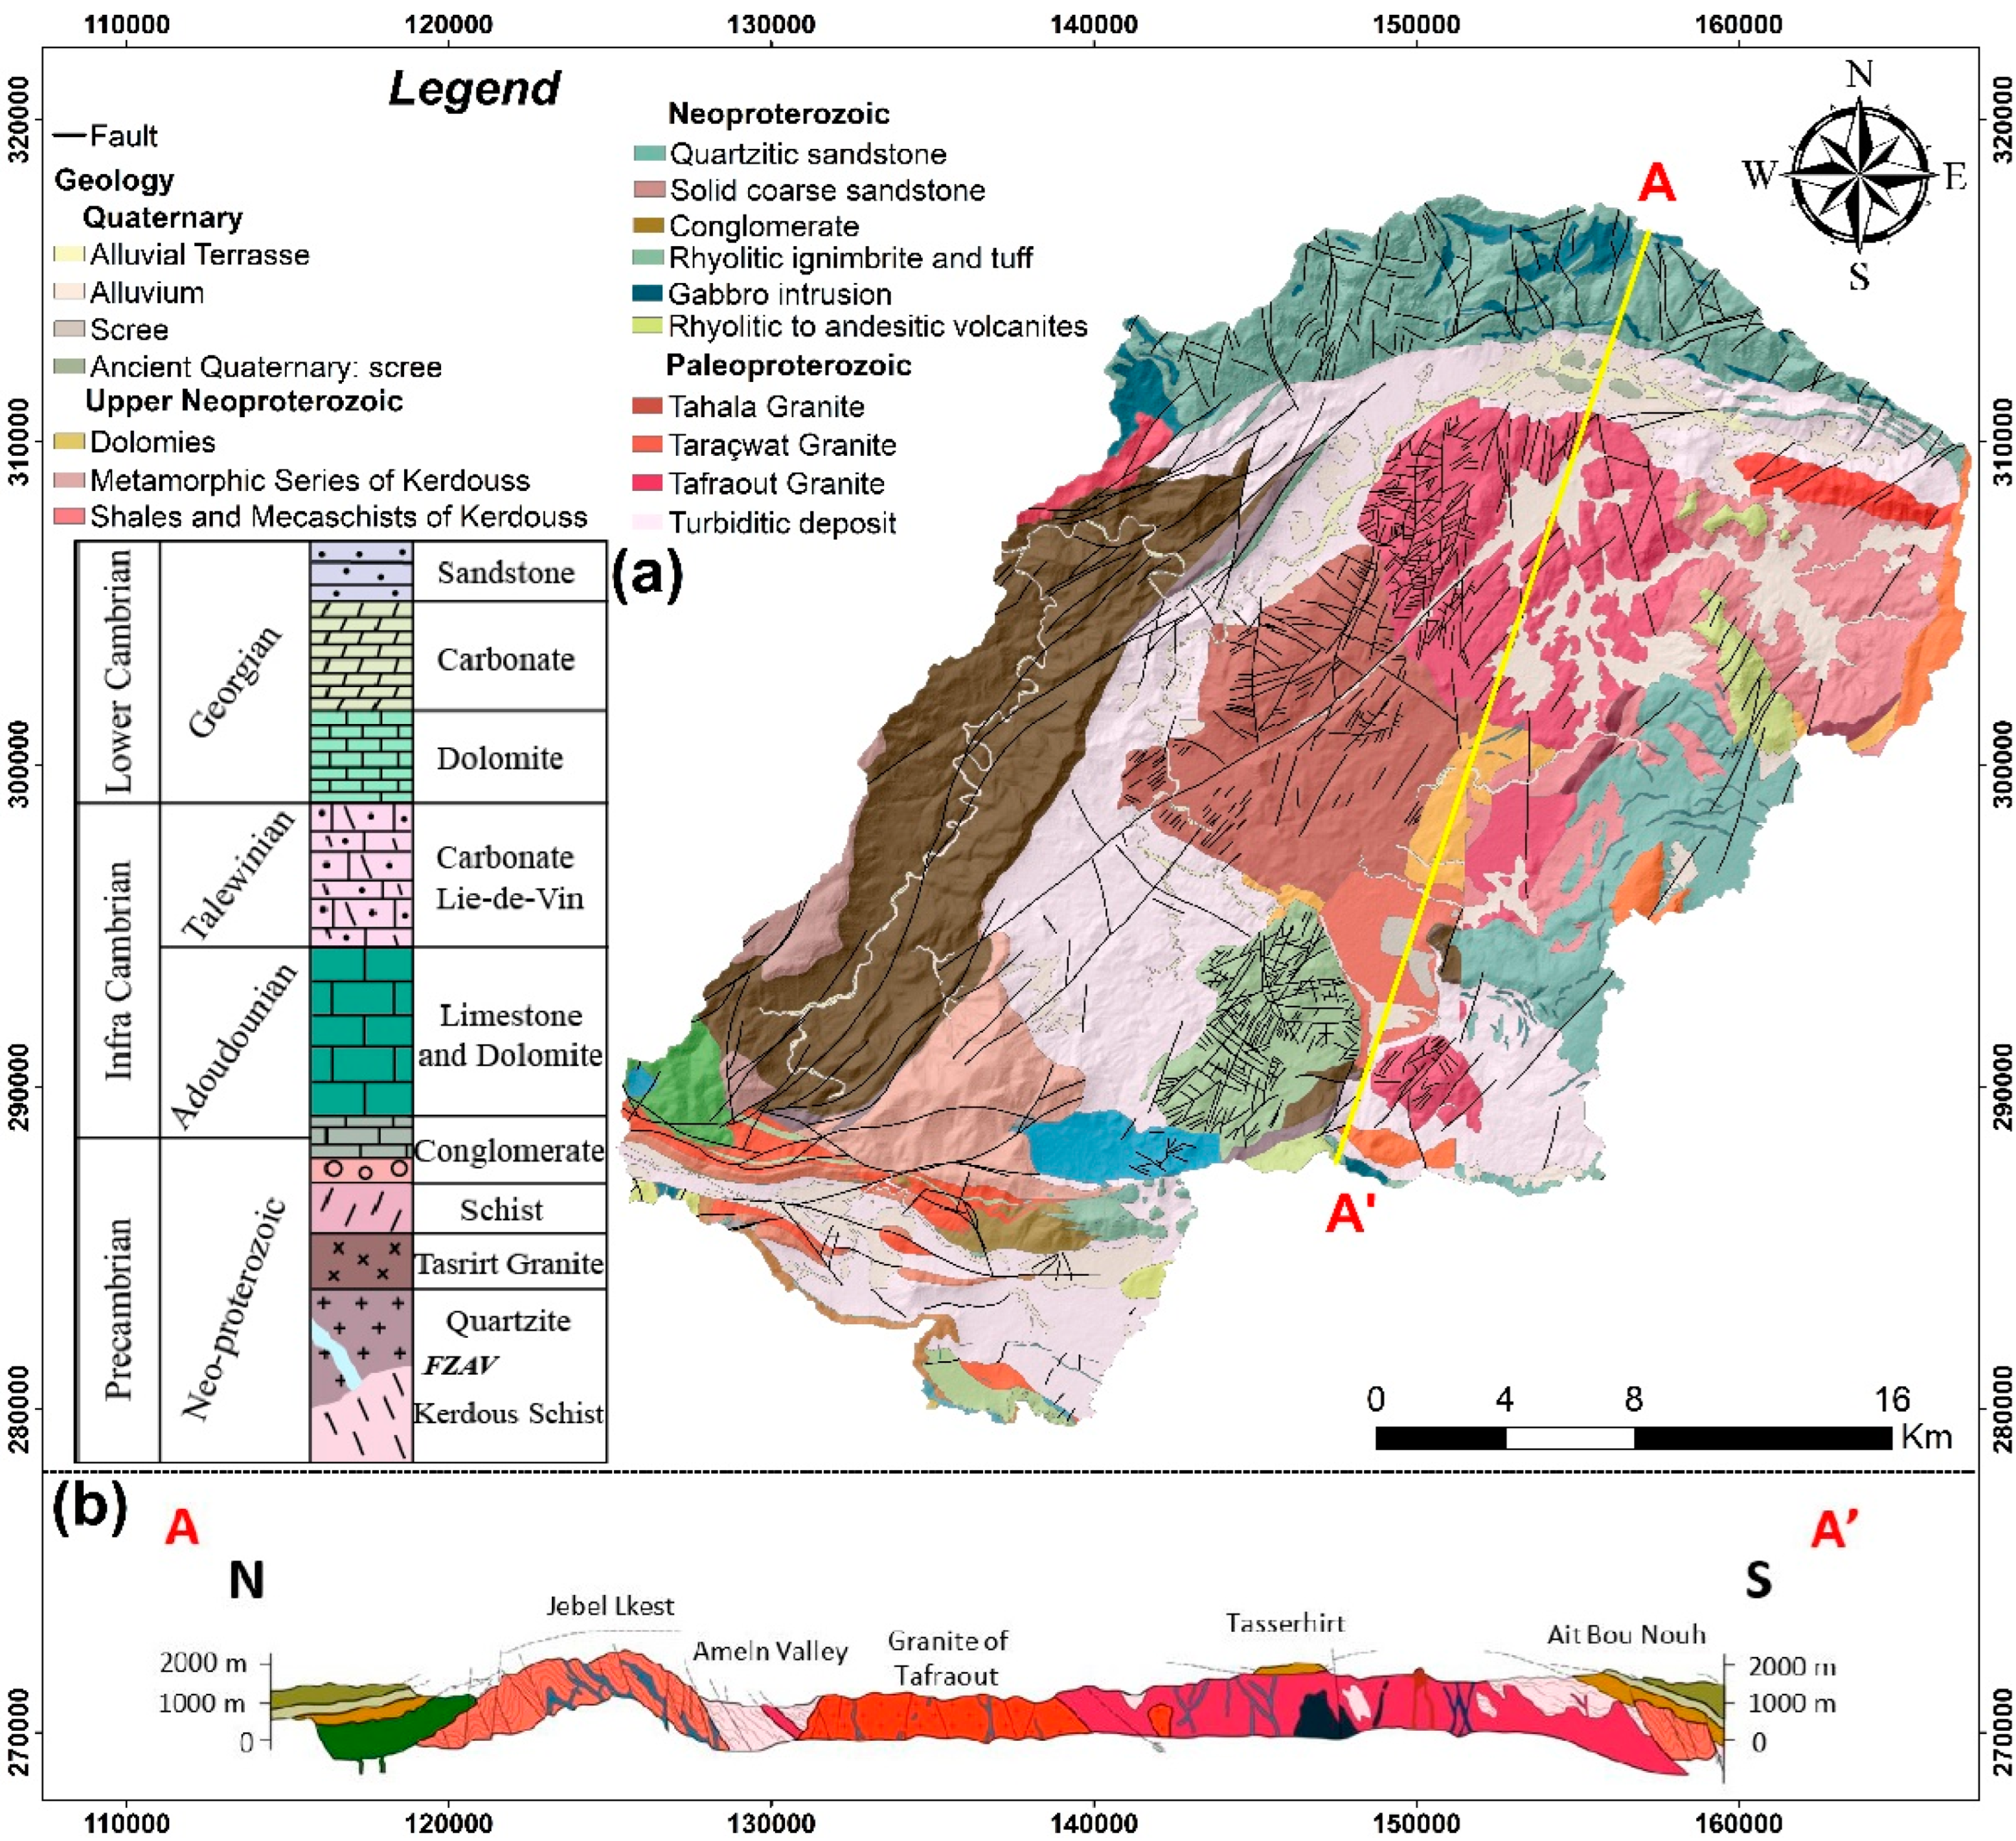
2. Study Area
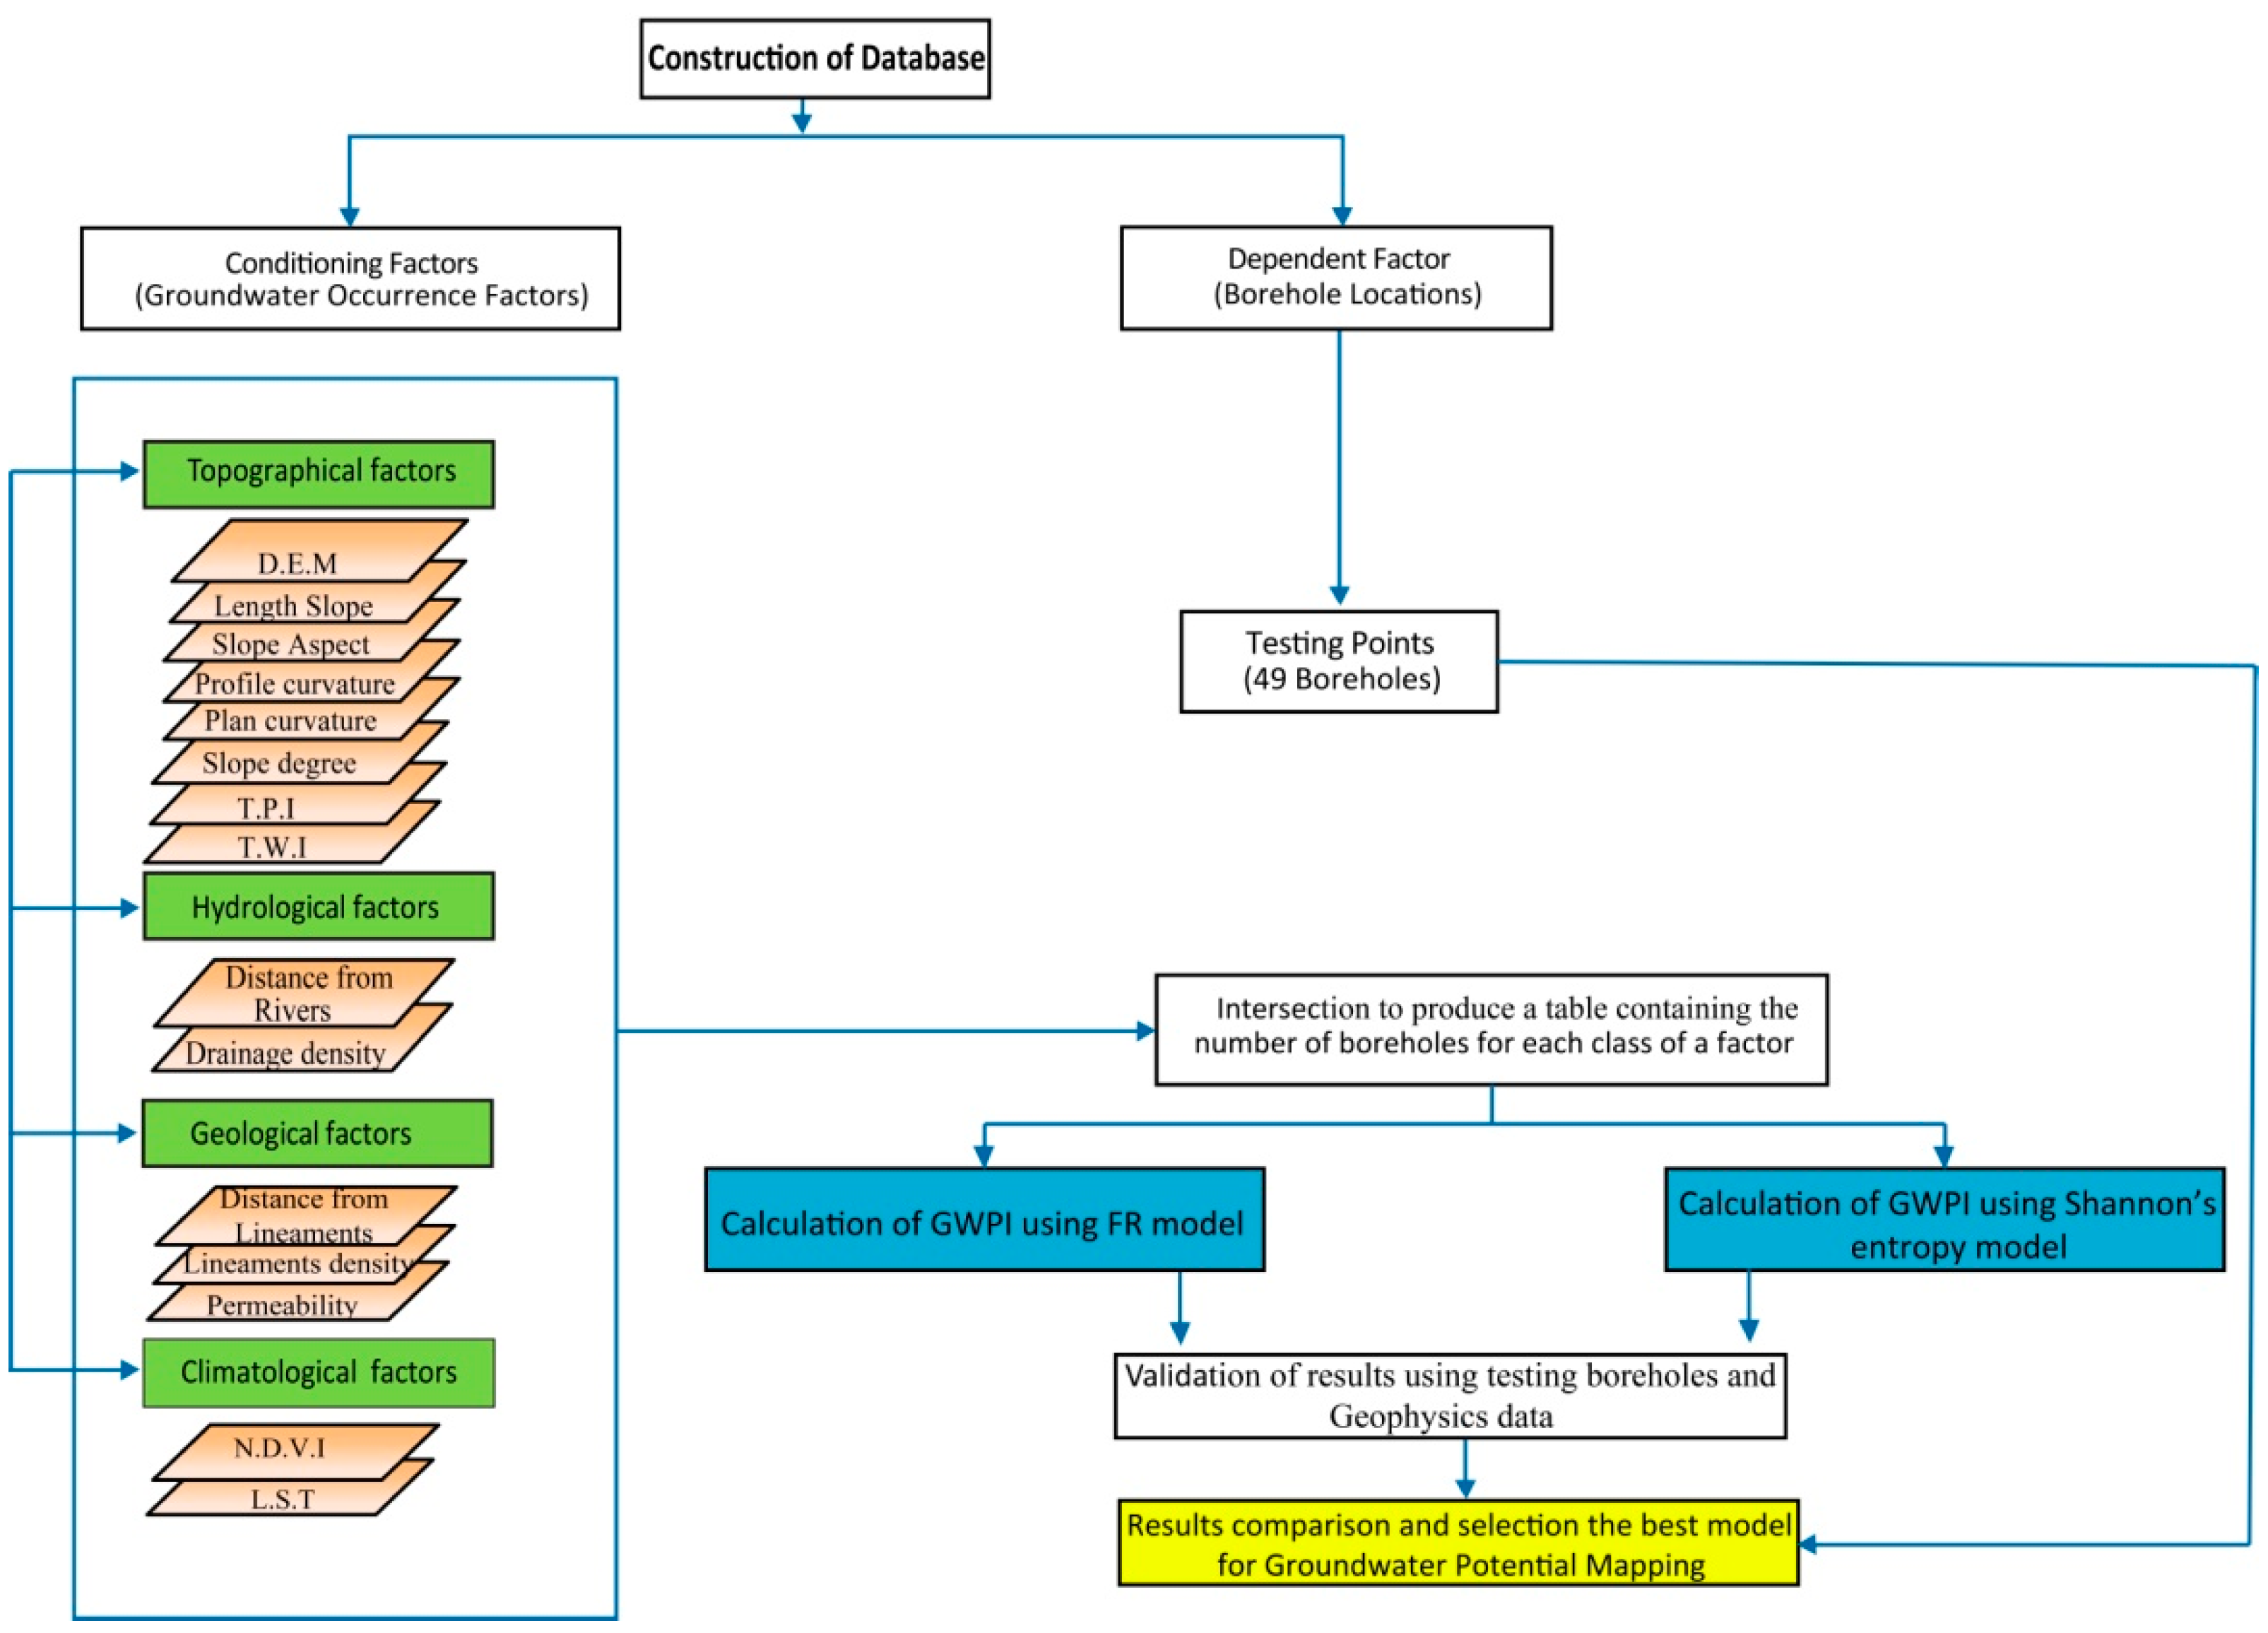
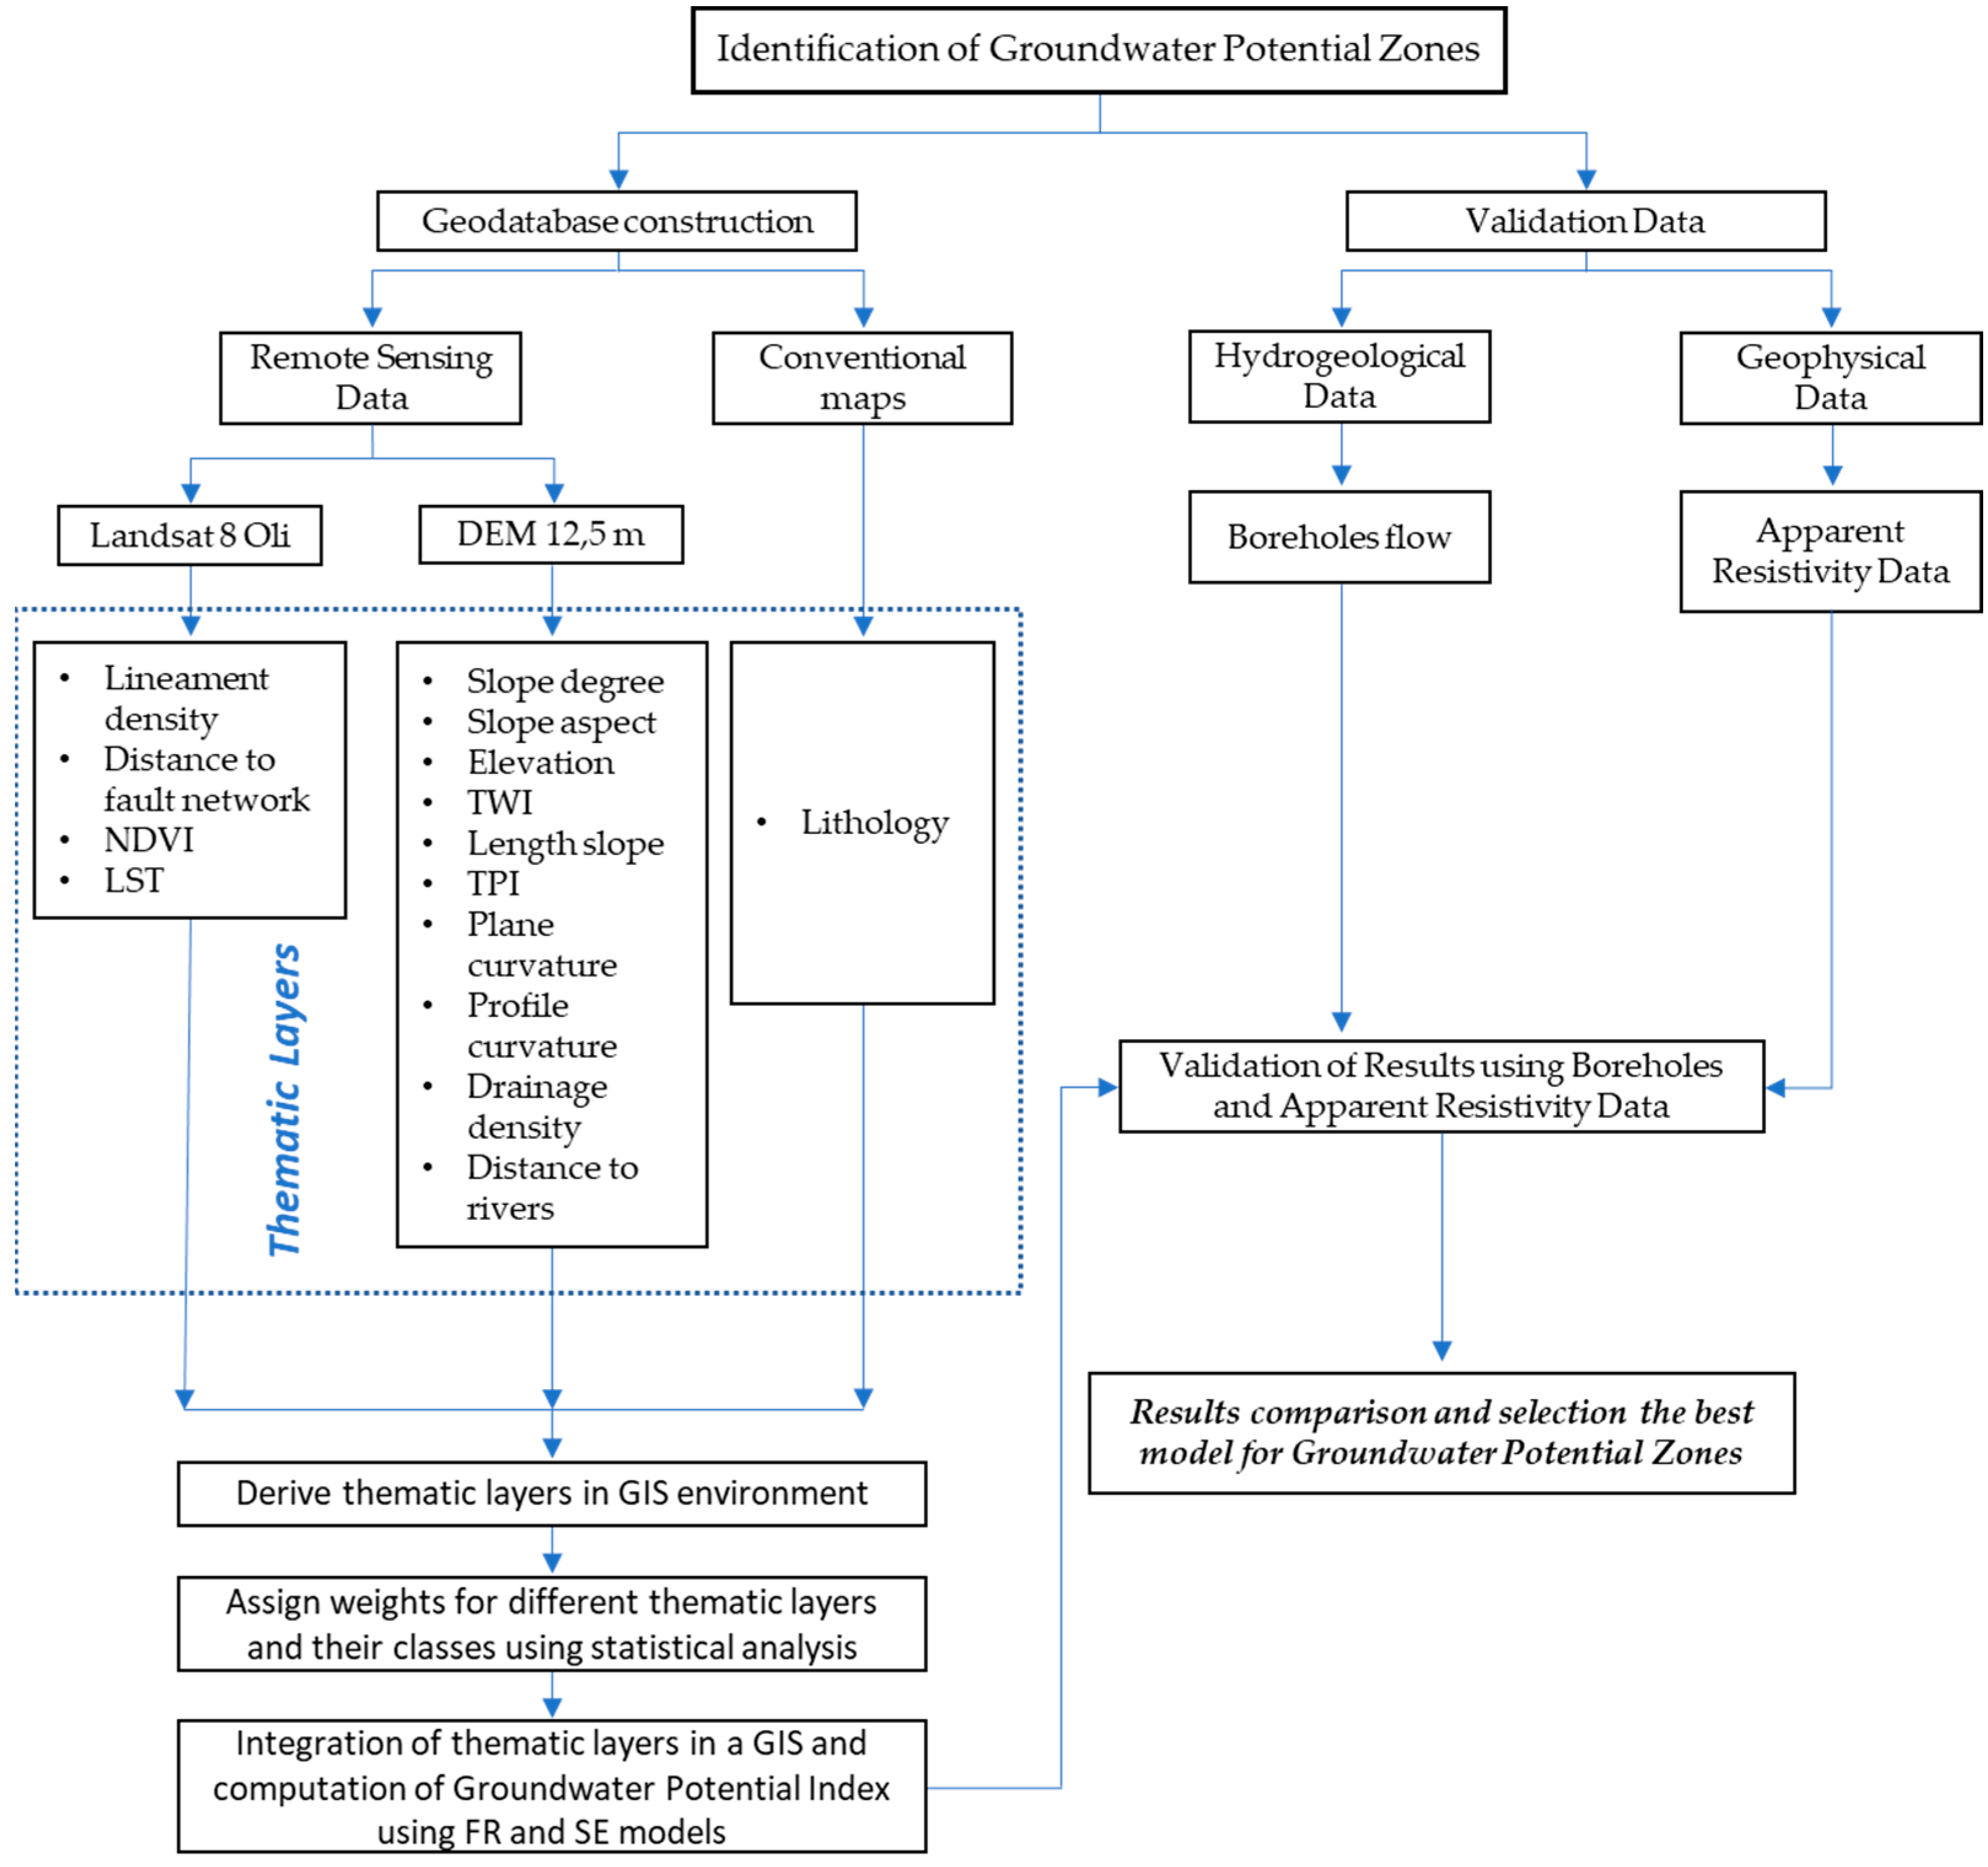
3. Materials and Methods
3.1. GIS Applications
3.2. Groundwater Occurrence Factors
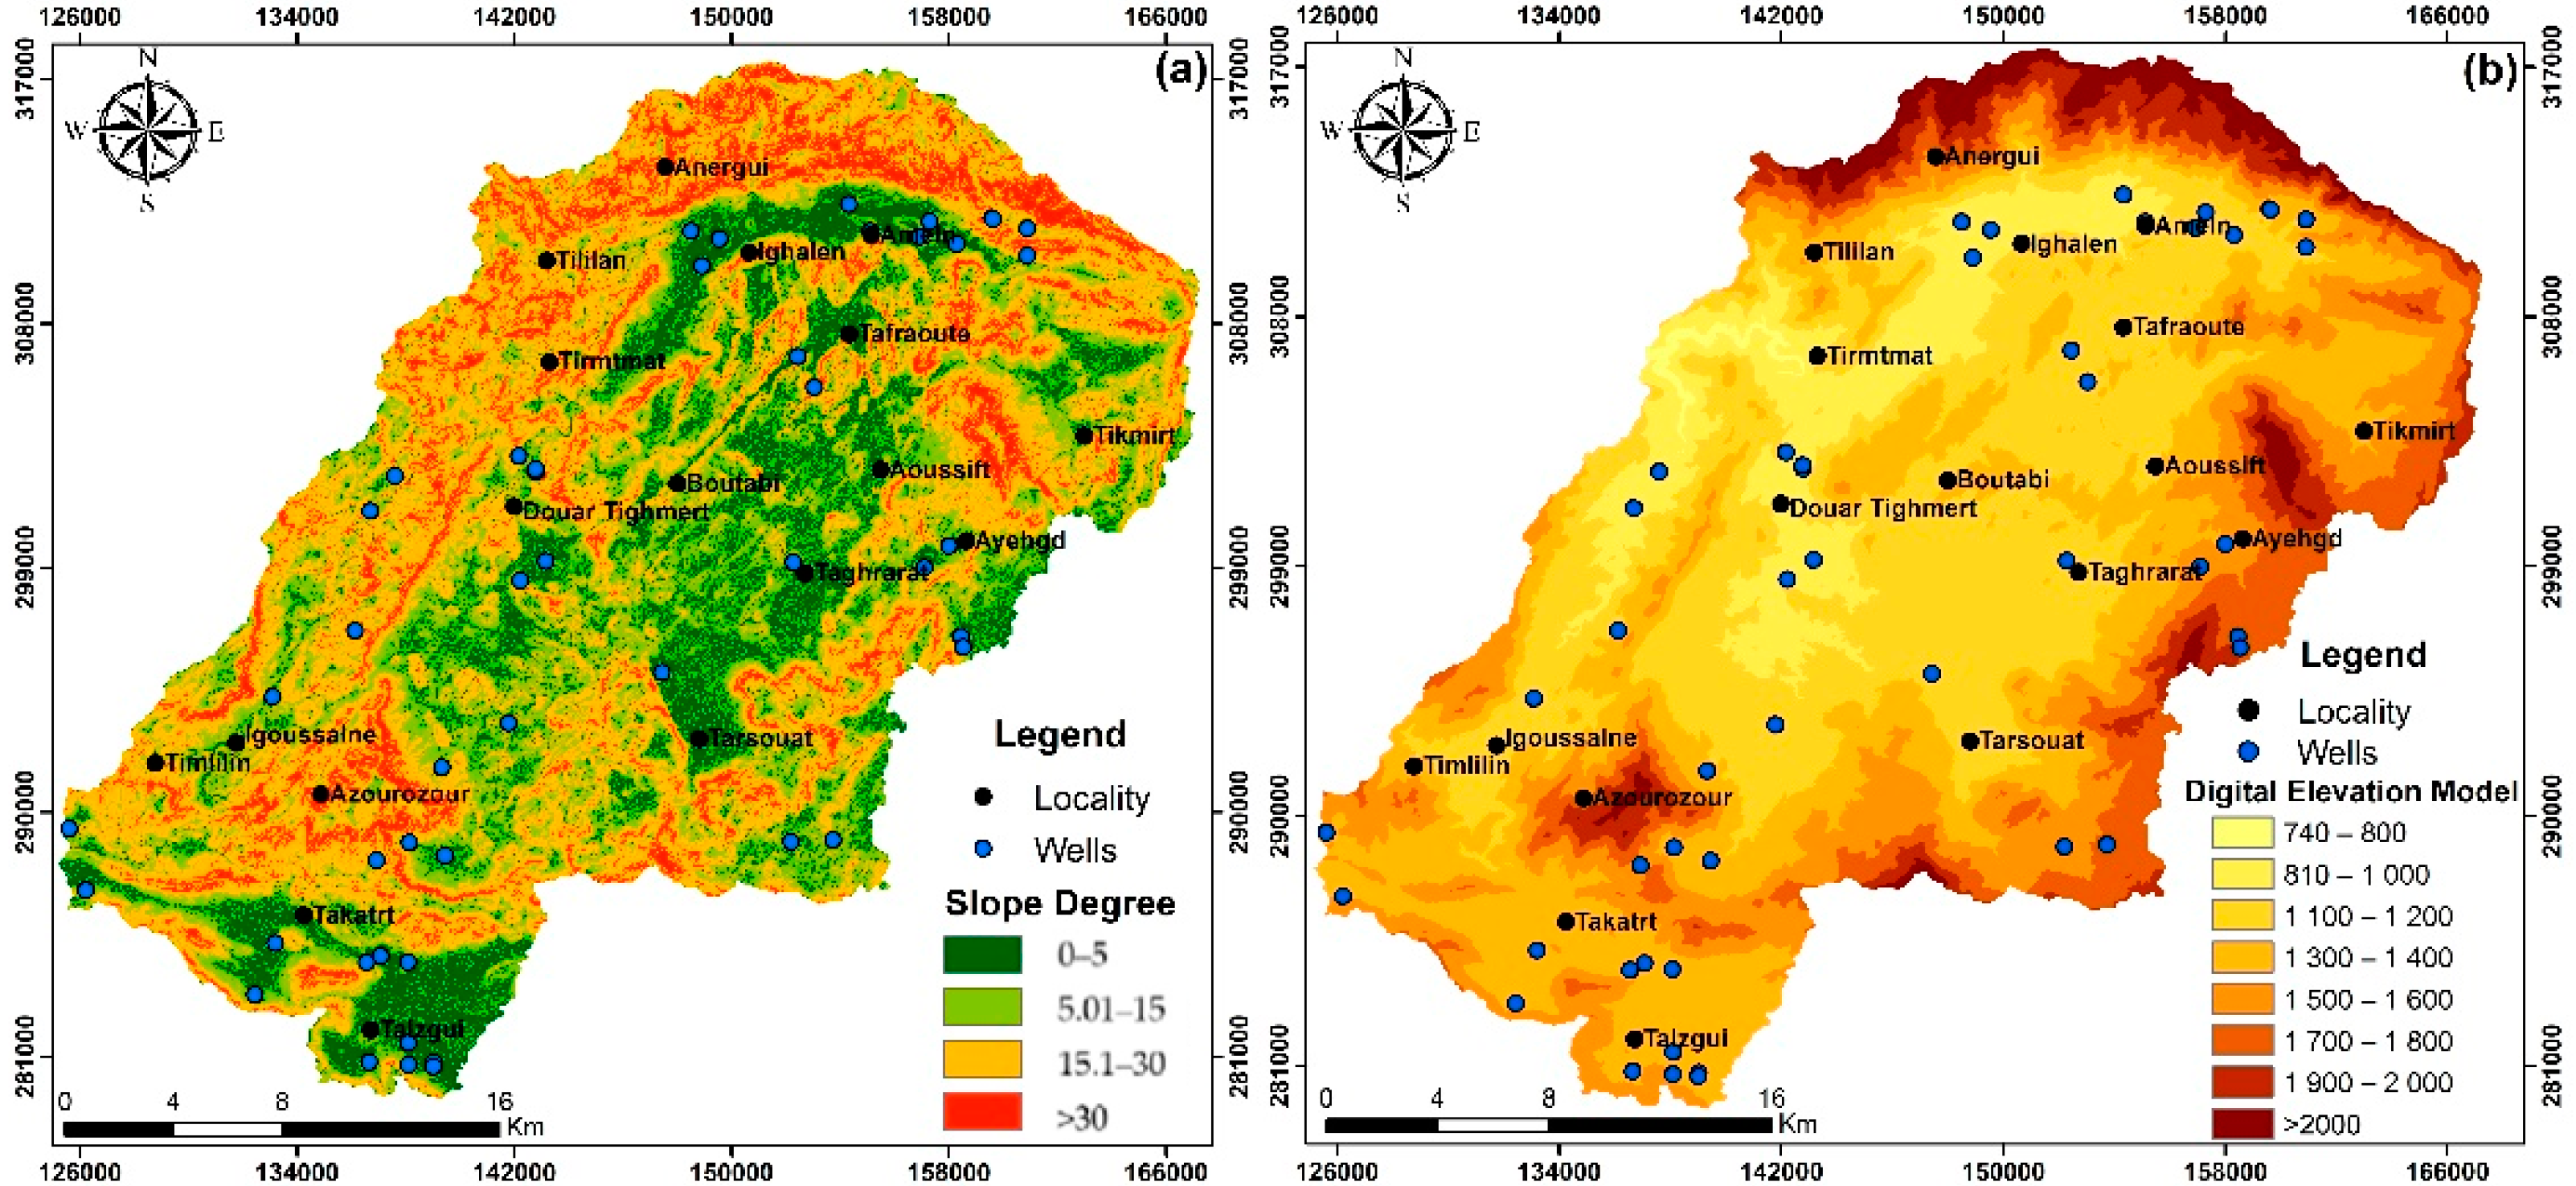
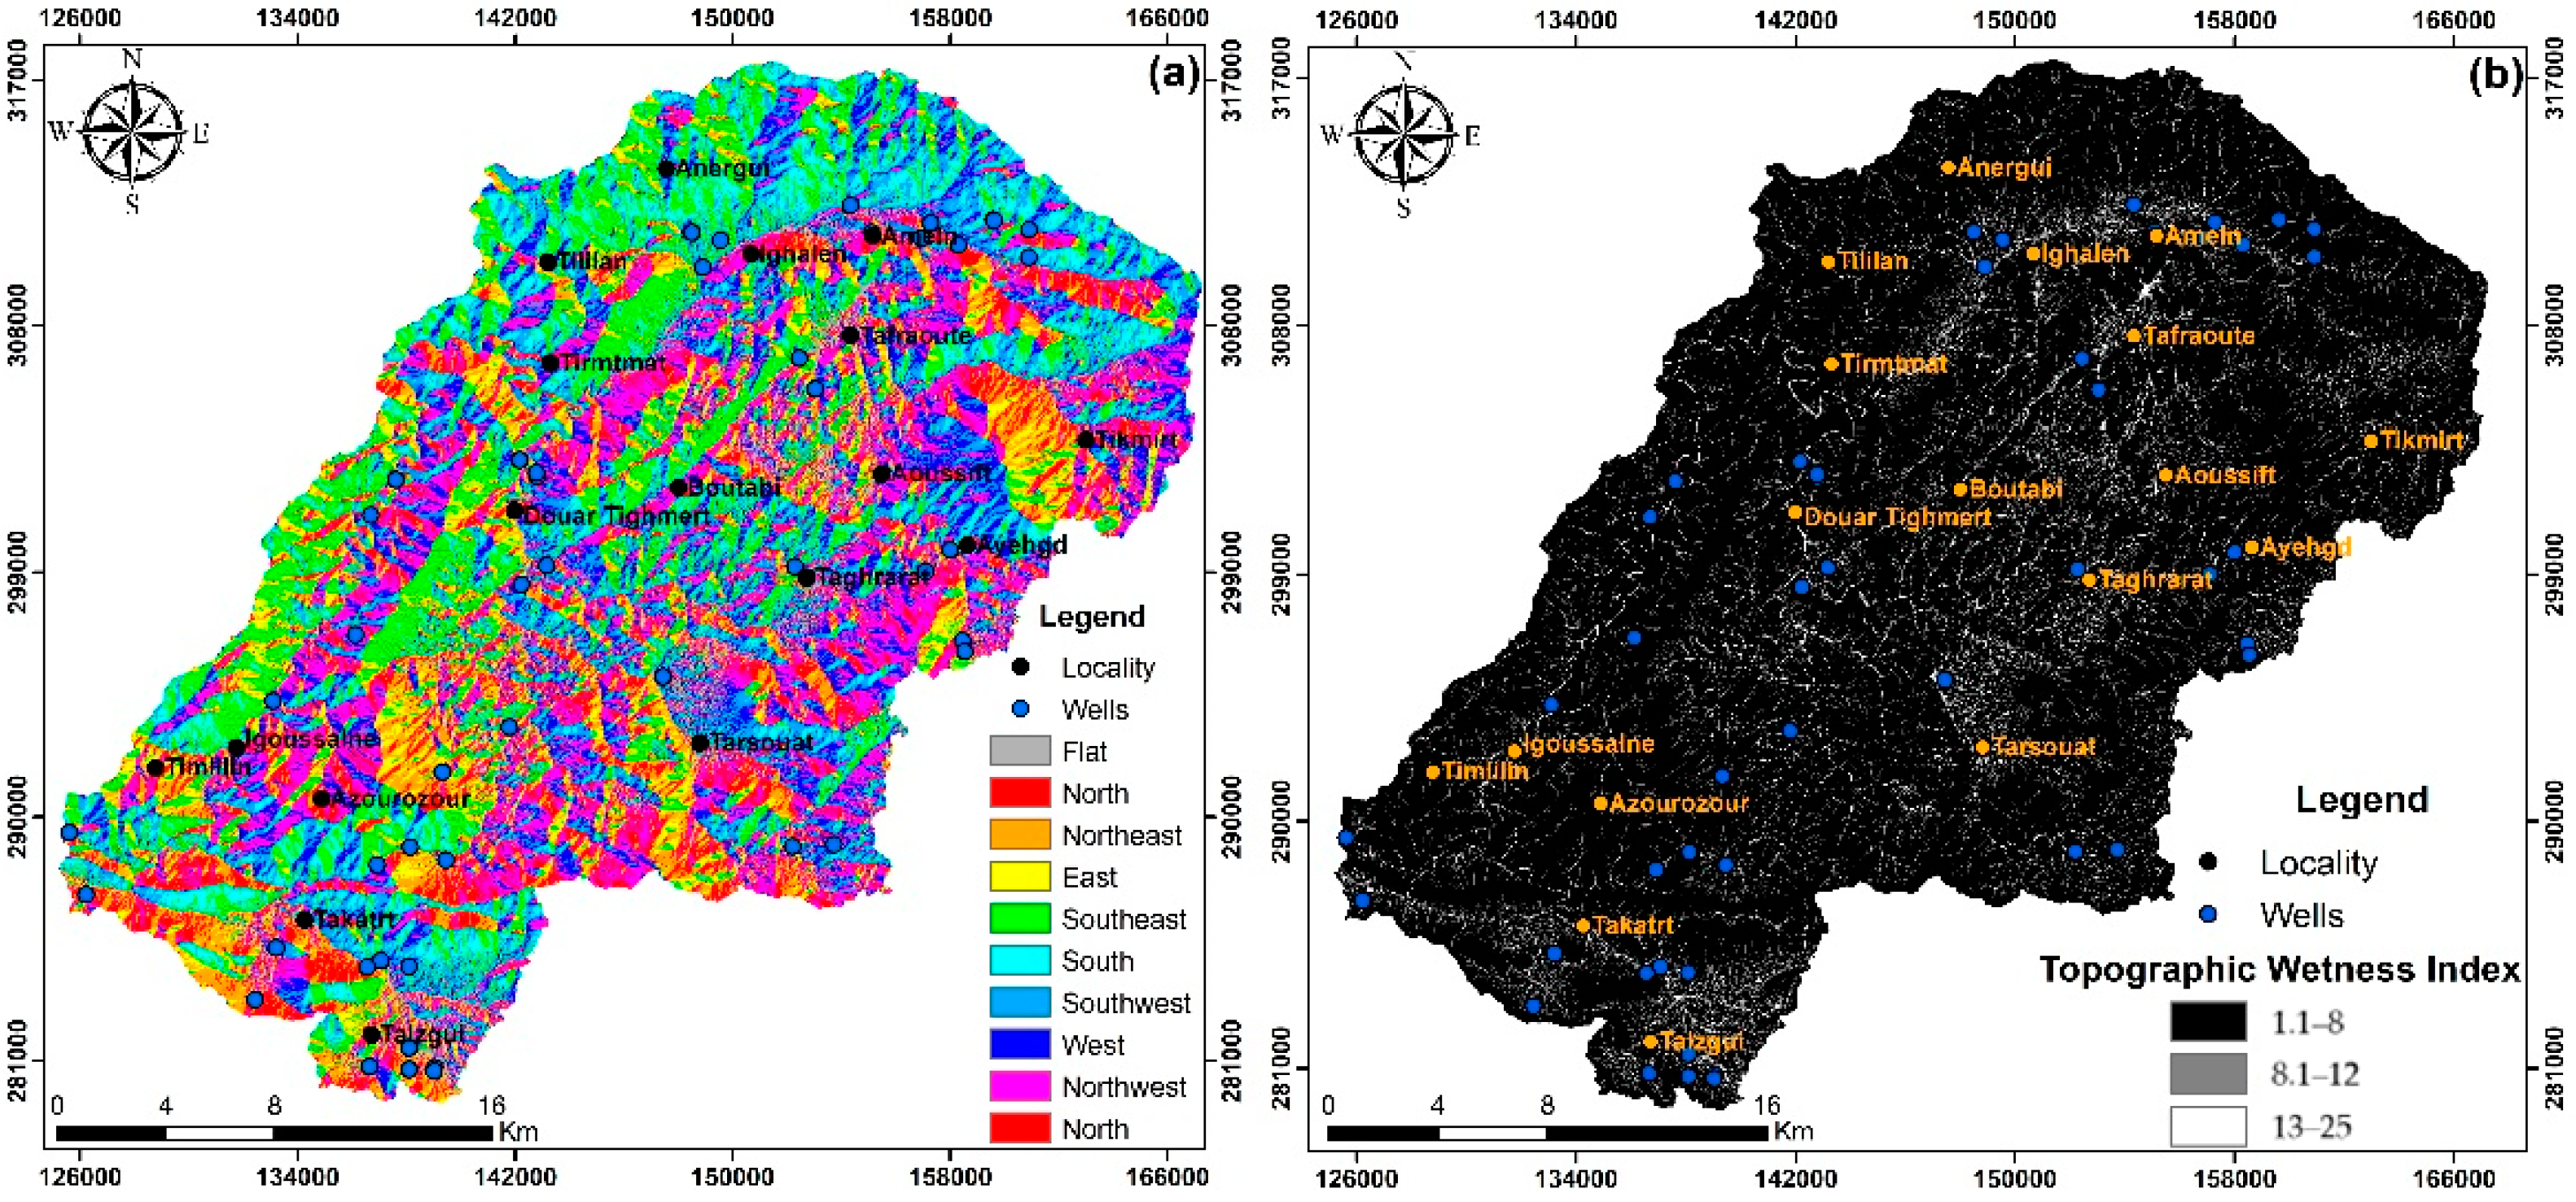
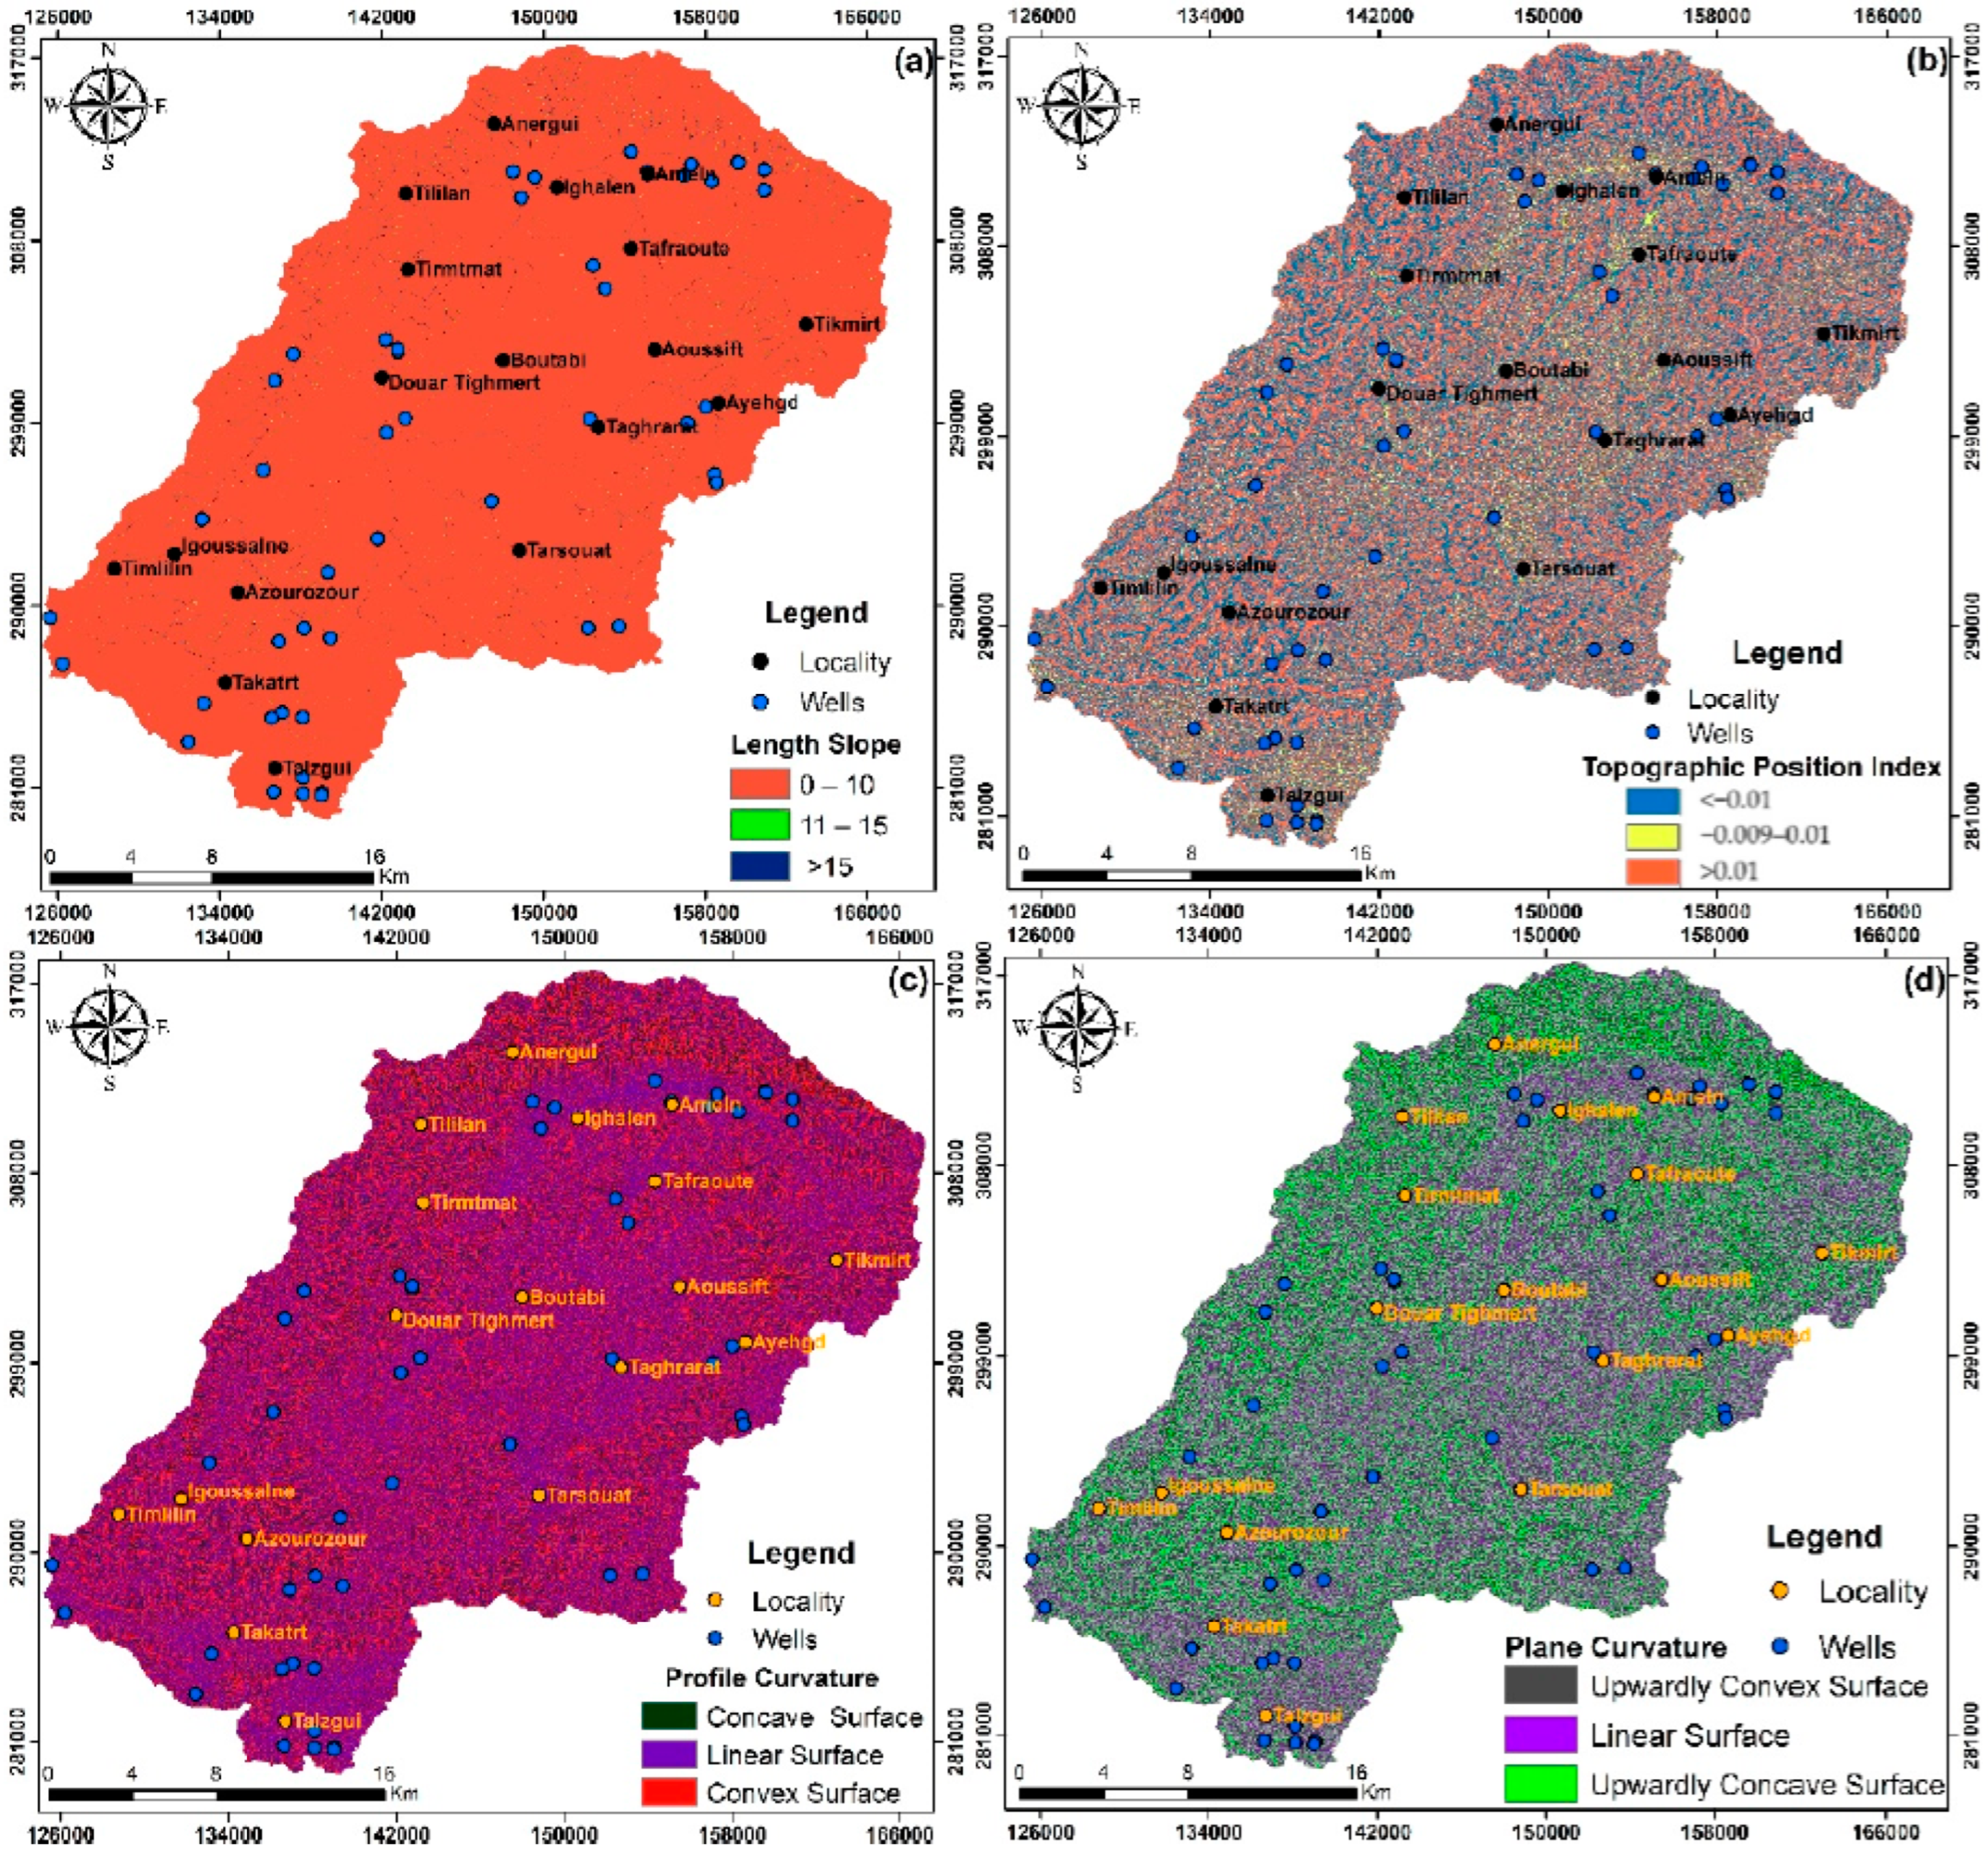
3.2.1. Topographic Factors
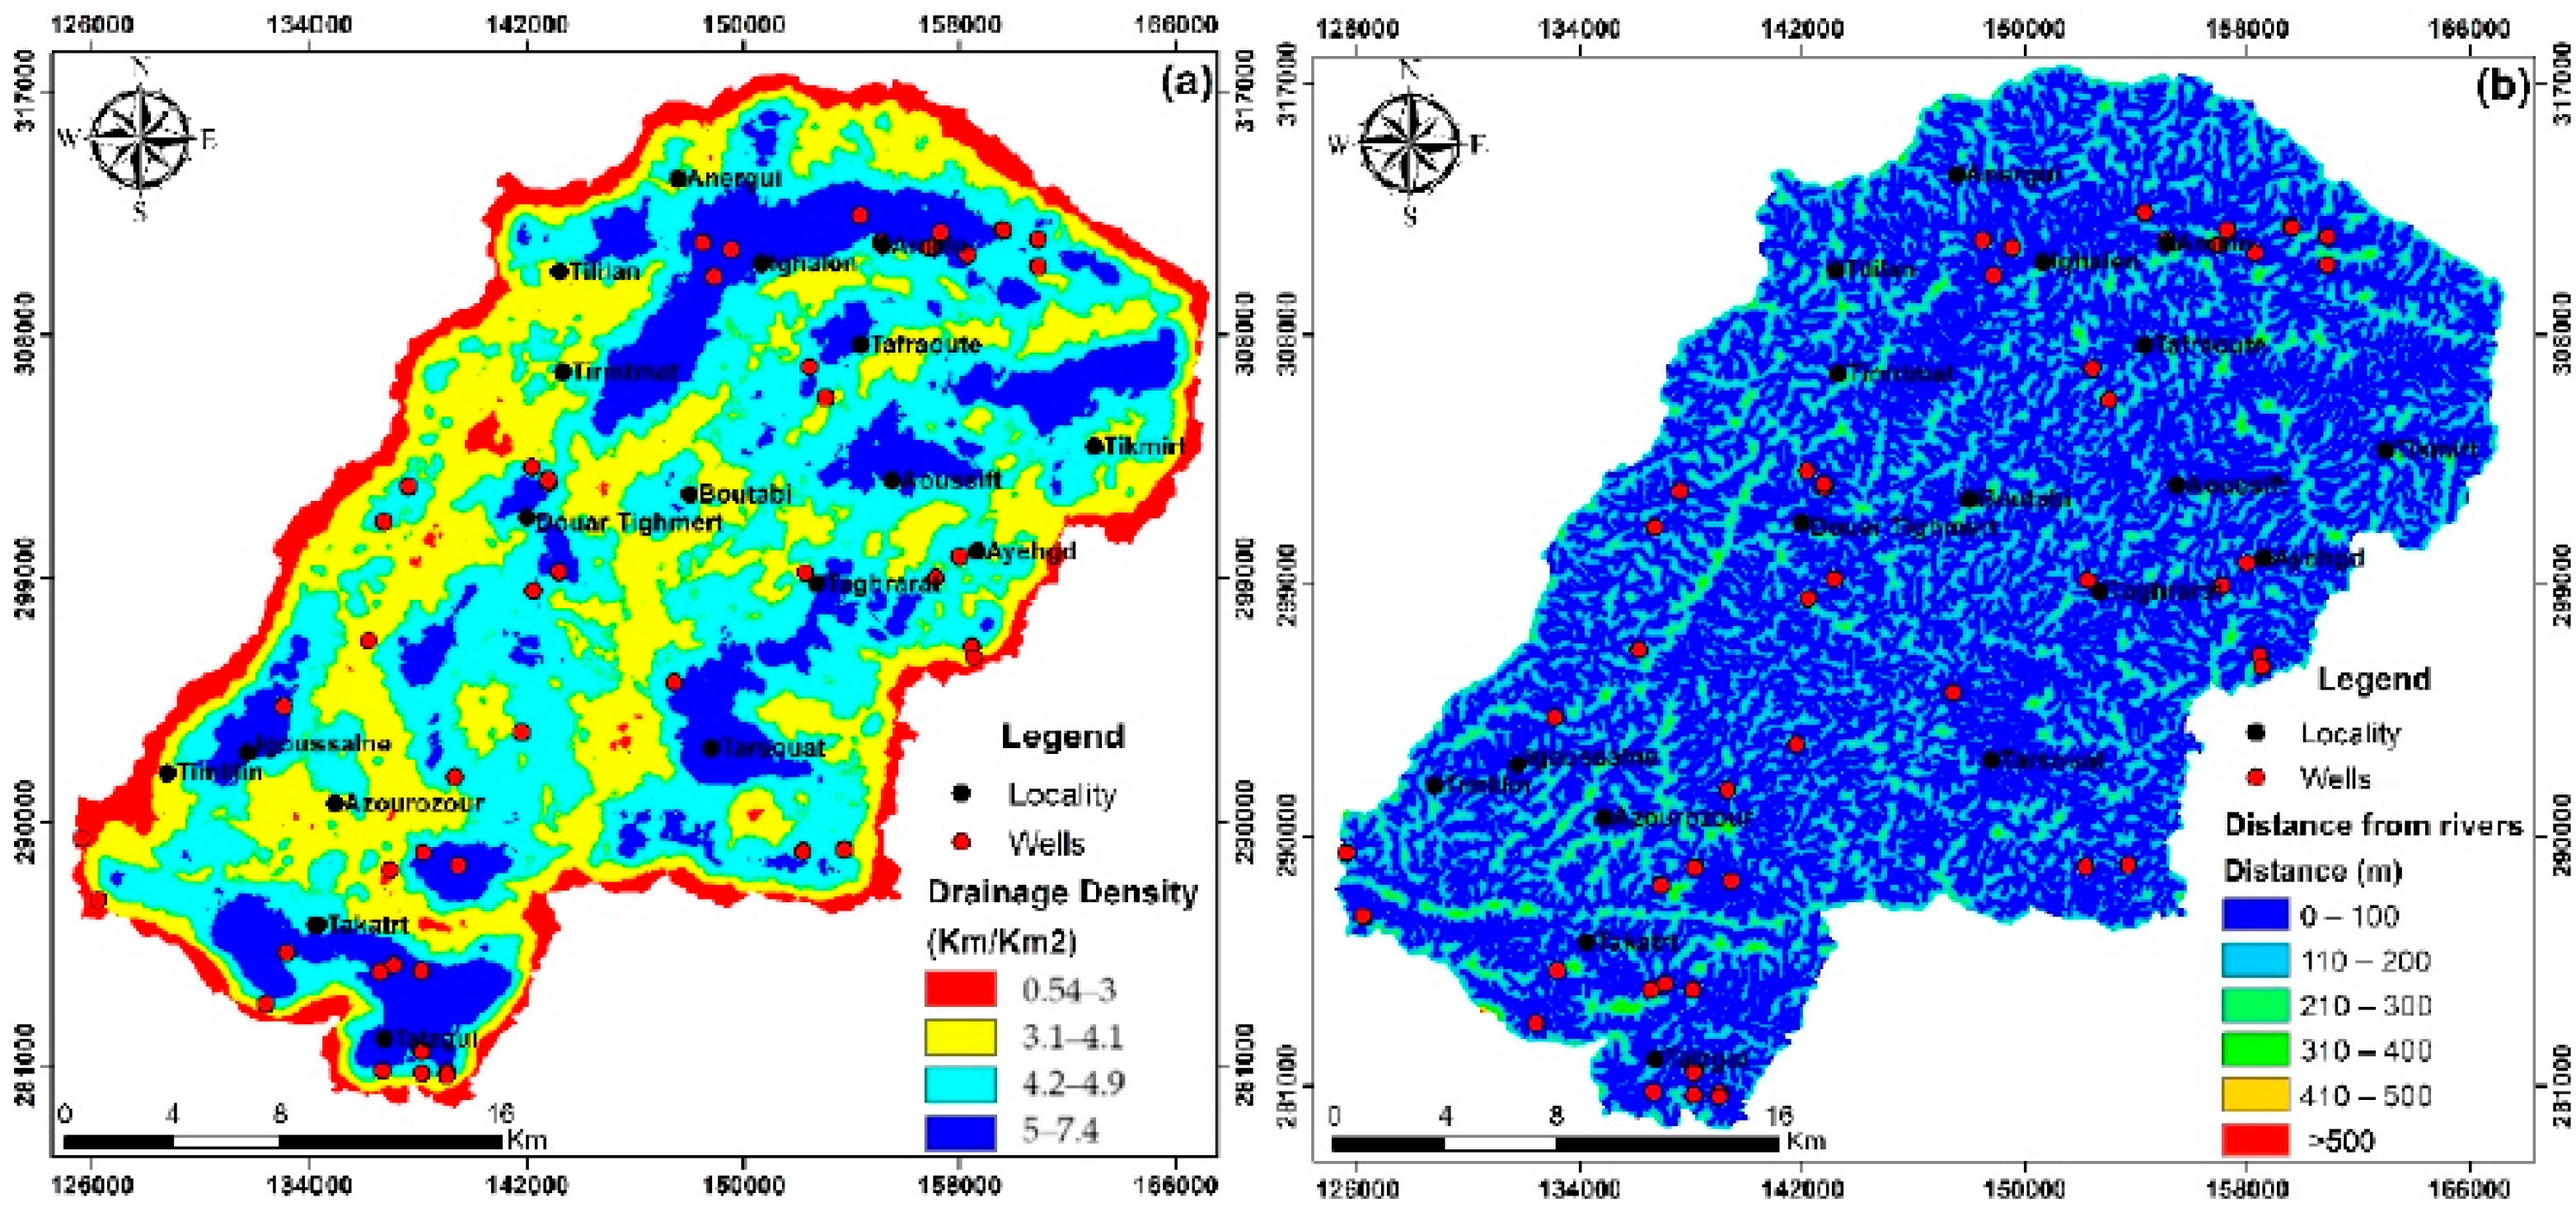
3.2.2. Hydrological Factors
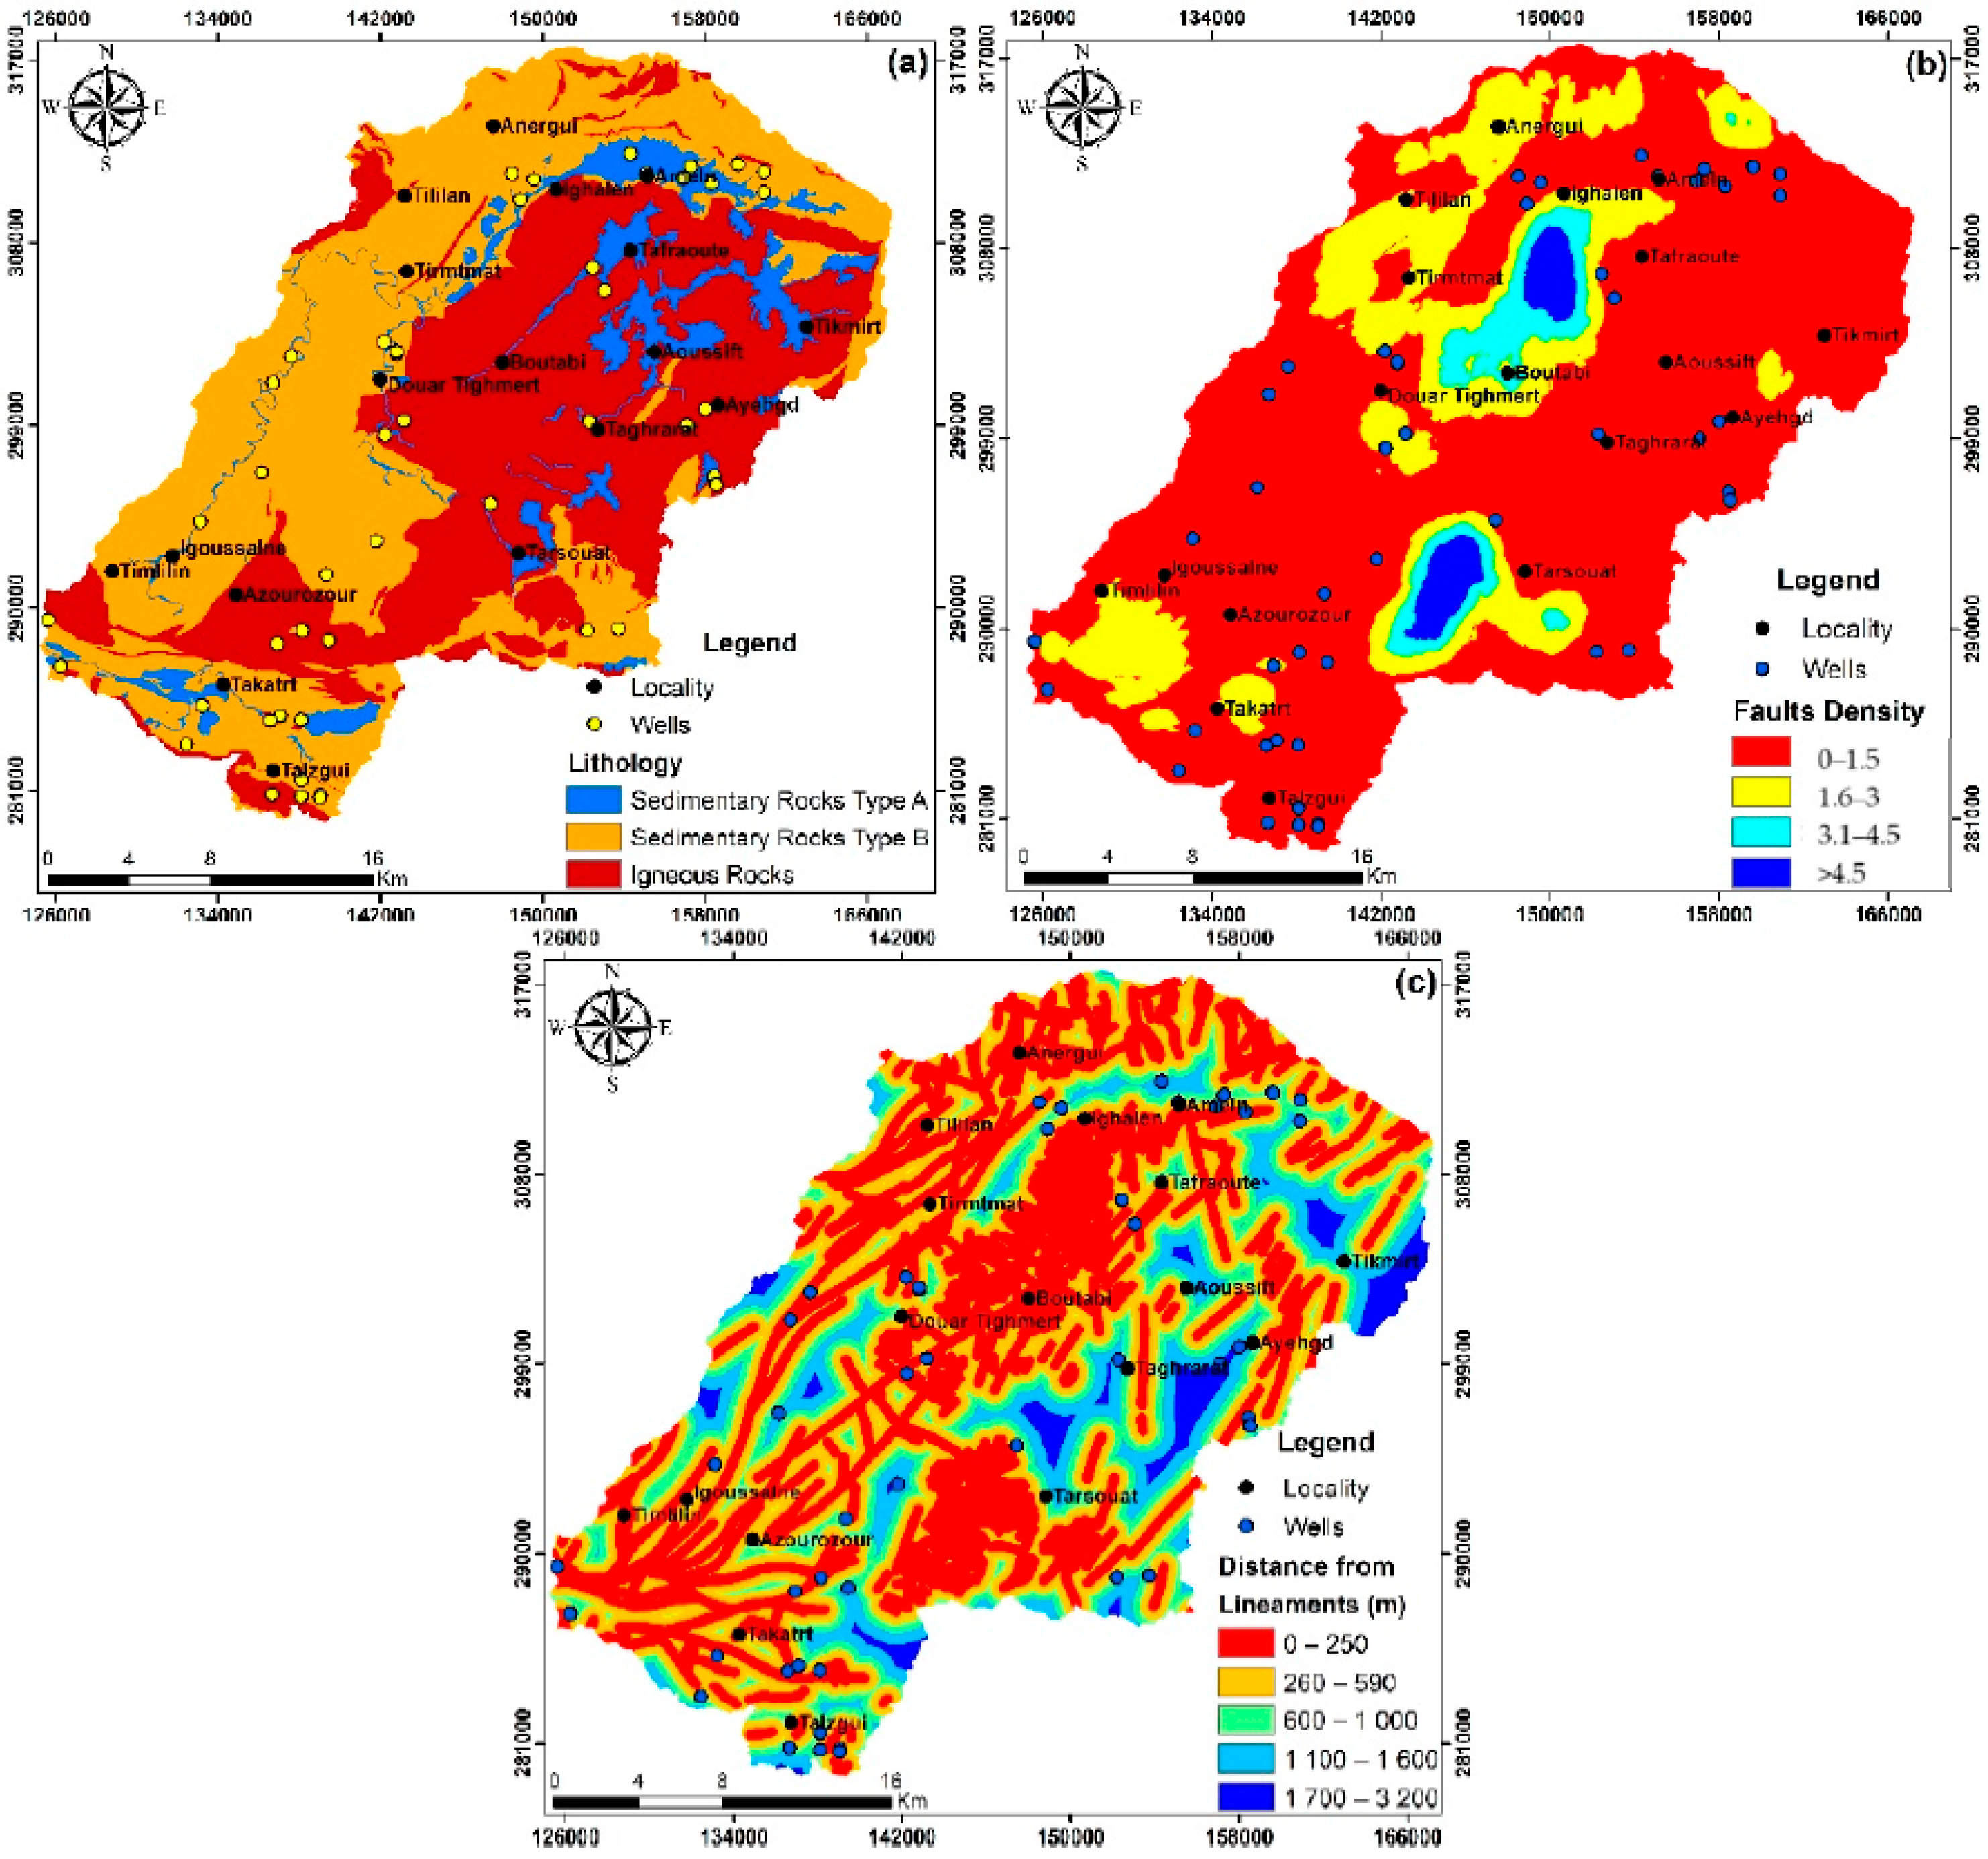
3.2.3. Geological Factors
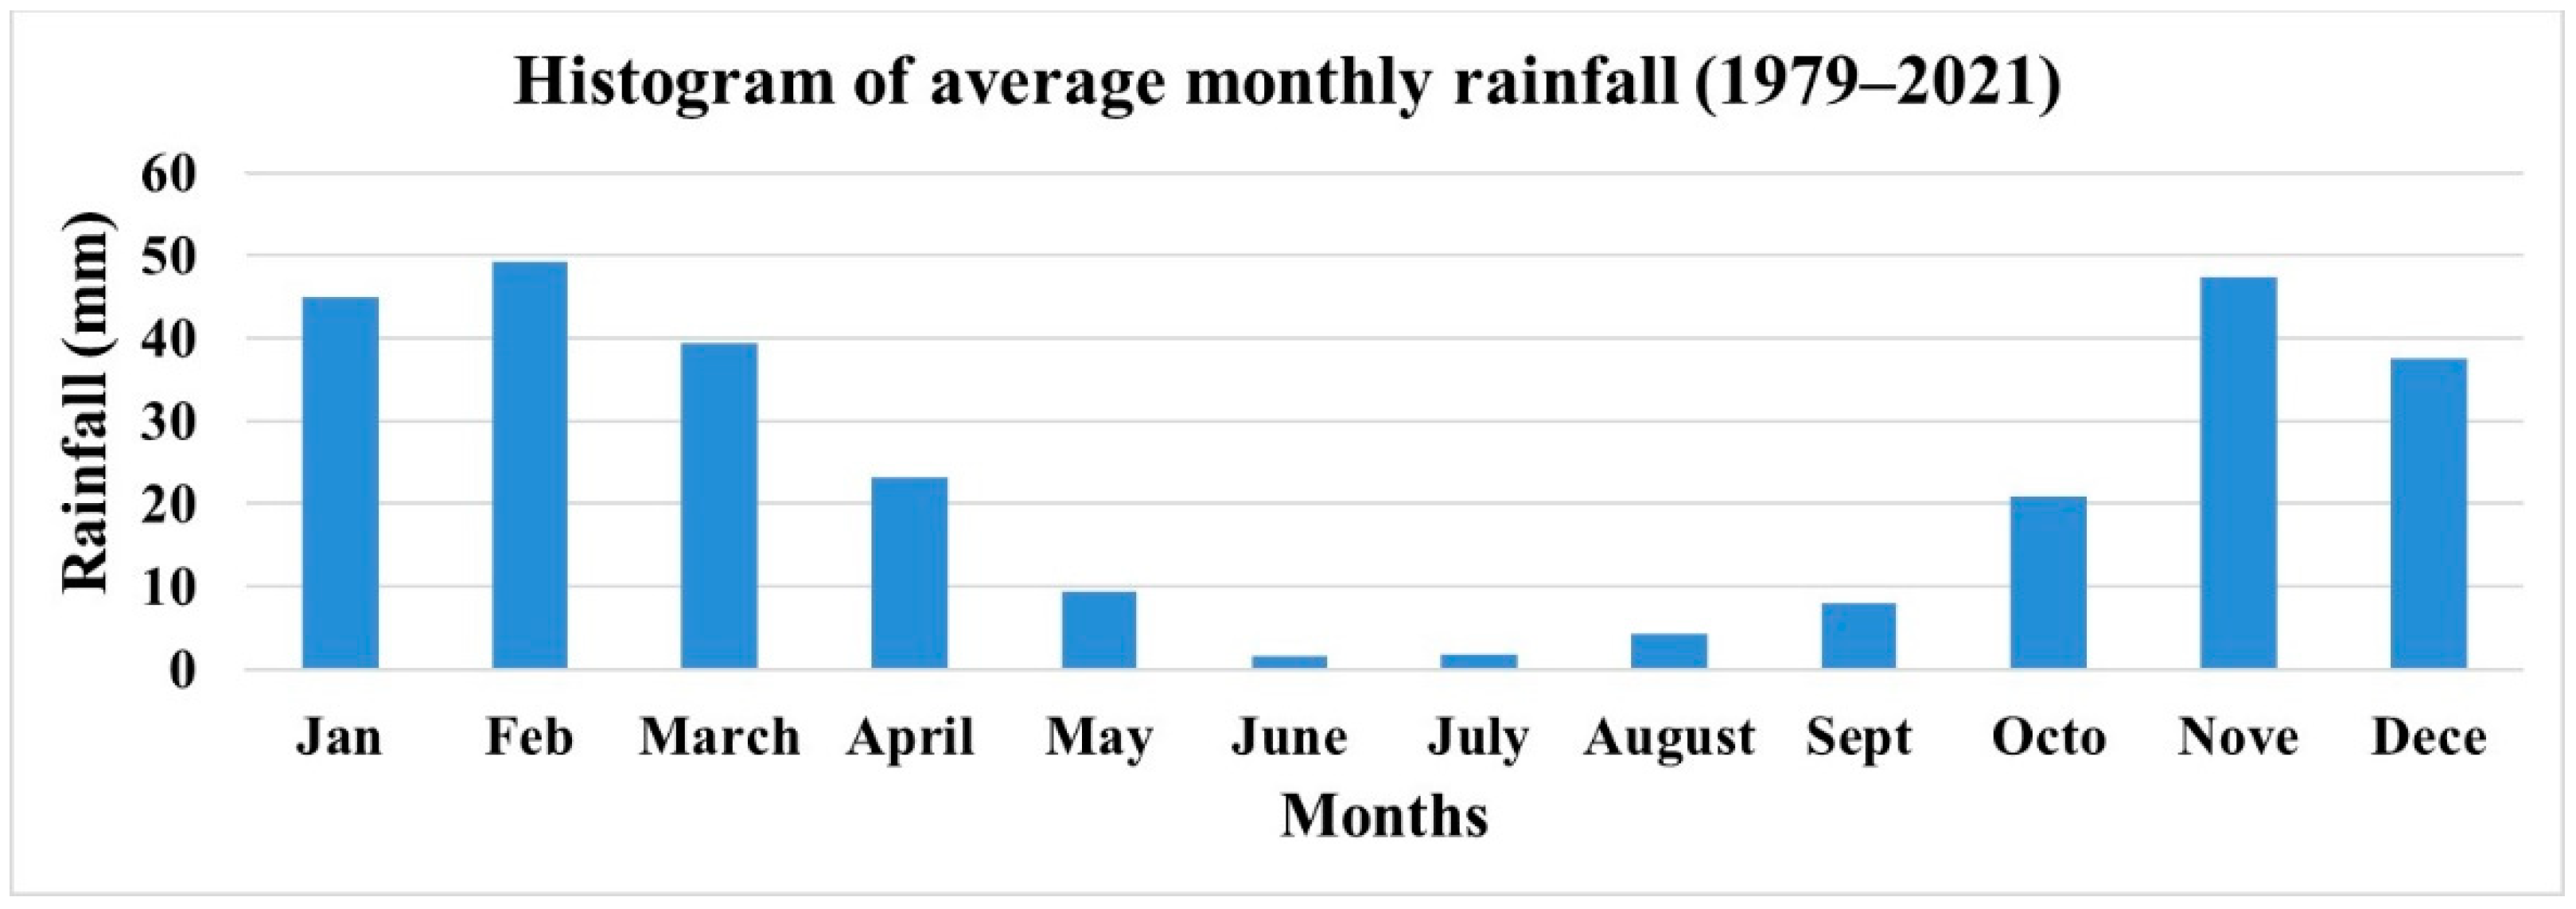
3.2.4. Climatological Factors
3.3. Modeling Techniques
3.3.1. Frequency Ratio Model
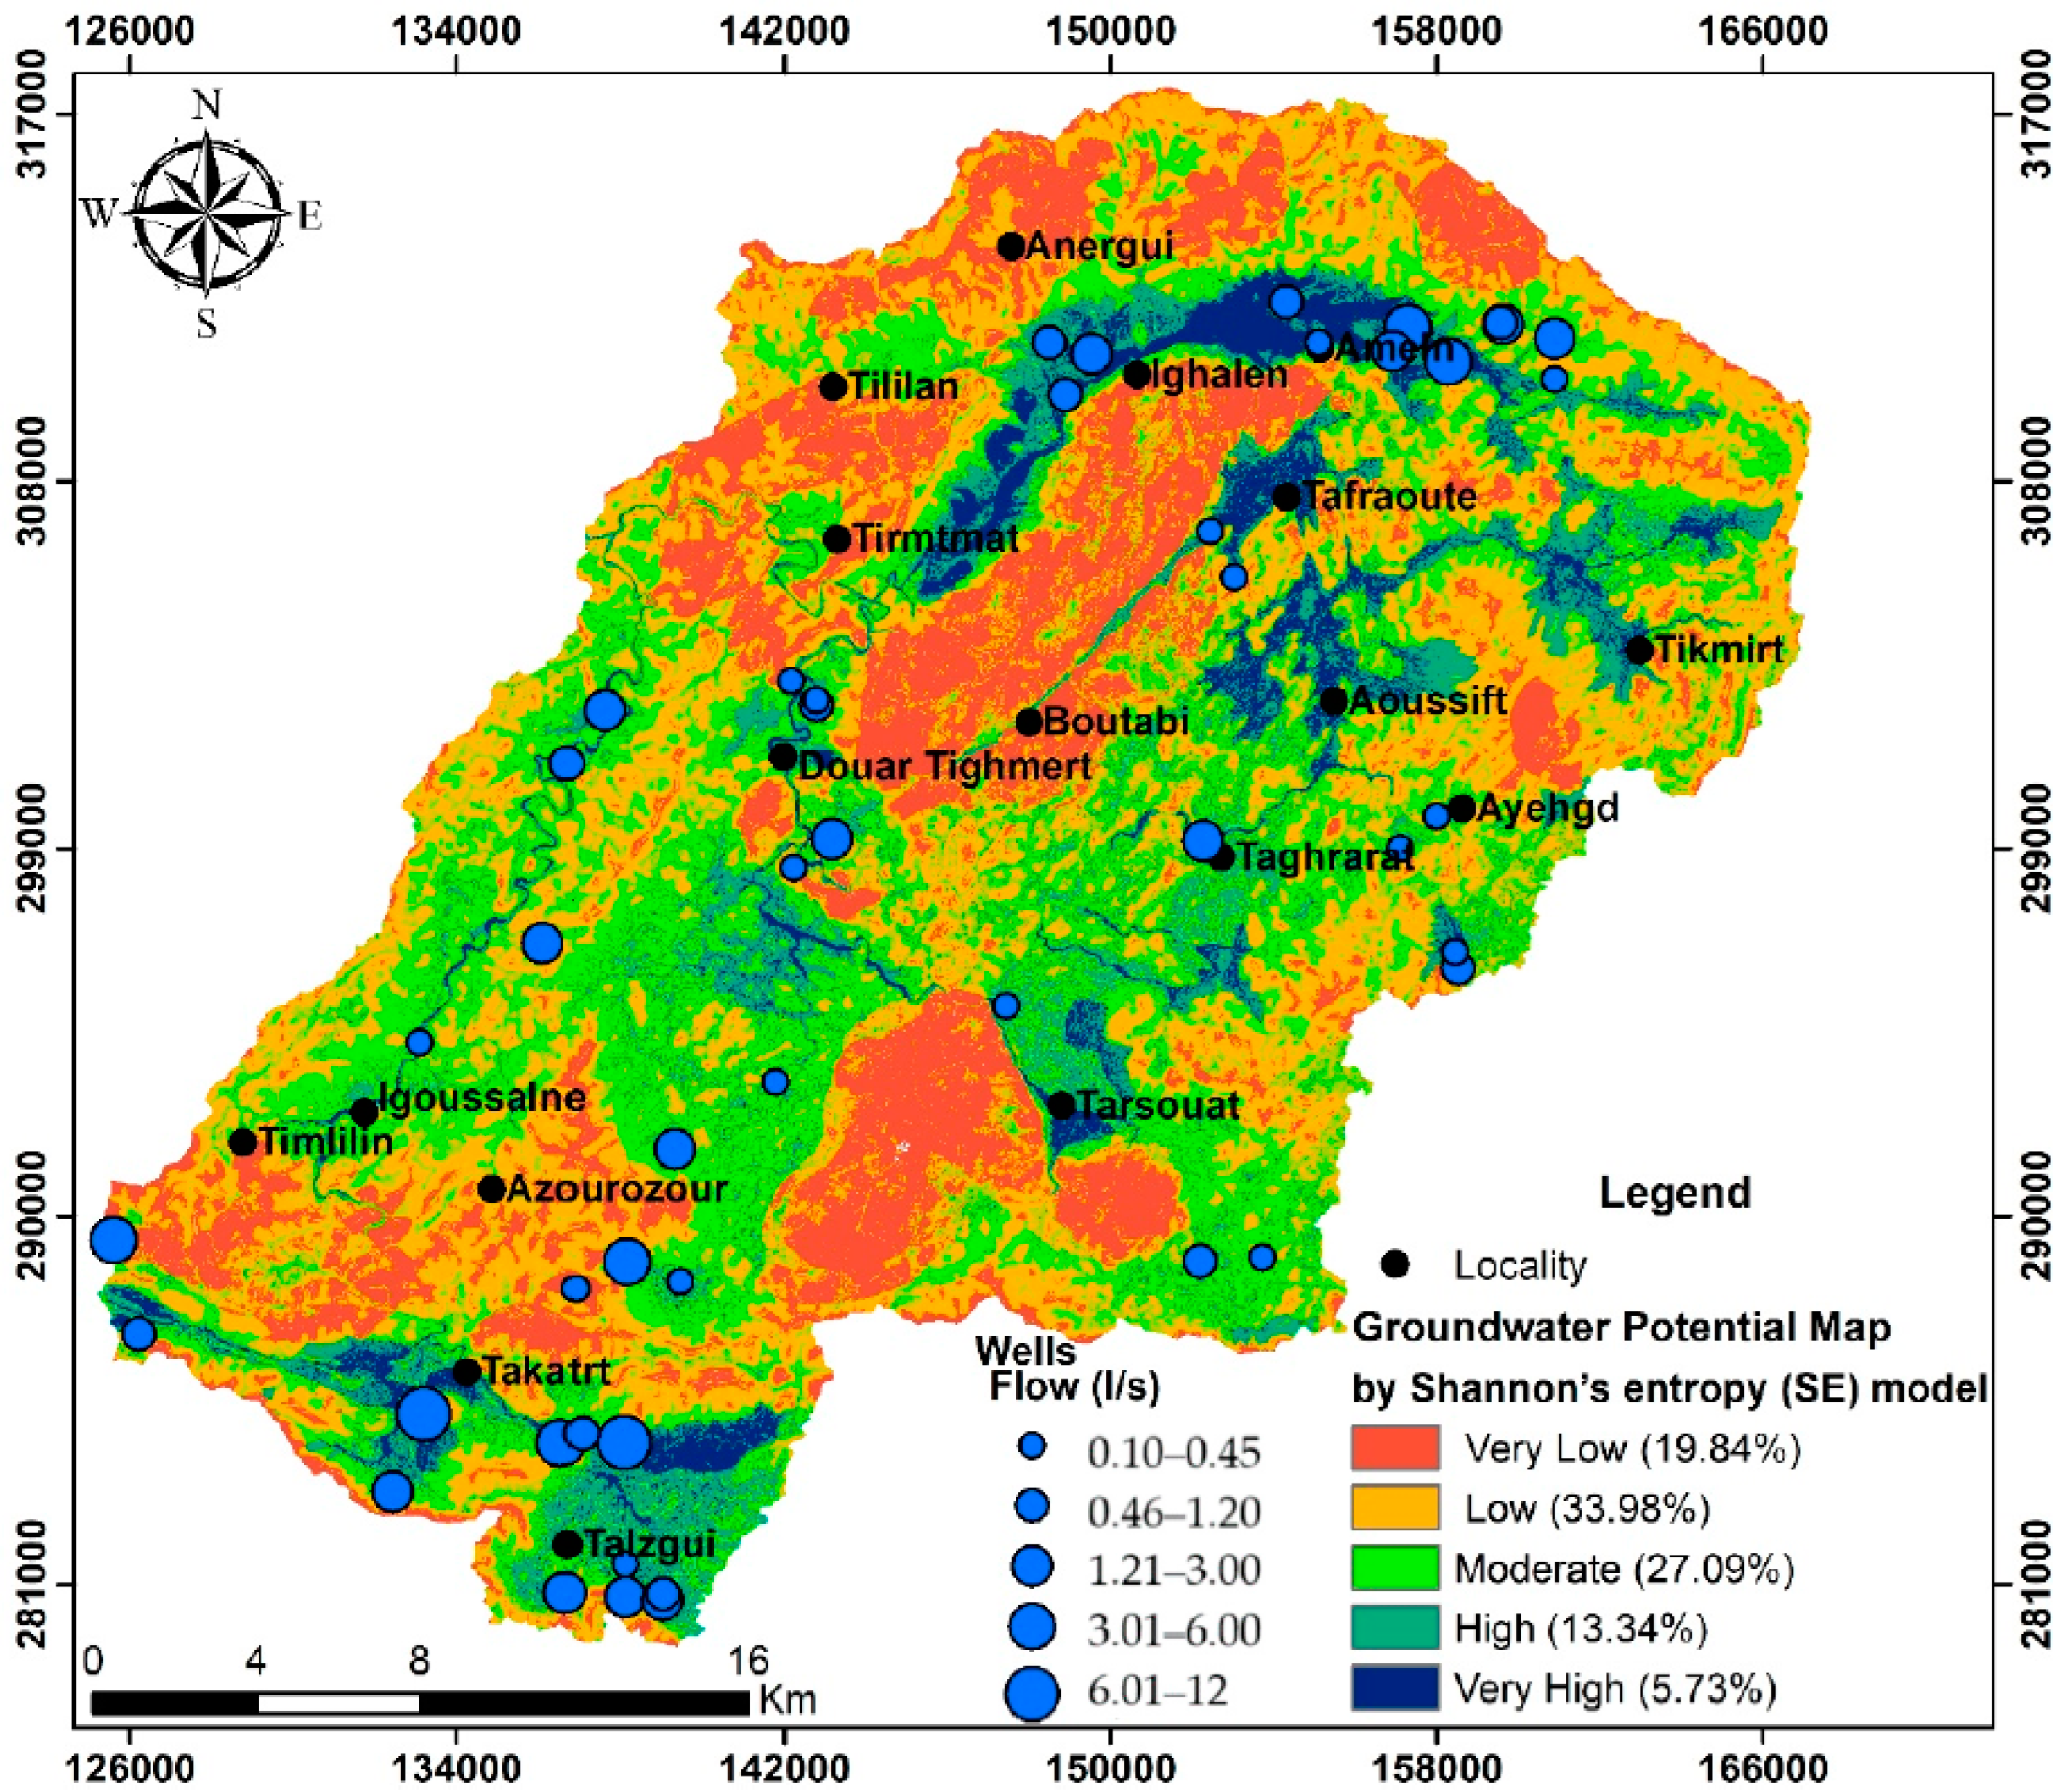
3.3.2. Shannon’s Entropy Model
4. Results and Discussion
4.1. Conditioning Factors
4.2. Frequency Ratio and Shannon Entropy Result
4.3. Validation of Groundwater Potential Map
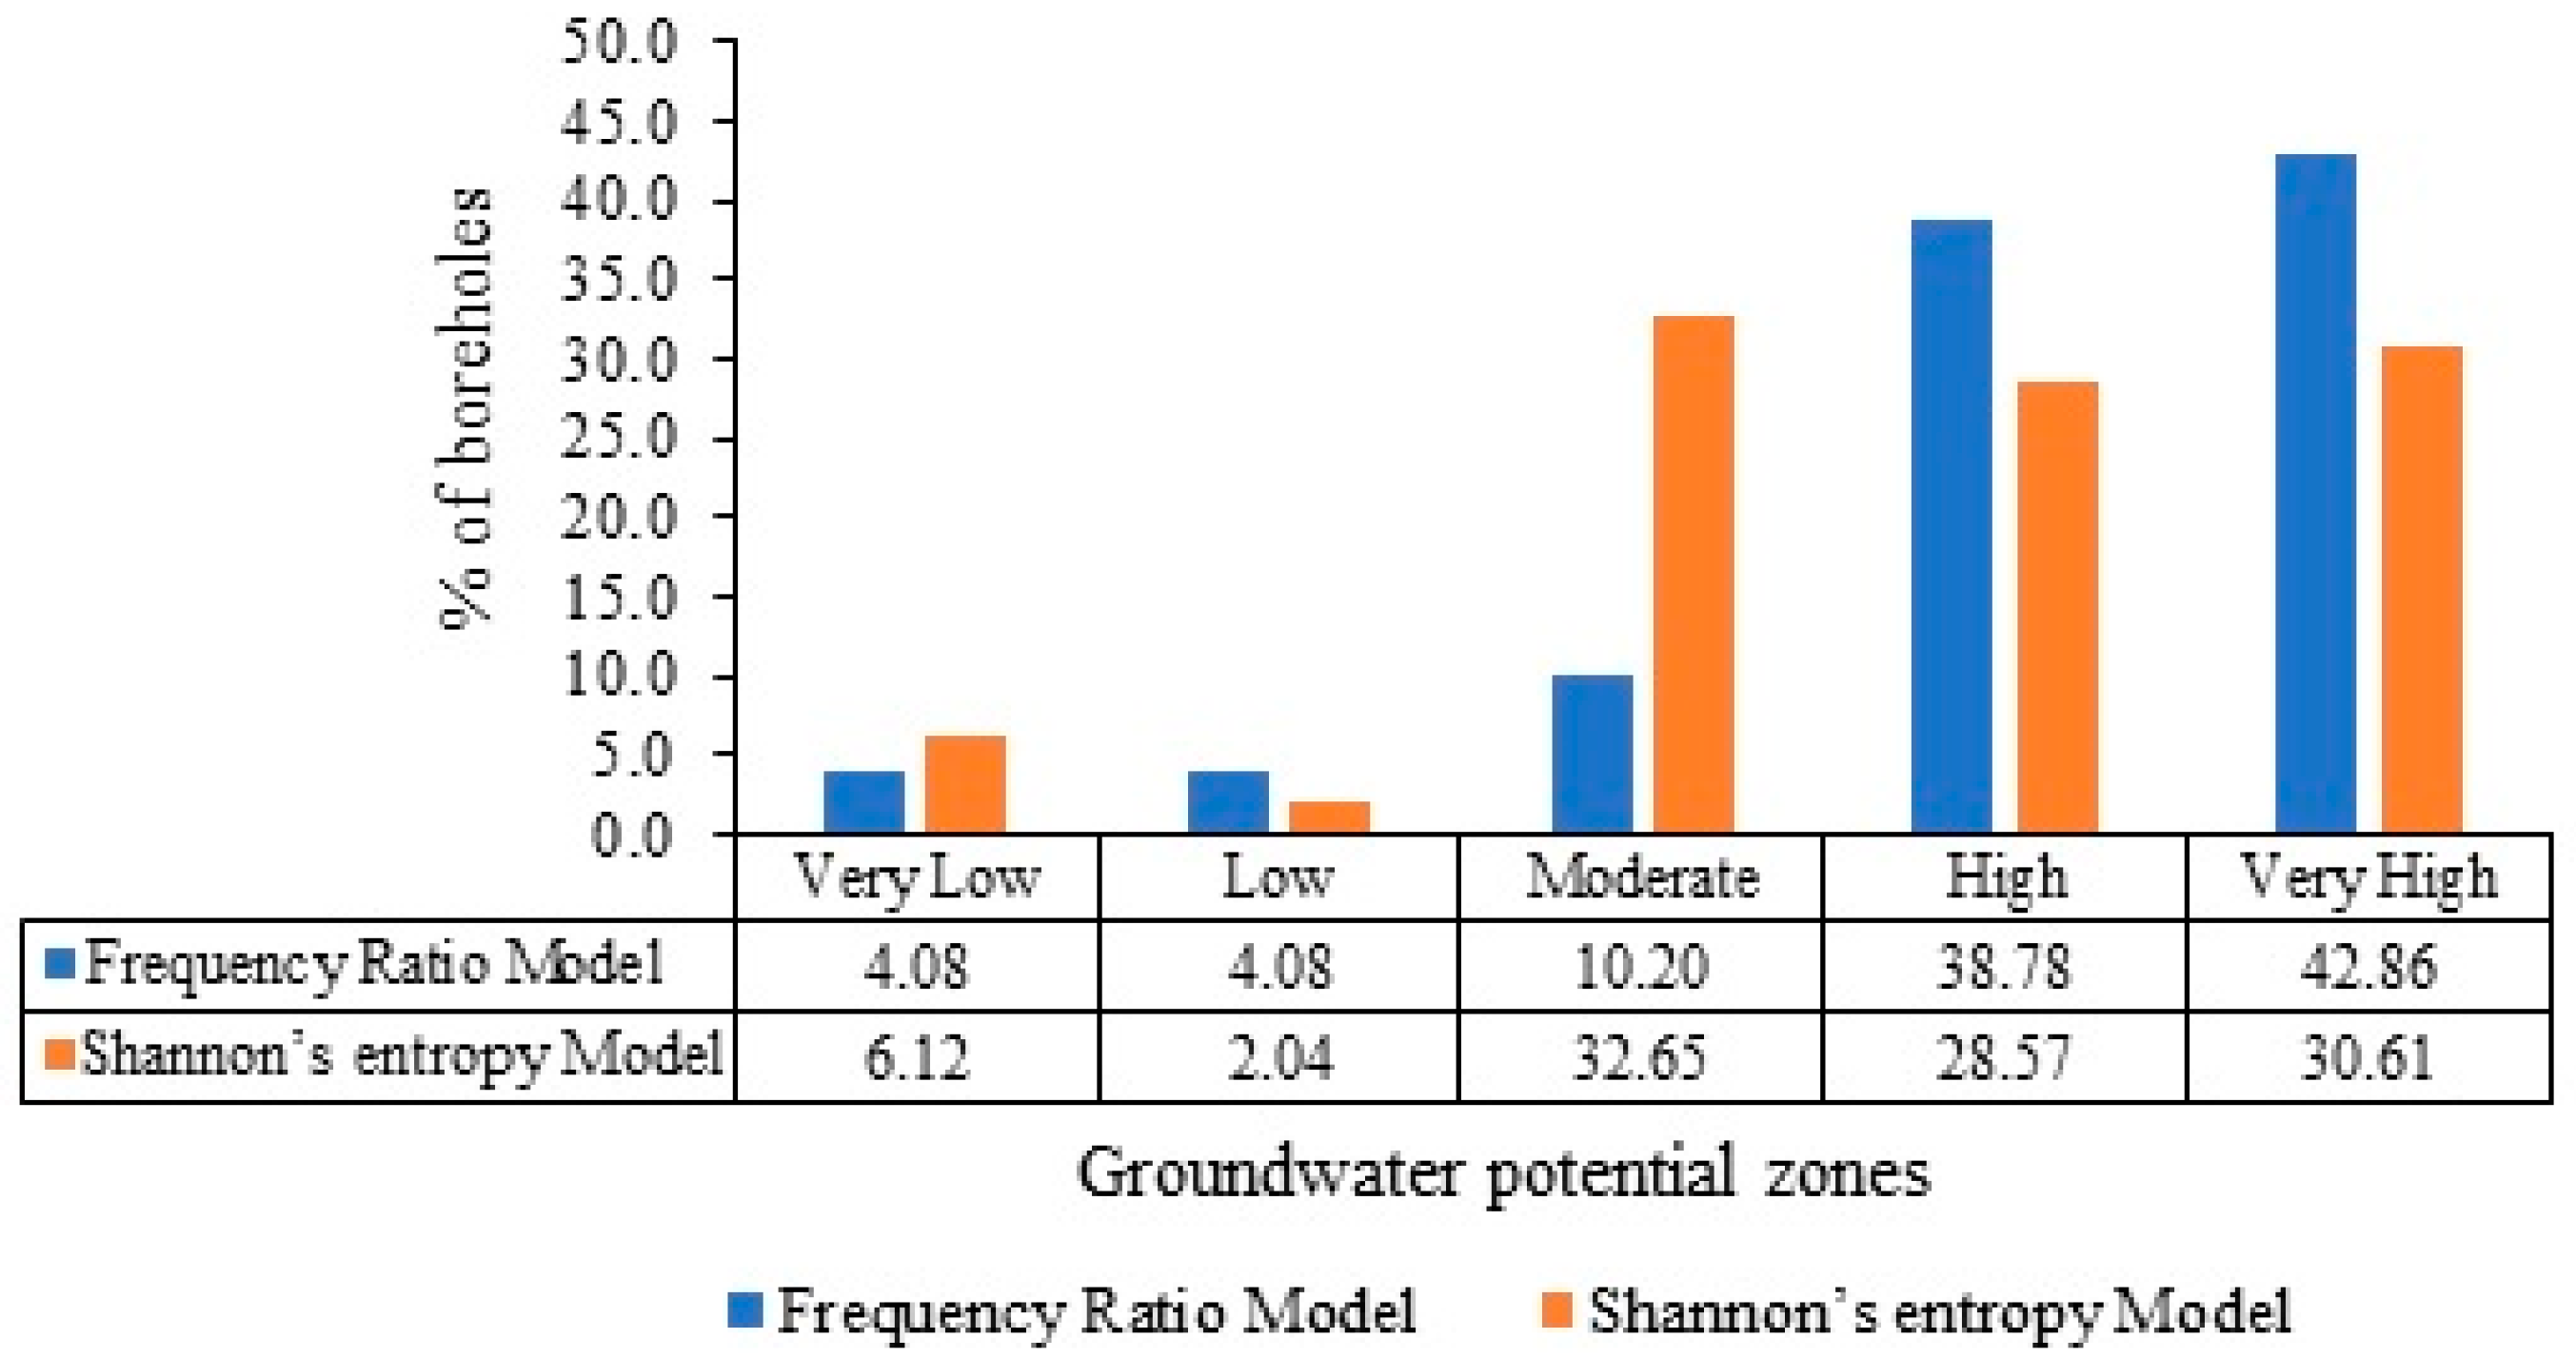
4.3.1. Validation Using Wells Data
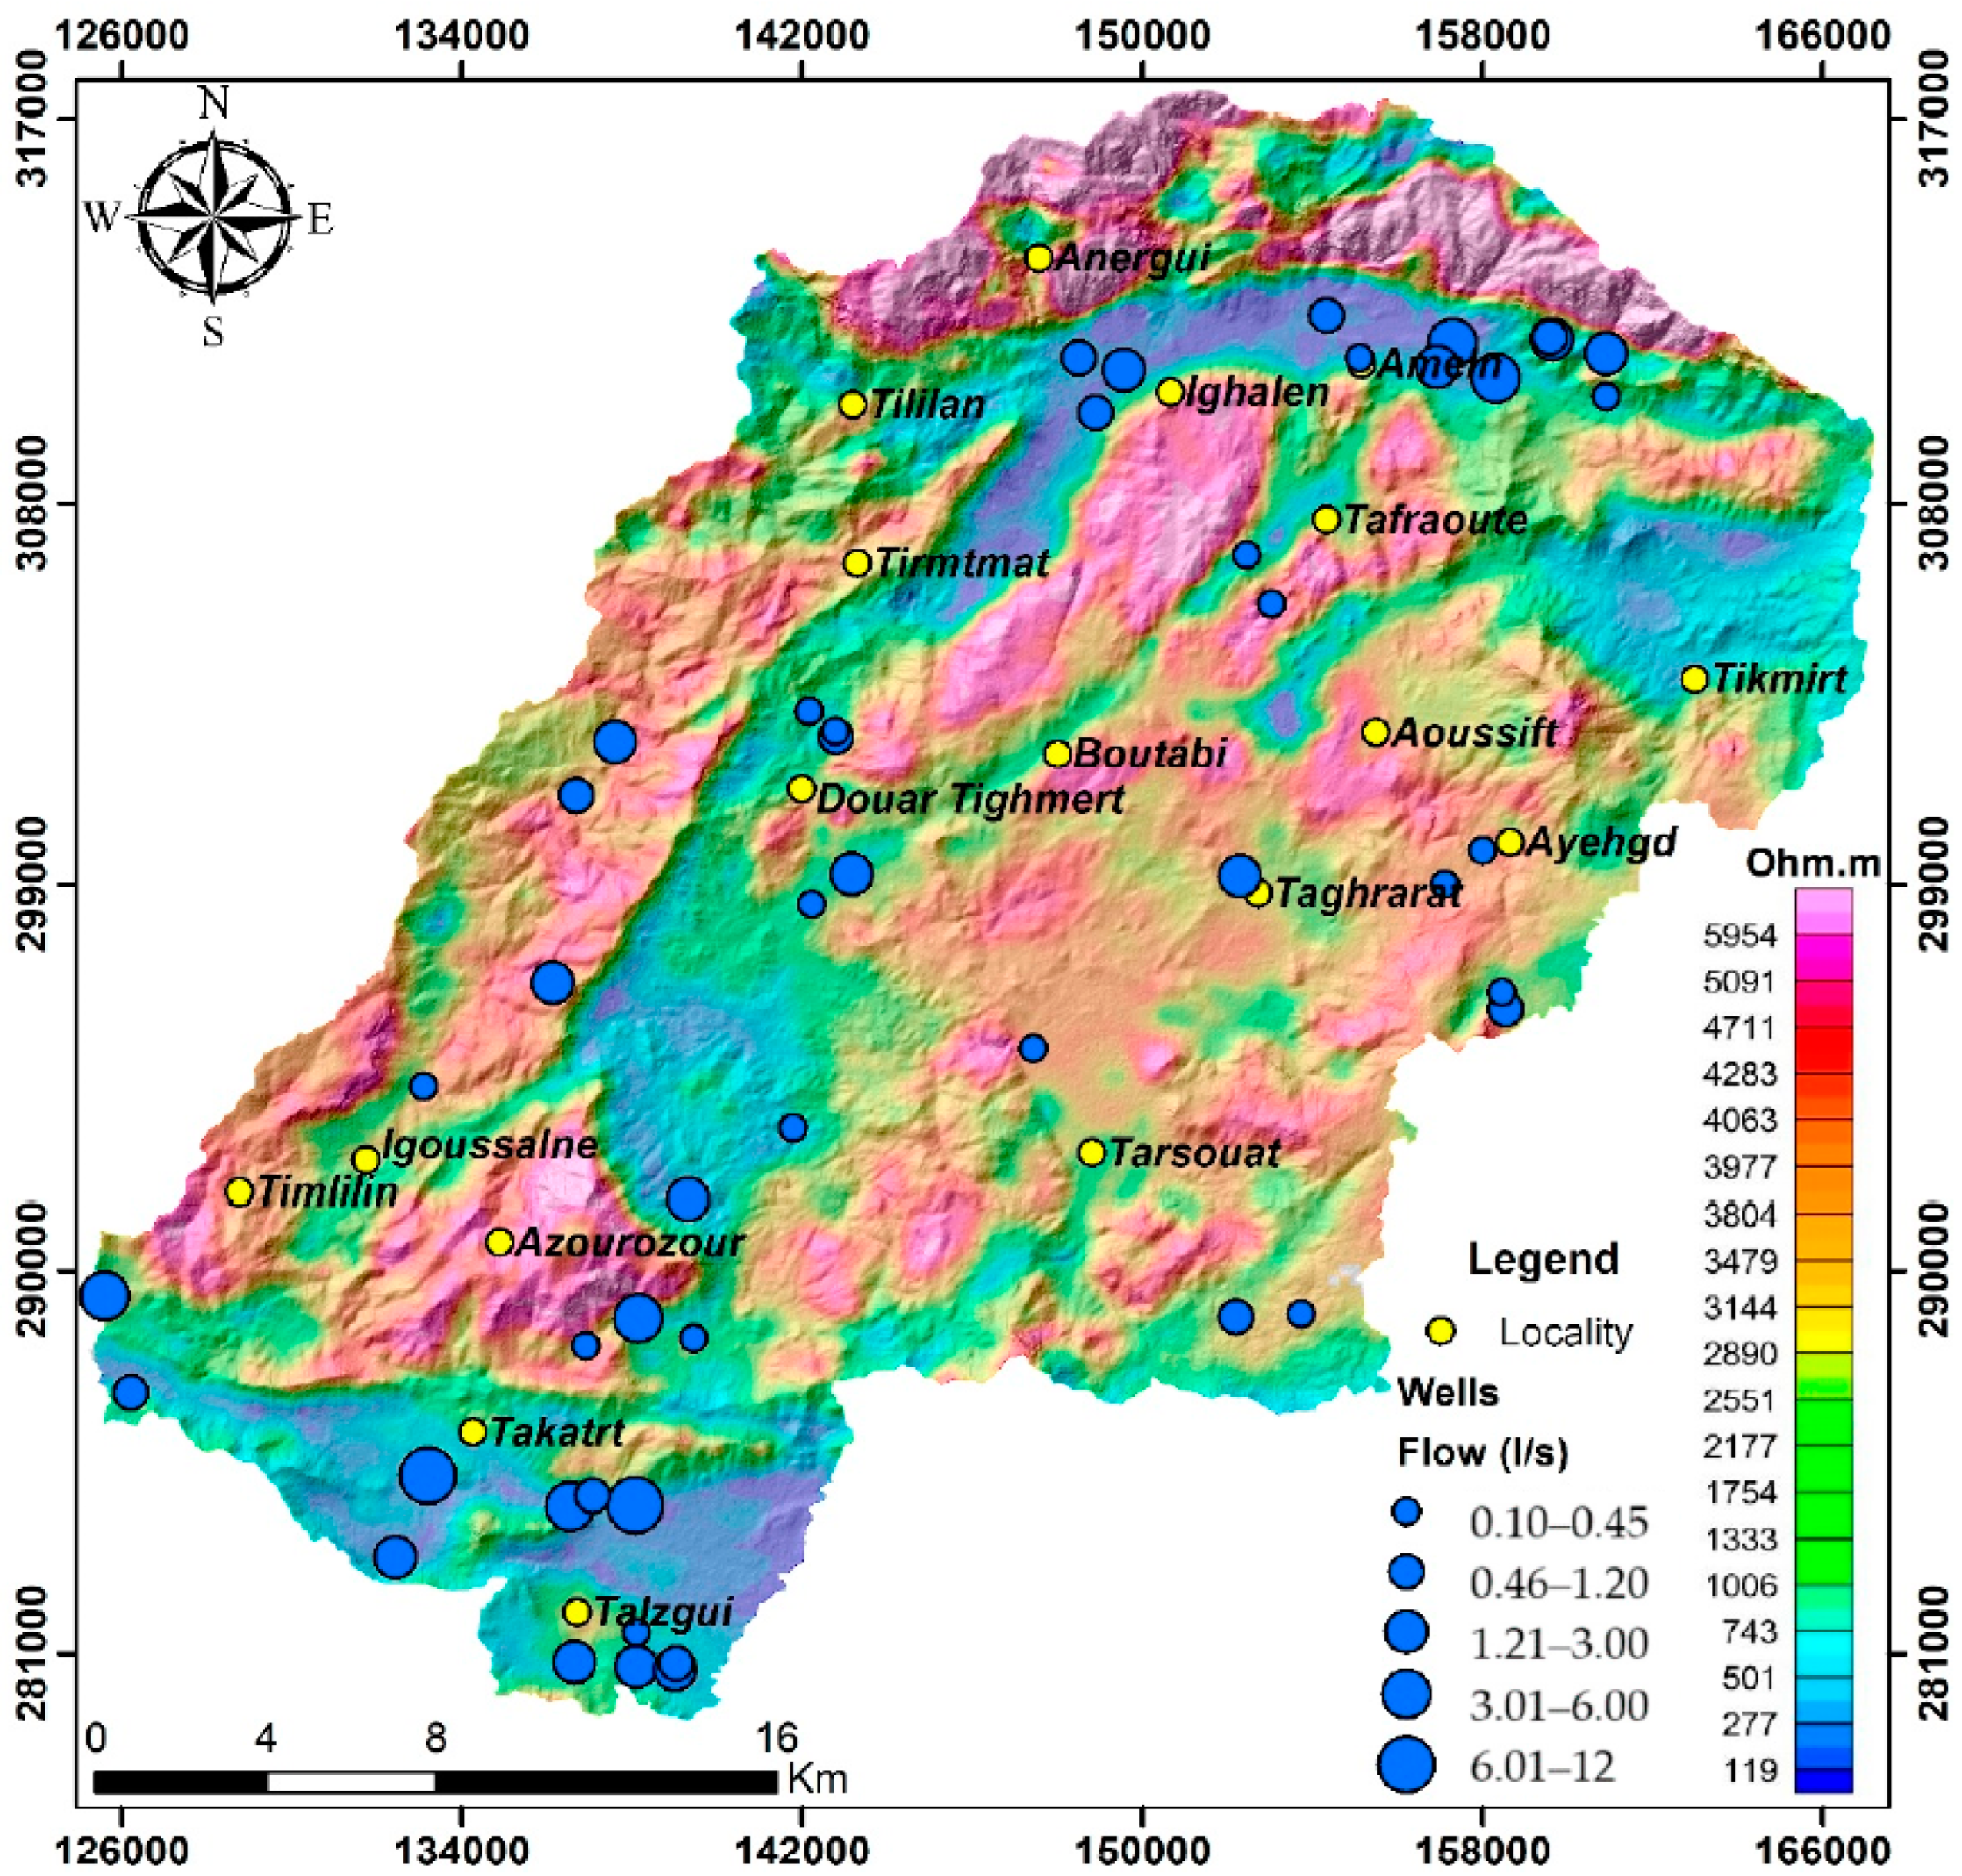
4.3.2. Validation Using Apparent Resistivity Data
5. Conclusions
Author Contributions
Funding
Institutional Review Board Statement
Informed Consent Statement
Data Availability Statement
Conflicts of Interest
References
- Bouchaou, L.; Tagma, T.; Boutaleb, S.; Hssaisoune, M.; El Morjani, Z.E.A. Climate change and its impacts on groundwater resources in Morocco: The case of the Souss-Massa Basin. In Climate Change Effects on Groundwater Resources. A Global Synthesis of Findings and Recommendations; Treidel, H., Martin-Bordes, J.L., Gurdak, J.J., Eds.; UNESCO, International Hydrological Programme: Paris, France, 2011; pp. 129–143. [Google Scholar]
- Seif-Ennasr, M.; Zaaboul, R.; Hirich, A.; Caroletti, G.N.; Bouchaou, L.; Morjani, Z.E.A.E.; Beraaouz, E.H.; McDonnell, R.A.; Choukr-Allah, R. Climate change and adaptive water management measures in Chtouka Aït Baha region (Morocco). Sci. Total Environ. 2016, 573, 862–875. [Google Scholar] [CrossRef] [PubMed]
- Bouchaou, L.; Hirich, A.; Choukr-Allah, R.; Bouaakaz, B.; Malki, M.; Abahous, H.; Nrhira, A. Climate change and water valuation in Souss-Massa region: Management and adaptive measures. In Proceedings of the 10thWorld Congress of EWRA on Water Resources and Environment, Athens, Greece, 5–9 July 2017; Rhei, P., Tsakiris, G., Tsihrintzis, V.A., Vangelis, H., Tigkas, D., Eds.; EWRA: Catania, Italy, 2017; pp. 835–843. [Google Scholar]
- Seif–Ennasr, M.; Hirich, A.; El Morjani, Z.E.A.; Choukr-Allah, R.; Zaaboul, R.; Nrhira, A.; Malki, M.; Bouchaou, L.; Beraaouz, E.H. Assessment of Global Change Impacts on Groundwater Resources in Souss-Massa Basin. In Water Resources in Arid Areas: The Way Forward; Abdalla, O., Kacimov, A., Chen, M., Al–Maktoumi, A., Al-Hosni, T., Clark, I., Eds.; Springer: Berlin/Heidelberg, Germany, 2017; pp. 115–140. [Google Scholar]
- Kadi, M.A.; Ziyad, A. Integrated Water Resources Management in Morocco. In Global Water Security; World Water Council, Ed.; Springer: Singapore, 2018; pp. 143–163. [Google Scholar]
- Benjmel, K.; Amraoui, F.; Boutaleb, S.; Ouchchen, M.; Tahiri, A.; Touab, A. Mapping of Groundwater Potential Zones in Crystalline Terrain Using Remote Sensing, GIS Techniques, and Multicriteria Data Analysis (Case of the Ighrem Region, Western Anti-Atlas, Morocco). Water 2020, 12, 471. [Google Scholar] [CrossRef] [Green Version]
- Hssaisoune, M.; Bouchaou, L.; Sifeddine, A.; Bouimetarhan, I.; Chehbouni, A. Moroccan Groundwater Resources and Evolution with Global Climate Changes. Geosciences 2020, 10, 81. [Google Scholar] [CrossRef] [Green Version]
- Yousif, M. A new theory to enhance the groundwater-related decisions based on deciphering the palaeohydrologic regime under climate change in the Sahara. Model. Earth Syst. Environ. 2021, 1–11. [Google Scholar] [CrossRef]
- Salama, D.S.; Yousif, M.; Gedamy, Y.; Ahmed, H.M.; Ali, M.E.; Shoukry, E.M. Satellite observations for monitoring atmospheric NO2 in correlation with the existing pollution sources under arid environment. Model. Earth Syst. Environ. 2022, 1–19. [Google Scholar] [CrossRef]
- Hsissou, Y.; Mudry, J.; Bouchaou, L.; Chauve, P.; Mania, J. Use of chemical tracy to study acquisition modality of mineralization and behaviour of unconfined groundwater under semi-arid climate: The case study of the Souss plain (Morocco). Environ. Geol. 2002, 42, 672–680. [Google Scholar]
- Ahkouk, S.; Hsissou, Y.; Bouchaou, L.; Krimissa, M.; Mania, J. Impact des fertilisants agricoles et du mode d’irrigation sur la qualité des eaux souterraines (cas de la nappe libre des Chtouka, bassin du Souss–Massa, Maroc). Afr. Geosci. Rev. 2003, 10, 355–364. [Google Scholar]
- Bouchaou, L.; Michelot, J.; Vengosh, A.; Hsissou, Y.; Qurtobi, M.; Gaye, C.; Bullen, T.; Zuppi, G. Application of multiple isotopic and geochemical tracers for investigation of recharge, salinization, and residence time of water in the Souss–Massa aquifer, southwest of Morocco. J. Hydrol. 2008, 352, 267–287. [Google Scholar] [CrossRef]
- Tagma, T.; Hsissou, Y.; Bouchaou, L.; Bouragba, L.; Boutaleb, S. Groundwater nitrate pollution in Souss-Massa Basin (south–west Morocco). Afr. J. Environ. Sci. Technol. 2009, 3, 301–309. [Google Scholar]
- Danni, S.O.; Bouchaou, L.; Elmouden, A.; N’Da, B.; Brahim, Y.A.; Malki, M. Isotopic and Chemical Tracers for the Sustainable Management of Water Resources in Semi-arid Area: Case of Massa Catchment, Morocco. In Groundwater and Global Change in the Western Mediterranean Area; Calvache, M., Duque, C., Pulido-Velazquez, D., Eds.; Springer: Cham, Germany, 2018; pp. 261–268. [Google Scholar]
- Shekhar, S.; Pandey, A.C. Delineation of groundwater potential zone in hard rock terrain of India using remote sensing, geographical information system (GIS) and analytic hierarchy process (AHP) techniques. Geocarto Int. 2014, 30, 402–421. [Google Scholar] [CrossRef]
- Ghosh, D.; Mandal, M.; Banerjee, M.; Karmakar, M. Impact of hydro-geological environment on availability of groundwater using analytical hierarchy process (AHP) and geospatial techniques: A study from the upper Kangsabati river basin. Groundw. Sustain. Dev. 2020, 11, 100419. [Google Scholar] [CrossRef]
- Mukherjee, I.; Singh, U. Delineation of groundwater potential zones in a drought-prone semi-arid region of east India using GIS and analytical hierarchical process techniques. CATENA 2020, 194, 104681. [Google Scholar] [CrossRef]
- Le Page, M.; Berjamy, B.; Fakir, Y.; Bourgin, F.; Jarlan, L.; Abourida, A.; Benrhanem, M.; Jacob, G.; Huber, M.; Sghrer, F.; et al. An Integrated DSS for Groundwater Management Based on Remote Sensing. The Case of a Semi-arid Aquifer in Morocco. Water Resour. Manag. 2012, 26, 3209–3230. [Google Scholar] [CrossRef] [Green Version]
- Goitsemang, T.; Das, D.M.; Raul, S.K.; Subudhi, C.R.; Panigrahi, B. Assessment of Groundwater Potential in the Kalahandi District of Odisha (India) Using Remote Sensing, Geographic Information System and Analytical Hierarchy Process. J. Indian Soc. Remote Sens. 2020, 48, 1739–1753. [Google Scholar] [CrossRef]
- Allafta, H.; Opp, C.; Patra, S. Identification of Groundwater Potential Zones Using Remote Sensing and GIS Techniques: A Case Study of the Shatt Al-Arab Basin. Remote Sens. 2020, 13, 112. [Google Scholar] [CrossRef]
- Achu, A.L.; Thomas, J.; Reghunath, R. Multi-criteria decision analysis for delineation of groundwater potential zones in a tropical river basin using remote sensing, GIS and analytical hierarchy process (AHP). Groundw. Sustain. Dev. 2020, 10, 100365. [Google Scholar] [CrossRef]
- Qadir, J.; Bhat, M.S.; Alam, A.; Rashid, I. Mapping groundwater potential zones using remote sensing and GIS approach in Jammu Himalaya, Jammu and Kashmir. GeoJournal 2019, 85, 487–504. [Google Scholar] [CrossRef]
- Shao, Z.; Huq, E.; Cai, B.; Altan, O.; Li, Y. Integrated remote sensing and GIS approach using Fuzzy-AHP to delineate and identify groundwater potential zones in semi-arid Shanxi Province, China. Environ. Model. Softw. 2020, 134, 104868. [Google Scholar] [CrossRef]
- Todd, D.K.; Mays, L.W. Groundwater Hydrology, 3rd ed.; Wiley: Hoboken, NJ, USA, 2004. [Google Scholar]
- Jha, M.K.; Chowdary, V.M.; Chowdhury, A. Groundwater assessment in Salboni Block, West Bengal (India) using remote sensing, geographical information system and multi-criteria decision analysis techniques. Hydrogeol. J. 2010, 18, 1713–1728. [Google Scholar] [CrossRef]
- Goodchild, M.F. Geographic information systems. In Encyclopedia of Theoretical Ecology; University of California Press: Oakland, CA, USA, 2012; pp. 341–345. [Google Scholar]
- Machiwal, D.; Jha, M.K.; Mal, B.C. Assessment of Groundwater Potential in a Semi-Arid Region of India Using Remote Sensing, GIS and MCDM Techniques. Water Resour. Manag. 2010, 25, 1359–1386. [Google Scholar] [CrossRef]
- Das, N.; Mukhopadhyay, S. Application of multi-criteria decision making technique for the assessment of groundwater potential zones: A study on Birbhum district, West Bengal, India. Environ. Dev. Sustain. 2018, 22, 931–955. [Google Scholar] [CrossRef]
- Lee, S.; Hyun, Y.; Lee, M.-J. Groundwater Potential Mapping Using Data Mining Models of Big Data Analysis in Goyang-si, South Korea. Sustainability 2019, 11, 1678. [Google Scholar] [CrossRef] [Green Version]
- Aouragh, M.H.; Essahlaoui, A.; El Ouali, A.; El Hmaidi, A.; Kamel, S. Groundwater potential of Middle Atlas plateaus, Morocco, using fuzzy logic approach, GIS and remote sensing. Geomat. Nat. Hazards Risk 2016, 8, 194–206. [Google Scholar] [CrossRef] [Green Version]
- Kazakis, N. Delineation of Suitable Zones for the Application of Managed Aquifer Recharge (MAR) in Coastal Aquifers Using Quantitative Parameters and the Analytical Hierarchy Process. Water 2018, 10, 804. [Google Scholar] [CrossRef] [Green Version]
- Nouayti, A.; Khattach, D.; Hilali, M.; Nouayti, N. Mapping potential areas for groundwater storage in the High Guir Basin (Morocco): Contribution of remote sensing and geographic information system. J. Groundw. Sci. Eng. 2019, 7, 309–322. [Google Scholar]
- Agarwal, E.; Agarwal, R.; Garg, R.D.; Garg, P.K. Delineation of groundwater potential zone: An AHP/ANP approach. J. Earth Syst. Sci. 2013, 122, 887–898. [Google Scholar] [CrossRef] [Green Version]
- Siddi Raju, R.; Sudarsana Raju, G.; Ravikumar, M.; Raghubabu, K. Applications of remote sensing and GIS, for identification of groundwater prospecting zones in and Aroud Nandalur, YSR District. IJEP 2016, 36, 293–304. [Google Scholar]
- Das, S.; Gupta, A.; Ghosh, S. Exploring groundwater potential zones using MIF technique in semi-arid region: A case study of Hingoli district, Maharashtra. Spat. Inf. Res. 2017, 25, 749–756. [Google Scholar] [CrossRef]
- Naghibi, S.A.; Pourghasemi, H.R.; Dixon, B. GIS-based groundwater spring potential using boosted regression tree, classification and regression tree, and random forest machine learning models in Iran. Environ. Monit. Assess. 2016, 188, 44. [Google Scholar] [CrossRef]
- Maskooni, E.K.; Naghibi, S.; Hashemi, H.; Berndtsson, R. Application of Advanced Machine Learning Algorithms to Assess Groundwater Potential Using Remote Sensing-Derived Data. Remote Sens. 2020, 12, 2742. [Google Scholar] [CrossRef]
- Chaudhari, R.V.; Dhanesh, L.; Sayantan, D.; Bhavna, U.; Saheb, H. Weighted overlay analysis for delineation of groundwater potential zone: A case study of pirangut river basin. Int. J. Remote Sens. Geosci. 2018, 7, 2319–3484. [Google Scholar]
- Ozdemir, A. Using a binary logistic regression method and GIS for evaluating and mapping the groundwater spring potential in the Sultan Mountains (Aksehir, Turkey). J. Hydrol. 2011, 405, 123–136. [Google Scholar] [CrossRef]
- Razavi-Termeh, S.V.; Sadeghi-Niaraki, A.; Choi, S.-M. Groundwater Potential Mapping Using an Integrated Ensemble of Three Bivariate Statistical Models with Random Forest and Logistic Model Tree Models. Water 2019, 11, 1596. [Google Scholar] [CrossRef] [Green Version]
- Naghibi, S.A.; Pourghasemi, H.R.; Pourtaghi, Z.S.; Rezaei, A. Groundwater qanat potential mapping using frequency ratio and Shannon’s entropy models in the Moghan watershed, Iran. Earth Sci. Inform. 2014, 8, 171–186. [Google Scholar] [CrossRef]
- Elvis, B.W.W.; Arsène, M.; Théophile, N.M.; Bruno, K.M.E.; Olivier, O.A. Integration of shannon entropy (SE), frequency ratio (FR) and analytical hierarchy process (AHP) in GIS for suitable groundwater potential zones targeting in the Yoyo river basin, Méiganga area, Adamawa Cameroon. J. Hydrol. Reg. Stud. 2022, 39, 100997. [Google Scholar] [CrossRef]
- Bednarik, M.; Magulová, B.; Matys, M.; Marschalko, M. Landslide susceptibility assessment of the Kralovany–Liptovský Mikuláš railway case study. Phys. Chem. Earth 2010, 35, 162–171. [Google Scholar] [CrossRef]
- Al-Abadi, A.M.; Al-Temmeme, A.A.; Al-Ghanimy, M.A. A GIS-based combining of frequency ratio and index of entropy approaches for mapping groundwater availability zones at Badra–Al Al-Gharbi–Teeb areas, Iraq. Sustain. Water Resour. Manag. 2016, 2, 265–283. [Google Scholar] [CrossRef] [Green Version]
- Najine, A.; Jaffal, M.; El Khammari, K.; Aifa, T.; Kattach, D.; Himi, M.; Casas, A.; Badrane, S.; Aqil, H. Contribution de la gravimétrie à l’étude de la structure du bassin de Tadla (Maroc): Implications hydrogéologiques. Comptes Rendus Geosci. 2006, 338, 676–682. [Google Scholar] [CrossRef]
- Bouchaou, L.; Boutaleb, S.; Boualoul, M.; Oudra, M. Application of remote-sensing and surface geophysics for groundwater prospecting in a hard rock terrain, Morocco. In Applied Groundwater Studies in Africa; Adelana, S.M.A., MacDonald, A.M., Eds.; IAH Book Series; CRC Press: Boca Raton, FL, USA; Balkema: Leiden, The Netherlands, 2008; pp. 215–227. [Google Scholar]
- Rochdane, S.; El Mandour, A.; Jaffal, M.; Himi, M.; Casas, A.; Amrhar, M.; Karroum, M. Géométrie de l’aquifère du Haouz oriental et Tassaout amont, Maroc occidental: Approche géophysique et hydrogéologique. Hydrol. Sci. J. 2015, 60, 133–144. [Google Scholar] [CrossRef] [Green Version]
- Elmahdy, S.I.; Mohamed, M.M. Probabilistic frequency ratio model for groundwater potential mapping in Al Jaww plain, UAE. Arab. J. Geosci. 2014, 8, 2405–2416. [Google Scholar] [CrossRef]
- Moghaddam, D.D.; Rezaei, M.; Pourghasemi, H.R.; Pourtaghie, Z.S.; Pradhan, B. Groundwater spring potential mapping using bivariate statistical model and GIS in the Taleghan Watershed, Iran. Arab. J. Geosci. 2013, 8, 913–929. [Google Scholar] [CrossRef]
- Leblanc, M. Ophiolites précambriennes et gîtes arséniés de cobalt (Bou–Azzer, Maroc). Notes Mém. Serv Géol. Maroc. 1975, 280, 306p. [Google Scholar]
- Charlot, R. The Precambrian of the Anti-Atlas (Morocco): A geochronological synthesis. Precambrian Res. 1976, 3, 273–299. [Google Scholar] [CrossRef]
- Charlot, R. Caractérisation des Événements Éburnéens et Pan-Africains dans l’Anti-Atlas Marocain. Apport de la Méthode Géochronologique Rb/Sr. Ph.D. Thesis, Université de Rennes, Rennes, France, 1978. [Google Scholar]
- Hassenforder, B. La Tectonique Panafricaine et Varisque de l’Anti-Atlas dans le Massif du Kerdous (Maroc). Ph.D. Thesis, Université de Strasbourg, Strasbourg, France, 1987. [Google Scholar]
- Saquaque, A.; Admou, H.; Cisse, A.; Benyoussef, A.; Reuber, I. Les intrusions calco—Alcalines de la boutonnière de Bou-Azzer-El Graâra (Anti-Atlas): Marqueurs de la déformation panafricaine majeure dans un contexte de collision d’arc. CR Acad. Sci. 1989, 308, 1279–1283. [Google Scholar]
- Thomas, R.; Chevallier, L.; Gresse, P.; Harmer, R.; Eglington, B.; Armstrong, R.; de Beer, C.; Martini, J.; de Kock, G.; Macey, P.; et al. Precambrian evolution of the Sirwa Window, Anti-Atlas Orogen, Morocco. Precambrian Res. 2002, 118, 1–57. [Google Scholar] [CrossRef]
- Gasquet, D.; Chevremont, P.; Baudin, T.; Chalot–Prat, F.; Guerrot, C.; Cocherie, A.; Roger, J.; Hassenforder, B.; Cheilletz, A. Polycyclic magmatism in the Tagragra d’Akka and Kerdous-Tafeltast inliers (Western Anti-Atlas, Morocco). J. Afr. Earth Sci. 2004, 39, 267–275. [Google Scholar] [CrossRef]
- Thomas, R.; Fekkak, A.; Ennih, N.; Errami, E.; Loughlin, S.; Gresse, P.; Chevallier, L.; Liegeois, J.-P. A new lithostratigraphic framework for the Anti-Atlas Orogen, Morocco. J. Afr. Earth Sci. 2004, 39, 217–226. [Google Scholar] [CrossRef] [Green Version]
- Benziane, F. Lithostratigraphie et Évolution Géodynamique de l’Anti-Atlas (Maroc) du Paléoprotérozoïque au Néoprotérozoïque: Exemples de la Boutonnière de Tagragra de Tata et du Jbel Saghro. Ph.D. Thesis, Université de Savoie, Chambéry, France, 2007. [Google Scholar]
- Ennih, N.; Liegeois, J.-P. The boundaries of the West African craton, with special reference to the basement of the Moroccan metacratonic Anti-Atlas belt. Geol. Soc. Lond. Spéc. Publ. 2008, 297, 1–17. [Google Scholar] [CrossRef] [Green Version]
- Gasquet, D.; Ennih, N.; Liégeois, J.P.; Soulaimani, A.; Michard, A. The Pan–African belt. In Continental Evolution: The Geology of Morocco; Michard, A., Saddiqi, O., Chalouan, A., Frizon de Lamotte, D., Eds.; Springer: Berlin/Heidelberg, Germany, 2008; Volume 116, pp. 33–64. [Google Scholar]
- Soulaimani, A.; Ouanaimi, H.; Saddiqi, O.; Baidder, L.; Michard, A. The Anti-Atlas Pan-African Belt (Morocco): Overview and pending questions. Comptes Rendus Geosci. 2018, 350, 279–288. [Google Scholar] [CrossRef]
- Hassenforder, B. Evolution tectono-métamorphique du socle du Kerdous (Anti–Atlas occidental, Maroc) dans le cadre des orogenèses éburnéenne et pan-africaine. Sci. Géol. Bull. 1978, 31, 21–31. [Google Scholar] [CrossRef]
- Hassenforder, B. Les mylonites de la zone de faille ductile pan-africaine des Ameln (Kerdous, Anti-Atlas occidental, Maroc). Une analyse pétrostructurale de la déformation. Sci. Géol. Bull. 1985, 38, 215–226. [Google Scholar]
- Nachit, H.; Barbey, P.; Pons, J.; Burg, J.P. L’Eburnéen existe-t-il dans l’Anti-Atlas marocain? L’exemple du massif du Kerdous. CR Acad. Sci. 1996, 322, 677–683. [Google Scholar]
- Soulaimani, A.; Essaifi, A.; Youbi, N.; Hafid, A. Les marqueurs structuraux et magmatiques de l’extension crustale au Protérozoïque terminal-Cambrien basal autour du massif de Kerdous (Anti-Atlas occidental, Maroc). Comptes Rendus Geosci. 2004, 336, 1433–1441. [Google Scholar] [CrossRef]
- Barbey, P.; Nachit, H.; Pons, J. Magma-host interactions during differentiation and emplacement of a shallow–level, zoned granitic pluton (Tarçouate pluton, Morocco): Implications for magma emplacement. Lithos 2001, 58, 125–143. [Google Scholar] [CrossRef] [Green Version]
- Benssaou, M.; Hamoumi, N. The western Anti-Atlas of Morocco: Sedimentological and palæogeographical formation studies in the Early Cambrian. J. Afr. Earth Sci. 2001, 32, 351–372. [Google Scholar] [CrossRef]
- Razandi, Y.; Pourghasemi, H.R.; Neisani, N.S.; Rahmati, O. Application of analytical hierarchy process, frequency ratio, and certainty factor models for groundwater potential mapping using GIS. Earth Sci. Inform. 2015, 8, 867–883. [Google Scholar] [CrossRef]
- Mogaji, K.A.; Lim, H.S.; Abdullah, K. Regional prediction of groundwater potential mapping in a multifaceted geology terrain using GIS-based Dempster–Shafer model. Arab. J. Geosci. 2014, 8, 3235–3258. [Google Scholar] [CrossRef]
- Burrough, P.A.; McDonnell, R.A. Principle of Geographic Information Systems; Oxford University Press: Oxford, UK, 1998. [Google Scholar]
- Ercanoglu, M.; Gokceoglu, C. Assessment of landslide susceptibility for a landslide-prone area (north of Yenice, NW Turkey) by fuzzy approach. Env. Geol. 2002, 41, 720–730. [Google Scholar]
- Aniya, M. Landslide-susceptibility mapping in the Anahata river basin, Japan. Ann. Assoc. Am. Geogr. 1985, 75, 102–114. [Google Scholar] [CrossRef]
- Manap, M.A.; Nampak, H.; Pradhan, B.; Lee, S.; Sulaiman, W.N.A.; Ramli, M.F. Application of probabilistic-based frequency ratio model in groundwater potential mapping using remote sensing data and GIS. Arab. J. Geosci. 2012, 7, 711–724. [Google Scholar] [CrossRef]
- Moore, I.D.; Grayson, R.B.; Ladson, A.R. Digital terrain modelling: A review of hydrological, geomorphological, and biological applications. Hydrol. Process. 1991, 5, 3–30. [Google Scholar] [CrossRef]
- Wischmeier, W.H.; Smith, D.D. Predicting Rainfall Erosion Losses—A Guide to Conservation Planning; U.S. Department of Agriculture, Science and Education Administration: Hyattsville, MD, USA, 1978. [Google Scholar]
- Moore, I.D.; Burch, G.J. Sediment Transport Capacity of Sheet and Rill Flow: Application of Unit Stream Power Theory. Water Resour. Res. 1986, 22, 1350–1360. [Google Scholar] [CrossRef]
- De Reu, J.; Bourgeois, J.; Bats, M.; Zwertvaegher, A.; Gelorini, V.; De Smedt, P.; Chu, W.; Antrop, M.; De Maeyer, P.; Finke, P.; et al. Application of the topographic position index to heterogeneous landscapes. Geomorphology 2013, 186, 39–49. [Google Scholar] [CrossRef]
- Magesh, N.S.; Chandrasekar, N.; Soundranayagam, J.P. Delineation of groundwater potential zones in Theni district, Tamil Nadu, using remote sensing, GIS and MIF techniques. Geosci. Front. 2012, 3, 189–196. [Google Scholar] [CrossRef] [Green Version]
- Chowdhury, A.; Jha, M.K.; Chowdary, V.M. Delineation of groundwater recharge zones and identification of artificial recharge sites in West Medinipur district, West Bengal, using RS, GIS and MCDM techniques. Environ. Earth Sci. 2010, 59, 1209–1222. [Google Scholar] [CrossRef]
- Gannouni, S.; Gabtni, H. Structural Interpretation of Lineaments by Satellite Image Processing (Landsat TM) in the Region of Zahret Medien (Northern Tunisia). J. Geogr. Inf. Syst. 2015, 07, 119–127. [Google Scholar] [CrossRef] [Green Version]
- Mandal, U.; Sahoo, S.; Munusamy, S.B.; Dhar, A.; Panda, S.N.; Kar, A.; Mishra, P.K. Delineation of Groundwater Potential Zones of Coastal Groundwater Basin Using Multi-Criteria Decision Making Technique. Water Resour. Manag. 2016, 30, 4293–4310. [Google Scholar] [CrossRef]
- Chen, W.; Li, H.; Hou, E.; Wang, S.; Wang, G.; Panahi, M.; Li, T.; Peng, T.; Guo, C.; Niu, C.; et al. GIS-based groundwater potential analysis using novel ensemble weights-of-evidence with logistic regression and functional tree models. Sci. Total Environ. 2018, 634, 853–867. [Google Scholar] [CrossRef] [Green Version]
- Miraki, S.; Zanganeh, S.H.; Chapi, K.; Singh, V.P.; Shirzadi, A.; Shahabi, H.; Pham, B.T. Mapping Groundwater Potential Using a Novel Hybrid Intelligence Approach. Water Resour. Manag. 2018, 33, 281–302. [Google Scholar] [CrossRef]
- Bonham-Carter, G.F. Geographic Information Systems for Geoscientists: Modeling with GIS; Pergamon Press: Ottawa, ON, Canada, 1994. [Google Scholar]
- Jaafari, A.; Najafi, A.; Pourghasemi, H.R.; Rezaeian, J.; Sattarian, A. GIS-based frequency ratio and index of entropy models for landslide susceptibility assessment in the Caspian forest, northern Iran. Int. J. Environ. Sci. Technol. 2014, 11, 909–926. [Google Scholar] [CrossRef] [Green Version]
- Ihara, S. Information Theory for Continuous Systems; World Scientific Publishing Co. Pte. Ltd.: Singapore, 1993. [Google Scholar]
- Massey, D.S.; Nancy, A.D. The Dimensions of Residential. Soc. Forces 1988, 67, 281–315. [Google Scholar] [CrossRef]
- Yufeng, S.; Fengxiang, J. Landslide Stability Analysis Based on Generalized Information Entropy. In Proceedings of the International Conference on Environmental Science and Information Application Technology, Wuhan, China, 4–5 July 2009. [Google Scholar]
- Constantin, M.; Bednarik, M.; Jurchescu, M.C.; Vlaicu, M. Landslide susceptibility assessment using the bivariate statistical analysis and the index of entropy in the Sibiciu Basin (Romania). Environ. Earth Sci. 2010, 63, 397–406. [Google Scholar] [CrossRef]
- Kumar, P.K.D.; Gopinath, G.; Seralathan, P. Application of remote sensing and GIS for the demarcation of groundwater potential zones of a river basin in Kerala, southwest coast of India. Int. J. Remote Sens. 2007, 28, 5583–5601. [Google Scholar] [CrossRef]
- El Morjani, Z.E.A. Conception d’un Système D’information à Référence Spatiale Pour la Gestion Environnementale: Application à la Sélection de Sites Potentiels de Stockage de Déchets Ménagers et Industriels en Région Semi-Aride (Souss, Maroc). Ph.D Dissertation, University of Geneva, Geneva, Switzerland, 2002. [Google Scholar]
- Heiß, L.; Bouchaou, L.; Reichert, B. Origin and evolution of groundwater in the semi-arid Kerdous Inlier in the Western Anti-Atlas, Morocco. Grundwasser 2017, 23, 17–28. [Google Scholar] [CrossRef]


| Factor | Classes | Area (Pixels) | Area (%) | Borehole No. | Borehole % | Frequency Ratio (FR) | (Eij) | Hj | Hjmax | Ij | vj |
|---|---|---|---|---|---|---|---|---|---|---|---|
| Elevation | 0–800 | 24,809 | 0.44 | 0 | 0.00 | 0.00 | 0.00 | 2.05 | 3.00 | 0.32 | 0.24 |
| 800–1000 | 551,814 | 9.91 | 9 | 25.7 | 2.59 | 0.43 | |||||
| 1000–1200 | 1,686,375 | 30.3 | 9 | 25.7 | 0.85 | 0.14 | |||||
| 1200–1400 | 1,424,487 | 25.5 | 12 | 34.2 | 1.34 | 0.22 | |||||
| 1400–1600 | 923,051 | 16.5 | 2 | 5.71 | 0.34 | 0.06 | |||||
| 1600–1800 | 547,847 | 9.84 | 3 | 8.57 | 0.87 | 0.15 | |||||
| 1800–2000 | 246,537 | 4.43 | 0 | 0.00 | 0.00 | 0.00 | |||||
| >2000 | 160,006 | 2.87 | 0 | 0.00 | 0.00 | 0.00 | |||||
| Slope | 0–5 | 902,150 | 16.21 | 16 | 45.71 | 2.82 | 0.63 | 1.42 | 2.00 | 0.29 | 0.33 |
| 5–15 | 1,967,568 | 35.36 | 14 | 40.00 | 1.13 | 0.25 | |||||
| 15–30 | 2,056,617 | 36.96 | 4 | 11.42 | 0.31 | 0.07 | |||||
| >30 | 637,524 | 11.45 | 1 | 2.85 | 0.25 | 0.06 | |||||
| Curvature | Concave | 2,186,540 | 39.29 | 12 | 34.28 | 0.87 | 0.26 | 1.51 | 1.58 | 0.05 | 0.05 |
| Flat | 1,077,217 | 19.36 | 11 | 31.42 | 1.62 | 0.49 | |||||
| Convex | 2,300,102 | 41.34 | 12 | 34.28 | 0.83 | 0.25 | |||||
| Aspect | Flat | 128,012 | 2.30 | 4 | 11.42 | 4.97 | 0.43 | 2.49 | 3.32 | 0.25 | 0.29 |
| North | 855,154 | 15.37 | 7 | 20.00 | 1.30 | 0.11 | |||||
| North east | 579,523 | 10.41 | 4 | 11.42 | 1.10 | 0.10 | |||||
| East | 2211 | 0.04 | 0 | 0.00 | 0.00 | 0.00 | |||||
| Southeast | 759,533 | 13.65 | 6 | 17.14 | 1.26 | 0.11 | |||||
| South | 697,033 | 12.52 | 2 | 5.71 | 0.46 | 0.04 | |||||
| Southwest | 650,521 | 11.69 | 1 | 2.85 | 0.24 | 0.02 | |||||
| West | 713,182 | 12.81 | 4 | 11.42 | 0.89 | 0.08 | |||||
| Northwest | 854,813 | 15.36 | 7 | 20.00 | 1.30 | 0.11 | |||||
| North | 323,877 | 5.82 | 0 | 0.00 | 0.00 | 0.00 | |||||
| TWI | 0–8 | 4,923,307 | 88.47 | 25 | 71.42 | 0.81 | 0.14 | 1.45 | 1.58 | 0.09 | 0.17 |
| 8–12 | 511,907 | 9.19 | 8 | 22.85 | 2.48 | 0.43 | |||||
| >12 | 129,620 | 2.32 | 2 | 5.71 | 2.45 | 0.43 | |||||
| TPI | <(–0.01) | 2,492,810 | 44.92 | 15 | 42.85 | 0.95 | 0.27 | 1.51 | 1.58 | 0.05 | 0.06 |
| ((–0.01)–0.01) | 644,036 | 11.60 | 7 | 20.00 | 1.72 | 0.49 | |||||
| >0.01 | 2,411,692 | 43.46 | 22 | 37.14 | 0.85 | 0.24 | |||||
| LS | 0–5 | 5,444,001 | 97.82 | 34 | 97.14 | 0.99 | 0.11 | 1.00 | 2.00 | 0.75 | 1.64 |
| 5–10 | 70,759 | 1.27 | 0 | 0.00 | 0.00 | 0.00 | |||||
| 10–15 | 20,348 | 0.36 | 1 | 2.85 | 7.81 | 0.89 | |||||
| >15 | 29,755 | 0.53 | 0 | 0.00 | 0.00 | 0.00 | |||||
| Distance to Faults (m) | 0–250 | 2,344,136 | 42.123 | 10 | 28.57 | 0.68 | 0.08 | 2.73 | 3.46 | 0.21 | 0.16 |
| 250–500 | 1,229,085 | 22.086 | 10 | 28.57 | 1.29 | 0.15 | |||||
| 500–750 | 764,829 | 13.744 | 6 | 17.14 | 1.25 | 0.15 | |||||
| 750–1000 | 490,281 | 8.810 | 3 | 8.57 | 0.97 | 0.12 | |||||
| 1000–1250 | 325,721 | 5.853 | 4 | 11.42 | 1.95 | 0.23 | |||||
| 1250–1500 | 198,597 | 3.569 | 1 | 2.85 | 0.80 | 0.10 | |||||
| 1500–1750 | 110,508 | 1.986 | 1 | 2.85 | 1.44 | 0.17 | |||||
| 1750–2000 | 54,126 | 0.973 | 0 | 0.00 | 0.00 | 0.00 | |||||
| 2000–2250 | 26,105 | 0.469 | 0 | 0.00 | 0.00 | 0.00 | |||||
| 2250–2500 | 11,242 | 0.202 | 0 | 0.00 | 0.00 | 0.00 | |||||
| >2500 | 10,296 | 0.185 | 0 | 0.00 | 0.00 | 0.00 | |||||
| 0–1.5 | 4,170,521 | 74.94 | 33 | 94.28 | 1.26 | 0.81 | 0.70 | 2.00 | 0.65 | 0.25 | |
| Fault Density | 1.5–3 | 1,071,774 | 19.26 | 2 | 5.71 | 0.30 | 0.19 | ||||
| 3–4.5 | 203,089 | 3.65 | 0 | 0.00 | 0.00 | 0.00 | |||||
| >4.5 | 119,287 | 2.14 | 0 | 0.00 | 0.00 | 0.00 | |||||
| Lithology | Highly permeable | 517,977 | 9.31 | 11 | 31.42 | 3.38 | 0.69 | 1.14 | 1.58 | 0.28 | 0.45 |
| Moderately permeable | 2,629,577 | 47.25 | 18 | 51.42 | 1.09 | 0.22 | |||||
| Impermeable | 2,417,347 | 43.44 | 6 | 17.14 | 0.39 | 0.08 | |||||
| Drainage Density | 0–2 | 103,831 | 1.86 | 0 | 0.00 | 0.00 | 0.00 | 1.37 | 2.00 | 0.31 | 0.30 |
| 2–4 | 2,085,006 | 37.46 | 6 | 17.14 | 0.46 | 0.12 | |||||
| 4–6 | 3,300,306 | 59.30 | 28 | 80 | 1.35 | 0.35 | |||||
| >6 | 75,771 | 1.36 | 1 | 2.85 | 2.10 | 0.54 | |||||
| Distance to Rivers (m) | 0–100 | 3,616,703 | 64.99 | 29 | 82.85 | 1.27 | 0.68 | 0.91 | 2.58 | 0.65 | 0.20 |
| 100–200 | 1,569,527 | 28.20 | 6 | 17.14 | 0.61 | 0.32 | |||||
| 200–300 | 352,773 | 6.33 | 0 | 0.00 | 0.00 | 0.00 | |||||
| 300–400 | 25,291 | 0.45 | 0 | 0.00 | 0.00 | 0.00 | |||||
| 400–500 | 563 | 0.01 | 0 | 0.00 | 0.00 | 0.00 | |||||
| >500 | 69 | 0.001 | 0 | 0.00 | 0.00 | 0.00 | |||||
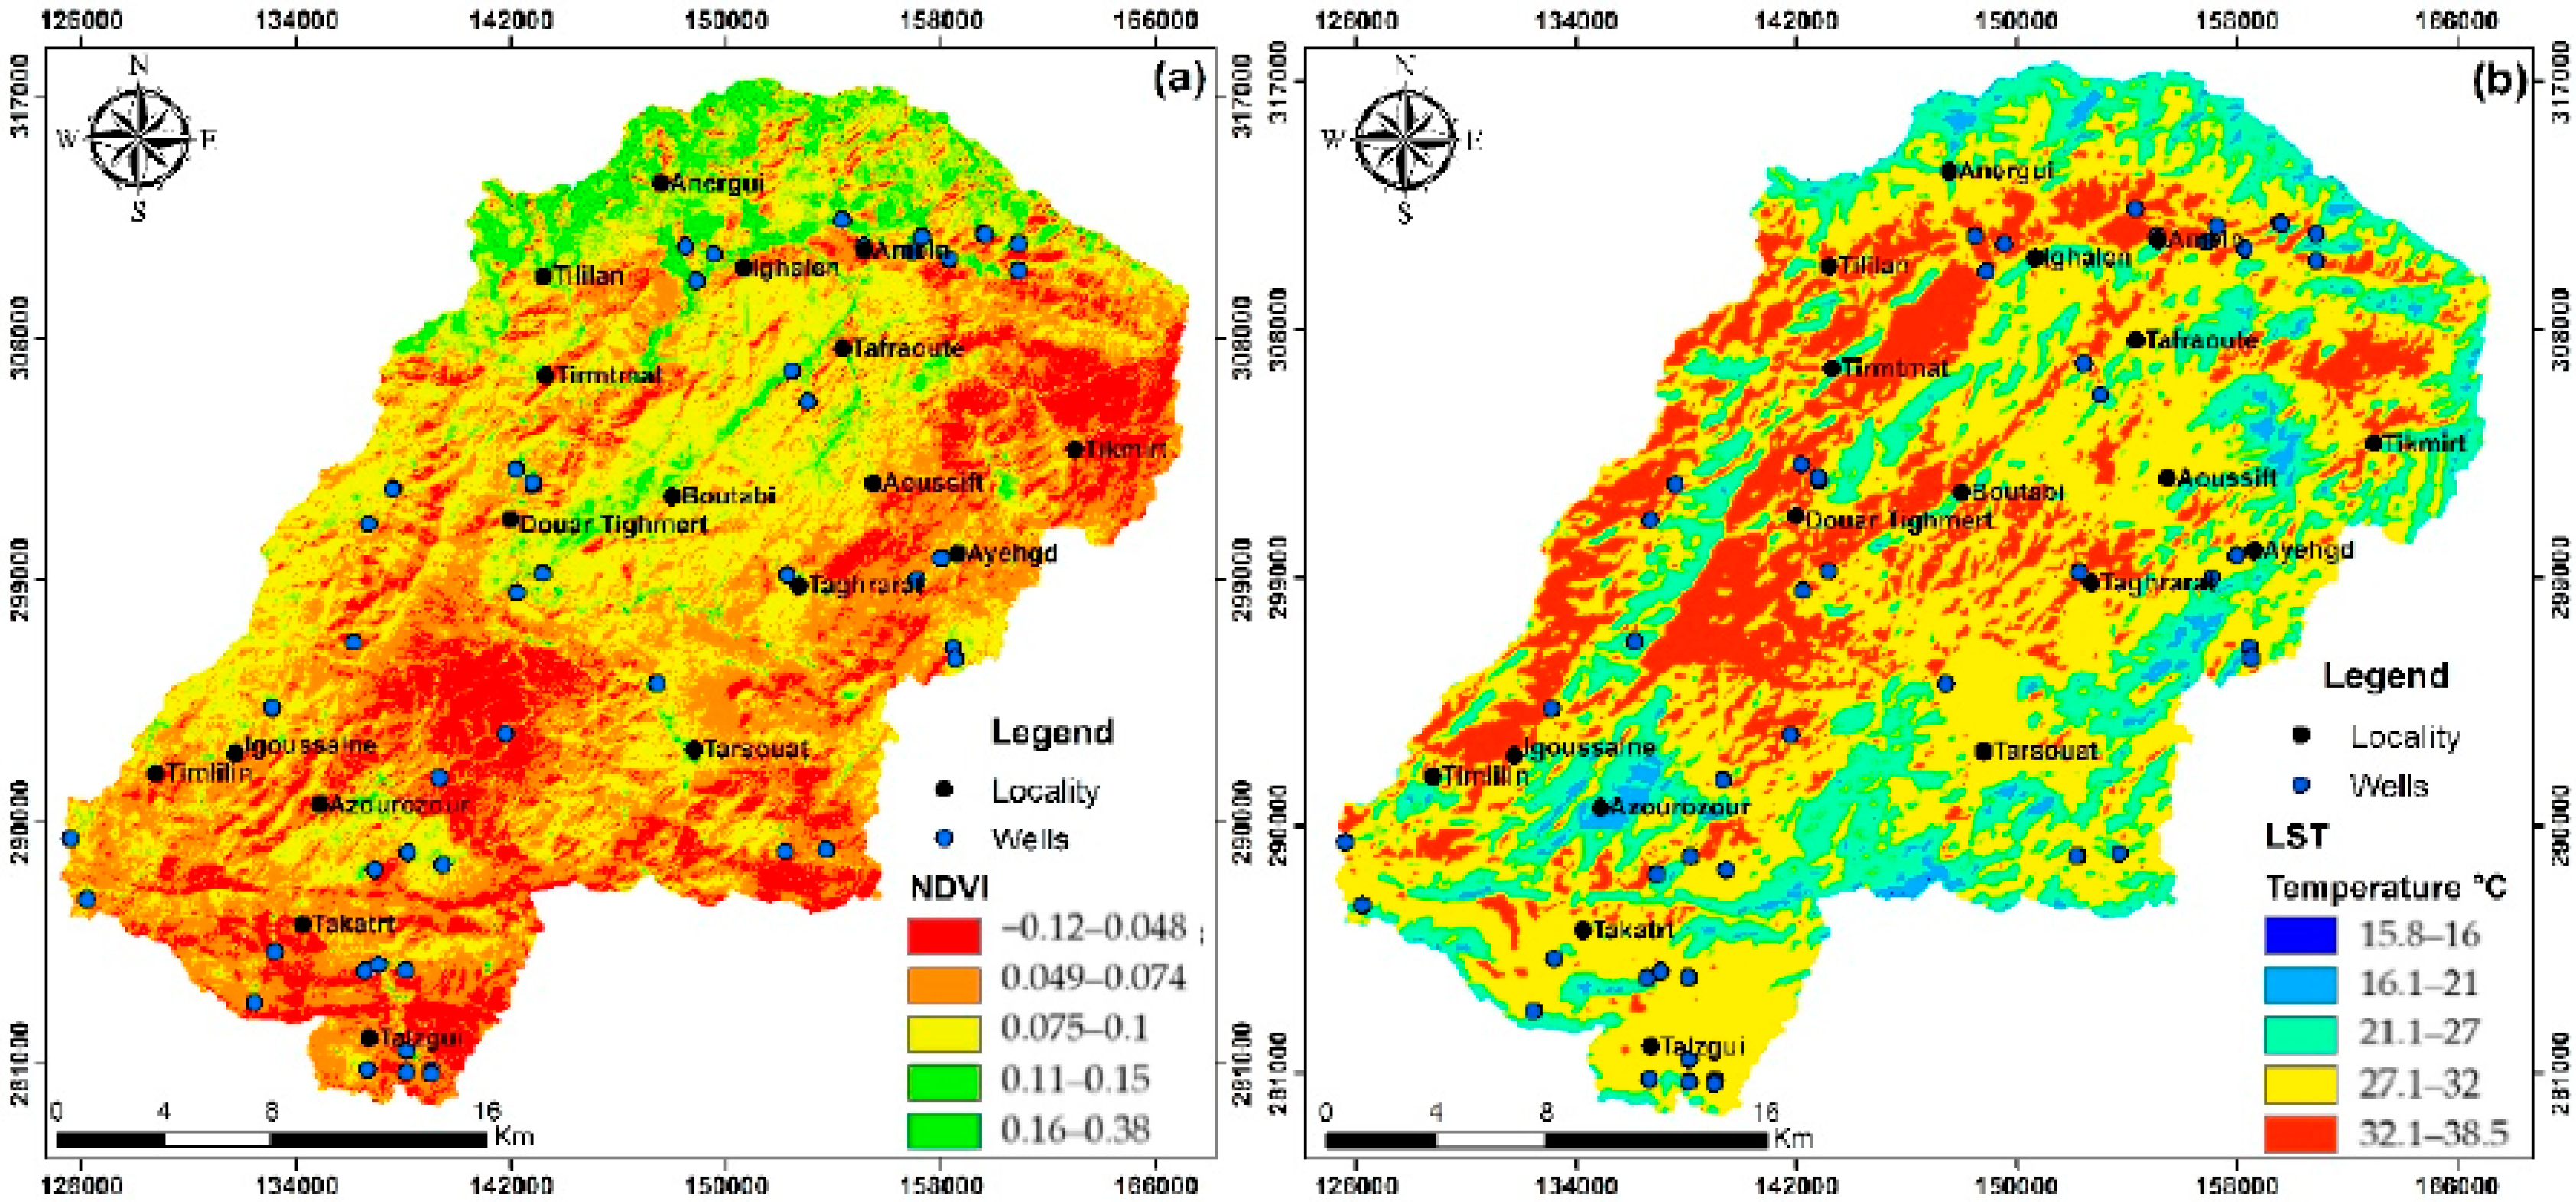
| LST (°C) | <16 | 21 | 0.002 | 0 | 0.00 | 0.00 | 0.00 | 1.18 | 2.32 | 0.49 | 0.24 |
| 16–21 | 20,482 | 2.12 | 0 | 0.00 | 0.00 | 0.00 | |||||
| 21–27 | 232,123 | 24.02 | 1 | 2.85 | 0.12 | 0.05 | |||||
| 27–32 | 516,939 | 53.50 | 28 | 80 | 1.50 | 0.61 | |||||
| >32 | 196,534 | 20.34 | 6 | 17.14 | 0.84 | 0.34 | |||||
| NDVI | 0–0.1 | 873,113 | 90.37 | 27 | 77.14 | 0.85 | 0.25 | 0.82 | 1.58 | 0.48 | 0.53 |
| 0.1–0.2 | 90,116 | 9.32 | 8 | 22.85 | 2.45 | 0.74 | |||||
| >0.2 | 2904 | 0.30 | 0 | 0.00 | 0.00 | 0.00 |
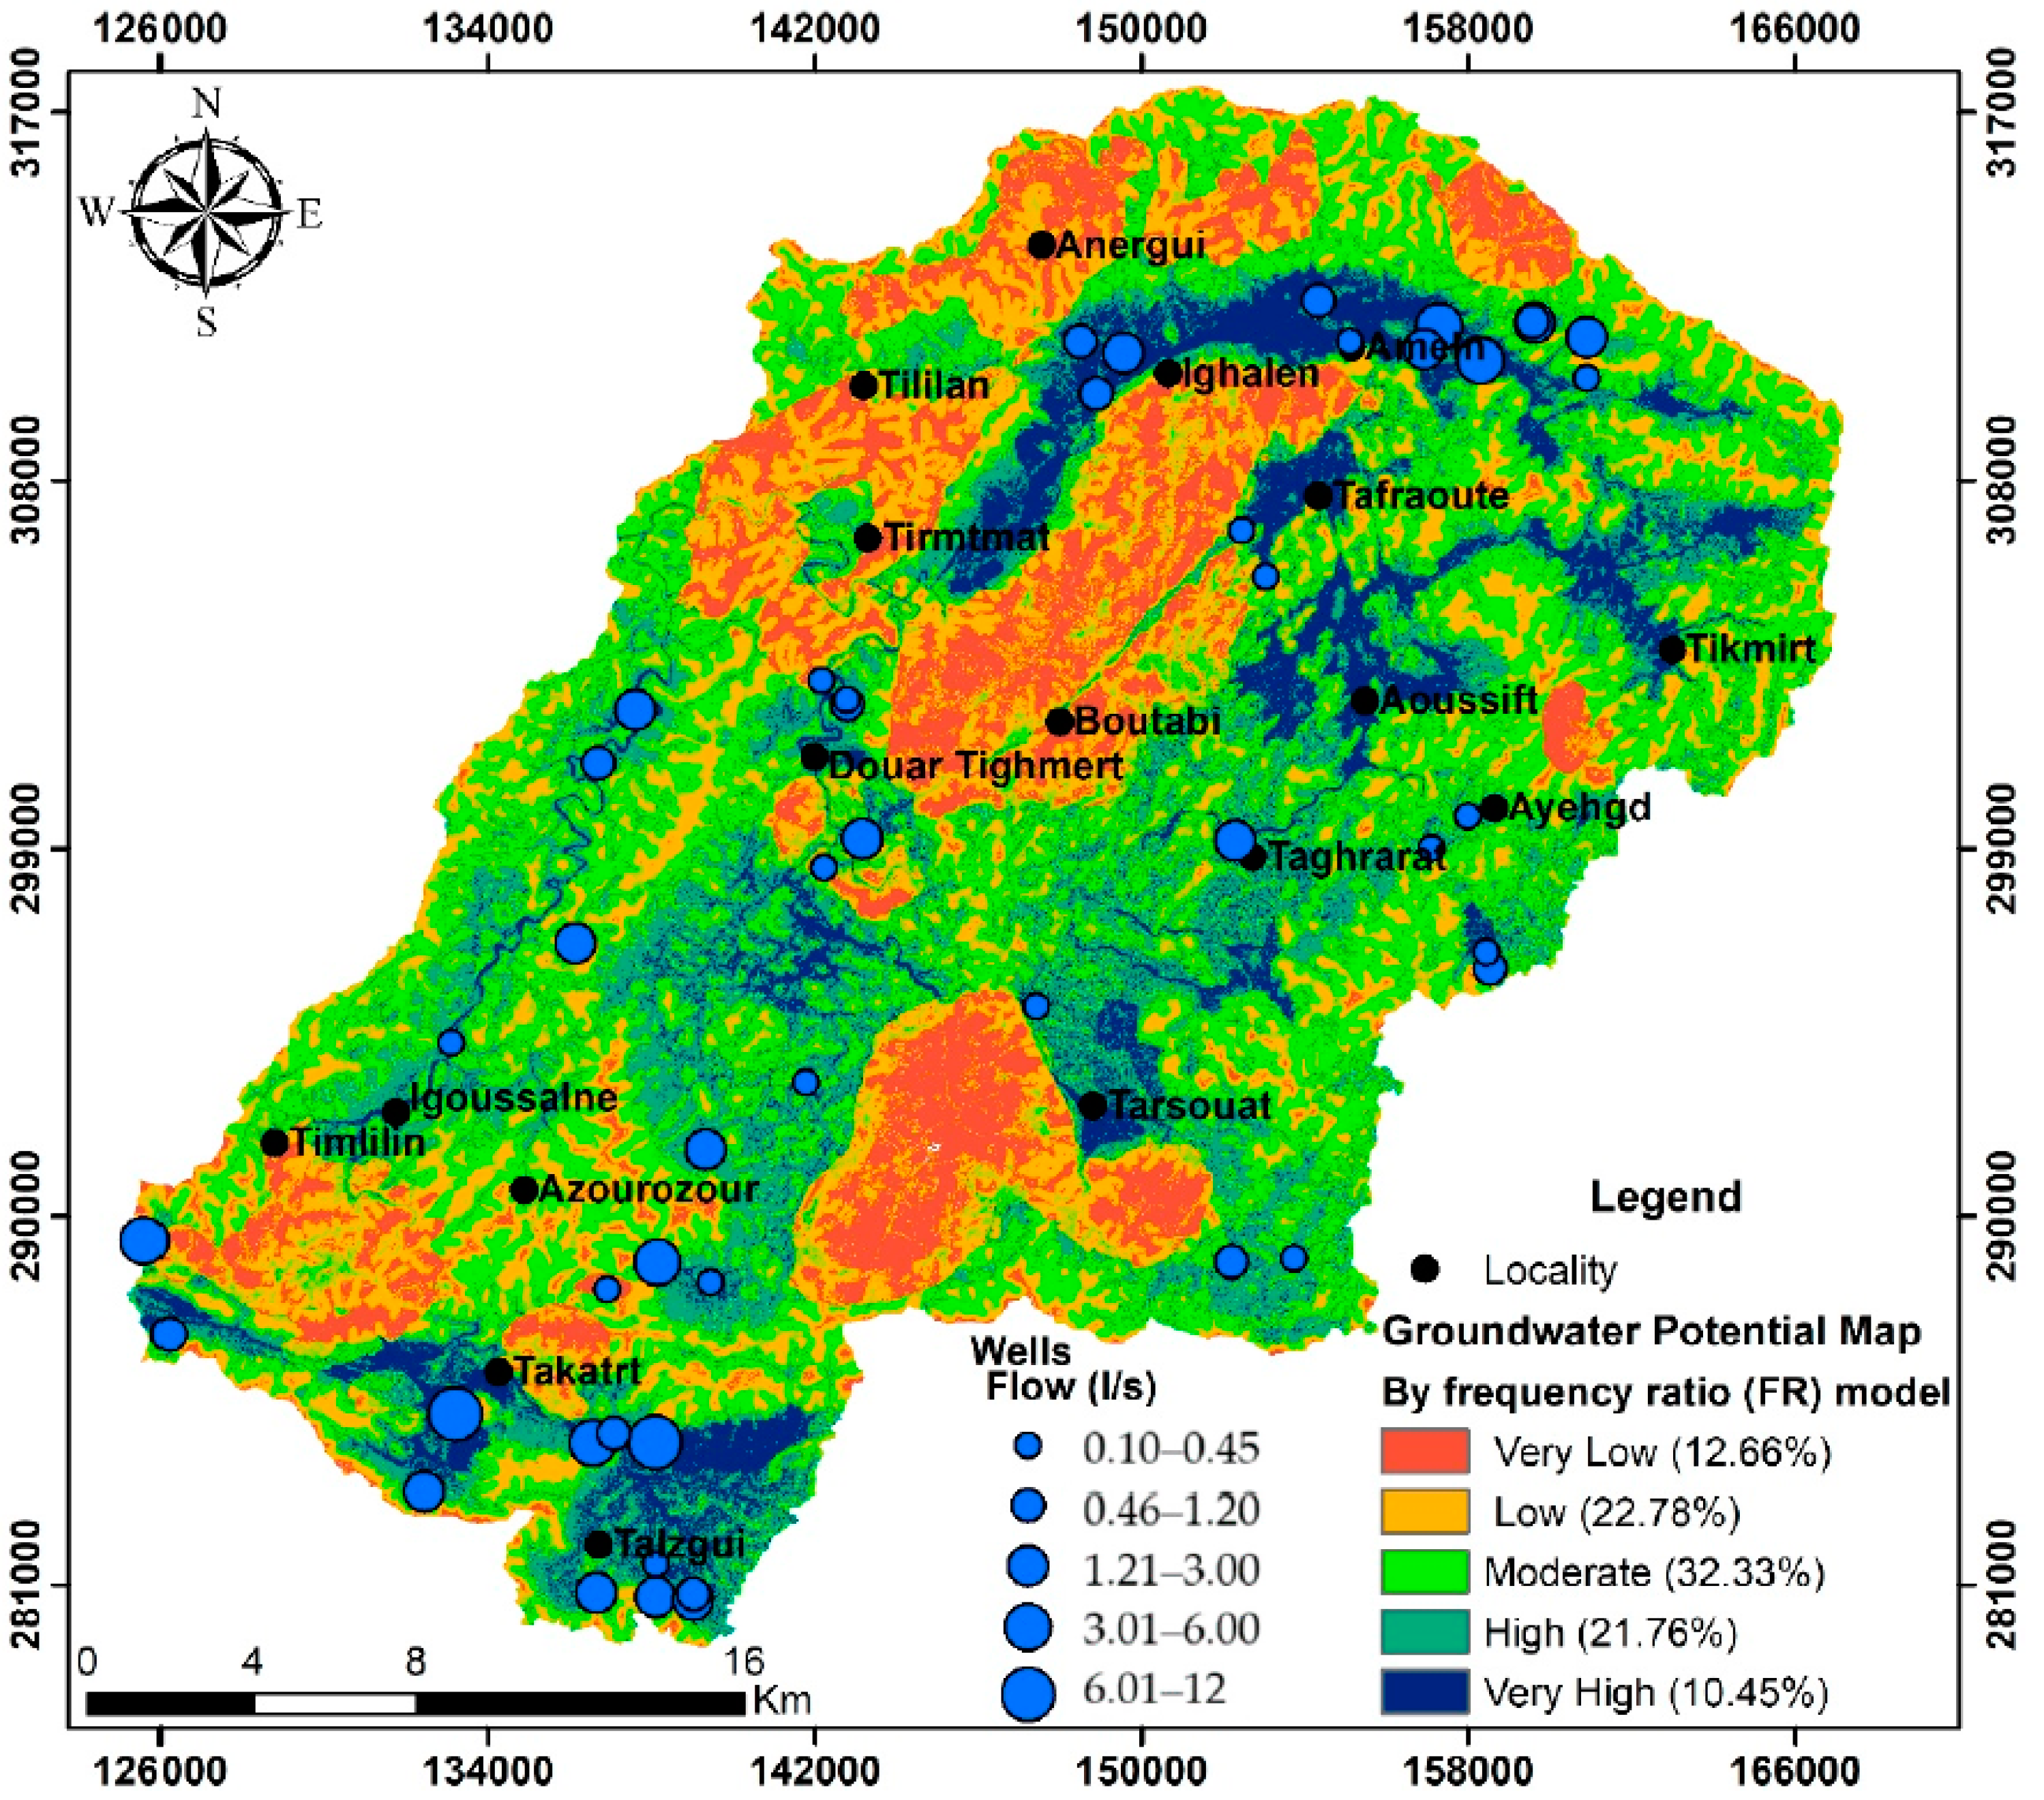
| Groundwater Potential Zones | Frequency Ratio Model (FR) | Shannon’s Entropy Model (SE) | ||
|---|---|---|---|---|
| Range | Area (%) | Range | Area (%) | |
| Very Low | 168–491 | 12.66 | 17.3–50.1 | 19.84 |
| Low | 492–643 | 22.78 | 50.2–64.8 | 33.98 |
| Moderate | 644–782 | 32.33 | 64.9–80.5 | 27.09 |
| High | 783–939 | 21.76 | 80.6–101 | 13.34 |
| Very High | 940–1310 | 10.45 | 102–142 | 5.73 |
Publisher’s Note: MDPI stays neutral with regard to jurisdictional claims in published maps and institutional affiliations. |
© 2022 by the authors. Licensee MDPI, Basel, Switzerland. This article is an open access article distributed under the terms and conditions of the Creative Commons Attribution (CC BY) license (https://creativecommons.org/licenses/by/4.0/).
Share and Cite
Benjmel, K.; Amraoui, F.; Aydda, A.; Tahiri, A.; Yousif, M.; Pradhan, B.; Abdelrahman, K.; Fnais, M.S.; Abioui, M. A Multidisciplinary Approach for Groundwater Potential Mapping in a Fractured Semi-Arid Terrain (Kerdous Inlier, Western Anti-Atlas, Morocco). Water 2022, 14, 1553. https://doi.org/10.3390/w14101553
Benjmel K, Amraoui F, Aydda A, Tahiri A, Yousif M, Pradhan B, Abdelrahman K, Fnais MS, Abioui M. A Multidisciplinary Approach for Groundwater Potential Mapping in a Fractured Semi-Arid Terrain (Kerdous Inlier, Western Anti-Atlas, Morocco). Water. 2022; 14(10):1553. https://doi.org/10.3390/w14101553
Chicago/Turabian StyleBenjmel, Khalid, Fouad Amraoui, Ali Aydda, Amine Tahiri, Mohamed Yousif, Biswajeet Pradhan, Kamal Abdelrahman, Mohammed S. Fnais, and Mohamed Abioui. 2022. "A Multidisciplinary Approach for Groundwater Potential Mapping in a Fractured Semi-Arid Terrain (Kerdous Inlier, Western Anti-Atlas, Morocco)" Water 14, no. 10: 1553. https://doi.org/10.3390/w14101553
APA StyleBenjmel, K., Amraoui, F., Aydda, A., Tahiri, A., Yousif, M., Pradhan, B., Abdelrahman, K., Fnais, M. S., & Abioui, M. (2022). A Multidisciplinary Approach for Groundwater Potential Mapping in a Fractured Semi-Arid Terrain (Kerdous Inlier, Western Anti-Atlas, Morocco). Water, 14(10), 1553. https://doi.org/10.3390/w14101553