
Sensitivity, Hazard, and Vulnerability of Farmlands to Saltwater Intrusion in Low-Lying Coastal Areas of Venice, Italy

 ,
,  , ,
, ,
Abstract
1. Introduction
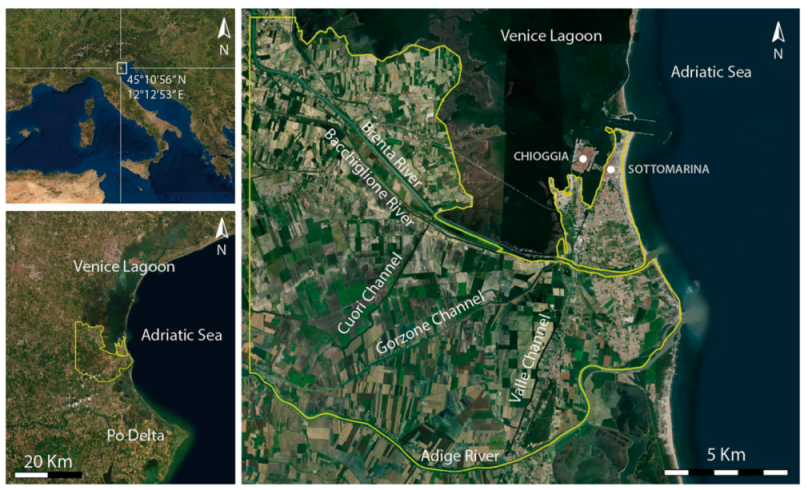
2. Study Area
3. Materials and Methods
3.1. Saline Interface Depth and Electrical Resistivity
3.2. Distance from Salt- and Freshwater Sources
3.3. Ground Elevation
3.4. Permeability of the Shallow Aquifer
3.5. Potential Runoff of the Hydrologic Soil Groups
3.6. Relative Ground Level Change
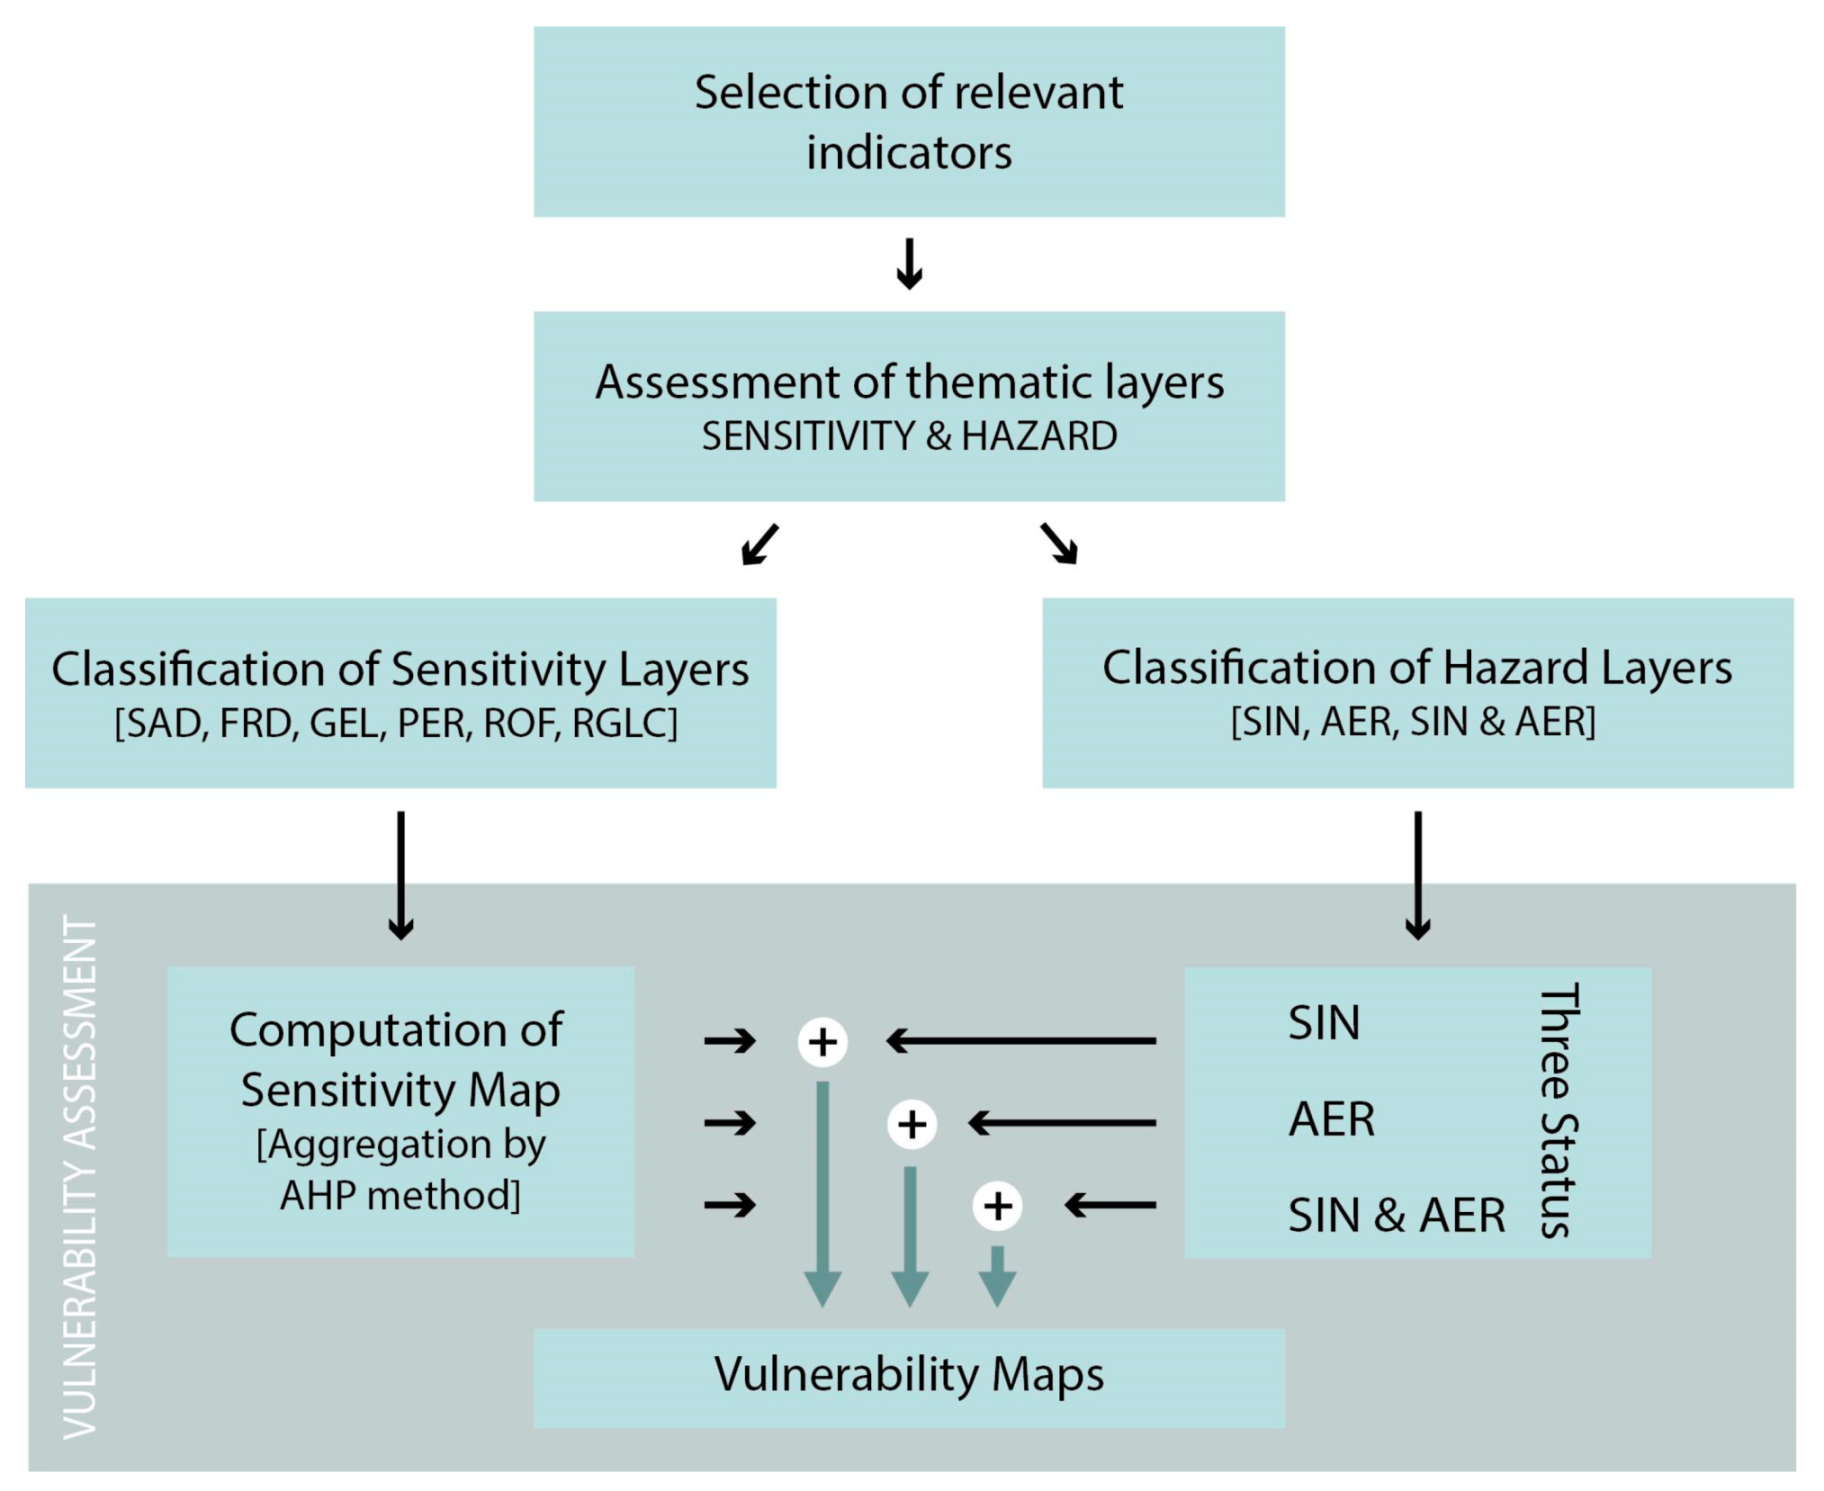
3.7. Modeling Approach
- Relevant indicators were selected, and the corresponding dataset was gridded on a 5 m regular cell grid, using the kriging method [61], resulting in a total of 7,767,096 nodes for each thematic layer.
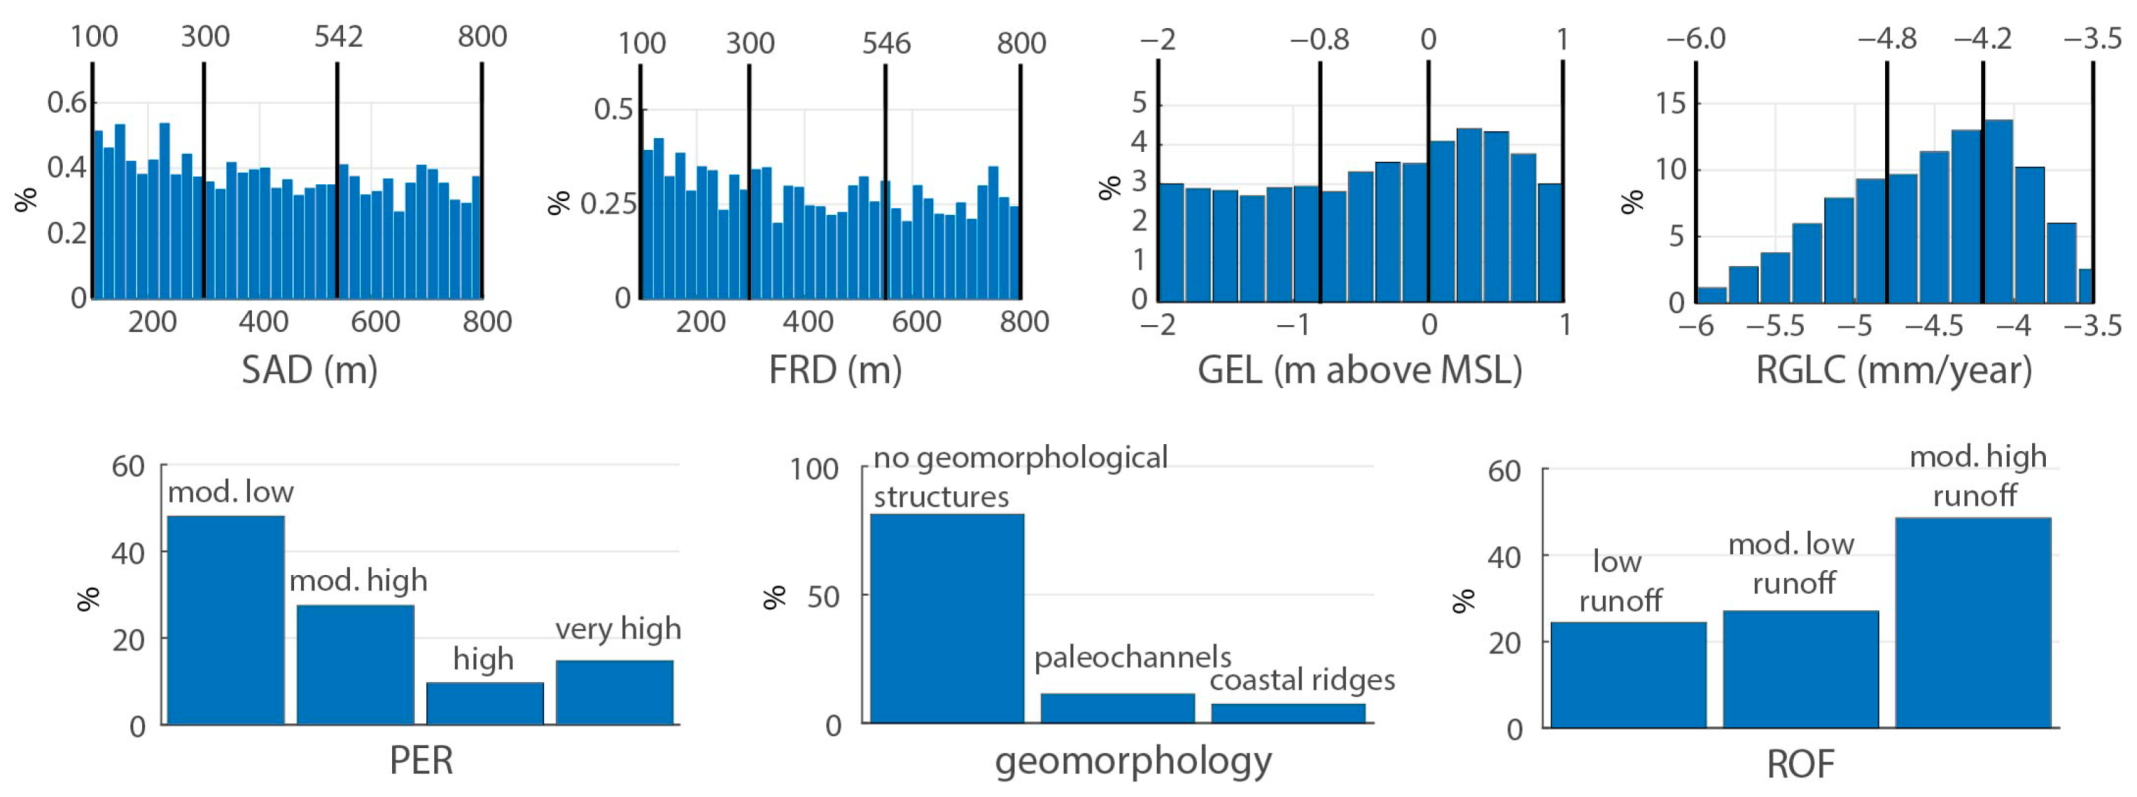
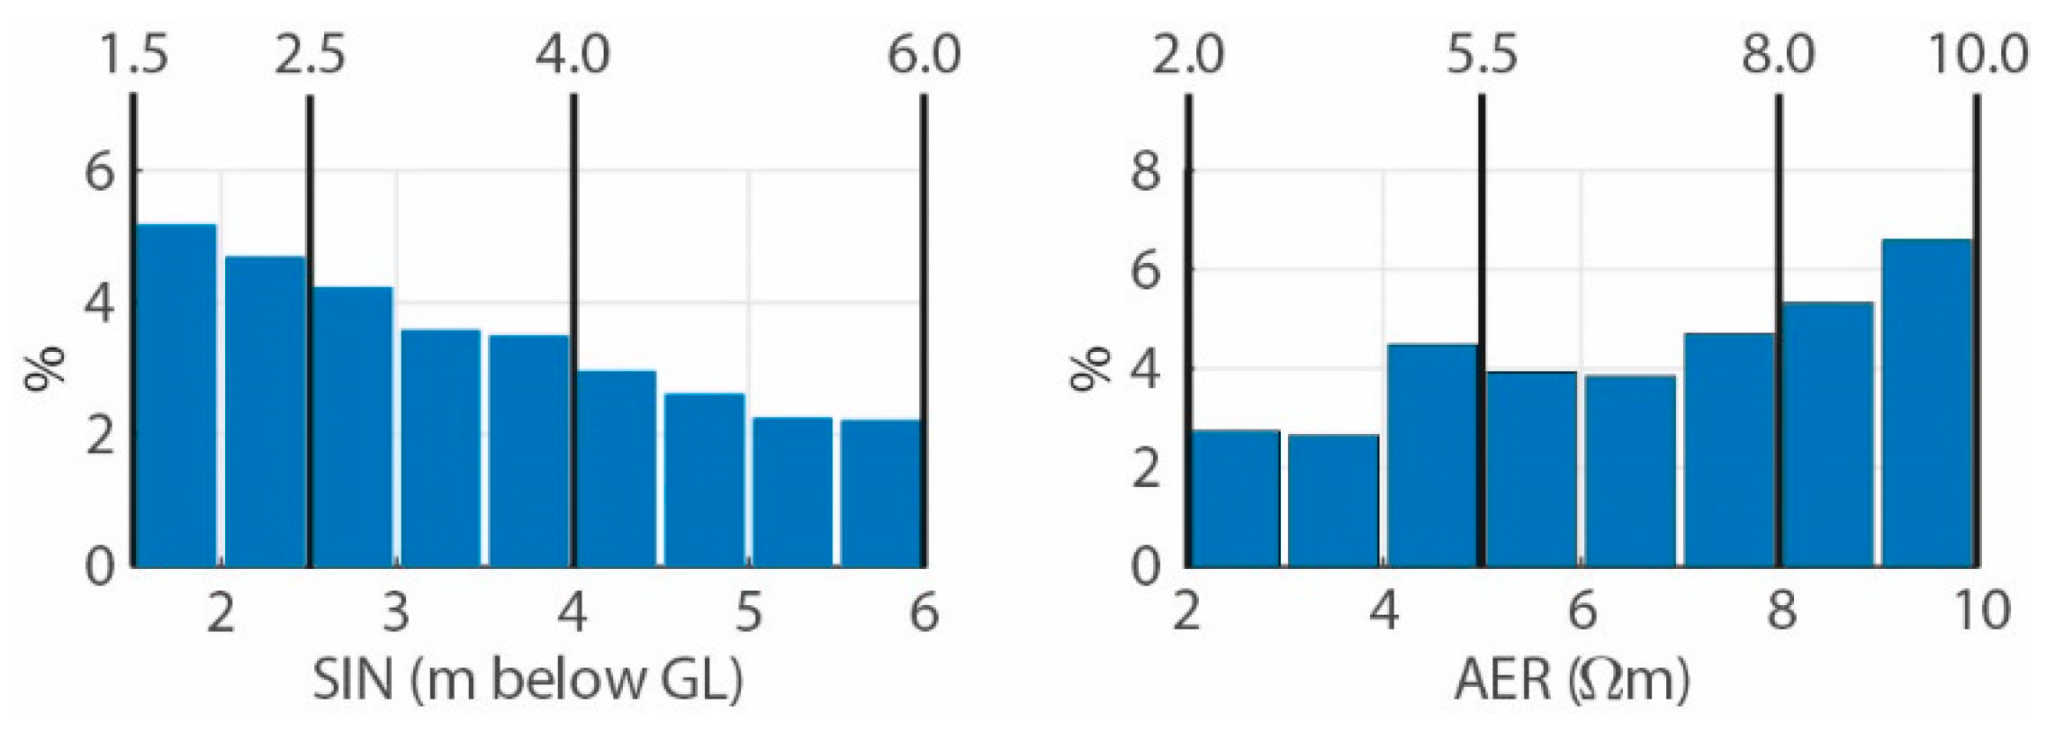
- Each layer was classified into five intervals of increasing importance, with respect to its contribution to sensitivity or hazard status. Maximum and minimum boundaries between classes were chosen based on previous investigations [29,30,50,51]. The intermediate limits were instead defined by analyzing the nodes frequency distribution and classifying them through an equal area criterion. In order to create homogenous ranking between different layers, a score ranging between 0 and 4 was assigned to each class, representing the increasing contribution to the vulnerability of the system.
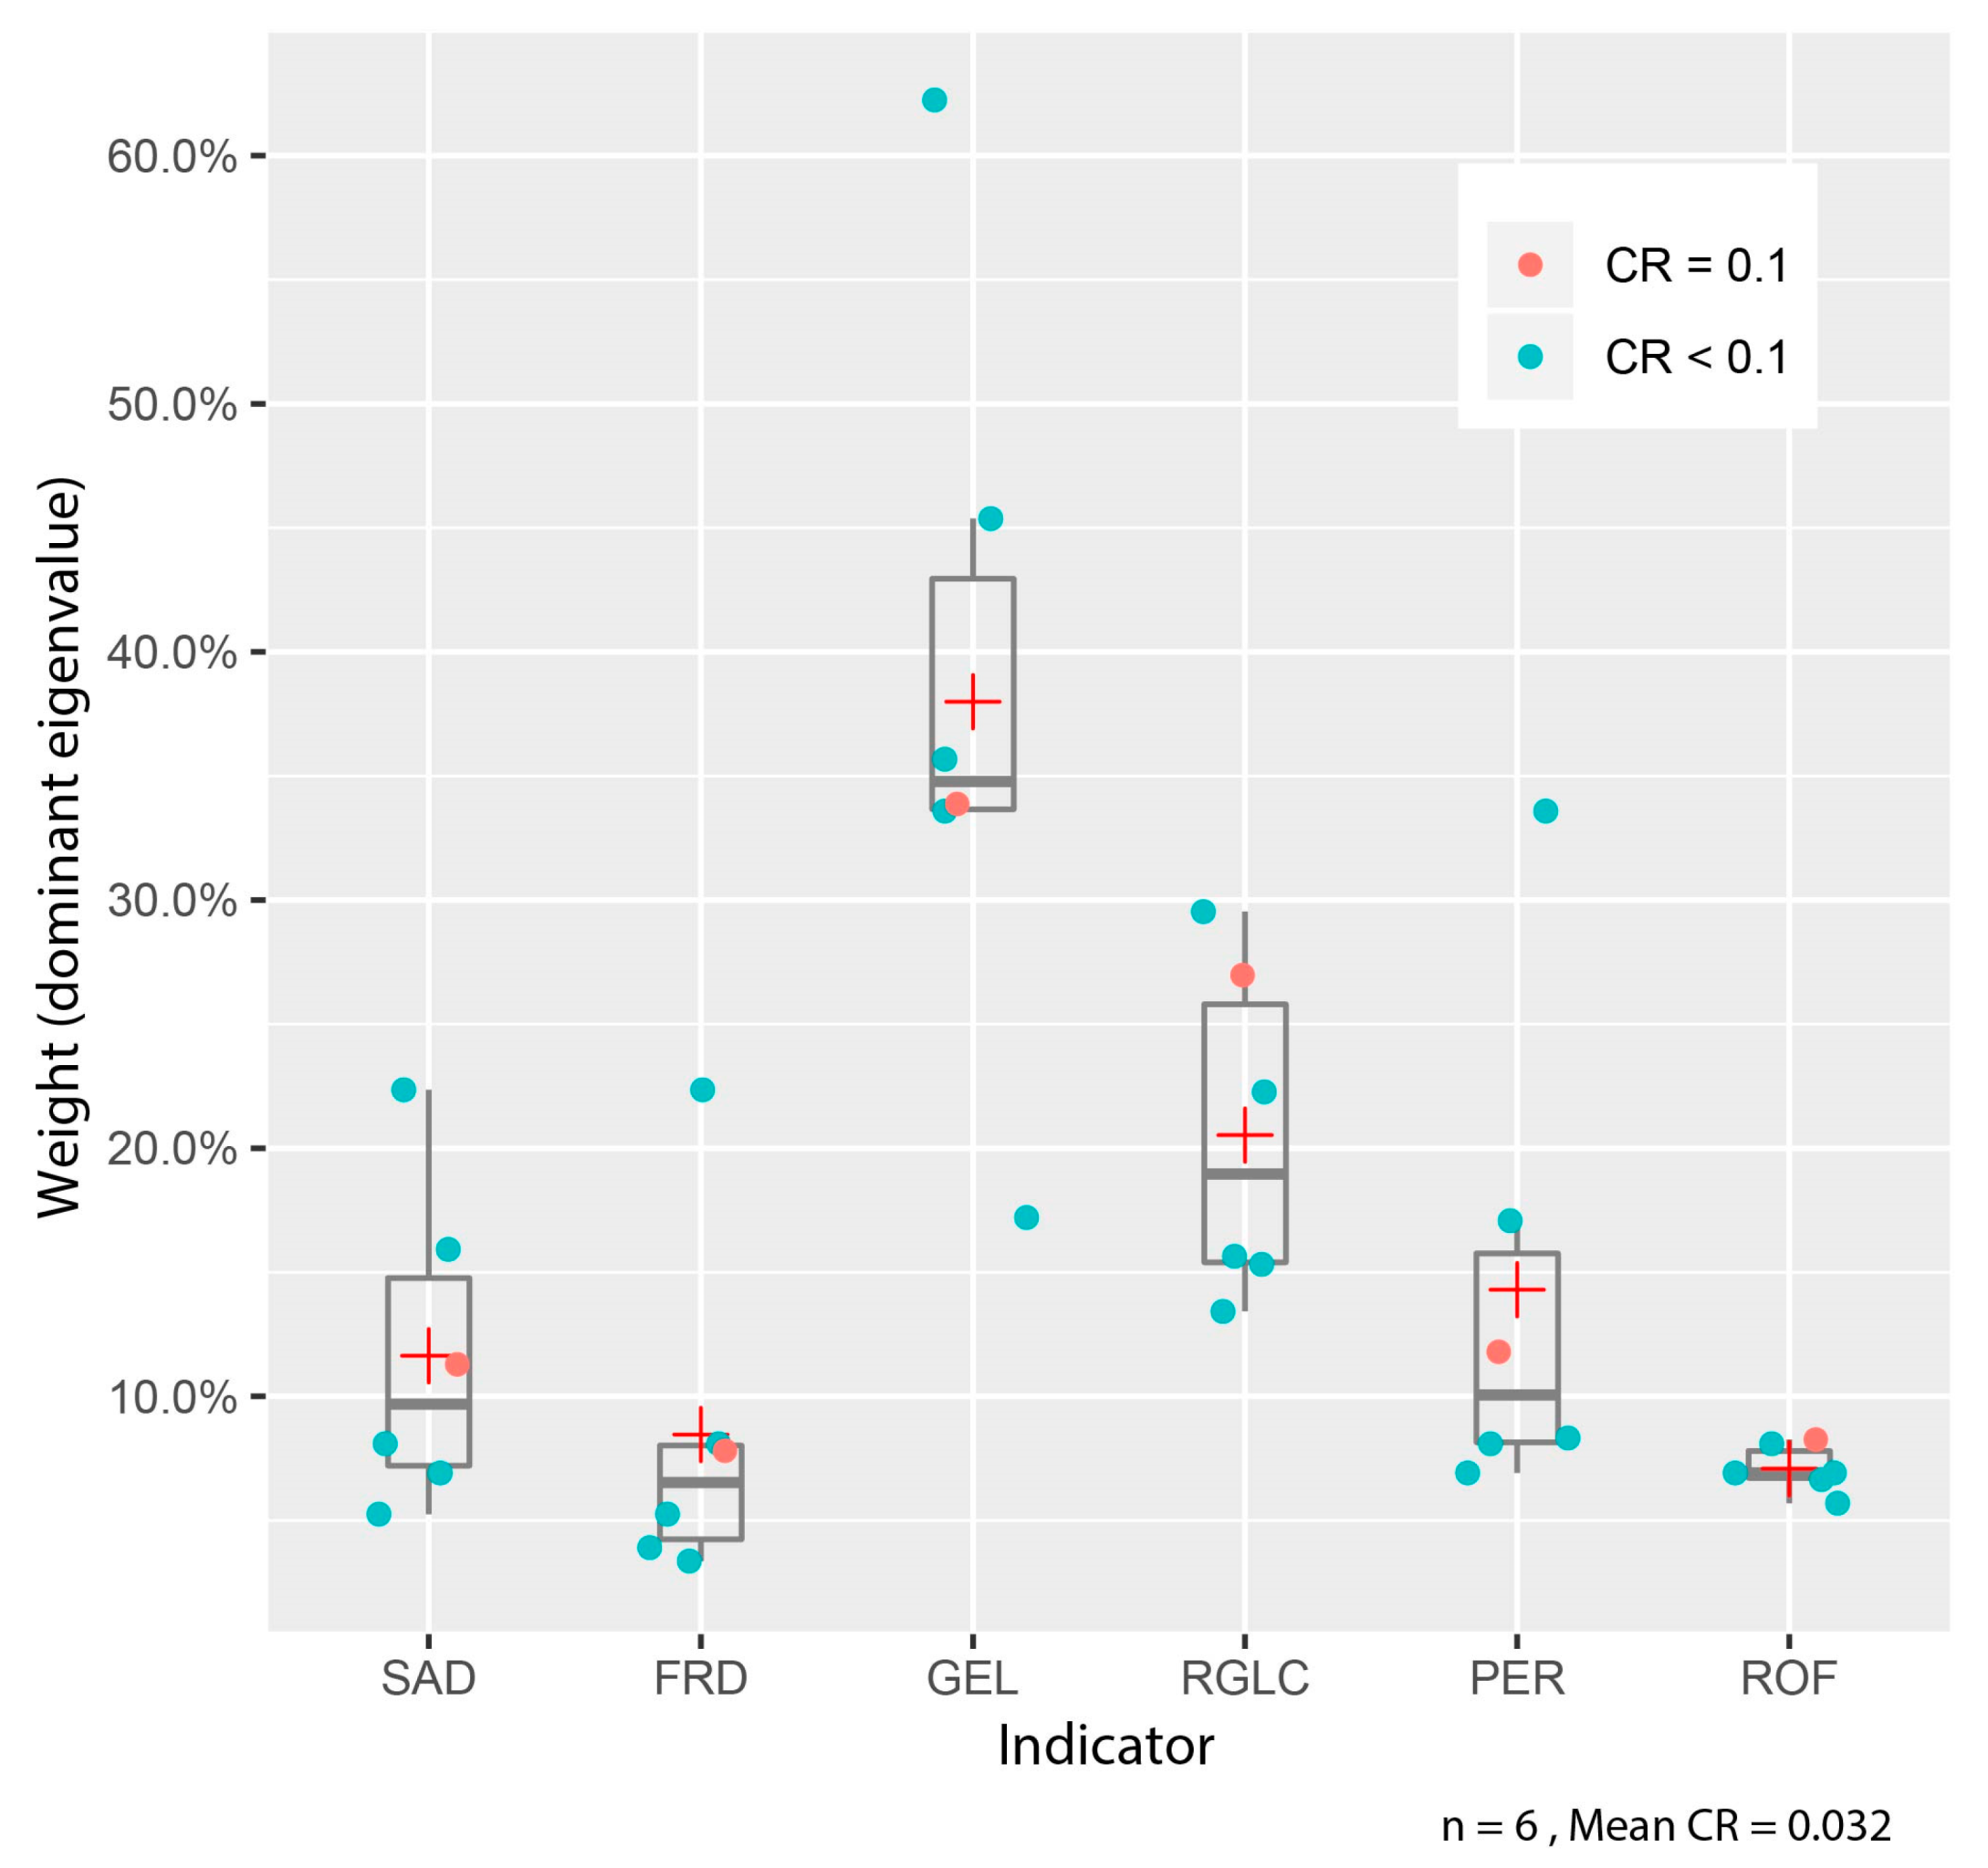
- The sensitivity map was estimated according to the following Equation (1):where the n sensitivity indicators (I) (i.e., SAD, FRD, PER, ROF, and RGLC) were weighted (ω) by using pairwise comparisons, following the AHP approach [23,62], a technique developed for multicriteria decision-making problems. AHP is a scaling method to be applied to prioritized indicators, where relative scales are derived by using expert judgements and given in the form of pairwise comparisons. The AHP analysis was performed by using the R-package ahpsurvey (v. 0.4.1) by Cho [63]. The AHP also provides a mathematical measure to determine the consistency of judgments. The coherence of the pair-wise comparisons is calculated to ensure the proportionality and transitivity of the results by calculating the consistency ratio (CR), as defined by Saaty 1990 [23], who also suggests that the CR of the order of 0.1 or less is considered to be a reasonable level of consistency [23].
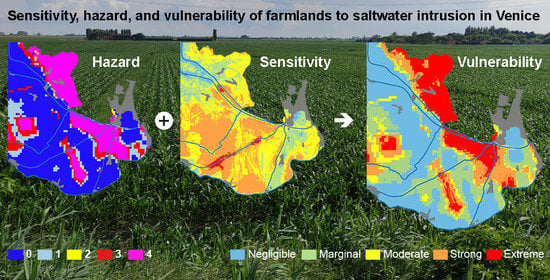
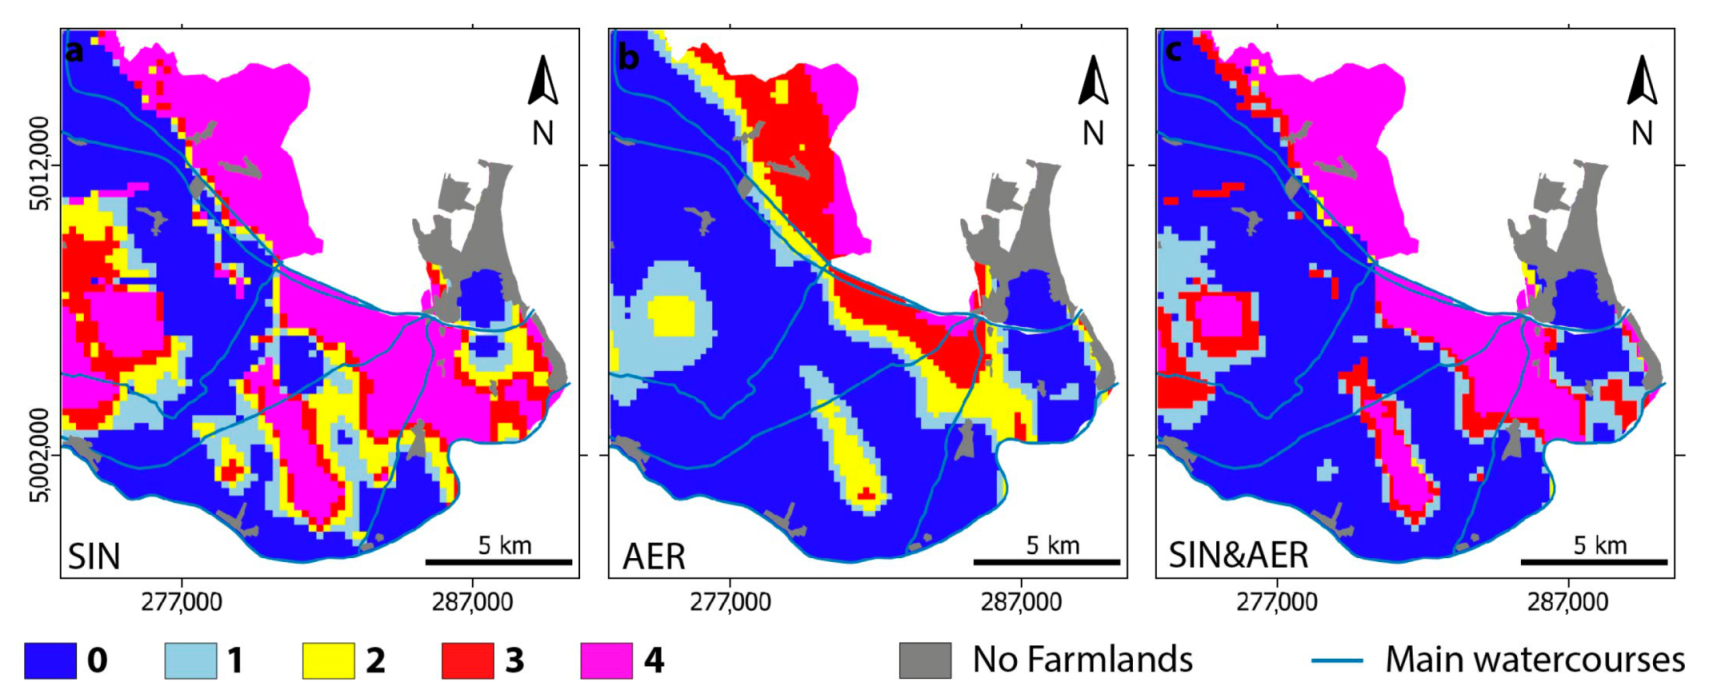
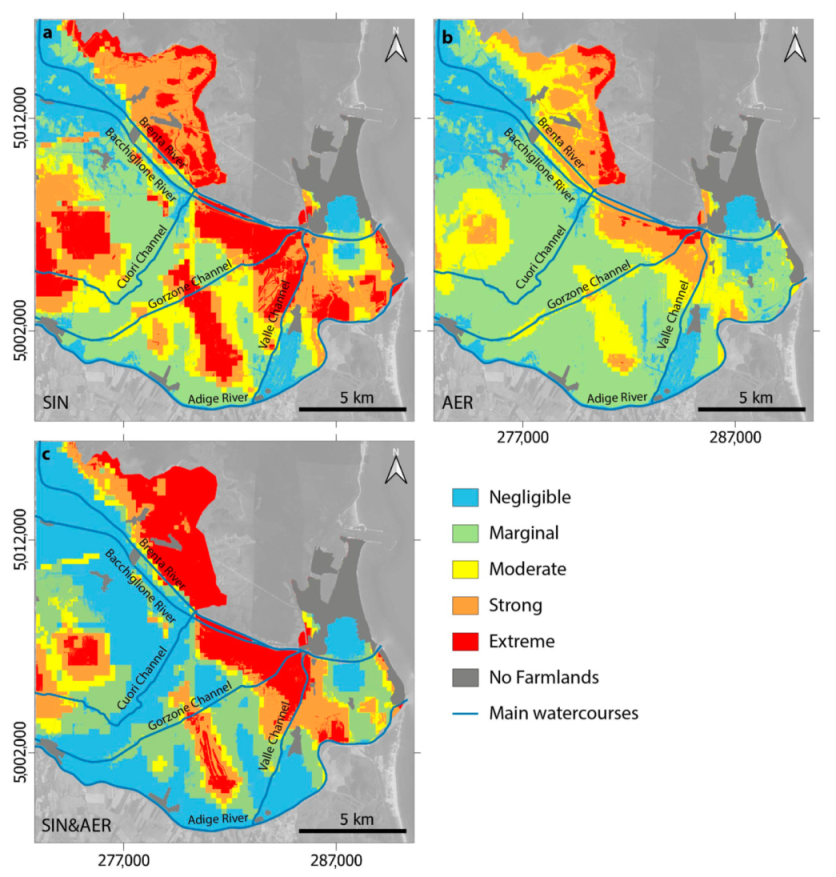
- The vulnerability map was then computed by combining the sensitivity map with the present hazard status, following Equation (2):Three different hazard statuses were considered: (i) SIN; (ii) AER; and (iii) their combination, i.e., SIN&AER.
4. Results
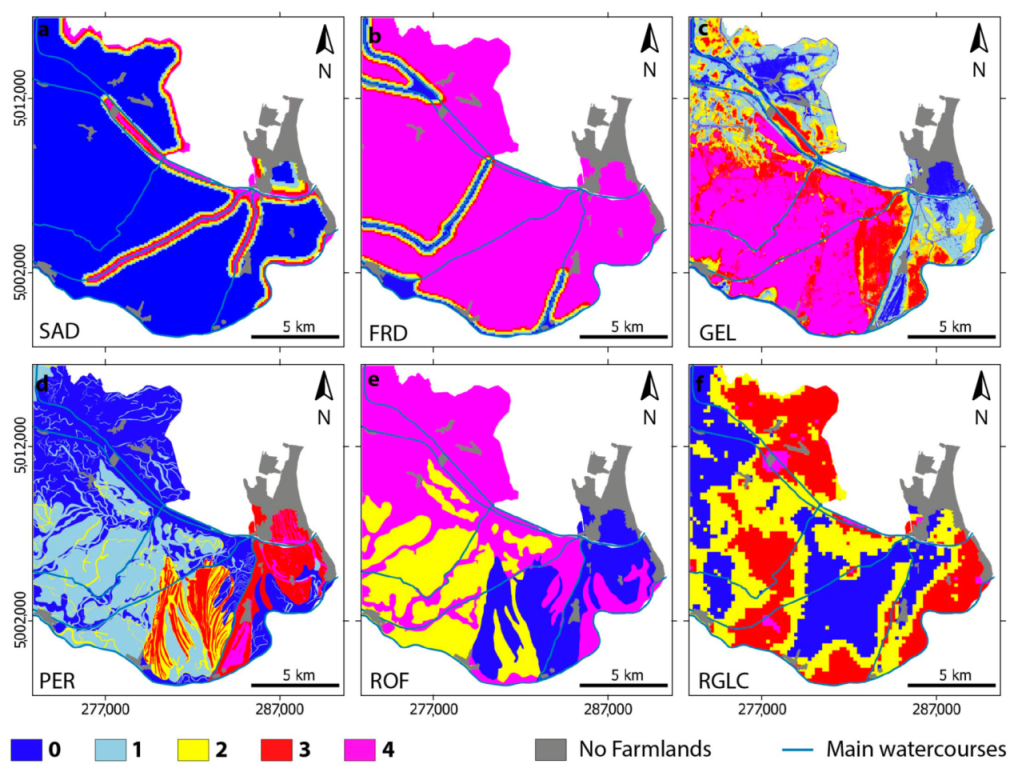
4.1. Sensitivity Layer Classification
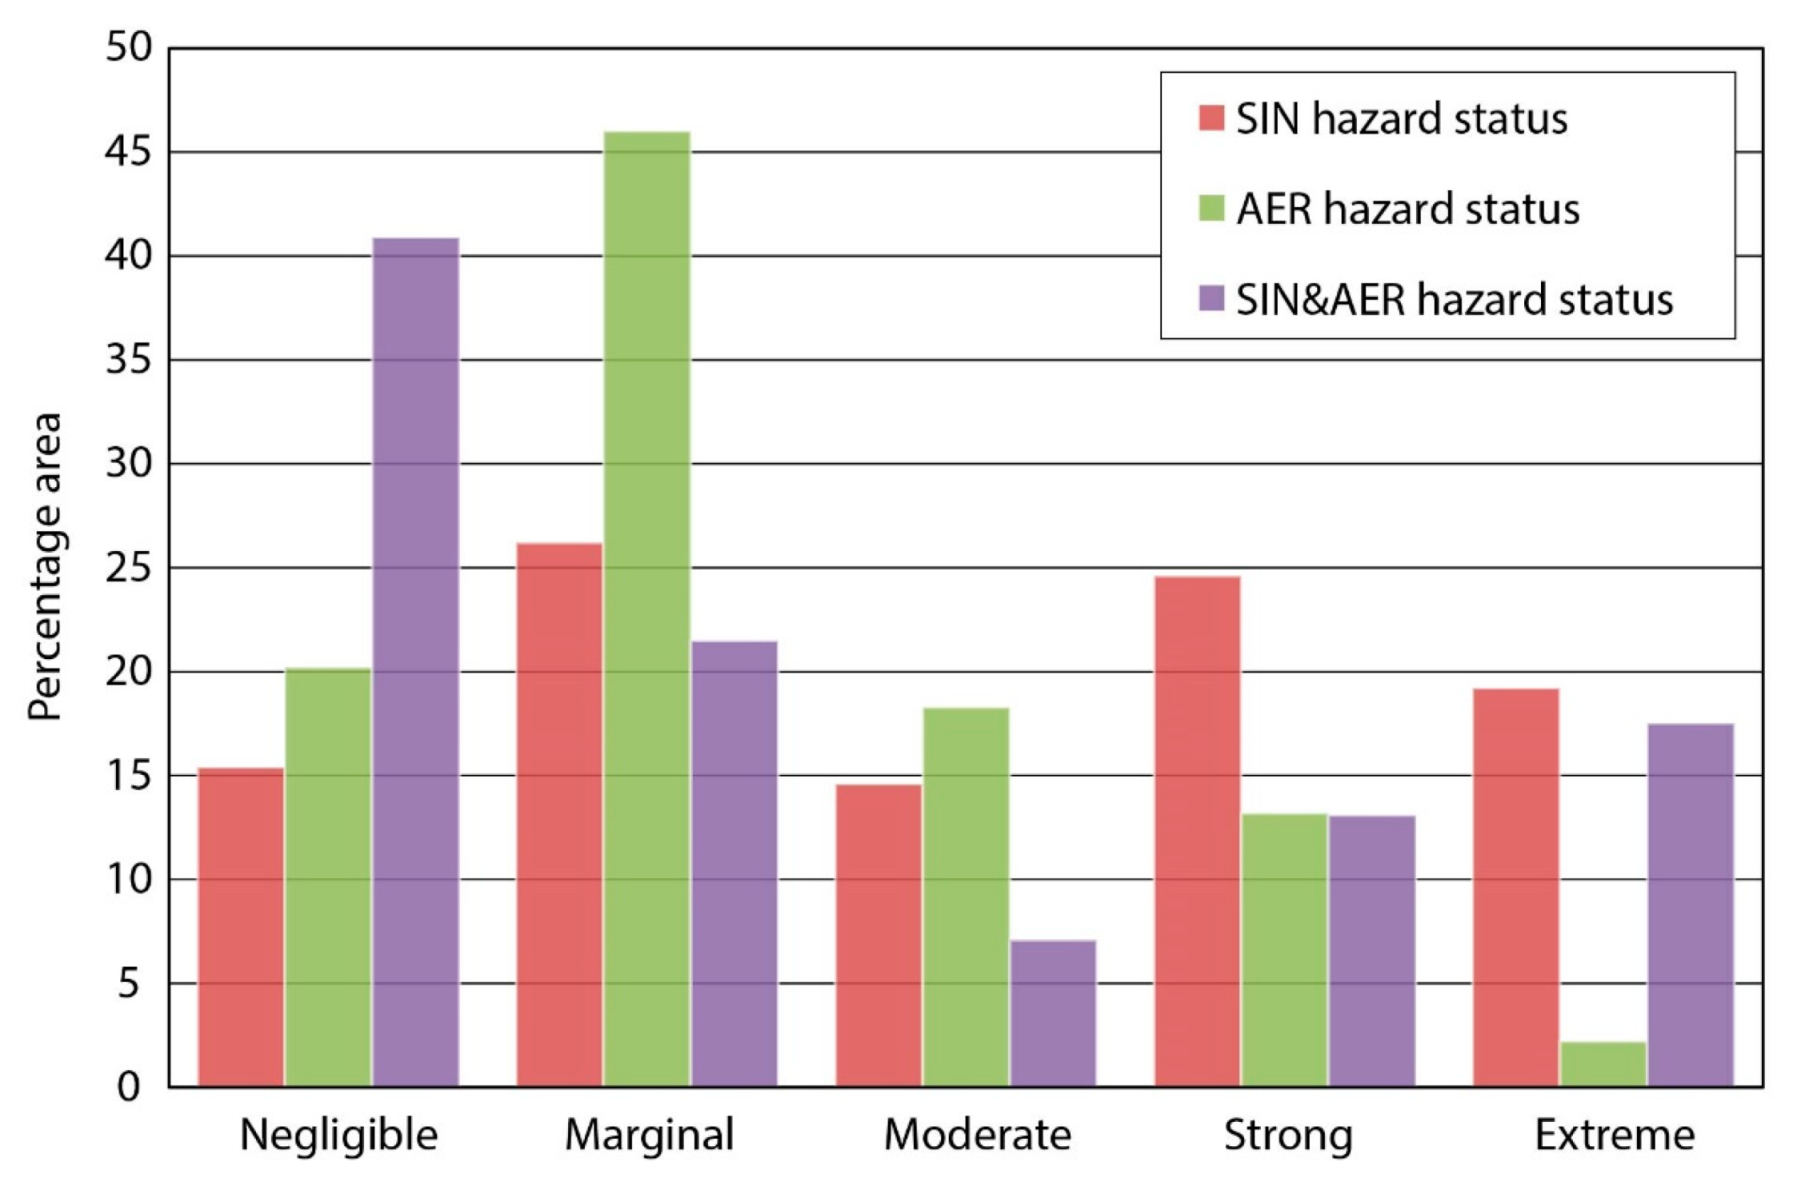
4.2. Hazard-Layer Classification
4.3. Sensitivity Setup of the Farmland System
4.4. Vulnerability Analysis of the Farmland System
5. Discussion
6. Conclusions
- The use of the AHP approach allowed the authors to prioritize indicators by using different weights provided by pairwise comparisons and to verify the consistency. Nevertheless, a certain degree of subjectivity remains, which is intrinsic in the classification and weighting.
- The combined hazard map of freshwater–saltwater interface depth and average electrical resistivity allowed the authors to capture the salinization threat on the agricultural zone without neglecting that on the underlying shallow subsoil. The vulnerability maps that were obtained by considering the two hazard statuses separately depict a less realistic representation of the fragilities of the farmland system, while their combination adjusts some classes apparently over-/underestimated.
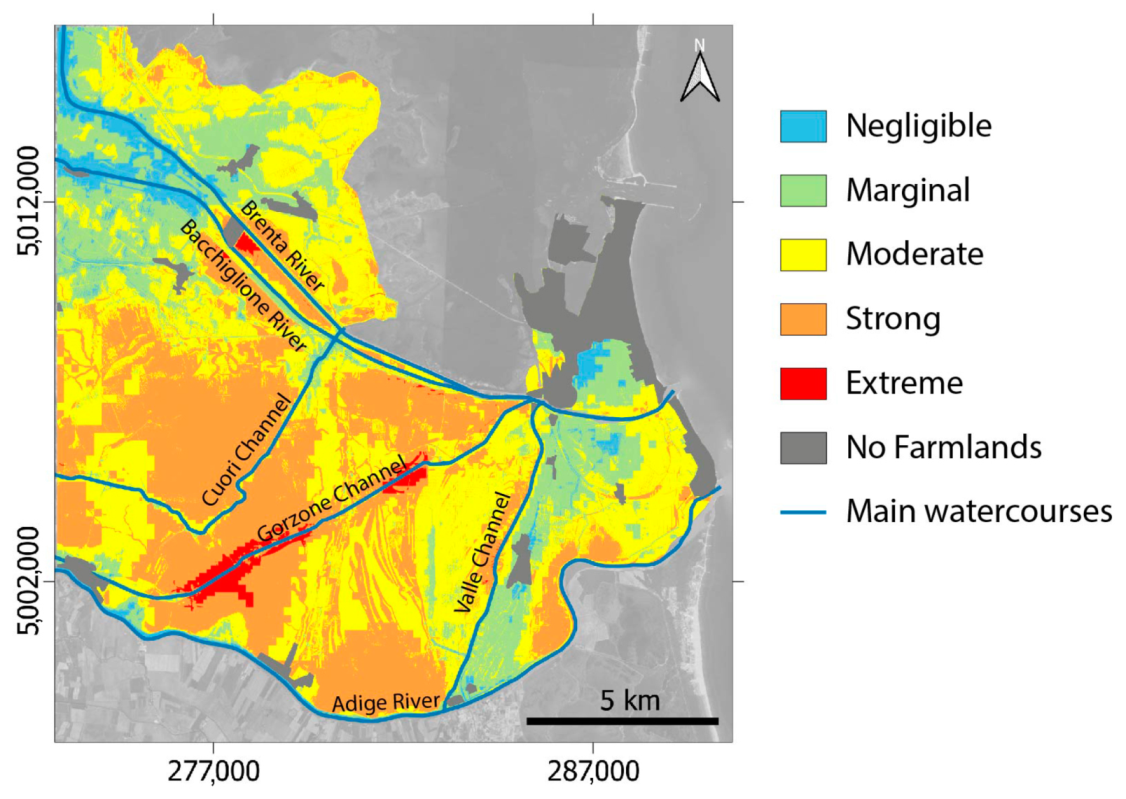
- The vulnerability of Venice farmland system is in the strong and extreme classes in about 30% of the area, marginal and moderate in the 28%, and negligible in the 40%.
- The outcomes of this research, compared with the previous assessments, confirm the heterogeneous distribution of the vulnerability in the study area. However, the differences between the two maps should be cautiously interpreted, because they focus on different targets, characterization of the sensitivity of the farmland system, and conceptualization of the hazard status.
Author Contributions
Funding
Data Availability Statement
Acknowledgments
Conflicts of Interest
References
- Poulter, B.; Goodall, J.L.; Halpin, P.N. Applications of network analysis for adaptive management of artificial drainage systems in landscapes vulnerable to sea level rise. J. Hydrol. 2008, 357, 207–217. [Google Scholar] [CrossRef]
- Rasmussen, P.; Sonnenborg, T.O.; Goncear, G.; Hinsby, K. Assessing impacts of climate change, sea level rise, and drainage canals on saltwater intrusion to coastal aquifer. Hydrol. Earth Syst. Sci. 2013, 17, 421–443. [Google Scholar] [CrossRef]
- Tully, K.L.; Weissman, D.; Wyner, W.J.; Miller, J. Soils in transition: Saltwater intrusion alters soil chemistry in agricultural fields. Biogeochemistry 2019, 142, 339–356. [Google Scholar] [CrossRef]
- Maas, E.; Grattan, S.R. Crop Yields as Affected by Salinity. In Agricultural drainage; American Society of Agronomy, Inc.: Madison, WI, USA; Crop Science Society of America, Inc.: Madison, WI, USA; Soil Science Society of America, Inc.: Madison, WI, USA, 1999; pp. 55–108. [Google Scholar]
- Mastrocicco, M.; Colombani, N. The issue of groundwater salinization in coastal areas of the mediterranean region: A review. Water 2021, 13, 90. [Google Scholar] [CrossRef]
- Weis, S.W.M.; Agostini, V.N.; Roth, L.M.; Gilmer, B.; Schill, S.R.; Knowles, J.E.; Blyther, R. Assessing vulnerability: An integrated approach for mapping adaptive capacity, sensitivity, and exposure. Clim. Change 2016, 136, 615–629. [Google Scholar] [CrossRef]
- Field, C.B.; Barros, V.R.; Dokken, D.J.; Mach, K.J.; Mastrandrea, M.D.; Bilir, T.E.; Chatterjee, M.; Ebi, K.L.; Estrada, Y.O.; Genova, R.C.; et al. (Eds.) IPCC Climate Change 2014. Impacts, Adaptation, and Vulnerability. Part A: Global and Sectoral Aspects. Contribution of Working Group II to the Fifth Assessment Report of the Intergovernmental Panel on Climate Change; Cambridge University Press: Cambridge, UK, 2014; ISBN 9781107641655. [Google Scholar]
- Field, C.B.; Barros, V.; Stocker, T.F.; Qin, D.; Dokken, D.J.; Ebi, K.L.; Mastrandrea, M.D.; Mach, K.J.; Plattner, G.-K.; Allen, S.K.; et al. (Eds.) IPCC Managing the Risks of Extreme Events and Disasters to Advance Climate Change Adaptation. A Special Report of Working Groups I and II of the Intergovernmental Panel on Climate Change; Cambridge University Press: Cambridge, UK, 2012; ISBN 9781139177245. [Google Scholar]
- Fussel, H.-M.; Klein, R.J.T. Climate change vulnerability assessments: An evolution of conceptual thinking. Clim. Change 2006, 75, 301–329. [Google Scholar] [CrossRef]
- Parizi, E.; Mossa, S.; Ataie-ashtiani, B.; Simmons, C.T. Vulnerability mapping of coastal aquifers to seawater intrusion: Review, development and application. J. Hydrol. 2019, 570, 555–573. [Google Scholar] [CrossRef]
- Goyal, D.; Haritash, A.K.; Singh, S.K. A comprehensive review of groundwater vulnerability assessment using index-based, modelling and coupling methods. J. Environ. Manag. 2021, 296, 113161. [Google Scholar] [CrossRef]
- Lobo-Ferreira, J.P.; Chachadi, A.G.; Diamantino, C.; Henriques, M.J. Assessing aquifer vulnerability to seawater intrusion using GALDIT method: Part 1—Application to the Portuguese Aquifer of Monte Gordo. In Proceedings of the Fourth Inter-Celtic Colloquium on Hydrology and Management of Water Resources, Guimarães, Portugal, 11–13 July 2005; International Association of Hydrological Sciences: Wallingford, UK, 2005; pp. 161–171. [Google Scholar]
- Chachadi, A.G.; Lobo-Ferreira, J.P. Sea water intrusion vulnerability mapping of aquifers using the GALDIT method. COASTIN A Coast. Policy Res. Newsl. 2001, 4, 7–9. [Google Scholar]
- Chachadi, A.G.; Lobo-Ferreira, J.P. Assessing aquifer vulnerability to sea-water intrusion using GALDIT method: Part 2—GALDIT Indicators Description. In Proceedings of the Fourth Inter-Celtic Colloquium on Hydrology and Management of Water Resources, Guimarães, Portugal, 11–13 July 2005; International Association of Hydrological Sciences: Wallingford, UK, 2005; pp. 172–180. [Google Scholar]
- Bordbar, M.; Neshat, A.; Javadi, S.; Pradhan, B.; Aghamohammadi, H. Meta-heuristic algorithms in optimizing GALDIT framework: A comparative study for coastal aquifer vulnerability assessment. J. Hydrol. 2020, 585, 124768. [Google Scholar] [CrossRef]
- Kazakis, N.; Busico, G.; Colombani, N.; Mastrocicco, M.; Pavlou, A.; Voudouris, K. GALDIT-SUSI a modified method to account for surface water bodies in the assessment of aquifer vulnerability to seawater intrusion. J. Environ. Manage. 2019, 235, 257–265. [Google Scholar] [CrossRef] [PubMed]
- Trabelsi, N.; Triki, I.; Hentati, I.; Zairi, M. Aquifer vulnerability and seawater intrusion risk using GALDIT, GQISWI and GIS: Case of a coastal aquifer in Tunisia. Environ. Earth Sci. 2016, 75, 669. [Google Scholar] [CrossRef]
- Recinos, N.; Kallioras, A.; Pliakas, F.; Schuth, C. Application of GALDIT index to assess the intrinsic vulnerability to seawater intrusion of coastal granular aquifers. Environ. Earth Sci. 2015, 73, 1017–1032. [Google Scholar] [CrossRef]
- Busico, G.; Buffardi, C.; Ntona, M.M.; Vigliotti, M.; Colombani, N.; Mastrocicco, M.; Ruberti, D. Actual and forecasted vulnerability assessment to seawater intrusion via GALDIT-SUSI in the Volturno river mouth (Italy). Remote Sens. 2021, 13, 3632. [Google Scholar] [CrossRef]
- Bordbar, M.; Neshat, A.; Javadi, S. A new hybrid framework for optimization and modification of groundwater vulnerability in coastal aquifer. Environ. Sci. Pollut. Res. 2019, 26, 21808–21827. [Google Scholar] [CrossRef] [PubMed]
- Nasri, G.; Hajji, S.; Aydi, W.; Boughariou, E.; Allouche, N.; Bouri, S. Water vulnerability of coastal aquifers using AHP and parametric models: Methodological overview and a case study assessment. Arab. J. Geosci. 2021, 14, 59. [Google Scholar] [CrossRef]
- Gorgij, A.D.; Moghaddam, A.A. Vulnerability Assessment of saltwater intrusion using simplified GAPDIT method: A case study of Azarshahr Plain Aquifer, East Azerbaijan, Iran. Arab. J. Geosci. 2016, 9, 106. [Google Scholar] [CrossRef]
- Saaty, T.L. How to make a decision: The analytic hierarchy process. Eur. J. Oper. Res. 1990, 48, 9–26. [Google Scholar] [CrossRef]
- Kazakis, N. Delineation of suitable zones for the application of Managed Aquifer Recharge (MAR) in coastal aquifers using quantitative parameters and the analytical hierarchy process. Water 2018, 10, 804. [Google Scholar] [CrossRef]
- Nguyen, T.D.L.; Bleys, B. Applying analytic hierarchy process to adaptation to saltwater intrusion in Vietnam. Sustainability 2021, 13, 2311. [Google Scholar] [CrossRef]
- Gambolati, G.; Putti, M.; Teatini, P.; Camporese, M.; Ferraris, S.; Gasparetto Stori, G.; Nicoletti, V.; Silvestri, S.; Rizzetto, F.; Tosi, L. Peat land oxidation enhances subsidence in the venice watershed. EOS 2005, 86, 217–224. [Google Scholar] [CrossRef]
- Carbognin, L.; Gambolati, G.; Putti, M.; Rizzetto, F.; Teatini, P. Soil contamination and land subsidence raise concern in the Venice watershed, Italy. WIT Trans. Ecol. Environ. 2006, 99, 691–700. [Google Scholar] [CrossRef]
- Carbognin, L.; Tosi, L. Il Progetto Ises per L’Analisi dei Processi di Intrusione Salina e Subsidenza nei Territori Meridionali delle Provincie di Padova e Venezia; Istituto per lo Studio della Dinamica delle Grandi Masse: Venezia, Italy, 2003. [Google Scholar]
- Da Lio, C.; Carol, E.; Kruse, E.; Teatini, P.; Tosi, L. Saltwater contamination in the managed low-lying farmland of the Venice coast, Italy: An assessment of vulnerability. Sci. Total Environ. 2015, 533, 356–369. [Google Scholar] [CrossRef]
- Tosi, L.; Da Lio, C.; Teatini, P.; Menghini, A.; Viezzoli, A. Continental and marine surficial water - Groundwater interactions: The case of the southern coastland of Venice (Italy). Proc. Int. Assoc. Hydrol. Sci. 2018, 379, 387–392. [Google Scholar] [CrossRef]
- Lovrinović, I.; Bergamasco, A.; Srzić, V.; Cavallina, C.; Holjević, D.; Donnici, S.; Erceg, J.; Zaggia, L.; Tosi, L. Groundwater monitoring systems to understand sea water intrusion dynamics in the Mediterranean: The Neretva valley and the southern Venice coastal aquifers case studies. Water 2021, 13, 561. [Google Scholar] [CrossRef]
- Tiozzo, P.G. Lo Stabilimento Jappelli-Testa e la Bonifica Dell’Ultimo Lembo del Foresto in Chioggia e il Suo Territorio; Ministero dell’Agricoltura, Bonifica e Programmazione nel Veneto: Venice, Italy, 1974. [Google Scholar]
- Zecchin, M.; Brancolini, G.; Tosi, L.; Rizzetto, F.; Caffau, M.; Baradello, L. Anatomy of the Holocene succession of the southern Venice lagoon revealed by very high-resolution seismic data. Cont. Shelf Res. 2009, 29, 1343–1359. [Google Scholar] [CrossRef]
- Tosi, L.; Teatini, P.; Brancolini, G.; Zecchin, M.; Carbognin, L.; Affatato, A.; Baradello, L. Three-dimensional analysis of the Plio-Pleistocene seismic sequences in the Venice Lagoon (Italy). J. Geol. Soc. 2012, 169, 507–510. [Google Scholar] [CrossRef]
- Donnici, S.; Serandrei-Barbero, R.; Canali, G. Evidence of climatic changes in the Venetian Coastal Plain (Northern Italy) during the last 40,000 years. Sediment. Geol. 2012, 281, 139–150. [Google Scholar] [CrossRef]
- Canali, G.; Capraro, L.; Donnici, S.; Rizzetto, F.; Serandrei-Barbero, R.; Tosi, L. Vegetational and environmental changes in the eastern Venetian coastal plain (Northern Italy) over the past 80,000 years. Palaeogeogr. Palaeoclimatol. Palaeoecol. 2007, 253, 300–316. [Google Scholar] [CrossRef]
- Storms, J.E.A.; Weltje, G.J.; Terra, G.J.; Cattaneo, A.; Trincardi, F. Coastal dynamics under conditions of rapid sea-level rise: Late Pleistocene to Early Holocene evolution of barrier–lagoon systems on the northern Adriatic shelf (Italy). Quat. Sci. Rev. 2008, 27, 1107–1123. [Google Scholar] [CrossRef]
- Zecchin, M.; Caffau, M.; Tosi, L. Relationship between peat bed formation and climate changes during the last glacial in the Venice area. Sediment. Geol. 2011, 238, 172–180. [Google Scholar] [CrossRef]
- Donnici, S.; Serandrei-Barbero, R.; Bini, C.; Bonardi, M.; Lezziero, A. The caranto paleosol and its role in the early urbanization of Venice. Geoarchaeology 2011, 26, 514–543. [Google Scholar] [CrossRef]
- Tosi, L.; Rizzetto, F.; Bonardi, M.; Donnici, S.; Serandrei-Barbero, R.; Toffoletto, F. Note Illustrative della Carta Geologica d’Italia alla Scala 1:50.000. Foglio 128, Venezia; Servizio Geologico d’Italia: Rome, Italy, 2007. [Google Scholar]
- Tosi, L.; Rizzetto, F.; Bonardi, M.; Donnici, S.; Serandrei-Barbero, R.; Toffoletto, F. Note Illustrative della Carta Geologica d’Italia alla Scala 1:50.000. Foglio 148-149, Chioggia-Malamocco; Servizio Geologico d’Italia: Rome, Italy, 2007; 164. [Google Scholar]
- Tosi, L.; Rizzetto, F.; Zecchin, M.; Brancolini, G.; Baradello, L. Morphostratigraphic framework of the Venice Lagoon (Italy) by very shallow water VHRS surveys: Evidence of radical changes triggered by human-induced river diversions. Geophys. Res. Lett. 2009, 36, 1–5. [Google Scholar] [CrossRef]
- Gambolati, G.; Teatini, P. Numerical Analysis of Land Subsidence due to Natural Compaction of the Upper Adriatic Sea Basin. In CENAS. Coastline Evolution of the Upper Adriatic Sea due to Sea Level Rise and Natural and Anthropogenic Land Subsidence; Gambolati, G., Ed.; Springer: Dordrecht, The Netherlands, 1998; pp. 103–131. [Google Scholar]
- Rizzetto, F.; Tosi, L.; Carbognin, L.; Bonardi, M.; Teatini, P. Geomorphic setting and related hydrogeological implications of the coastal plain south of the Venice Lagoon, Italy. In Proceedings of the Hydrology of Mediterranean and Semiarid Regions, Montpellier, France, 1–4 April 2003; International Association of Hydrological Sciences: Wallingford, UK; pp. 463–470. [Google Scholar]
- Gambolati, G.; Putti, M.; Teatini, P.; Gasparetto Stori, G. Subsidence due to peat oxidation and impact on drainage infrastructures in a farmland catchment south of the Venice Lagoon. Environ. Geol. 2006, 49, 814–820. [Google Scholar] [CrossRef]
- Fornasiero, A.; Gambolati, G.; Putti, M.; Teatini, P.; Ferraris, S.; Pitacco, A.; Rizzetto, F.; Tosi, L.; Bonardi, M.; Gatti, P. Subsidence due to peat soil loss in the Zennare basin (Italy): Design and set-up of the field experiment. In Scientific Research and Safeguarding of Venice; Campostrini, P., Ed.; Istituto Veneto di Scienze Lettere ed Arti: Venice, Italy, 2002; pp. 201–215. [Google Scholar]
- Camporese, M.; Putti, M.; Salandin, P.; Teatini, P. Spatial variability of CO2 efflux in a drained cropped peatland south of Venice, Italy. J. Geophys. Res. Biogeosciences 2008, 113, G04018. [Google Scholar] [CrossRef]
- Tosi, L.; Carbognin, L.; Teatini, P.; Rosselli, R.; Gasparetto Stori, G. The ISES Project subsidence monitoring of the catchment basin south of the Venice Lagoon (Italy). In Land subsidence: Proceedings of the Sixth International Symposium on Land Subsidence, Ravenna, Italy, 24–29 September 2000; CNR, Grupo Nazionale per la Difesa dalle Catastrofi Idrogeologiche: Venice, Italy, 2000; Volume 2, pp. 113–126. [Google Scholar]
- Zechner, E.; Konz, M.; Younes, A.; Huggenberger, P. Effects of tectonic structures, salt solution mining, and density-driven groundwater hydraulics on evaporite dissolution (Switzerland). Hydrogeol. J. 2011, 19, 1323–1334. [Google Scholar] [CrossRef][Green Version]
- De Franco, R.; Biella, G.; Tosi, L.; Teatini, P.; Lozej, A.; Chiozzotto, B.; Giada, M.; Rizzetto, F.; Claude, C.; Mayer, A.; et al. Monitoring the saltwater intrusion by time lapse electrical resistivity tomography: The Chioggia test site (Venice Lagoon, Italy). J. Appl. Geophys. 2009, 69, 117–130. [Google Scholar] [CrossRef]
- Viezzoli, A.; Tosi, L.; Teatini, P.; Silvestri, S. Surface water-groundwater exchange in transitional coastal environments by airborne electromagnetics: The Venice Lagoon example. Geophys. Res. Lett. 2010, 37, L01402. [Google Scholar] [CrossRef]
- Teatini, P.; Tosi, L.; Viezzoli, A.; Baradello, L.; Zecchin, M.; Silvestri, S. Understanding the hydrogeology of the Venice Lagoon subsurface with airborne electromagnetics. J. Hydrol. 2011, 411, 342–354. [Google Scholar] [CrossRef]
- Morari, F.; Meggio, F.; Lunardon, A.; Scudiero, E.; Forestan, C.; Farinati, S.; Varotto, S. Time course of biochemical, physiological, and molecular responses to field-mimicked conditions of drought, salinity, and recovery in two maize lines. Front. Plant Sci. 2015, 6, 314. [Google Scholar] [CrossRef]
- Tosi, L.; Da Lio, C.; Donnici, S.; Strozzi, T.; Teatini, P. Vulnerability of Venice’s coastland to relative sea-level rise. Proc. Int. Assoc. Hydrol. Sci. 2020, 382, 689–695. [Google Scholar] [CrossRef]
- Zanchettin, D.; Bruni, S.; Raicich, F.; Lionello, P.; Adloff, F.; Androsov, A.; Antonioli, F.; Artale, V.; Carminati, E.; Ferrarin, C.; et al. Sea-level rise in Venice: Historic and future trends (review article). Nat. Hazards Earth Syst. Sci. 2021, 21, 2643–2678. [Google Scholar] [CrossRef]
- Bondesan, A.; Primon, S.; Bassan, V.; Vitturi, A. Carta delle Unità Geologiche della Provincia di Venezia; Cierre: Verona, Italy, 2008. [Google Scholar]
- Da Lio, C.; Tosi, L.; Zambon, G.; Vianello, A.; Baldin, G.; Lorenzetti, G.; Manfè, G.; Teatini, P. Long-term groundwater dynamics in the coastal confined aquifers of Venice (Italy). Estuar. Coast. Shelf Sci. 2013, 135, 248–259. [Google Scholar] [CrossRef]
- ARPAV Valutazione della permeabilità e del gruppo idrologico dei suoli del Veneto; 2011. Available online: https://www.arpa.veneto.it/temi-ambientali/suolo/file-e-allegati/documenti/minacce-didegradazione/Relazione_permeabilita_Gruppo_Idrologico_giu2011_def.pdf (accessed on 23 December 2021).
- Vitturi, A.; Bassan, V.; Mazzuccato, A.; Primon, S.; Bondesan, A.; Ronchese, F.; Zangheri, P. Atlante Geologico della Provincia di Venezia. Note Illustrative; Provincia di Venezia: Venice, Italy, 2011. [Google Scholar]
- USDA Hydrologic Soil Groups. National Engineering Handbook; U.S. Department of Agriculture, Natural Resources Conservation Service: Washington, DC, USA, 2009; p. 13. [Google Scholar]
- Cressie, N. The origins of kriging. Math. Geol. 1990, 22, 239–252. [Google Scholar] [CrossRef]
- Saaty, T.L. Decision-making with the AHP: Why is the principal eigenvector necessary. Eur. J. Oper. Res. 2003, 145, 85–91. [Google Scholar] [CrossRef]
- Cho, F. Analytic Hierarchy Process for Survey Data in R. Vignettes for the ahpsurvey package (ver 0.4.1). 2019. Available online: https://cran.r-project.org/web/packages/ahpsurvey/vignettes/my-vignette.html (accessed on 23 December 2021).
- Azizi, F.; Vadiati, M.; Asghari, A.; Amirhossein, M.; Jan, N. A hydrogeological-based multi-criteria method for assessing the vulnerability of coastal aquifers to saltwater intrusion. Environ. Earth Sci. 2019, 78, 548. [Google Scholar] [CrossRef]
- Gattacceca, J.C.; Vallet-Coulomb, C.; Mayer, A.; Claude, C.; Radakovitch, O.; Conchetto, E.; Hamelin, B. Isotopic and geochemical characterization of salinization in the shallow aquifers of a reclaimed subsiding zone: The southern Venice Lagoon coastland. J. Hydrol. 2009, 378, 46–61. [Google Scholar] [CrossRef]
- Thywissen, K. Components of Risk: A Comparative Glossary; United Nations University, Institute of Environment and Human Security: Bonn, Germany, 2006; ISBN 3981058208. [Google Scholar]
- Manyena, S.B. The concept of resilience revisited. Disasters 2006, 30, 433–450. [Google Scholar] [CrossRef]


| Hazard status | Indicators | Dataset | Method | Data Source |
|---|---|---|---|---|
| Saline interface depth (SIN) | Electrical resistivity | Airborne Electromagnetic | Tosi et al. [30] | |
| Electrical resistivity of the uppermost subsoil layer (AER) | ||||
| Sensitivity | Distance from saltwater (SAD) and freshwater sources (FRD) | Spatial information | Satellite images | Google Earth, accessed on 31 October 2021 |
| Ground elevation (GEL) | Digital Terrain Model | Lidar | Regione del Veneto * | |
| Permeability of the shallow aquifer (PER) | Permeability of the shallow subsoil | Agriculture and pedology | ARPAV ** | |
| Geomorphological map | Geology, Sedimentology, Geomorphology | Città Metropolitana di Venezia *** | ||
| Potential runoff (ROF) | Hydrologic Soil Groups | Agriculture and pedology | ARPAV **** | |
| Relative ground level change (RGLC) | Ground displacements | SAR interferometry | Tosi et al. [54] | |
| Sea-level time series | Tide gauge time series | Zanchettin et al. [55] |
| SAD m | FRD m | GEL m above MSL | PER mm/h | ROF | RGLC mm/Year | Score |
|---|---|---|---|---|---|---|
| >800 | <100 | >1 | moderately low 0.36–3.6 | low | >−3.5 | 0 |
| 546–800 | 100–300 | 0.0–1.0 | moderately high 3.6–36 | −4.2 to −3.5 | 1 | |
| 300–546 | 300–542 | −0.8 to 0.0 | high 36–360 | moderately low | −4.8 to −4.2 | 2 |
| 100–300 | 542–800 | −2.0 to −0.8 | very high >360 | −6.0 to −4.8 | 3 | |
| <100 | >800 | <−2.0 | moderately high | <−6.0 | 4 |
| SIN m below GL | AER Ωm | Score |
|---|---|---|
| >6.0 | >10.0 | 0 |
| 4.0–6.0 | 8.0–10.0 | 1 |
| 2.5–4.0 | 5.5–8 | 2 |
| 1.5–2.5 | 2.0–5.5 | 3 |
| <1.5 | <2.0 | 4 |
| Sensitivity Indicators | Weight | ||
|---|---|---|---|
| Mean | SD | (%) | |
| SAD | 0.117 | 0.06 | 11.7 |
| FRD | 0.084 | 0.07 | 8.4 |
| GEL | 0.373 | 0.14 | 37.3 |
| RGLC | 0.208 | 0.06 | 20.8 |
| PER | 0.145 | 0.09 | 14.5 |
| ROF | 0.073 | 0.01 | 7.3 |
| Present Study | Da Lio et al. [29] | |
|---|---|---|
| Target | A specific farmland system by referring to the subsurface layer that includes the agricultural zone and the underneath shallow subsoil up to 3–4 m depth | Generic farmlands taking into account the phreatic aquifer up to 10 m depth |
| Sensitivity indicators | Distance from salt- and freshwater sources (100 and 800 m are considered as likely the minimum and maximum distances influencing the sensitivity of the farmland system); Ground elevation; Permeability of the shallow aquifer; Potential runoff; Relative ground level change | Distance from salt- and freshwater sources (500 and 4000 m were considered as likely the minimum and maximum distances influencing the sensitivity of farmlands); ground elevation |
| Hazard indicators | Saline interface depth; electrical resistivity of the uppermost subsoil layer (1.5 m thick), which includes unsatured and satured agricultural soils | Electrical conductivity detected in wells screened at depths between 2 and 10 m below ground level or taking into account the worst condition in wells with the entire length screened where the water is density-stratified in the water column |
Publisher’s Note: MDPI stays neutral with regard to jurisdictional claims in published maps and institutional affiliations. |
© 2021 by the authors. Licensee MDPI, Basel, Switzerland. This article is an open access article distributed under the terms and conditions of the Creative Commons Attribution (CC BY) license (https://creativecommons.org/licenses/by/4.0/).
Share and Cite
Tosi, L.; Da Lio, C.; Bergamasco, A.; Cosma, M.; Cavallina, C.; Fasson, A.; Viezzoli, A.; Zaggia, L.; Donnici, S. Sensitivity, Hazard, and Vulnerability of Farmlands to Saltwater Intrusion in Low-Lying Coastal Areas of Venice, Italy. Water 2022, 14, 64. https://doi.org/10.3390/w14010064
Tosi L, Da Lio C, Bergamasco A, Cosma M, Cavallina C, Fasson A, Viezzoli A, Zaggia L, Donnici S. Sensitivity, Hazard, and Vulnerability of Farmlands to Saltwater Intrusion in Low-Lying Coastal Areas of Venice, Italy. Water. 2022; 14(1):64. https://doi.org/10.3390/w14010064
Chicago/Turabian StyleTosi, Luigi, Cristina Da Lio, Alessandro Bergamasco, Marta Cosma, Chiara Cavallina, Andrea Fasson, Andrea Viezzoli, Luca Zaggia, and Sandra Donnici. 2022. "Sensitivity, Hazard, and Vulnerability of Farmlands to Saltwater Intrusion in Low-Lying Coastal Areas of Venice, Italy" Water 14, no. 1: 64. https://doi.org/10.3390/w14010064
APA StyleTosi, L., Da Lio, C., Bergamasco, A., Cosma, M., Cavallina, C., Fasson, A., Viezzoli, A., Zaggia, L., & Donnici, S. (2022). Sensitivity, Hazard, and Vulnerability of Farmlands to Saltwater Intrusion in Low-Lying Coastal Areas of Venice, Italy. Water, 14(1), 64. https://doi.org/10.3390/w14010064