
Deep Learning Based Approach to Classify Saline Particles in Sea Water

 ,
,  ,
,  , and
, and
Abstract
1. Introduction
- Objectives:
- Contaminants such as salt particles present in water cause hardness and make it unfit for consumption. Identifying saline particles in the water will help water treatment plants treat water effectively with high performance.
- The proposed approach aims to target seawater, a rich source of salt particles, using a deep learning system.
- The presented study involves experimentation and the analysis of different saltwater concentrations to provide the system’s robustness against high saline concentrations.
- The proposed work is evaluated using various classification measuring metrics such as precision, recall, accuracy scores, etc.
- Conventional water treatment plants are less accurate and efficient in treating seawater. Integrating the proposed framework with water treatment plants can boost their operational and functional capabilities, resulting in a better seawater treatment process.
2. Literature Work
3. Research Methodology
| Algorithm 1 |
| Step 1: Salinity captured images are taken as input. Step 2: Images are divided into training and testing of 7:3 proportion. Step 3: Transfer learning based VGG16 deep learning model for salinity particles classification is designed with 19 weighted layers. Step 4: Classification for 10 salt concentration particles is evaluated. Step 5: Results are plotted using various performance ML based parameters. Predictive analysis is done with other ML models. |
3.1. Sample Preparation
3.2. Stage 1: Experimental Analysis
3.3. Stage 2: Classification of Concentration of Saline Particles
4. Experimental Results and Discussion
- True Positives (Tp)—This evaluates to true if the actual class labels match with the predicted class labels.
- True Negatives (Tn)—This evaluates to false if the actual class labels match with the predicted class labels.
- False Positives (Fp) and False Negatives (Fn)—These parameters signify that the actual class labels do not comply with the class predicted by the model or vice-versa.
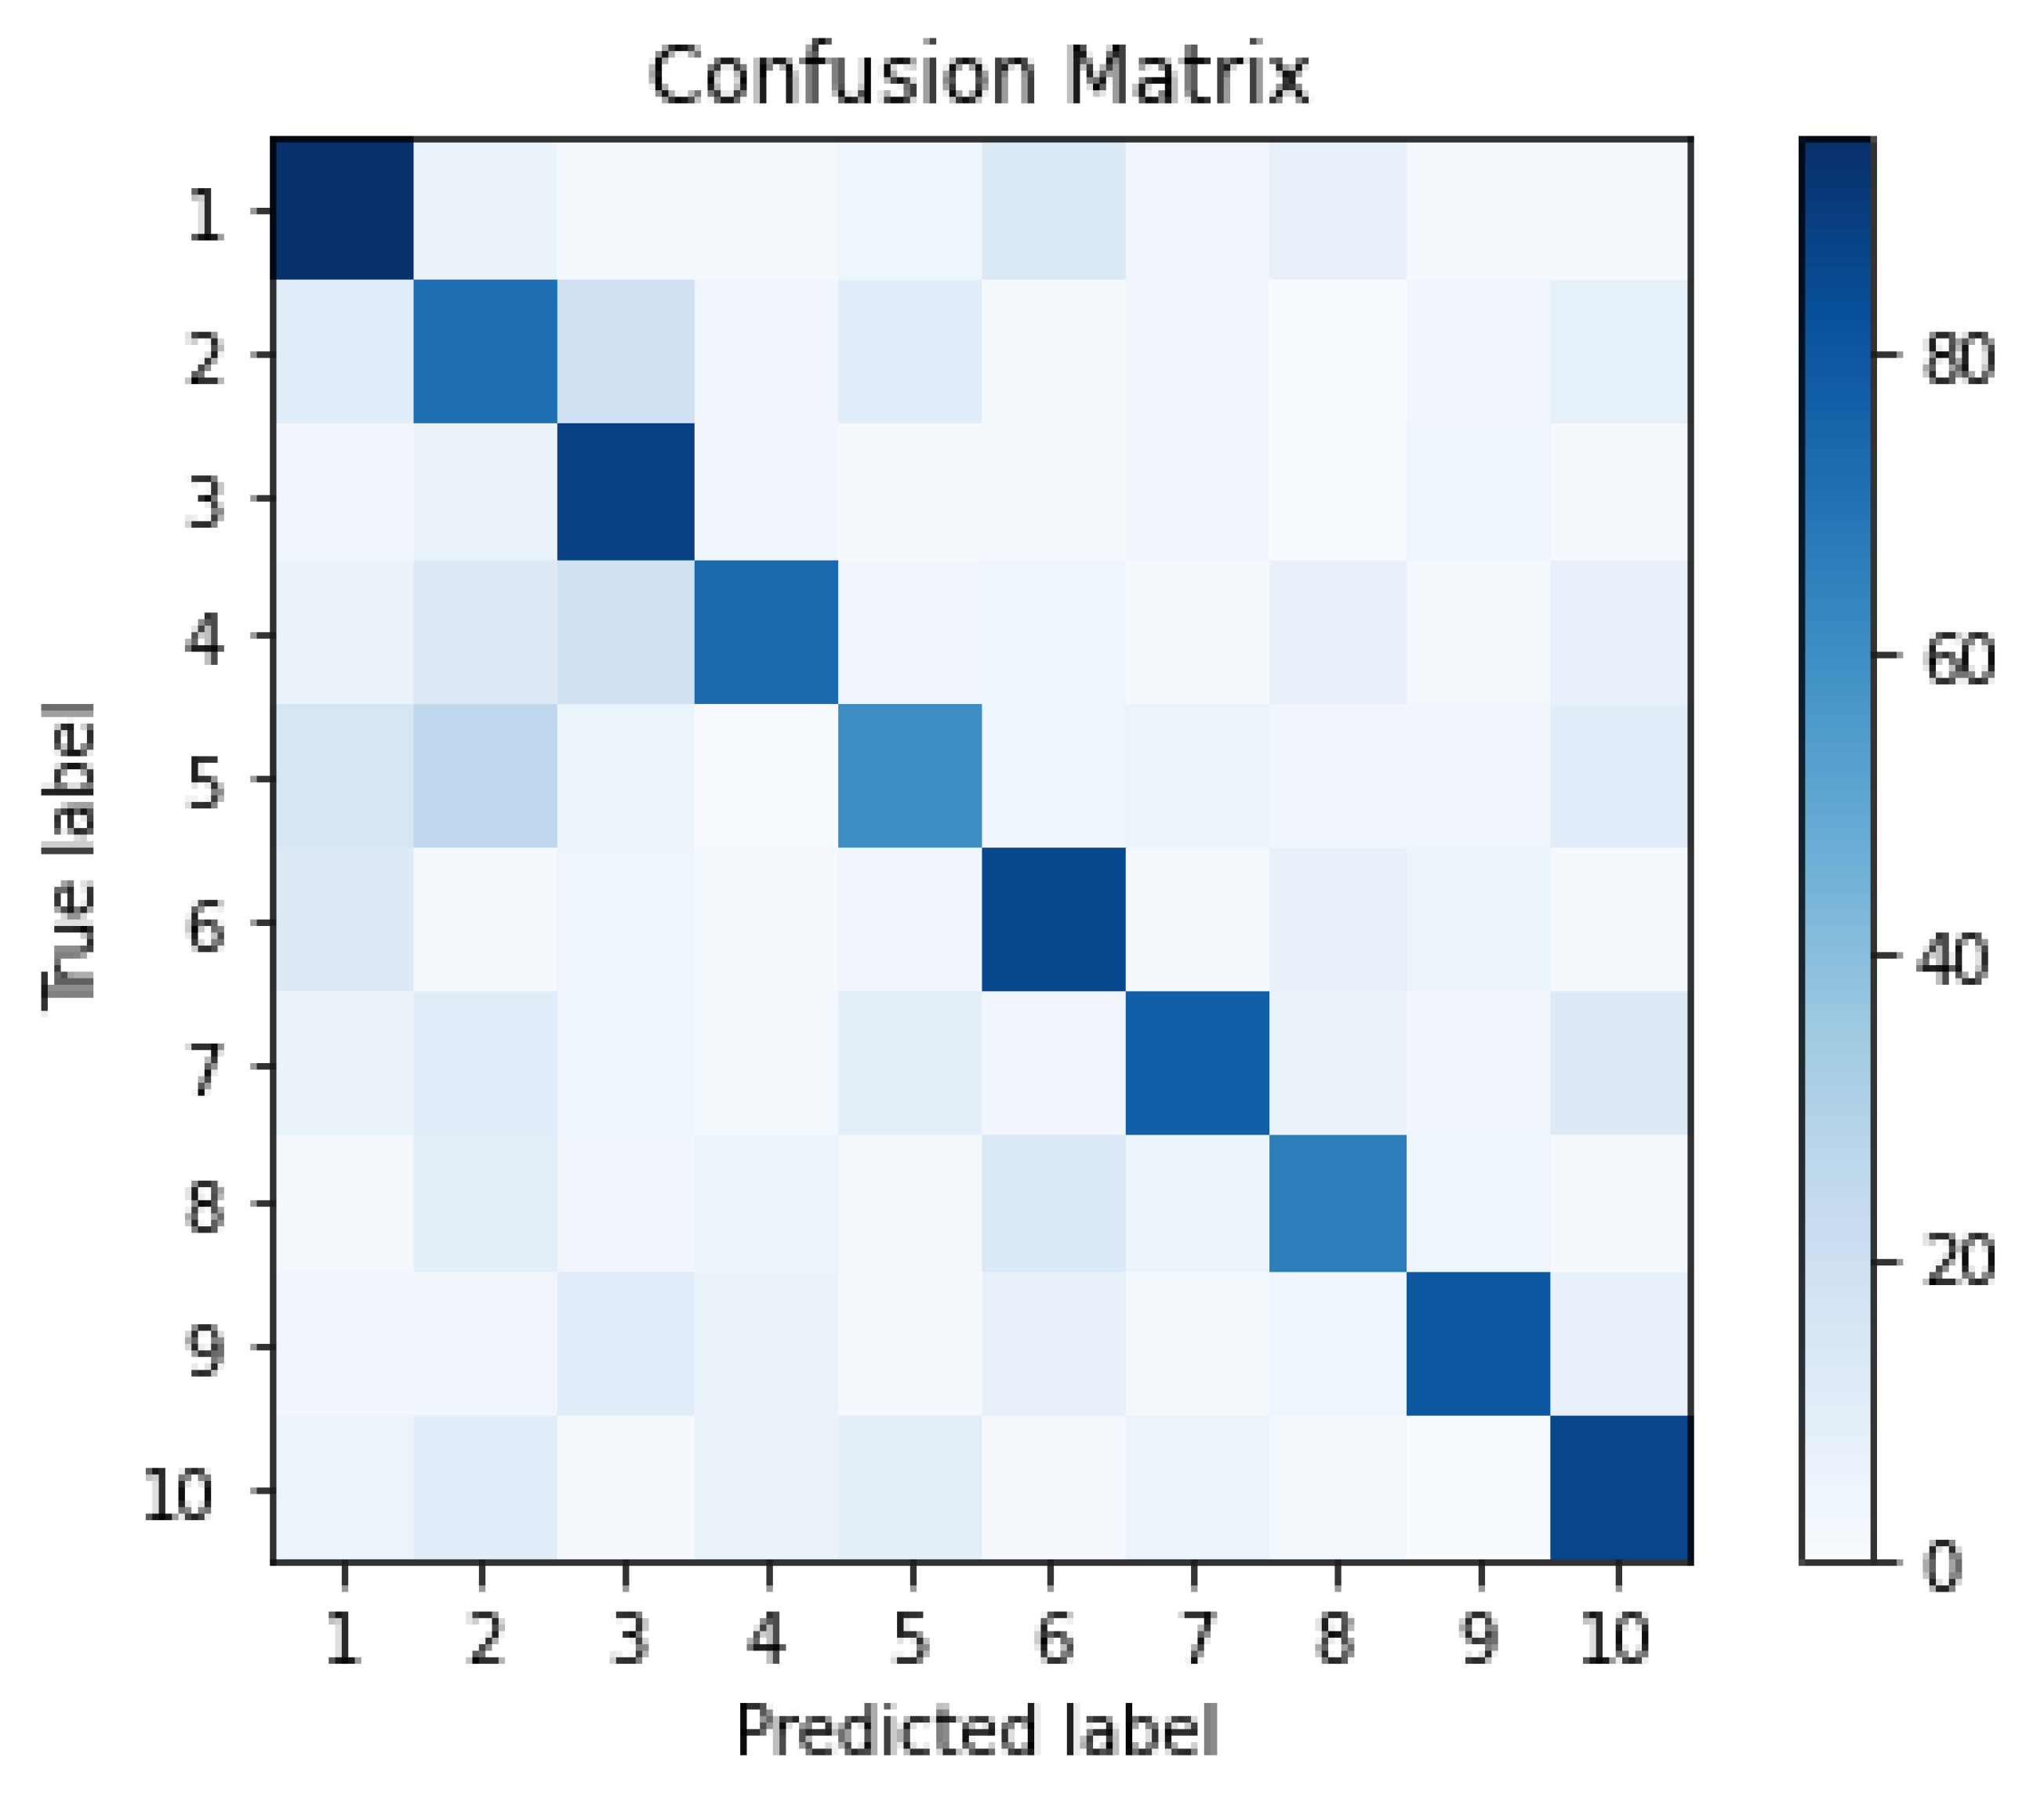
- Confusion Matrix
- Precision
- Recall
- F-Score
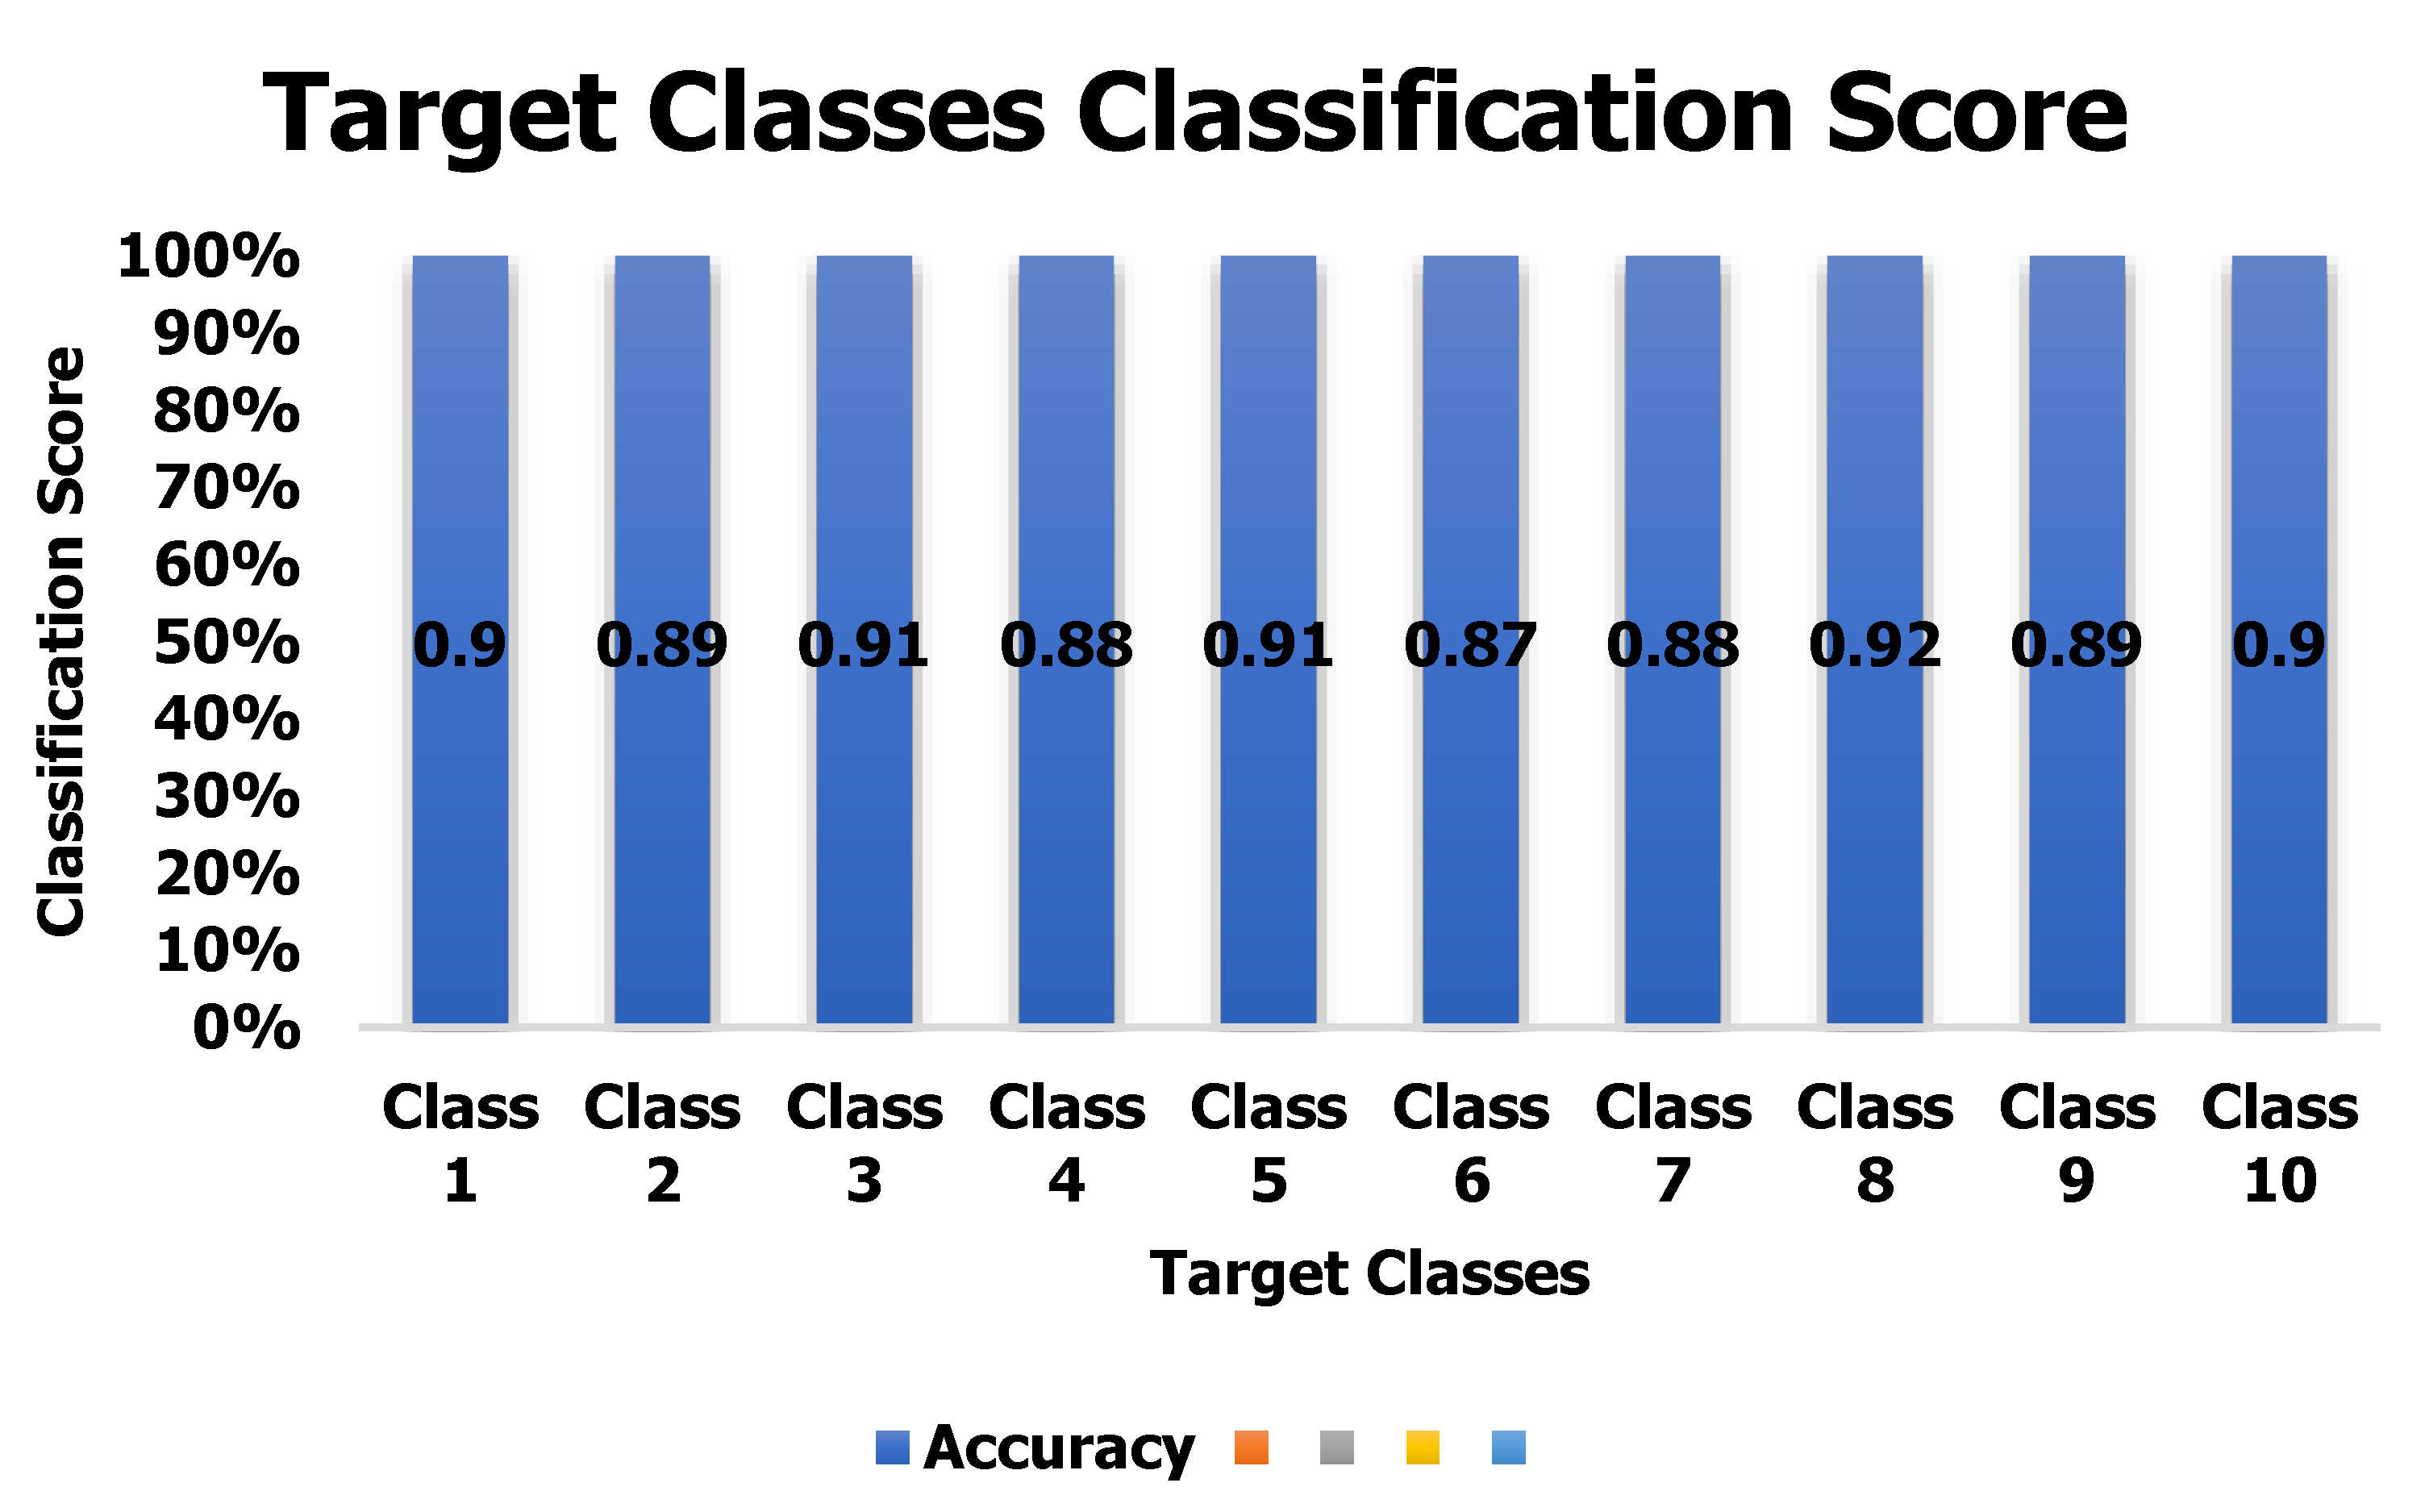
- Accuracy
- Specificity
Discussion
5. Conclusions and Future Works
Author Contributions
Funding
Institutional Review Board Statement
Informed Consent Statement
Conflicts of Interest
References
- Patil, V.C.; Al-Gaadi, K.A.; Madugundu, R.; Tola, E.H.M.; Marey, S.; Aldosari, A.; Biradar, C.M.; Gowda, P.H. Assessing Agricultural Water Productivity in Desert Farming System of Saudi Arabia. IEEE J. Sel. Top. Appl. Earth Obs. Remote Sens. 2014, 8, 284–297. [Google Scholar] [CrossRef]
- Pivokonsky, M.; Cermakova, L.; Novotna, K.; Peer, P.; Cajthaml, T.; Janda, V. Occurrence of microplastics in raw and treated drinking water. Sci. Total Environ. 2018, 643, 1644–1651. [Google Scholar] [CrossRef]
- Bhojwani, S.; Topolski, K.; Mukherjee, R.; Sengupta, D.; El-Halwagi, M.M. Technology review and data analysis for cost assessment of water treatment systems. Sci. Total Environ. 2019, 651, 2749–2761. [Google Scholar] [CrossRef] [PubMed]
- Ghernaout, D. Increasing Trends Towards Drinking Water Reclamation from Treated Wastewater. World J. Appl. Chem. 2017, 3, 1. [Google Scholar] [CrossRef]
- Liponi, A.; Wieland, C.; Baccioli, A. Multi-effect distillation plants for small-scale seawater desalination: Thermodynamic and economic improvement. Energy Convers. Manag. 2020, 205, 112337. [Google Scholar] [CrossRef]
- Liu, S.; Wang, Z.; Han, M.; Wang, G.; Hayat, T.; Chen, G. Energy-water nexus in seawater desalination project: A typical water production system in China. J. Clean. Prod. 2021, 279, 123412. [Google Scholar] [CrossRef]
- Khan, M.S.; Lal, B.; Sabil, K.M.; Ahmed, I. Desalination of Seawater through Gas Hydrate Process: An Overview. J. Adv. Res. Fluid Mech. Therm. Sci. 2019, 55, 65–73. [Google Scholar]
- Pistocchi, A.; Bleninger, T.; Breyer, C.; Caldera, U.; Dorati, C.; Ganora, D.; Millán, M.; Paton, C.; Poullis, D.; Herrero, F.S.; et al. Can seawater desalination be a win-win fix to our water cycle? Water Res. 2020, 182, 115906. [Google Scholar] [CrossRef] [PubMed]
- Melesse, A.M.; Khosravi, K.; Tiefenbacher, J.P.; Heddam, S.; Kim, S.; Mosavi, A.; Pham, B.T. River Water Salinity Prediction Using Hybrid Machine Learning Models. Water 2020, 12, 2951. [Google Scholar] [CrossRef]
- Banerjee, P.; Singh, V.; Chatttopadhyay, K.; Chandra, P.; Singh, B. Artificial neural network model as a potential alternative for groundwater salinity forecasting. J. Hydrol. 2011, 398, 212–220. [Google Scholar] [CrossRef]
- Barzegar, R.; Moghaddam, A.A. Combining the advantages of neural networks using the concept of committee machine in the groundwater salinity prediction. Model. Earth Syst. Environ. 2016, 2, 26. [Google Scholar] [CrossRef]
- Azad, A.; Karami, H.; Farzin, S.; Mousavi, S.-F.; Kisi, O. Modeling river water quality parameters using modified adaptive neuro fuzzy inference system. Water Sci. Eng. 2019, 12, 45–54. [Google Scholar] [CrossRef]
- Duong, H.C.; Cooper, P.; Nelemans, B.; Cath, T.Y.; Nghiem, L.D. Evaluating energy consumption of air gap membrane distillation for seawater desalination at pilot scale level. Sep. Purif. Technol. 2016, 166, 55–62. [Google Scholar] [CrossRef]
- Doornbusch, G.; van der Wal, M.; Tedesco, M.; Post, J.; Nijmeijer, K.; Borneman, Z. Multistage electrodialysis for desalination of natural seawater. Desalination 2021, 505, 114973. [Google Scholar] [CrossRef]
- Hussain, I.; Das, M.; Ahamad, K.U.; Nath, P. Water salinity detection using a smartphone. Sens. Actuators B Chem. 2017, 239, 1042–1050. [Google Scholar] [CrossRef]
- Tufa, R.A.; Noviello, Y.; Di Profio, G.; Macedonio, F.; Ali, A.; Drioli, E.; Fontananova, E.; Bouzek, K.; Curcio, E. Integrated membrane distillation-reverse electrodialysis system for energy-efficient seawater desalination. Appl. Energy 2019, 253, 113551. [Google Scholar] [CrossRef]
- Maia, C.B.; Silva, F.V.; Oliveira, V.L.; Kazmerski, L.L. An overview of the use of solar chimneys for desalination. Sol. Energy 2019, 183, 83–95. [Google Scholar] [CrossRef]
- Suwaileh, W.; Johnson, D.; Hilal, N. Membrane desalination and water re-use for agriculture: State of the art and future outlook. Desalination 2020, 491, 114559. [Google Scholar] [CrossRef]
- Alkhudhiri, A.; Bin Darwish, N.; Hilal, N. Analytical and forecasting study for wastewater treatment and water resources in Saudi Arabia. J. Water Process. Eng. 2019, 32, 100915. [Google Scholar] [CrossRef]
- Mansouri, N.Y.; Ghoniem, A.F. Does nuclear desalination make sense for Saudi Arabia? Desalination 2017, 406, 37–43. [Google Scholar] [CrossRef]
- Pan, S.-Y.; Haddad, A.Z.; Kumar, A.; Wang, S.-W. Brackish water desalination using reverse osmosis and capacitive deionization at the water-energy nexus. Water Res. 2020, 183, 116064. [Google Scholar] [CrossRef]
- De Medeiros, J.F.; Lisboa, R.D.A.; De Oliveira, M.; da Silva Júnior, M.J.; Alves, L.P. Caracterização das águas subterrâneas usadas para irrigação na área produtora de melão da Chapada do Apodi. Rev. Bras. Eng. Agríc. Ambient. 2003, 7, 469–472. [Google Scholar] [CrossRef]
- Rose, L.; Mary, X.A. Sensor data classification using machine learning algorithm. J. Stat. Manag. Syst. 2020, 23, 363–371. [Google Scholar] [CrossRef]
- Taheran, M.; Brar, S.K.; Verma, M.; Surampalli, R.; Zhang, T.; Valero, J. Membrane processes for removal of pharmaceutically active compounds (PhACs) from water and wastewaters. Sci. Total Environ. 2016, 547, 60–77. [Google Scholar] [CrossRef] [PubMed]
- Huang, H.; Zhou, H.; Yang, X.; Zhang, L.; Qi, L.; Zang, A.-Y. Faster R-CNN for marine organisms detection and recognition using data augmentation. Neurocomputing 2019, 337, 372–384. [Google Scholar] [CrossRef]
- Aggarwal, A.; Kumar, M. Image surface texture analysis and classification using deep learning. Multimed. Tools Appl. 2021, 80, 1289–1309. [Google Scholar] [CrossRef]
- Aggarwal, A.; AlShehri, M.; Kumar, M.; Alfarraj, O.; Sharma, P.; Pardasani, K.R. Landslide data analysis using various time-series forecasting models. Comput. Electr. Eng. 2020, 88, 106858. [Google Scholar] [CrossRef]
- Aggarwal, A.; Alshehri, M.; Kumar, M.; Sharma, P.; Alfarraj, O.; Deep, V. Principal component analysis, hidden Markov model, and artificial neural network inspired techniques to recognize faces. Concurr. Comput. Pract. Exp. 2021, 33, e6157. [Google Scholar] [CrossRef]
- Aggarwal, A.; Rani, A.; Kumar, M. A robust method to authenticate car license plates using segmentation and ROI based approach. Smart Sustain. Built Environ. 2019, 9, 737–747. [Google Scholar] [CrossRef]
- Chen, Y.; Fan, R.; Yang, X.; Wang, J.; Latif, A. Extraction of Urban Water Bodies from High-Resolution Remote-Sensing Imagery Using Deep Learning. Water 2018, 10, 585. [Google Scholar] [CrossRef]
- Hu, C.; Wu, Q.; Li, H.; Jian, S.; Li, N.; Lou, Z. Deep Learning with a Long Short-Term Memory Networks Approach for Rainfall-Runoff Simulation. Water 2018, 10, 1543. [Google Scholar] [CrossRef]
- Chatterjee, A.; Hu, X.; Lam, F.L.-Y. Modified coal fly ash waste as an efficient heterogeneous catalyst for dehydration of xylose to furfural in biphasic medium. Fuel 2019, 239, 726–736. [Google Scholar] [CrossRef]
- Shah, D.; Haradi, V. IoT Based Biometrics Implementation on Raspberry Pi. Procedia Comput. Sci. 2016, 79, 328–336. [Google Scholar] [CrossRef]
- Hajji, W.; Tso, F.P. Understanding the Performance of Low Power Raspberry Pi Cloud for Big Data. Electronics 2016, 5, 29. [Google Scholar] [CrossRef]
- Simonyan, K.; Zisserman, A. Very deep convolutional networks for large-scale image recognition. arXiv 2015, arXiv:1409.1556. Available online: http://arxiv.org/abs/1409.1556 (accessed on 18 March 2021).
- Russakovsky, O.; Deng, J.; Su, H.; Krause, J.; Satheesh, S.; Ma, S.; Huang, Z.; Karpathy, A.; Khosla, A.; Bernstein, M.; et al. ImageNet Large Scale Visual Recognition Challenge. Int. J. Comput. Vis. 2015, 115, 211–252. [Google Scholar] [CrossRef]
- Hosseini, F.S.; Choubin, B.; Mosavi, A.; Nabipour, N.; Shamshirband, S.; Darabi, H.; Haghighi, A.T. Flash-flood hazard assessment using ensembles and Bayesian-based machine learning models: Application of the simulated annealing feature selection method. Sci. Total Environ. 2019, 711, 135161. [Google Scholar] [CrossRef] [PubMed]
- Gelman, A.; Pardoe, I. Bayesian Measures of Explained Variance and Pooling in Multilevel (Hierarchical) Models. University Library of Munich, Germany. April 2004. Available online: https://ideas.repec.org/p/wpa/wuwpem/0404002.html (accessed on 24 March 2021).
- Mosavi, A.; Hosseini, F.S.; Choubin, B.; Goodarzi, M.; Dineva, A.A. Groundwater Salinity Susceptibility Mapping Using Classifier Ensemble and Bayesian Machine Learning Models. IEEE Access 2020, 8, 145564–145576. [Google Scholar] [CrossRef]
- Vermeulen, D.; Van Niekerk, A. Machine learning performance for predicting soil salinity using different combinations of geomorphometric covariates. Geoderma 2017, 299, 1–12. [Google Scholar] [CrossRef]
- Ivushkin, K.; Bartholomeus, H.; Bregt, A.K.; Pulatov, A.; Kempen, B.; de Sousa, L. Global mapping of soil salinity change. Remote Sens. Environ. 2019, 231, 111260. [Google Scholar] [CrossRef]
- Alshehri, M.; Bhardwaj, A.; Kumar, M.; Mishra, S.; Gyani, J. Cloud and IoT based smart architecture for desalination water treatment. Environ. Res. 2021, 195, 110812. [Google Scholar] [CrossRef] [PubMed]
- Muharemi, F.; Logofătu, D.; Leon, F. Machine learning approaches for anomaly detection of water quality on a real-world data set. J. Inf. Telecommun. 2019, 3, 294–307. [Google Scholar] [CrossRef]


| Classes | Range (in ppt) |
|---|---|
| 1 | 0–10 |
| 2 | 10–20 |
| 3 | 20–30 |
| 4 | 30–40 |
| 5 | 40–50 |
| 6 | 50–60 |
| 7 | 60–70 |
| 8 | 70–80 |
| 9 | 80–90 |
| 10 | 90–100 |
| Type of Transformation | Value |
|---|---|
| Rotation | 20 |
| Zooming | 0.2 |
| Width Shifting | 0.2 |
| Height Shifting | 0.2 |
| Rescaling | 1.0/255 |
| Sample wise Centering | True |
| Horizontal Flipping | True |
| Parameter Name | Default Value |
|---|---|
| 0.001 | |
| 0.9 | |
| 0.999 | |
| 10−8 |
| Model Parameters | Values |
|---|---|
| Optimization Algorithm | Adam |
| Learning Rate | 1 × 10⁻⁵ |
| Epochs | 600 |
| Loss Function | Categorical Cross Entropy |
| Batch Size | 32 |
| Final Activation Function | Softmax |
| Steps Per Epoch | Batch Size |
| Validation Steps | Batch Size/2 |
| Statistics | Bayesian Generalized Linear Model [37] | Rotation Forest [38] | Proposed Model |
|---|---|---|---|
| Accuracy | 87.6% | 87.6% | 90% |
| Kappa | 0.81 | 0.81 | 0.83 |
| Salinity Prediction Approaches | Accuracy (%) |
|---|---|
| Classifier Ensemble + Bayesian Learning (Mosavi, Hosseini, Choubin, Goodarzi, & Dineva, 2020) [39] | 86.7 |
| Decision Tree (Vermeulen & Niekerk, 2017) [40] | 75 |
| Random Forest (Ivushkin et al., 2019) [41] | 70 |
| Proposed Approach | 90 |
Publisher’s Note: MDPI stays neutral with regard to jurisdictional claims in published maps and institutional affiliations. |
© 2021 by the authors. Licensee MDPI, Basel, Switzerland. This article is an open access article distributed under the terms and conditions of the Creative Commons Attribution (CC BY) license (https://creativecommons.org/licenses/by/4.0/).
Share and Cite
Alshehri, M.; Kumar, M.; Bhardwaj, A.; Mishra, S.; Gyani, J. Deep Learning Based Approach to Classify Saline Particles in Sea Water. Water 2021, 13, 1251. https://doi.org/10.3390/w13091251
Alshehri M, Kumar M, Bhardwaj A, Mishra S, Gyani J. Deep Learning Based Approach to Classify Saline Particles in Sea Water. Water. 2021; 13(9):1251. https://doi.org/10.3390/w13091251
Chicago/Turabian StyleAlshehri, Mohammed, Manoj Kumar, Akashdeep Bhardwaj, Shailendra Mishra, and Jayadev Gyani. 2021. "Deep Learning Based Approach to Classify Saline Particles in Sea Water" Water 13, no. 9: 1251. https://doi.org/10.3390/w13091251
APA StyleAlshehri, M., Kumar, M., Bhardwaj, A., Mishra, S., & Gyani, J. (2021). Deep Learning Based Approach to Classify Saline Particles in Sea Water. Water, 13(9), 1251. https://doi.org/10.3390/w13091251