1. Introduction
Groundwater is an important component of water resources and acts as a large natural “reservoir” that supplies water even in conditions of low surface water availability (i.e., dry season or interannual periods of prolonged drought). Using the WaterGAP Global Hydrology Model, global groundwater recharge was estimated at 12,666 km
3/a during 1961–1990 under normal climate conditions, accounting for 32% of the total renewable water resources [
1]. In 2017, China’s total groundwater resources accounted for 28.89% of its total water resources, and groundwater supply accounted for 16.82% of its total water supply. However, groundwater pollution is a serious problem in China [
2]. In 2019, among the 10,168 state-level groundwater quality monitoring sites in China, 14.4% were classified as category 1 to 3, 66.9% as category 4, and 18.8% as category 5. The above standard indices were based on Mn, Total hardness (TH), I, Total Dissolved Solids (TDS), Ferrum (Fe), Fluoride ion(F
−), Ammonia nitrogen (NH
4+–N), Sodium ion (Na
+), Sulfate ion (SO
42−), and Chloride ion (Cl
−) [
3]. On the basis of the groundwater quality standards, groundwaters of categories 4 and 5 are not safe for drinking without treatment.
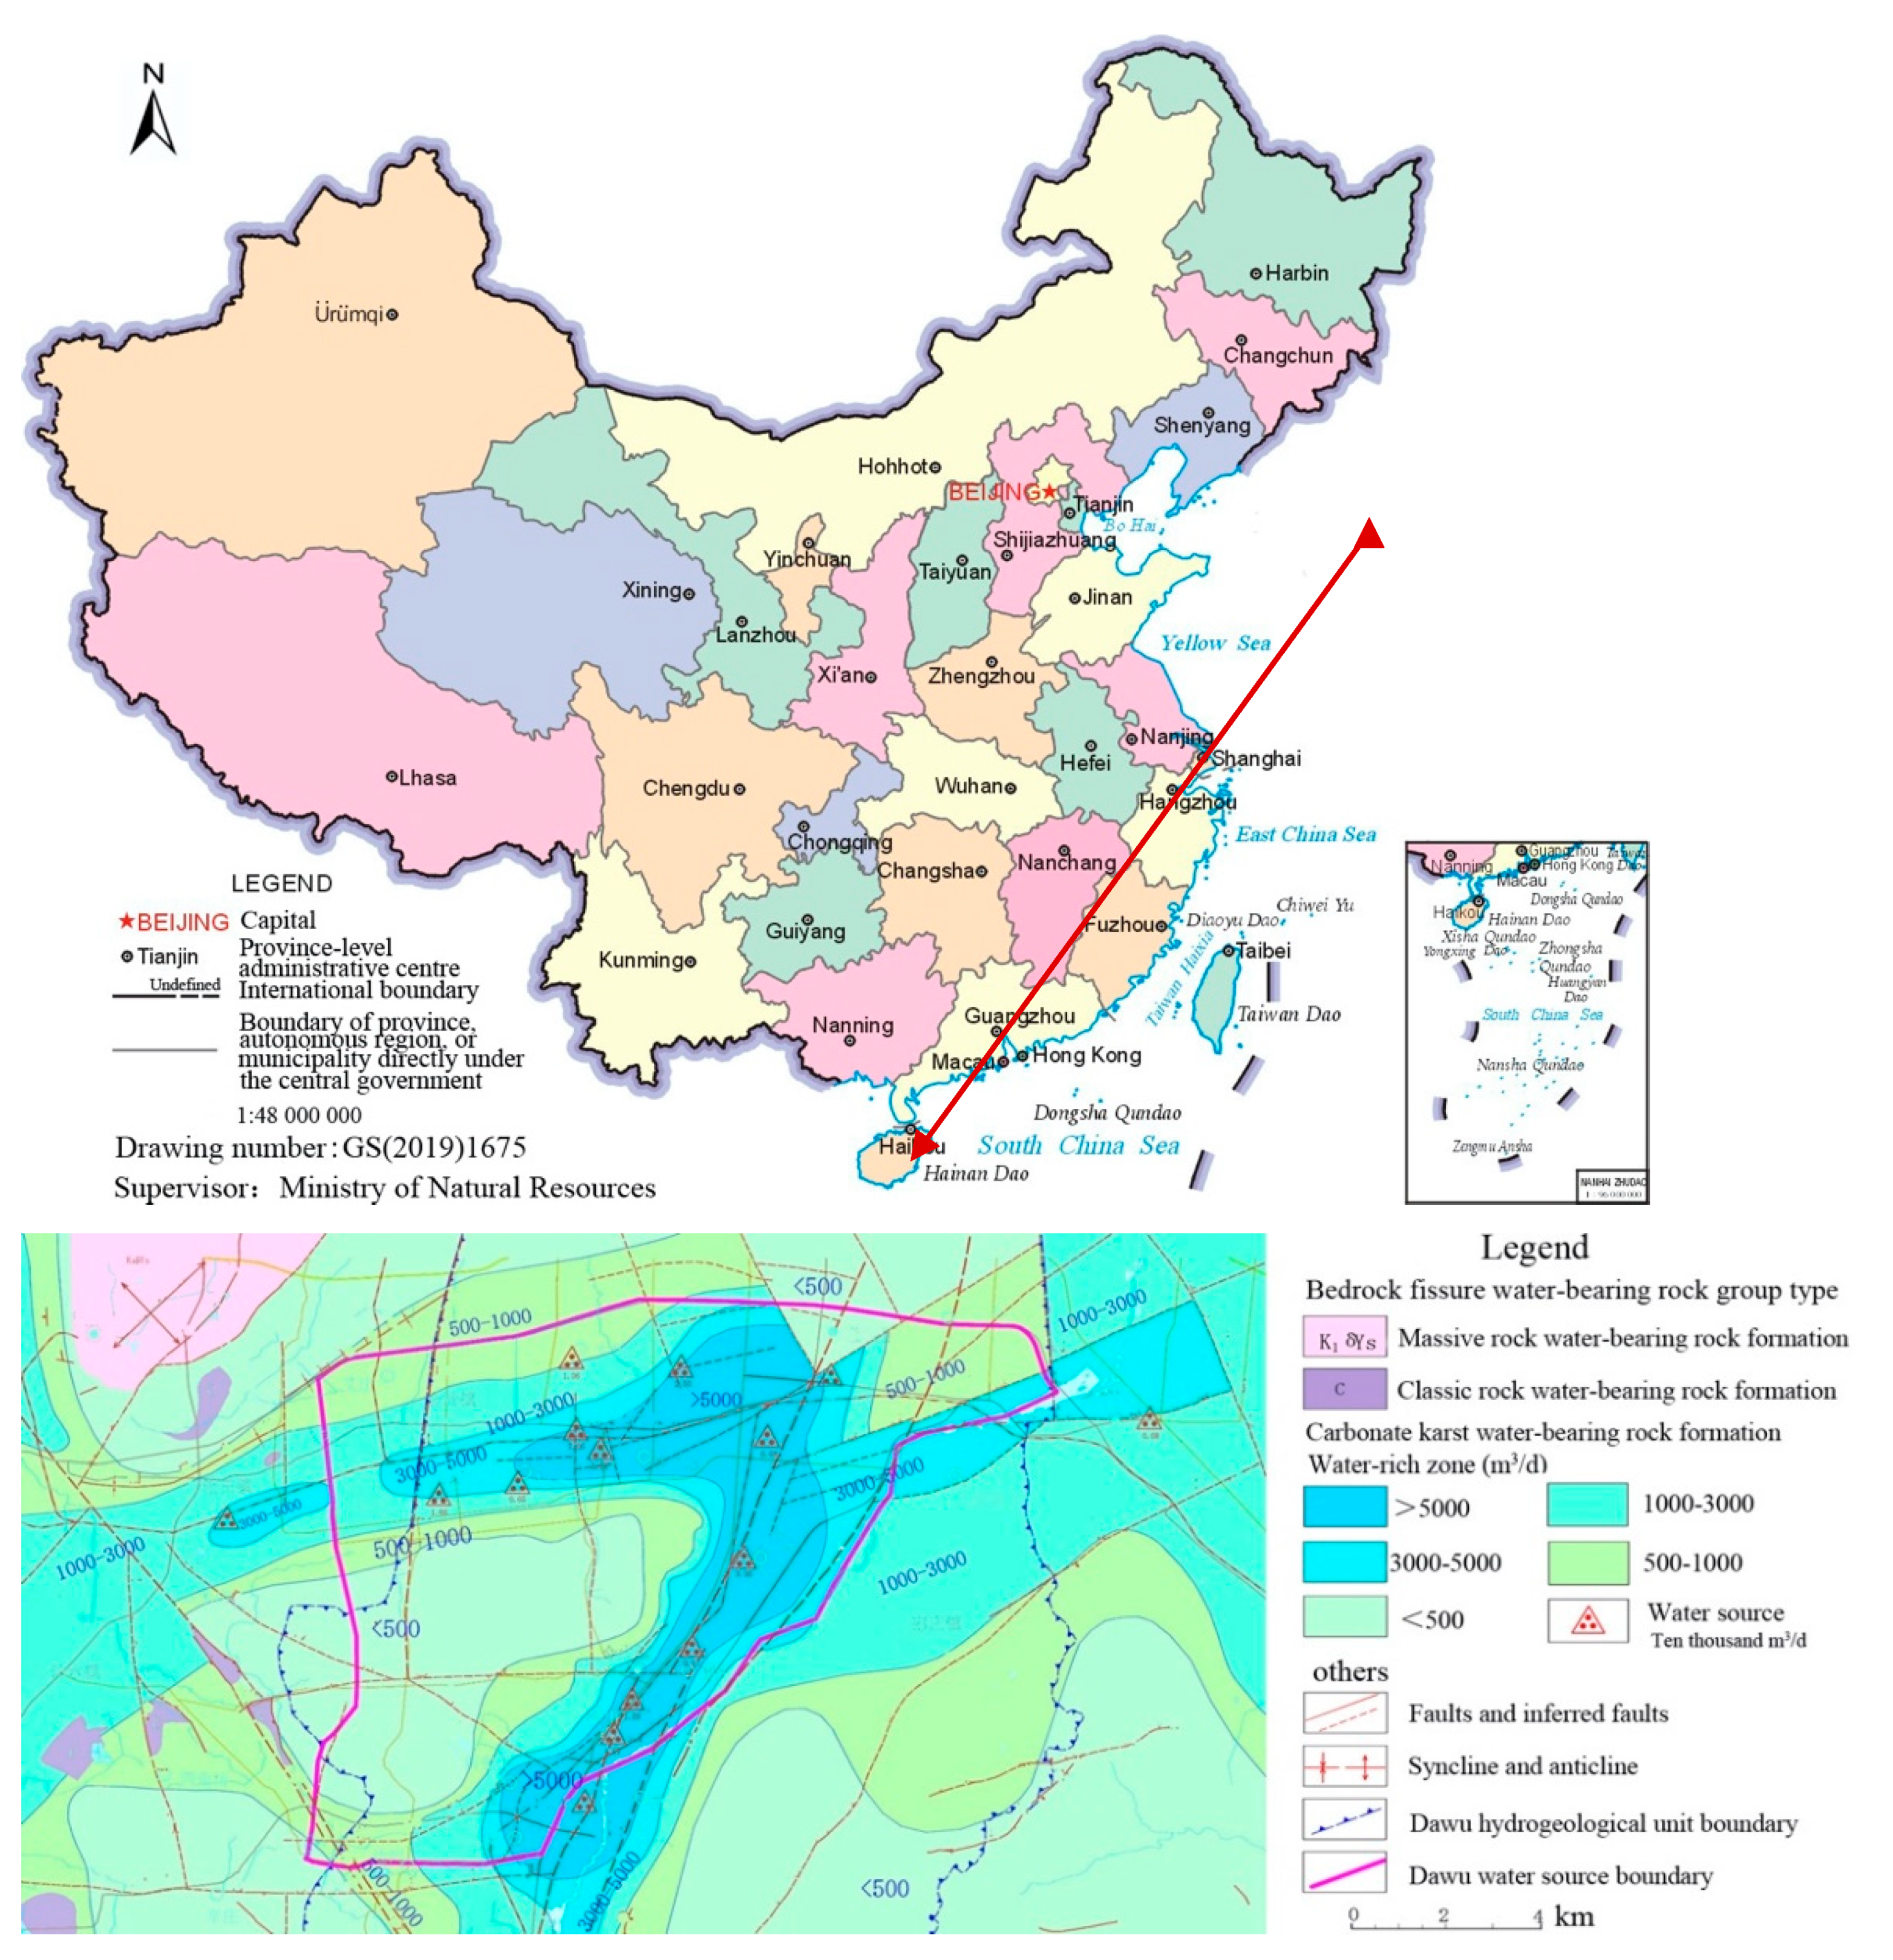
The Dawu water source area is located in the groundwater gathering area of the Dawu hydrogeological unit, covering approximately 148 km
2. It is an important water source for sustaining the livelihood of approximately one million people and the industrial and agricultural development of Zibo City [
4]. As the only super-large karst water source in Shandong Province, Central China, and a rare super-large karst water source in North China, its groundwater has been intensely exploited. Conforming to the survey report of Shandong Geological Survey Institute in 2018, the maximum exploitation has been 504,500 m
3/d since the large-scale centralized development in the middle and late 1970s. During groundwater exploitation, a series of problems, such as groundwater environmental pollution by petroleum processing enterprises, have gained the attention of relevant local departments. In recent years, researchers have analyzed the quality of groundwater in the Dawu water source area and found that the rate of organic pollutants exceeded the standards by 13.89%, indicating serious organic pollution.
The quality of groundwater affects human activities and health; therefore, it is necessary to scientifically evaluate the quality of groundwater. The traditional method of evaluating water quality by measuring its chemical parameters and comparing these with the existing standards is simple but cannot accurately describe the water quality [
5]. Horton defined the water quality index (WQI) according to the weighted relative importance of eight water quality parameters [
6,
7,
8,
9,
10,
11,
12,
13]. Brown et al. has given the steps of the Weight Arithmetic Water Quality Index (WAWQI) [
14]. An improved version of National Sanitation Foundation water quality index (Hereinafter referred to as “NSFWQI”) was proposed by Brown et al. (1973) with the support of the National Sanitation Foundation (NSF) in the United States, wherein parameter selection was based on the Delphi technology by RAND Corporation [
15,
16,
17]. In Canada, British Columbia introduced a new Water Quality Index in the mid-1990s as British Columbia Water Quality Index (BCWQI), and the Water Quality Guidelines Working Group of the Council of Canadian Ministers of the Environment (CCME), recognizing the need to assess the suitability of water for different uses, revised the index in 2001 to become known as the Canadian Council of Ministers of the Environment Water Quality Index (CCME WQI) [
17]. The groundwater quality index (GWQI) for groundwater quality was first derived by Backman et al. in 1998 [
17,
18]. Subsequently, researchers have globally developed and used WQI technology, but the parameter selection and weight determination were primarily conducted using the Delphi method, which is subjective and random; the use of statistical multivariate analysis technology has been limited [
17]. Mahapatra et al. proposed a groundwater quality classification method by measuring the Euclidean distance matrix as an input to Q-mode principal component analysis (PCA) [
19]. Fathy et al. evaluated the water quality of three sites along the Alexandria coast in Egypt using principal component analysis (PCA) approach to develop water quality index [
20]. In Yotova’s study, a new method combining water quality index (WQI) and self-organizing map (SOM) was proposed to evaluate surface water quality in a specific watershed [
21]. In the research on the application of multivariate statistical analysis technology, the scientific application of principal component analysis (PCA) and other methods using the WQI, as well as a comparative study with that of the Delphi method, are lacking. In groundwater evaluation, the focus is primarily laid on general chemical parameters, such as Total Dissolved Solids (TDS), hydrogen ion concentration(pH), Electrical Conductivity (EC), and heavy metals such as Hydrargyrum (Hg), Arsenic (As), and Chromium (Cr), with limited consideration for organic pollutants [
18]. Previous studies on the application of WQI technology in groundwater quality analysis in China are few, and the application of groundwater environmental quality assessment in the Dawu water source area has not yet been reported.
In this study, the full index method, Delphi method, principal component analysis (PCA) approach combined with entropy weight assignment method were adopted to develop WQI technology; the groundwater environment quality of Dawu water source area was evaluated, and the results were compared; the scientific basis of the multivariate statistical analysis method in the process of index selection was verified, and the groundwater pollution situation of the Dawu water source area was analyzed to provide a theoretical basis for sustainable development of the area.
2. Materials and Methods
The Dawu water source area is located at 36°30′31′′–36°51′12′′ N, 118°02′16′′–118°26′55′′ E, Linzi District, Zibo City, Shandong Province, China. It includes a part of Fengshui Town in Zhangdian District in the west, parts of the northeastern towns in Zichuan District in the south, and the western part of Qingzhou District in Weifang City in the east. The terrain slope gradually decreases from the south of the low hills to the northern piedmont slope plain.
Figure 1 shows the location of the Dawu water source area.
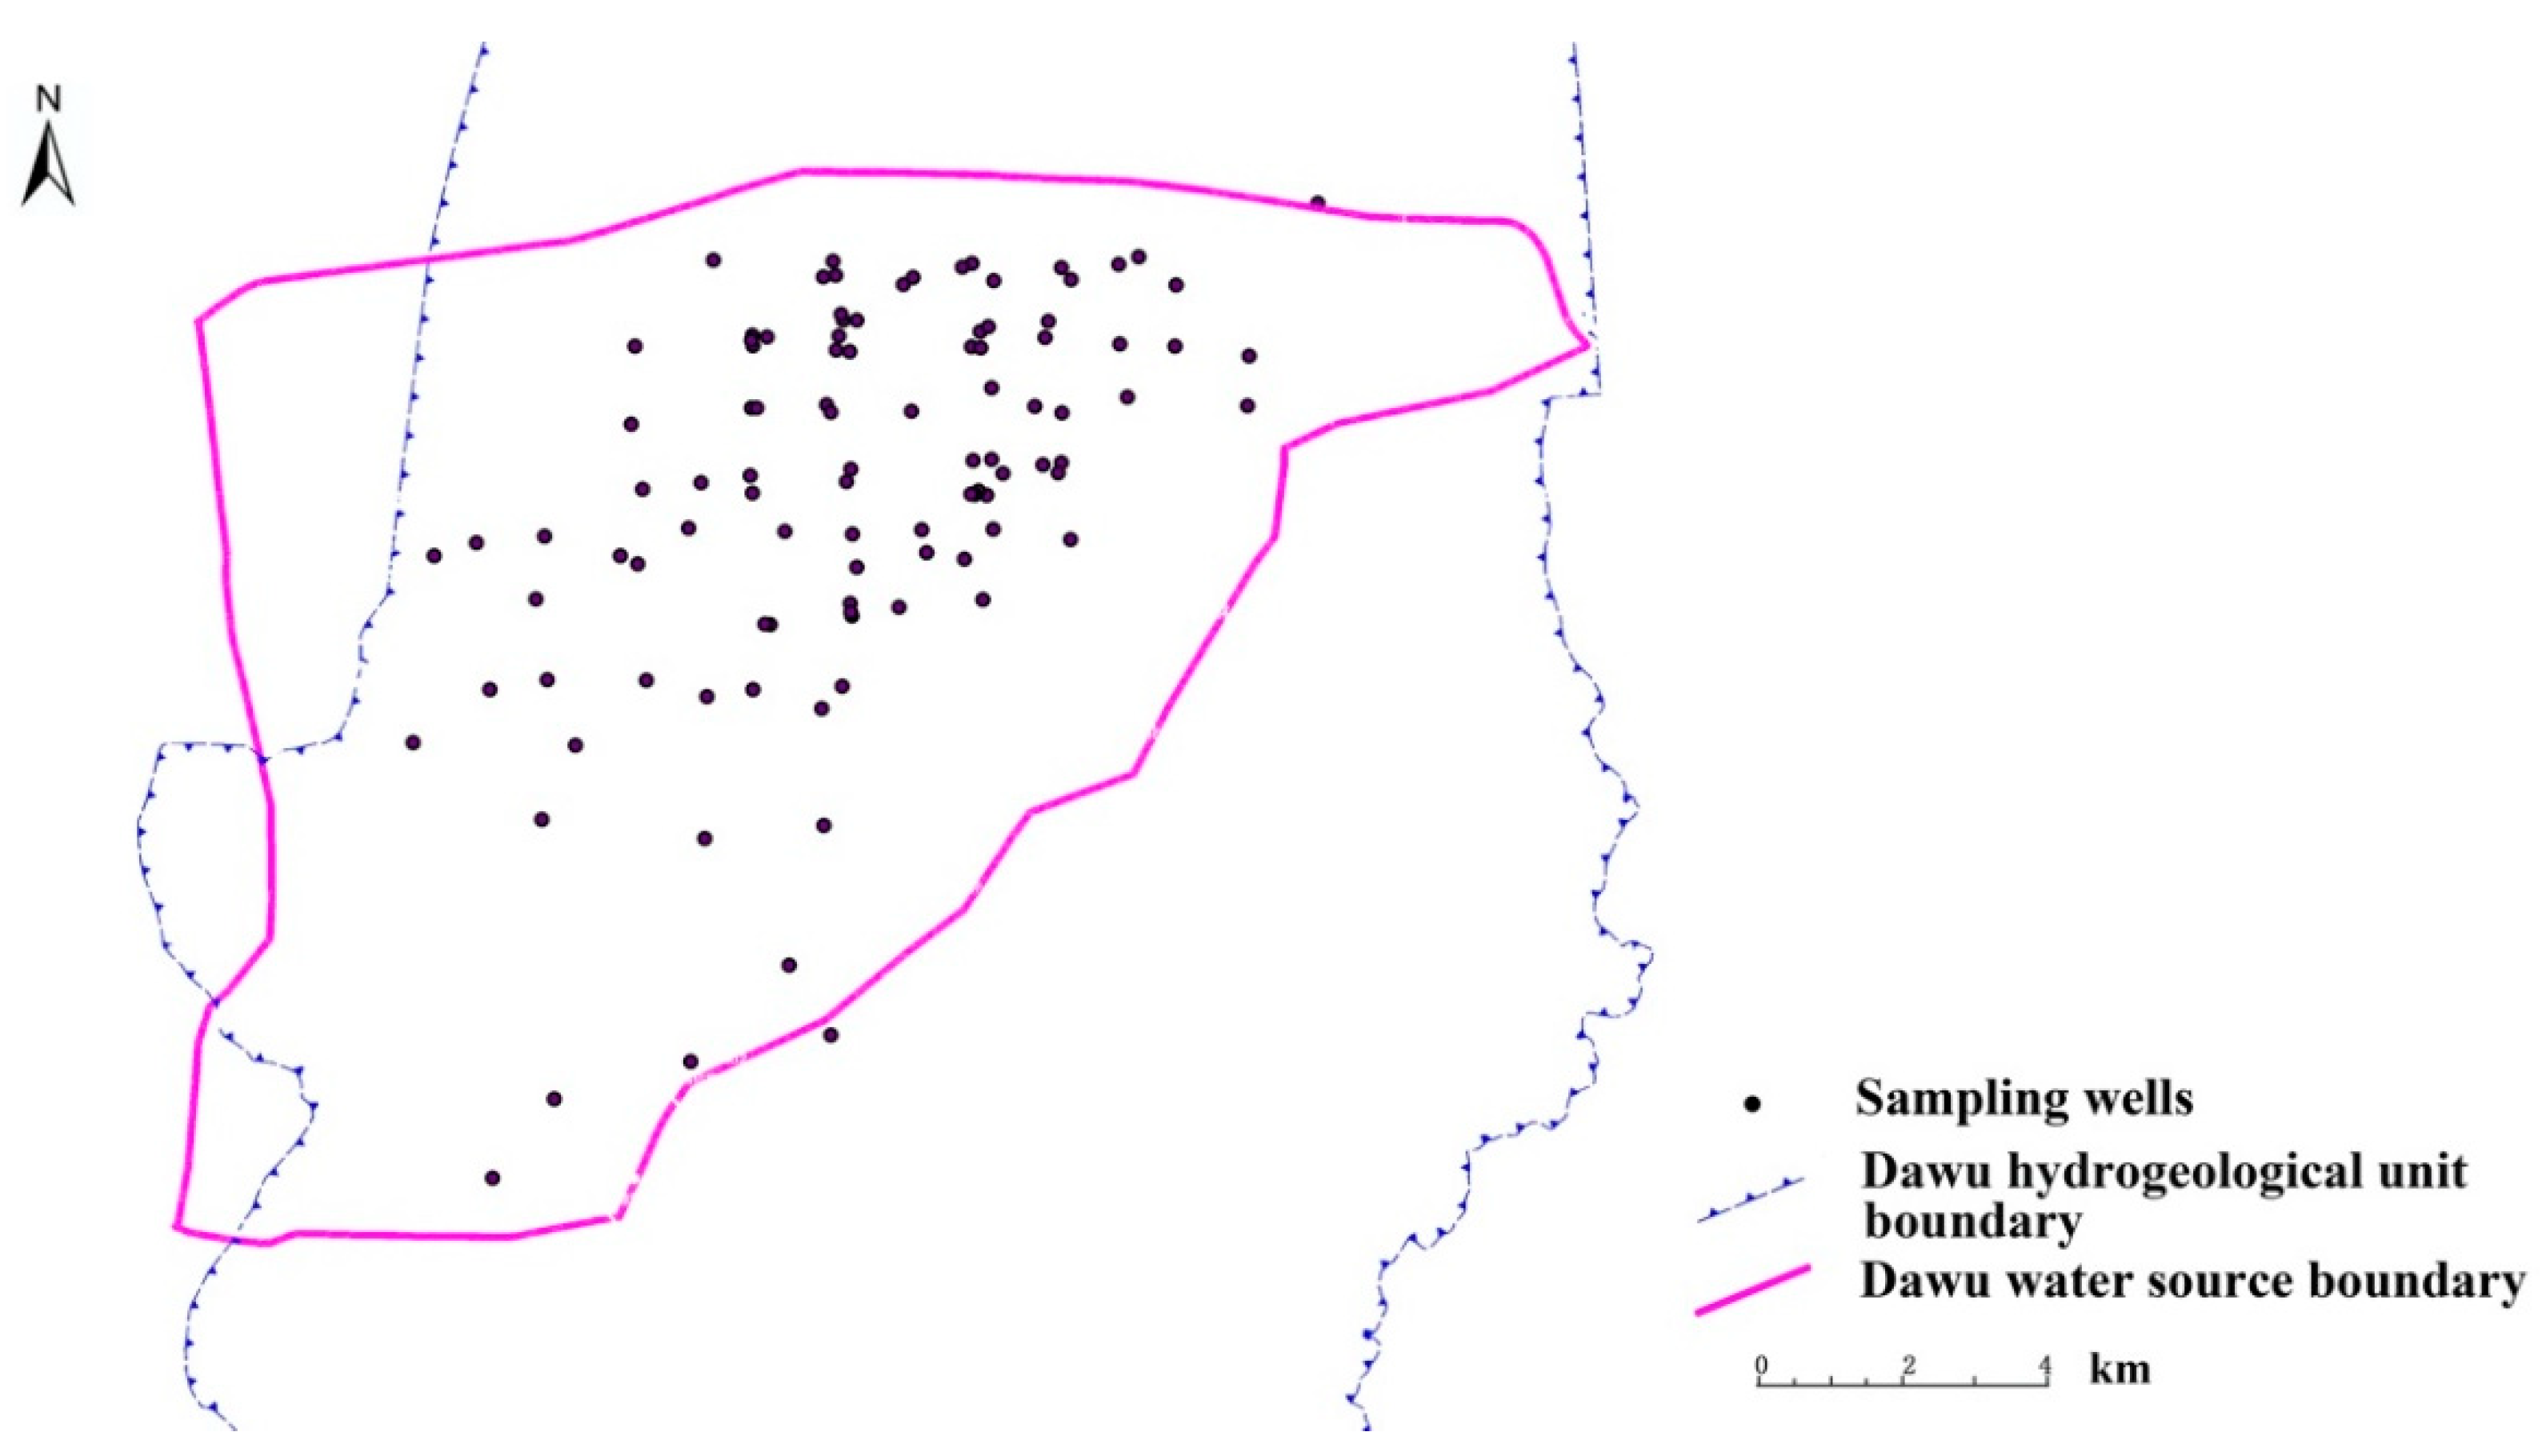
This study was based on the 3D visualization information system construction of the water source of Zibo City from October 2017 to January 2018; 101 samples were collected with a sampling depth of 150–520 m. There were 122 detection indices, including the general chemical indices, such as metal ions, pH, and total hardness, and toxicology indices, such as nitrite, nitrate, heavy metals, organic pollutants, and pesticides. The sampling points were mining wells or pressure wells that often supply water, and the water was pumped for more than 10 mins before collection to ensure that the water samples obtained can reflect the real conditions of groundwater in the sampling points. Samples were collected in brown sampling bottles, which were pickled and washed with distilled water before sampling and washed with fresh water at least three times during sampling, and pH was measured on-site. After sampling, the container was immediately stoppered to avoid air gap, and the sample was promptly sent for analysis. Organic matter was detected in consonance with Standard examination methods for drinking water (GB/T5750) [
22], primarily using Agilent6890N gas chromatograph (United States) and TU1810 UV-visible spectrophotometer (China). Groundwater samples were primarily karst water, which also accounted for pore water. In a preliminary analysis of the index data, none of the 37 pesticides were detected; eventually, the 33 organic compounds, such as dibromomethane, bromodichloromethane, and 1,2-dibromoethane, were also not detected. At the same time, referring to Standards for groundwater quality (GT14848-2017) [
23], Standards for drinking water quality (GB5749-2006) [
24], The European Union Water Framework Directive (hereafter referred to as the “WFD”) in 2000 [
25] and the World Health Organization (WHO) Guidelines for drinking-water quality (the fourth edition) in July 2011 [
26], the similar index and other indices not included in the scope of standards and guidelines were removed. Finally, 38 indices were determined as within the scope of this study. If the detected concentration was below the detection limit, it was set as the standard detection concentration for evaluation.
Figure 2 shows the distribution of the sampling Wells.
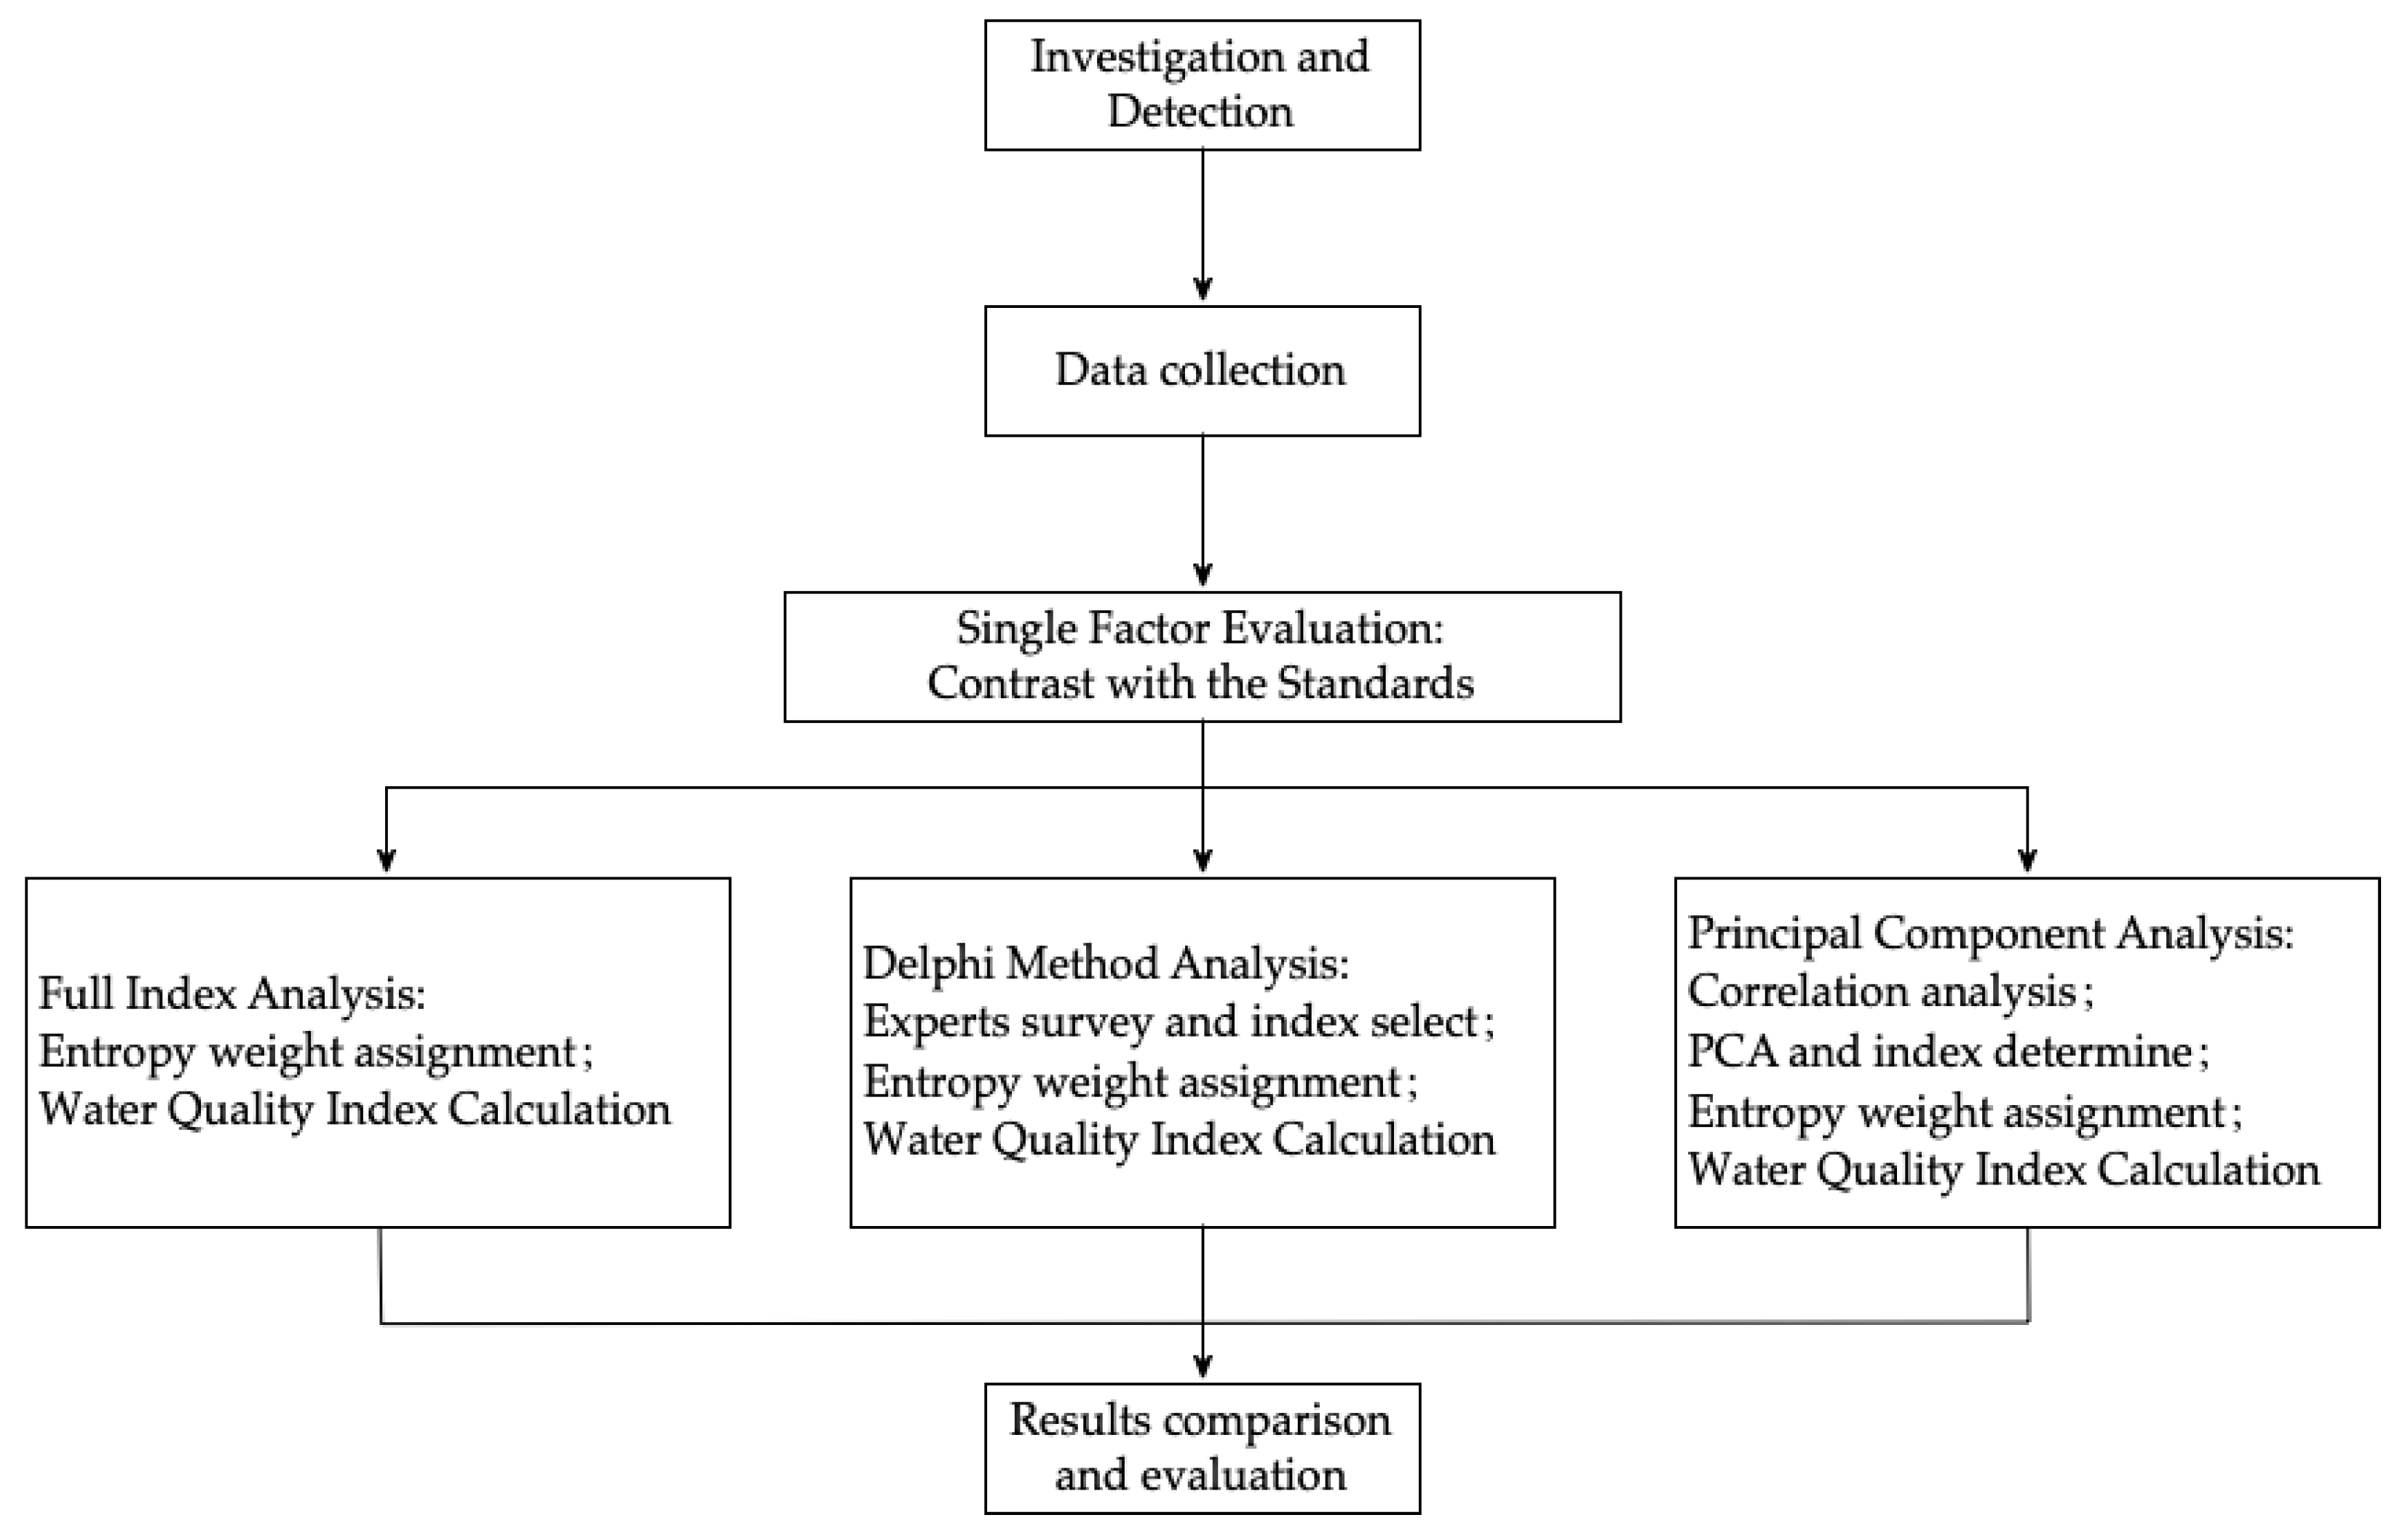
In this study, the full index method, Delphi method, and PCA were adopted to evaluate the groundwater quality of the Dawu water source area. The research process is shown in the
Figure 3 below.
The Delphi method, also known as the expert survey method, was initiated and implemented by Dalkey and Helmer for RAND Corporation in 1946 [
27]. It is primarily a feedback and anonymous consultation method; the general process is to collect opinions of experts on the problems to be predicted; then organize, statistically summarize, and give anonymous feedback to experts; then solicit opinions again, analyze and give feedback again, until a consistent opinion is obtained [
28,
29]. The Delphi method is a qualitative research method that can anonymously accept a large number of individual opinions from different sources and professional fields. Participants are allowed to openly provide criticism, which can thereby minimize social pressure or the influence of experts [
27,
30]. The standard Delphi method has five primary characteristics: the use of experts, anonymity, controlled feedback, multi-stage iteration, and the search for consensus through the statistical aggregation of group responses [
31].
Multivariate statistical analysis was developed from classical statistics. It is a comprehensive analysis method that can analyze the statistical law of multiple objects and multiple indices under the condition that they are interrelated. Multivariate statistical techniques have been widely used in water quality data analysis [
32,
33,
34,
35,
36,
37]. These tools help simplify and organize large datasets to explain the observed relationships between several variables [
38]. In this study, correlation analysis, PCA, and principal factor analysis (PFA) were used to select evaluation index parameters, and IBM SPSS Statistics 26 software (United States) was used for data visualization. Each water quality parameter contained important water quality information, and there may be different degrees of correlation between the parameters. Through comprehensive analysis of these correlations, we can obtain the water quality information from the data [
35,
36,
38,
39,
40]. Based on PCA, the water quality indices obtained from the same principal component had similar or the same sources contributing to pollution, while the water quality parameters within different principal components represent different sources of pollutants. Based on the correlation, PFA was carried out and factor load calculated. The contribution rate of water quality parameters in principal components can be determined through factor load calculation, to identify the primary pollution impact factors [
38,
40,
41,
42].
The entropy weight method is based on Shannon entropy, proposed by Shannon in 1948 [
43]. According to Shannon’s theory, information is a function: the sender of the information chooses a piece of information from a set of possible choices, and the degree of uncertainty associated with this choice behavior is central to this concept [
44]. Consistent with the basic principles of information theory, information is a measure of the degree of system order, and entropy is a measure of the degree of system disorder. In line with the definition of information entropy, for a certain index, the entropy value can be used to determine the degree of dispersion of an index. A smaller information entropy value will lead to a greater degree of dispersion of an index, and a greater influence (i.e., weight) of the index on the comprehensive evaluation. If all the values of an index are equal, the index will not play any role in the comprehensive evaluation [
43,
45,
46,
47]. Therefore, the information entropy tool can be used to calculate the weight of each index and provide a basis for the comprehensive evaluation of multiple indices. Li et al. [
48] used the entropy weight fuzzy analysis method to evaluate the groundwater quality of industrial parks in Northwest China.
Indices can be divided into positive and negative indices. Positive indices are also known as efficiency criteria; a high original value of the index will result in a higher efficiency level, whereas a low original value of the index will result in a lower level. The inverse index is also known as the cost index. A smaller original value of the index will result in a higher level; a higher original value of the index will result in a lower level [
45,
49,
50]. In the water quality index, except pH, all others are inverse indices. If the membership function is
Uw (x), the membership degree of the positive index is
the inverse index membership degree is
where
xmax and
xmin represent the maximum and minimum of the original data values of m samples of the index, respectively. In Equations (1) and (2),
Uw (x) ∈ [0,1]. The closer the membership function value is to 1, the better the water quality. On the basis of the membership degree of each index, the membership matrix, namely the decision matrix
Rw, was obtained as
where
rij =
Uw (x);
i = 1,2, …,
m,
j = 1,2, …,
n;
m is the number of samples; and
n is the number of indices. The entropy method was used to determine the weight of each index, and the weight transformation was carried out to calculate the new weight of each index.
The specific gravity of the index was transformed as
Ej represents the total contribution of all samples to the index, namely the entropy value,
Here, the constant K = 1/ln (m), such that 0 ≤ Ej ≤ 1 can be ensured; that is, Ej has a maximum value of 1.
The reverse entropy was obtained as
Finally, the index weight was calculated as
The WQI is the simplest and most widely used index for assessing the overall quality of surface and groundwater water [
17,
33,
51,
52]. In this study, the WQI was [
48] calculated as
where
wj is the weight, which ranges between 0 and 1,
w1 +
w2 +
w3 +…+
wn = 1;
qj is the quality level of each parameter, and
n is the number of parameters used in WQI evaluation.
where
Cj is the concentration (mg/L) of each index in each water sample,
CpH is the value of the pH in each water sample, and
Sj is the standard limit (mg/L) of each index in the Standards for drinking water quality (GB5749-2006).
4. Discussion
In this study, thirty-eight indices data from 101 sample wells in the Dawu water source area of China were analyzed, and the single factor method and WQI method were used to evaluate groundwater quality in this area. In the single factor water quality evaluation method, the weights of all indices are not considered. Even if only one of all indices exceed the standard and by a very small amount, the water quality is defined as exceeding the standard, and the evaluation results are one-sided. Therefore, this study adopted the WQI method for comprehensive evaluation.
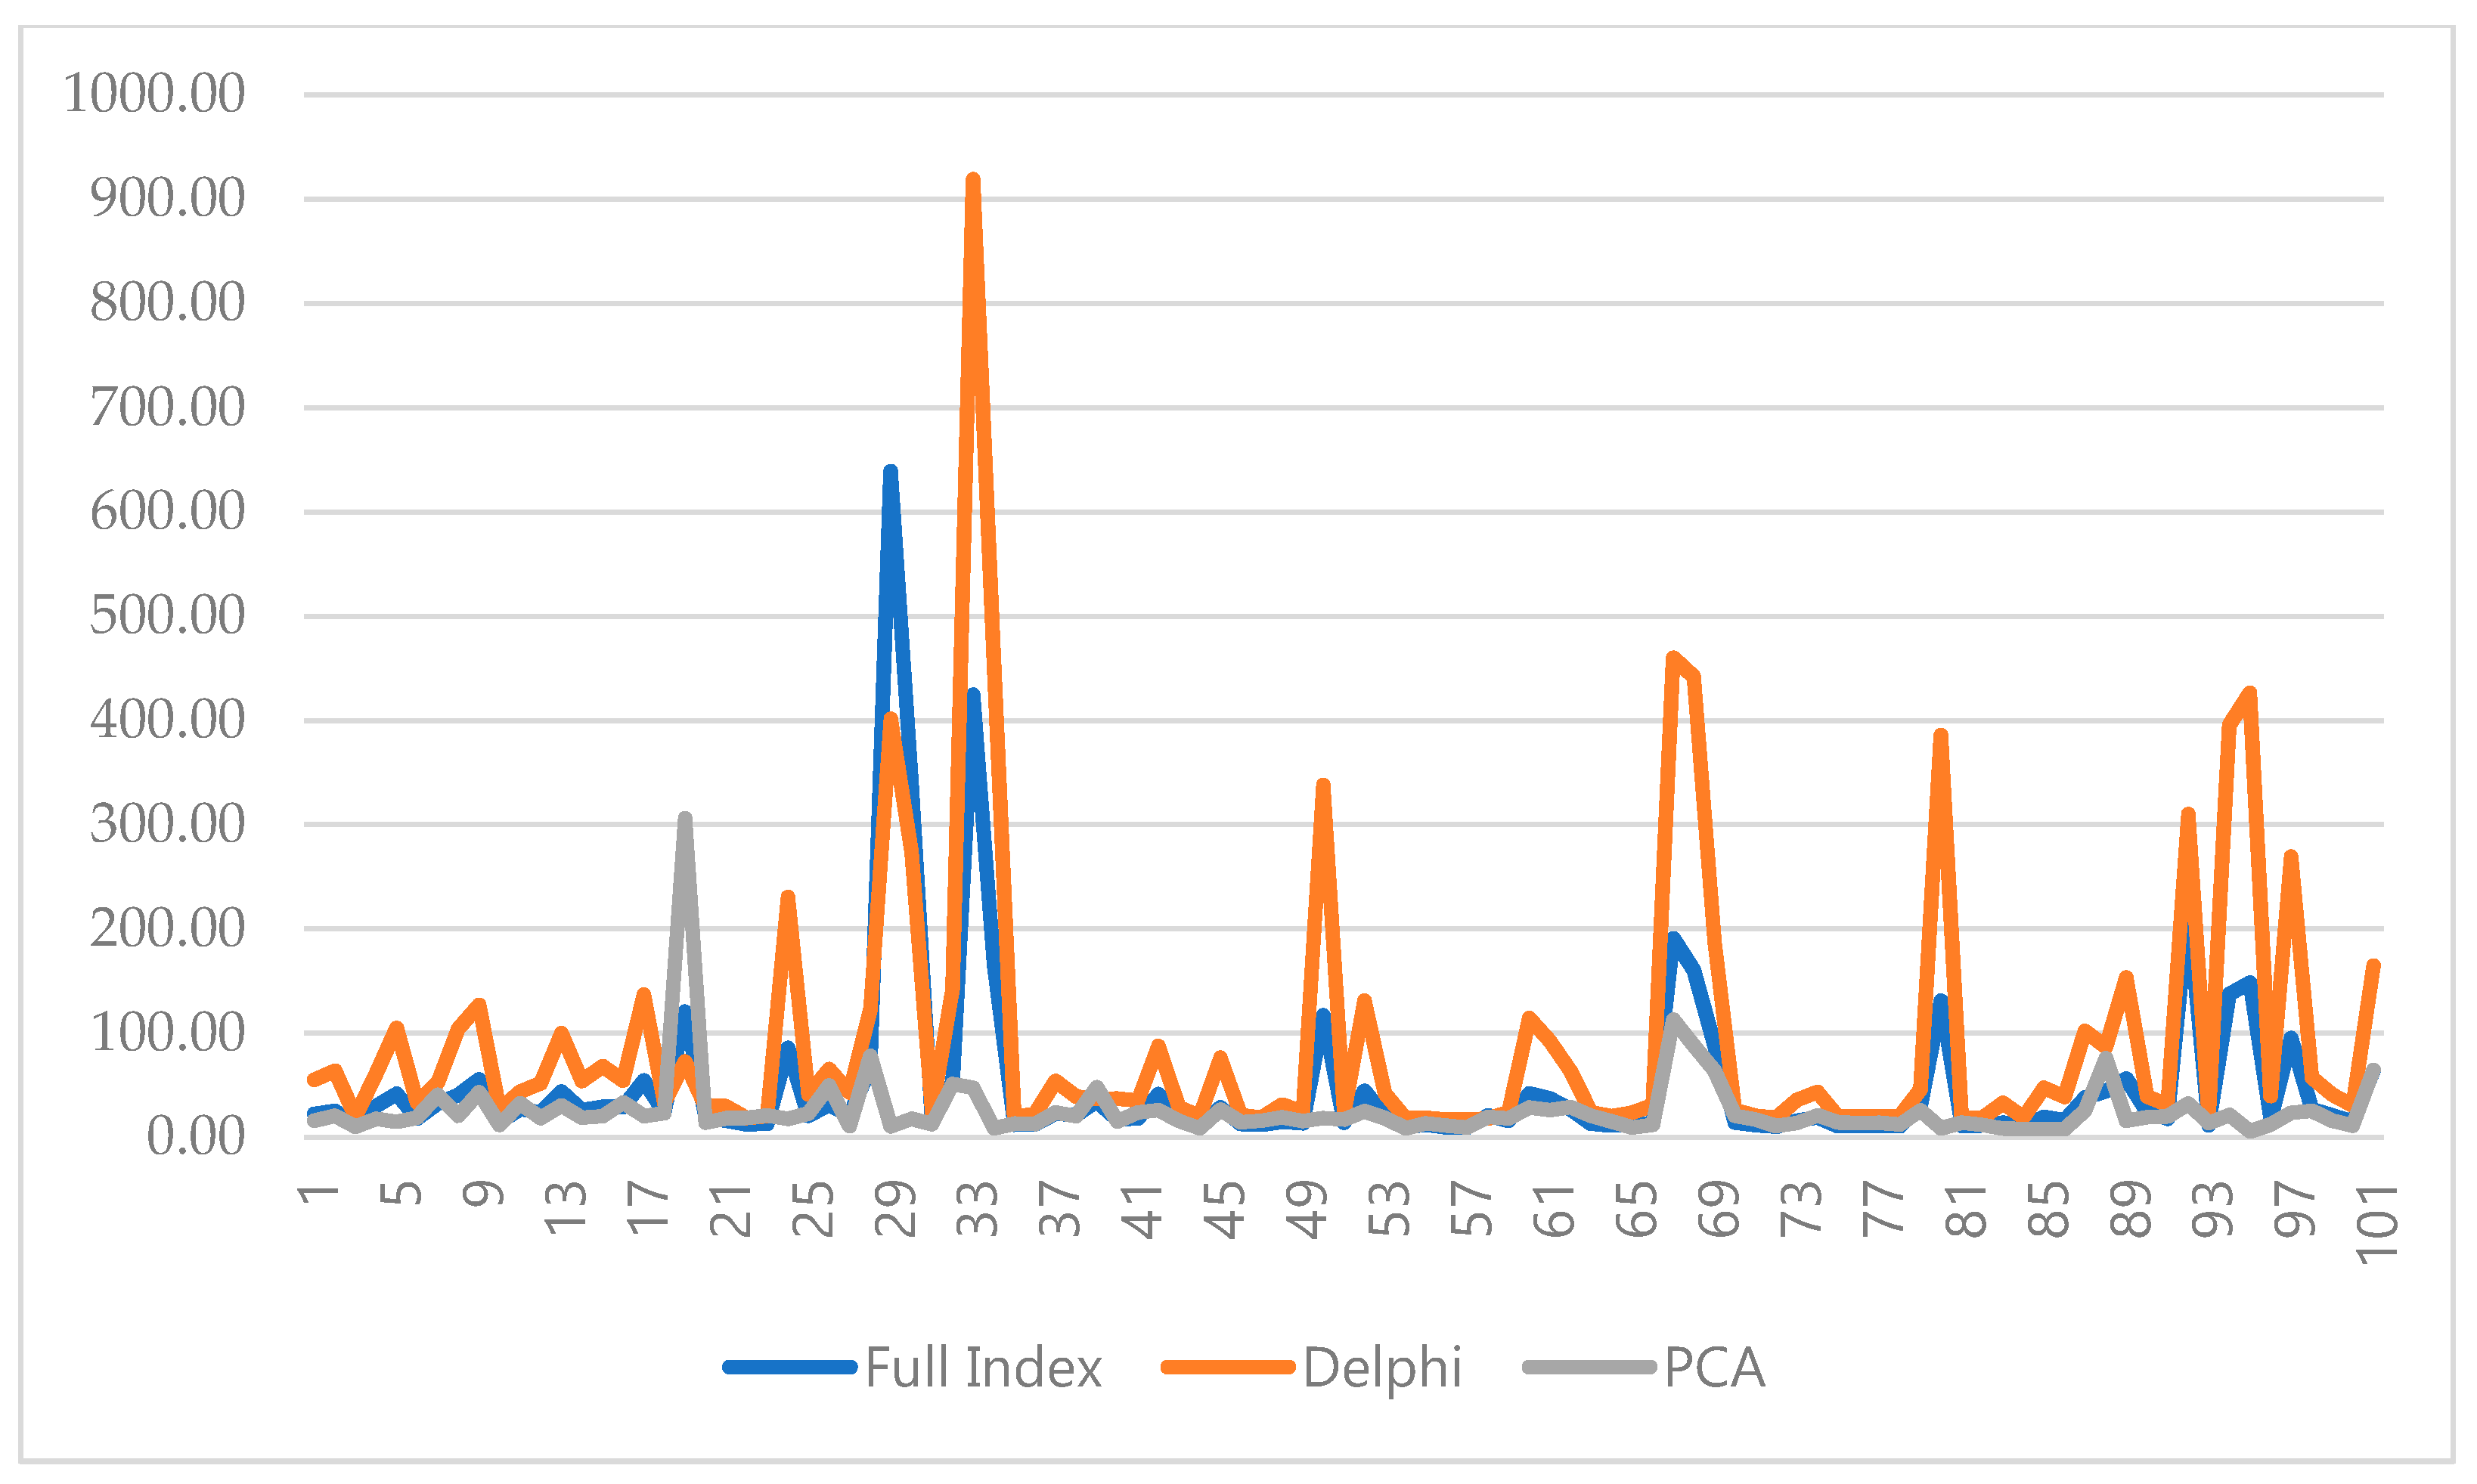
In the index selection process of the WQI evaluation method, the full index method, the Delphi method, and the PCA method were adopted and the entropy method was used to determine the weight. Finally, the evaluation results were analyzed, and the scientific basis for the Delphi method and the PCA method were compared. Using the full index method, Class I sample wells accounted for 57.43%; using the Delphi method, these accounted for 28.71%; and using the PCA method, these accounted for 74.26%. Thus, from the three methods, the Class I and II sample wells had an average of 76.24%. Therefore, it may be concluded that the groundwater in the Dawu water source area generally has good quality and is potable. Selecting the full index method as the criterion, the same rate of WQI evaluation results of the Delphi method and the full index method was 37.62%, which was worse than that of the full index method. The same rate of PCA WQI evaluation was 77.23%, which was better than that of the full index method. Hence, the PCA method is more accurate than the Delphi method in terms of the same rate of evaluation results, and it is reasonable and scientific to apply the multivariate statistical analysis method and entropy weighting method in WQI technology.
Despite this, this study only carried out a comparative analysis on the detection data of the Dawu water source area; in the Delphi method, the selection of evaluation indices may consider more factors such as regional water quality background differences; more research is needed to determine whether the results of other groundwater or surface water assessments are consistent. At the same time, the large difference in the evaluation results between the full index method and the Delphi method also reminds scholars that they need to pay more attention to the rationality of the selection of indicators in the future research.


