Article

Forested Riparian Buffers Change the Taxonomic and Functional Composition of Stream Invertebrate Communities in Agricultural Catchments

1
Department of Aquatic Sciences and Assessment, Swedish University of Agricultural Sciences, 75007 Uppsala, Sweden
2
Department of Systems Ecology and Sustainability, University of Bucharest, 050095 Bucharest, Romania
3
Research Institute of the University of Bucharest, 050663 Bucharest, Romania
4
Department of Animal Sciences and Aquatic Ecology, Aquatic Ecology Research Unit, Ghent University, 9000 Ghent, Belgium
*
Author to whom correspondence should be addressed.
Water 2021, 13(8), 1028; https://doi.org/10.3390/w13081028
Submission received: 26 February 2021 / Revised: 2 April 2021 / Accepted: 6 April 2021 / Published: 9 April 2021
(This article belongs to the Special Issue Ecosystem Functioning in Rivers and Riparian Zones)

Abstract

:
Riparian zones form the interface between stream and terrestrial ecosystems and play a key role through their vegetation structure in determining stream biodiversity, ecosystem functioning and regulating human impacts, such as warming, nutrient enrichment and sedimentation. We assessed how differing riparian vegetation types influence the structural and functional composition (based on species traits) of stream invertebrate communities in agricultural catchments. We characterized riparian and stream habitat conditions and sampled stream invertebrate communities in 10 independent site pairs, each comprising one “unbuffered” reach lacking woody riparian vegetation and a second downstream reach with a woody riparian buffer. Forested riparian buffers were associated with greater shading, increased gravel content in stream substrates and faster flow velocities. We detected changes in invertebrate taxonomic composition in response to buffer presence, with an increase in sensitive Ephemeroptera, Plecoptera and Trichoptera (EPT) taxa and increases in key invertebrate species traits, including species with preference for gravel substrates and aerial active dispersal as adults. Riparian vegetation independently explained most variation in taxa composition, whereas riparian and instream habitat together explained most variation in functional composition. Our results highlight how changes in stream invertebrate trait distributions may indirectly reflect differences in riparian habitat, with implications for stream health and cross-ecosystem connectivity.

1. Introduction

The habitats that form the interface between a stream and its adjacent terrestrial landscape are known as “riparian zones” [1]. Streams and their riparian habitats are strongly connected hydrologically and ecologically and together provide valuable ecosystem services including intrinsic aesthetic values, recreational activities such as fishing, birdwatching and hiking and the supply of clean drinking water to human populations [2]. Riparian habitats also support unique biodiversity and strongly influence the functioning of stream ecosystems [3,4]. The properties of riparian zones (e.g., vegetation structure) can determine stream ecosystem processes and the extent of human impacts by moderating flow regimes and stabilizing banks during floods and regulating the extent of warming (e.g., during summer heat waves) and inputs of nutrients, fine sediments and micropollutants (e.g., pesticides) [5]. Consequently, riparian vegetation may strongly influence the structural and functional composition of stream communities in modified catchments by helping to mitigate impacts of human land uses.
Riparian vegetation directly affects instream primary production by altering incident light and secondary production indirectly by affecting the basal resources that support instream food webs, including the quantity and quality of terrestrially derived (allochthonous) detritus (e.g., leaf litter, woody debris). The presence of riparian trees can further contribute to the physical structuring of instream habitats, by contributing structural elements such as instream wood, stabilizing banks and providing habitats for both invertebrate and vertebrate breeding [6]. The level of control that riparian vegetation has on a stream ecosystem largely depends on the density and type of riparian vegetation and its position in the river network [7]. Headwater streams are often strongly embedded in the terrestrial (forested) landscape, while the riparian corridors of large rivers are characterized by complex floodplains and diverse terrestrial vegetation [4]. Small to mid-sized stream food webs are often driven by the quality and quantity of allochthonous organic matter entering the stream [8,9,10]. The significance of allochthonous matter is also reflected in the diversity, taxonomic composition and feeding guilds (e.g., shredders and filter-feeders) comprising forested communities. Thus, human activities, such as deforestation and landscape disturbances, that alter riparian vegetation composition can impact both terrestrial and stream ecosystems.
Land use impacts on riparian vegetation can directly or indirectly affect instream biodiversity and function through changes in instream conditions, habitat and basal resources [11,12,13]. Erosion and increased inputs of fine sediments and pollutants result in loss of instream microhabitats and sensitive species [14,15], whilst at high levels of disturbance, macroinvertebrate communities are often composed predominantly of species preferring soft-bottom sediments (e.g., certain Diptera and Oligochaeta). These stress-tolerant invertebrates are often adapted to low dissolved oxygen levels (e.g., modes of respiration including tegument). Adverse conditions and availability of instream food resources are also reflected through species life-history traits including smaller body size, shorter development times and adult life spans [16,17]. Loss or altered riparian vegetation also reduces shading and increases water temperatures, which, when combined with elevated nutrient levels from land use, can result in an increase in primary production (algae and macrophytes) [18,19], ultimately shifting basal resources from allochthonous to autochthonous matter [8]. These changes can impact stream food webs by altering the composition of functional feeding guilds and the transfer of energy to higher trophic levels [5]. Such changes to biodiversity and ecosystem processes require management practices that mitigate the impacts of human activities and restore key functional processes.
Riparian buffer strips, defined as patches of habitat alongside streams planted either with a more open mixture of grasses and herbs or with shrubs and trees (or a mixture of both), are increasingly used as a management tool to reduce the effects of agriculture and forestry on streams [20,21]. Such buffers can help to control erosion, filter nutrients and play an important role in hydrological processes including runoff and groundwater recharge [22,23,24]. Forested riparian buffers have the potential to be a particularly useful management tool, because increasing riparian forest quality (i.e., forest cover, structure, quality and channel integrity) can support the greatest number of ecosystem services in stream-riparian networks [2]. Forested riparian buffers have multiple benefits, including increased shading thereby moderating temperature fluctuations, reducing proliferations of aquatic plants and adding inputs of allochthonous organic matter [1,25,26]. While the ecological importance of stream-riparian ecosystems for local and regional biodiversity is well-recognized [4], the lack of robust guidelines for riparian buffer attributes and the potential management conflicts (e.g., drainage values, invasive plants) underscore a pressing need to quantify and understand how forested riparian buffers mitigate human impacts on streams and rivers. Riparian buffer management practices may significantly improve biodiversity [27], but knowledge gaps remain on the responses and drivers of instream communities, hindering efficient and effective management by land owners and decision makers [20,21,28].
Using a replicated field study, we addressed these knowledge gaps by quantifying the effects of forested riparian buffers on changes in instream attributes and macroinvertebrate communities across 20 stream reaches located on 10 streams within an agricultural catchment. On each stream, we sampled two reaches: an upstream unbuffered reach lacking riparian woody vegetation and the paired forested buffer reach downstream. We chose benthic macroinvertebrates as our biological response because (1) these organisms are often used in biomonitoring of stream ecosystems, (2) combining taxonomic and trait-based approaches allows for making strong mechanistic inferences and (3) macroinvertebrate responses to anthropogenic disturbance are well known and predictable [29,30,31].
Building on previous studies, we expected significant differences in instream habitat, physicochemical conditions and biological responses between unbuffered and buffered reaches. Specifically, we hypothesized that:
(1) Buffered reaches would have high amounts of organic matter (e.g., coarse particulate organic matter (CPOM) and woody debris), while unbuffered reaches were expected to have higher temperatures, nutrients concentrations (e.g., nitrogen, phosphorous) and finer benthic sediments (e.g., sand, silt).
(2) Altered riparian vegetation and differences in instream habitat between unbuffered and buffered reaches were expected to result in lower diversity and shifts in community and trait composition at unbuffered reaches. For example, differences in instream habitat were expected to result in the loss of sensitive species such as EPT taxa [30,32] and changes in the relative abundances of sensitive and tolerant taxa. Moreover, if substratum differed between the study reaches (e.g., shifts from hard to soft-bottom substrata with more macrophytes), we expected these differences to be reflected in macroinvertebrate traits describing microhabitat and flow preferences and adaptions for breathing.
(3a) Altered conditions in agricultural streams are often associated with changes in life history traits such as polyvoltinism and adult dispersal (i.e., smaller adult size and weak fliers) [14,16,33]); accordingly, we expect species with relatively shorter development times, small body sizes and passive dispersal to be more abundant at the unbuffered reaches.
(3b) Differences in feeding guilds were also anticipated between unbuffered and buffered reaches. For example, in unbuffered reaches, increased incidence of photosynthetically active radiation (PAR) is often associated with increased algal production [18,19]. Therefore, we expected a higher proportion of scraper feeding traits (i.e., traits specialized for consuming algal biofilms). Alternatively, if substrata at unbuffered reaches were dominated by fine sediment (i.e., sandy or silty substrates) we expected to find a higher proportion of deposit-feeders [5]. In buffered reaches, higher inputs of allochthonous organic matter (e.g., coarse particulate matter and woody debris) were expected to result in a higher diversity and proportion of shredders [34].
(4) Finally, we predicted that macroinvertebrate communities would respond more to local (i.e., riparian and instream habitat) than the large-scale (i.e., catchment land use) drivers. This prediction was consistent with the strong differences in local habitat characteristics that we anticipated between our unbuffered-buffered site pairs and the key role that local habitat features play in helping to structure macroinvertebrate communities [35].

2. Materials and Methods
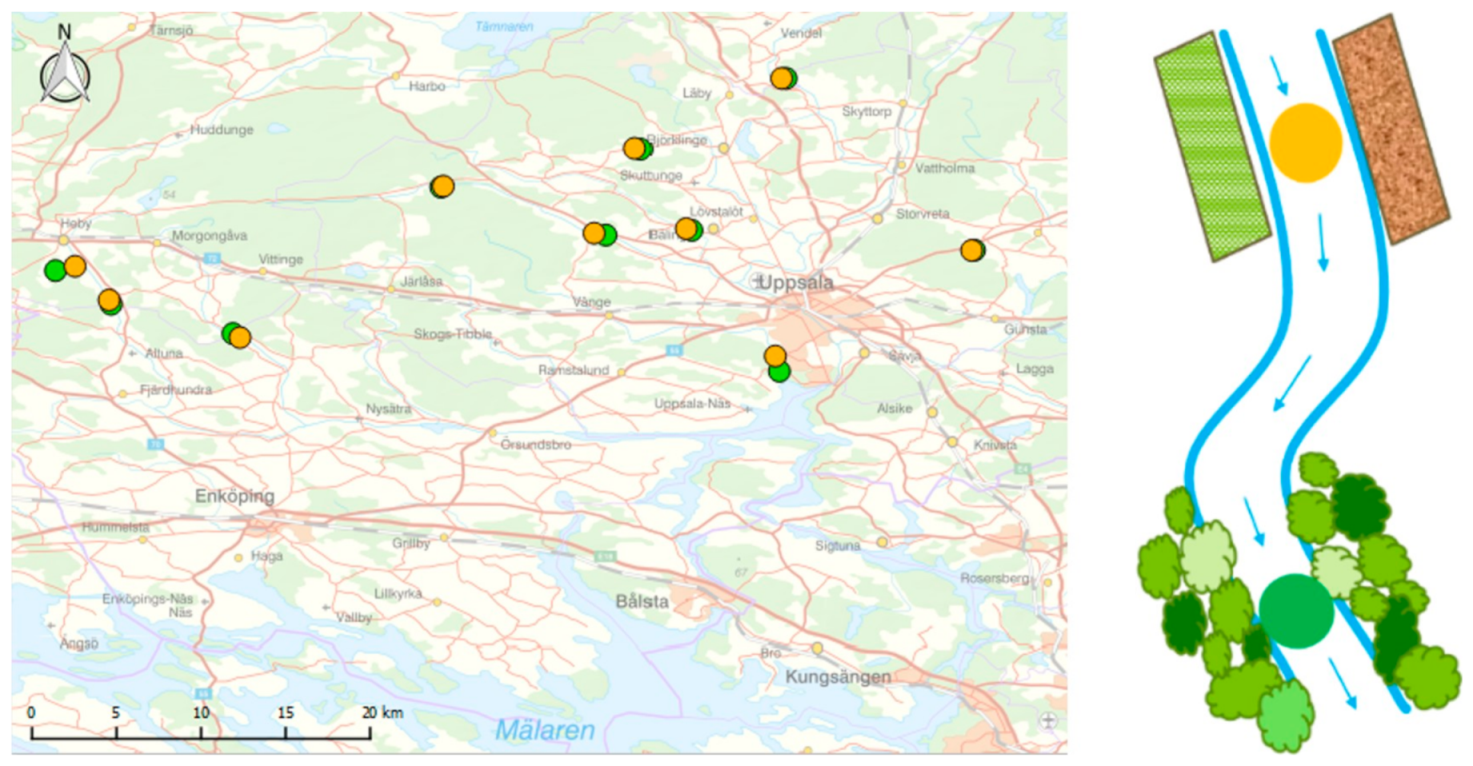
2.1. Study Sites

Ten 1st to 3rd order lowland (<200 m a.s.l.) streams in the Lake Ekoln basin (part of the larger Lake Mälaren catchment), located in central Sweden, were studied in spring 2018. The catchment land cover is dominated by forest (49%), agriculture (36%) and urban (4%) land uses and in the sub-catchments of studied streams agricultural land use averaged 38%. In order to investigate impacts of local and upstream catchment land uses and the potential of riparian buffers to mitigate environmental impacts, one unbuffered (upstream) reach and one buffered (downstream) reach was selected for sampling within each stream (hereafter described as paired reaches; Figure 1).
Buffered reaches were selected based on the presence of a “forest riparian buffer” and following criteria described in Burdon et al. [5]: length (a woody buffer extending >50 m on both sides of the stream over the sampling reach), width (>2–3 x wetted stream width), extent (buffer on both banks of the stream segment) and composition (dominated by small and large trees). Unbuffered reaches typically only had a few isolated riparian trees or woody vegetation was completely absent, instead being dominated by grasses and herbaceous vegetation. Streams were chosen to be as similar as possible in key environmental characteristics including a stable streambed dominated by hard substrates (gravel/cobbles), similar stream widths, depths and flow characteristics. Riparian and aquatic habitat properties at each reach were surveyed within a 50 m habitat assessment reach (HAR), while macroinvertebrate sampling was conducted within 30 m effective sampling reach nested within the HAR [5].

2.2. Sampling Methods

2.2.1. Environmental Variables

We measured stream properties along 5–6 transects distributed in a stratified random approach over each study reach [5], including bankfull width and depth (based on evidence of the highest waterline), as well as wetted channel widths and water depths at the time of sampling. Flow measurements were made at 2/3 depth of the channel thalweg on the transect using a flow meter (MiniAir20 Flowmeter, Schiltknecht Messtechnik AG, Gossau, Switzerland).
Water samples were collected from below the water surface in the channel thalweg at the downstream end of each reach, stored cold and analyzed within 24 h for total organic carbon, total nitrogen, ammonium, nitrates, total phosphorus, conductivity, pH and alkalinity. Water temperature was measured using spot measurements and continuous logging (e.g., Manta + 30 probe, Eureka Water Probes, Austin, TX, USA).
We estimated the percentage cover of instream inorganic and organic substrate types (Table 1) over the effective sampling reach. Inorganic substrate classes followed the Wentworth scale [36], while the percentage cover of bryophytes and filamentous algae was estimated as an extent on the underlying substrate. Instream shading was recorded as a percentage of canopy cover using CanopyApp (for Android OS, Version 1.0.3, University of New Hampshire, Durham, NH, USA). Six measurements (digital images using a smartphone at the breast height) were taken in the middle of the stream channel to calculate the average stream shading (% canopy cover) for each study reach.
Woody riparian vegetation was quantified by measuring, identifying and counting the number of trees (Diameter at Breast Height > 5 cm) as the mean density (m2) of trees from six 50 m2 (30 m × 5 m) rectangular plots in the riparian zones adjacent to the stream at each sampling reach. Similarly, riparian habitat characteristics (% area of different habitat types) were estimated as a vertical projection onto the ground from each 50 m2 riparian plot. Canopy cover was estimated in the middle of each plot, using the same method as described above (for instream shading).
We used a national database from Sweden’s meteorological and hydrological institute (SMHI, https://www.smhi.se/data/hydrologi/vattenwebb, accessed on 2 November 2020) and Swedish mapping, cadastral and land registration authority (Lantmateriet, https://www.lantmateriet.se/en/about-lantmateriet/Samverkan-med-andra/internationell-samverkan/corine-land-cover/, accessed on 2 November 2020) to extract the spatial data (e.g., river network, digital elevation) for catchments of the 10 stream reaches. We used land use data from the most current (2018) CORINE Land Cover (CLC) inventory. Riparian buffer size, width and length were estimated using aerial photographs from Google Earth and reach elevation, longitude and latitude were obtained from Geographical Information System (GIS) data.

2.2.2. Macroinvertebrate Communities

We sampled macroinvertebrates once in spring 2018, using a Surber sampler with a metal frame (dimensions 0.25 × 0.25 m = 0.0625 m2) and 500 µm mesh netting. The sampling effort was standardized for 60 s where coarse substrate was disturbed to a maximum depth of 10 cm. A total of six replicate subsamples were collected (three samples from erosional run-riffle habitats and three from depositional run-pool habitats). The six samples were pooled, sieved through 500 µm mesh and preserved in 70% ethanol. Macroinvertebrate samples were identified to the lowest taxonomic level possible (e.g., species or genus) using standard identification guides. Taxa were counted and the abundance was expressed as the number of individuals per m2. EPT taxa were expressed as a percentage of the sensitive orders (E = Ephemeroptera, P = Plecoptera, T = Tricoptera) to the total taxa found.

2.3. Functional Traits Selection

Benthic macroinvertebrate functional traits were used to quantify differences in functional structure of macroinvertebrate communities. We focused on biological and ecological traits that reflect changes in the aquatic environment attributable to differences in riparian vegetation (e.g., feeding and respiration), instream habitat (e.g., substratum preferences) and traits that can reflect changes in the transfer of nutrients and energy between aquatic and terrestrial systems, therefore affecting lateral connectivity of streams (e.g., life history and dispersal traits). Accordingly, we selected 39 trait modalities from the 8 traits categories to quantify changes between unbuffered and buffered reaches.
Biological traits:
(1)
body size (in cm): ≤0.25, 0.25–0.5, 0.5–1, 1–2, 2–4, 4–8, >8;
(2)
life cycle duration: ≤1 year, >1 year;
(3)
potential number of cycles per year: <1 (semivoltine), 1 (monovoltine), >1 (polyvoltine);
(4)
dispersal: aquatic passive, aquatic active, aerial passive, aerial active;
(5)
respiration: tegument, gill, plastron, spiracle;
(6)
feeding: deposit feeder, shredder, scraper, filter feeder, predator, parasite.
Ecological traits:
(7)
substratum preferences: boulders/cobbles/pebbles, gravel, sand, silt, mud, macrophytes, microphytes, twigs/roots, organic detritus/litter (hereafter CPOM);
(8)
flow: null (<5 cm/s), slow (5–25 cm/s), medium (25–50 cm/s), fast (>50 cm/s).
We extracted available trait information from the database of Tachet et al. [37] and an online database (https://www.freshwaterecology.info/TaxaDB_mzbSearch.php, accessed on 2 November 2020) for 89 taxa (out of 94). Traits scores were based on fuzzy coding, which uses positive scores to describe the affinity of a species for different modalities (i.e., categories) of a given variable [38]. Fuzzy coding allows membership of a given species in more than one trait state simultaneously to account for trait plasticity, with trait scores weighted individually for each species. Macroinvertebrate traits were expressed as community weighted means (CWM) calculated as: i = 1 n   r e l a t i v e   a b u n d a n c e i   x   t r a i t i (for a species i, [39]).

2.4. Statistical Analysis

2.4.1. Hypothesis 1

Each of the 10 investigated streams comprised a pair of study reaches (unbuffered and buffered). To detect if there was a difference between these two categories, means of study reaches were tested using a paired t-test implemented in the JMP Pro 15.0.0 (SAS Institute, Cary, North Carolina). Prior to the analyses, environmental metrics data were log or log (x + 1) transformed, while the percentage data were logit transformed to approximate normal distribution. Principal Component Analysis (PCA) on standardized environmental variables (mean of 0 and a standard deviation of 1) and correlation (Pearson Product Moment) was used to visualize the difference between the study reaches and reduce the dimensionality of environmental variables. Data were normalized using R packages car and vegan and standardized by the decostand R function.

2.4.2. Hypotheses 2, 3a and 3b

Changes in macroinvertebrate biodiversity metrics between unbuffered and buffered reaches were tested using paired t-tests. We included taxa richness, EPT taxa richness, Simpson index, Shannon–Wiener index, evenness and dominance. To visualize (dis)similarities and test the differences in the taxonomic and trait compositions between the study reaches, we used Non-Metric Multidimensional Scaling (NMDS), followed by PERMANOVA (PERmutational Multivariate ANalysis Of VAriance), using the adonis function in R. Next, to investigate the contribution of individual taxa and traits to dissimilarity between study reaches [40], we used the simper function in R package vegan, tested with 999 permutations. The invertebrate abundance data were Hellinger transformed using the decostand R function to down weight rare species and avoid the influence of the “double zero” problem in our data [41].

2.4.3. Hypothesis 4

Redundancy analysis (RDA) was used to relate the variation in the composition of macroinvertebrate taxa and functional traits with environmental variables among the study reaches, using R package vegan and adespatial and related functions pcnm, rda and varpart [42]. We tested independent effects of various environmental variables describing spatial structure (PCNM, Principal Coordinates of Neighborhoods Matrix), catchment properties (land use), riparian characteristics and instream characteristics (Table 1). PCNM was used to decompose the spatial (geographical) relationship among study reaches into PCNM functions, which were obtained by principal coordinate analysis of a truncated matrix of Euclidean (geographic) distances [43]. PCNM is based on the diagonalization of a spatial weighting matrix and produces orthogonal maps that maximize spatial auto-correlation. It creates spatial components that can be directly linked to the spatial patterns of the environmental variables. Consequently, geographical distances in rectangular form are similar to normal explanatory variables used in RDA, for ecologically relevant spatial scales. To select model predictors and avoid over-parameterizing models, we first removed highly collinear predictors (e.g., r > 0.75). Then, we used forward.sel function in the adespatial R package (v 0.3–8) to select a subset of the best explanatory variables to describe the most variability in taxonomic and trait composition. The significance of the environmental variables was tested with 999 Monte Carlo permutations. Forward selection was carried out with the stopping criteria at the alpha significance level α = 0.1 and the adjusted coefficient of multiple determination (R2adj) calculated using all potential explanatory variables [44]. A more relaxed significance level was necessary to retrieve explanatory variables within each of the four observed sets of variables. Finally, we checked the variance inflation factors (VIF) using the vif.cca function. Predictor variables were excluded if they had VIF score > 4 [45].
To further investigate the independent effects of the local habitat attributes and direct contribution of riparian buffers to differences between study reaches, we performed partial RDA (pRDA). Here, we included riparian habitat structure and vegetation attributes selected by forward selection and conditioned out the confounding influence of instream properties as well as spatial structure and catchment characteristics. Additionally, variation partitioning analysis (VP) was used (varpart function in R) to separate variation in taxonomic and trait differences of communities explained by each environmental fraction (spatial, catchment, riparian and instream) using the strongest predictors from RDA analysis (i.e., forward selection) (varpart function in R).

3. Results

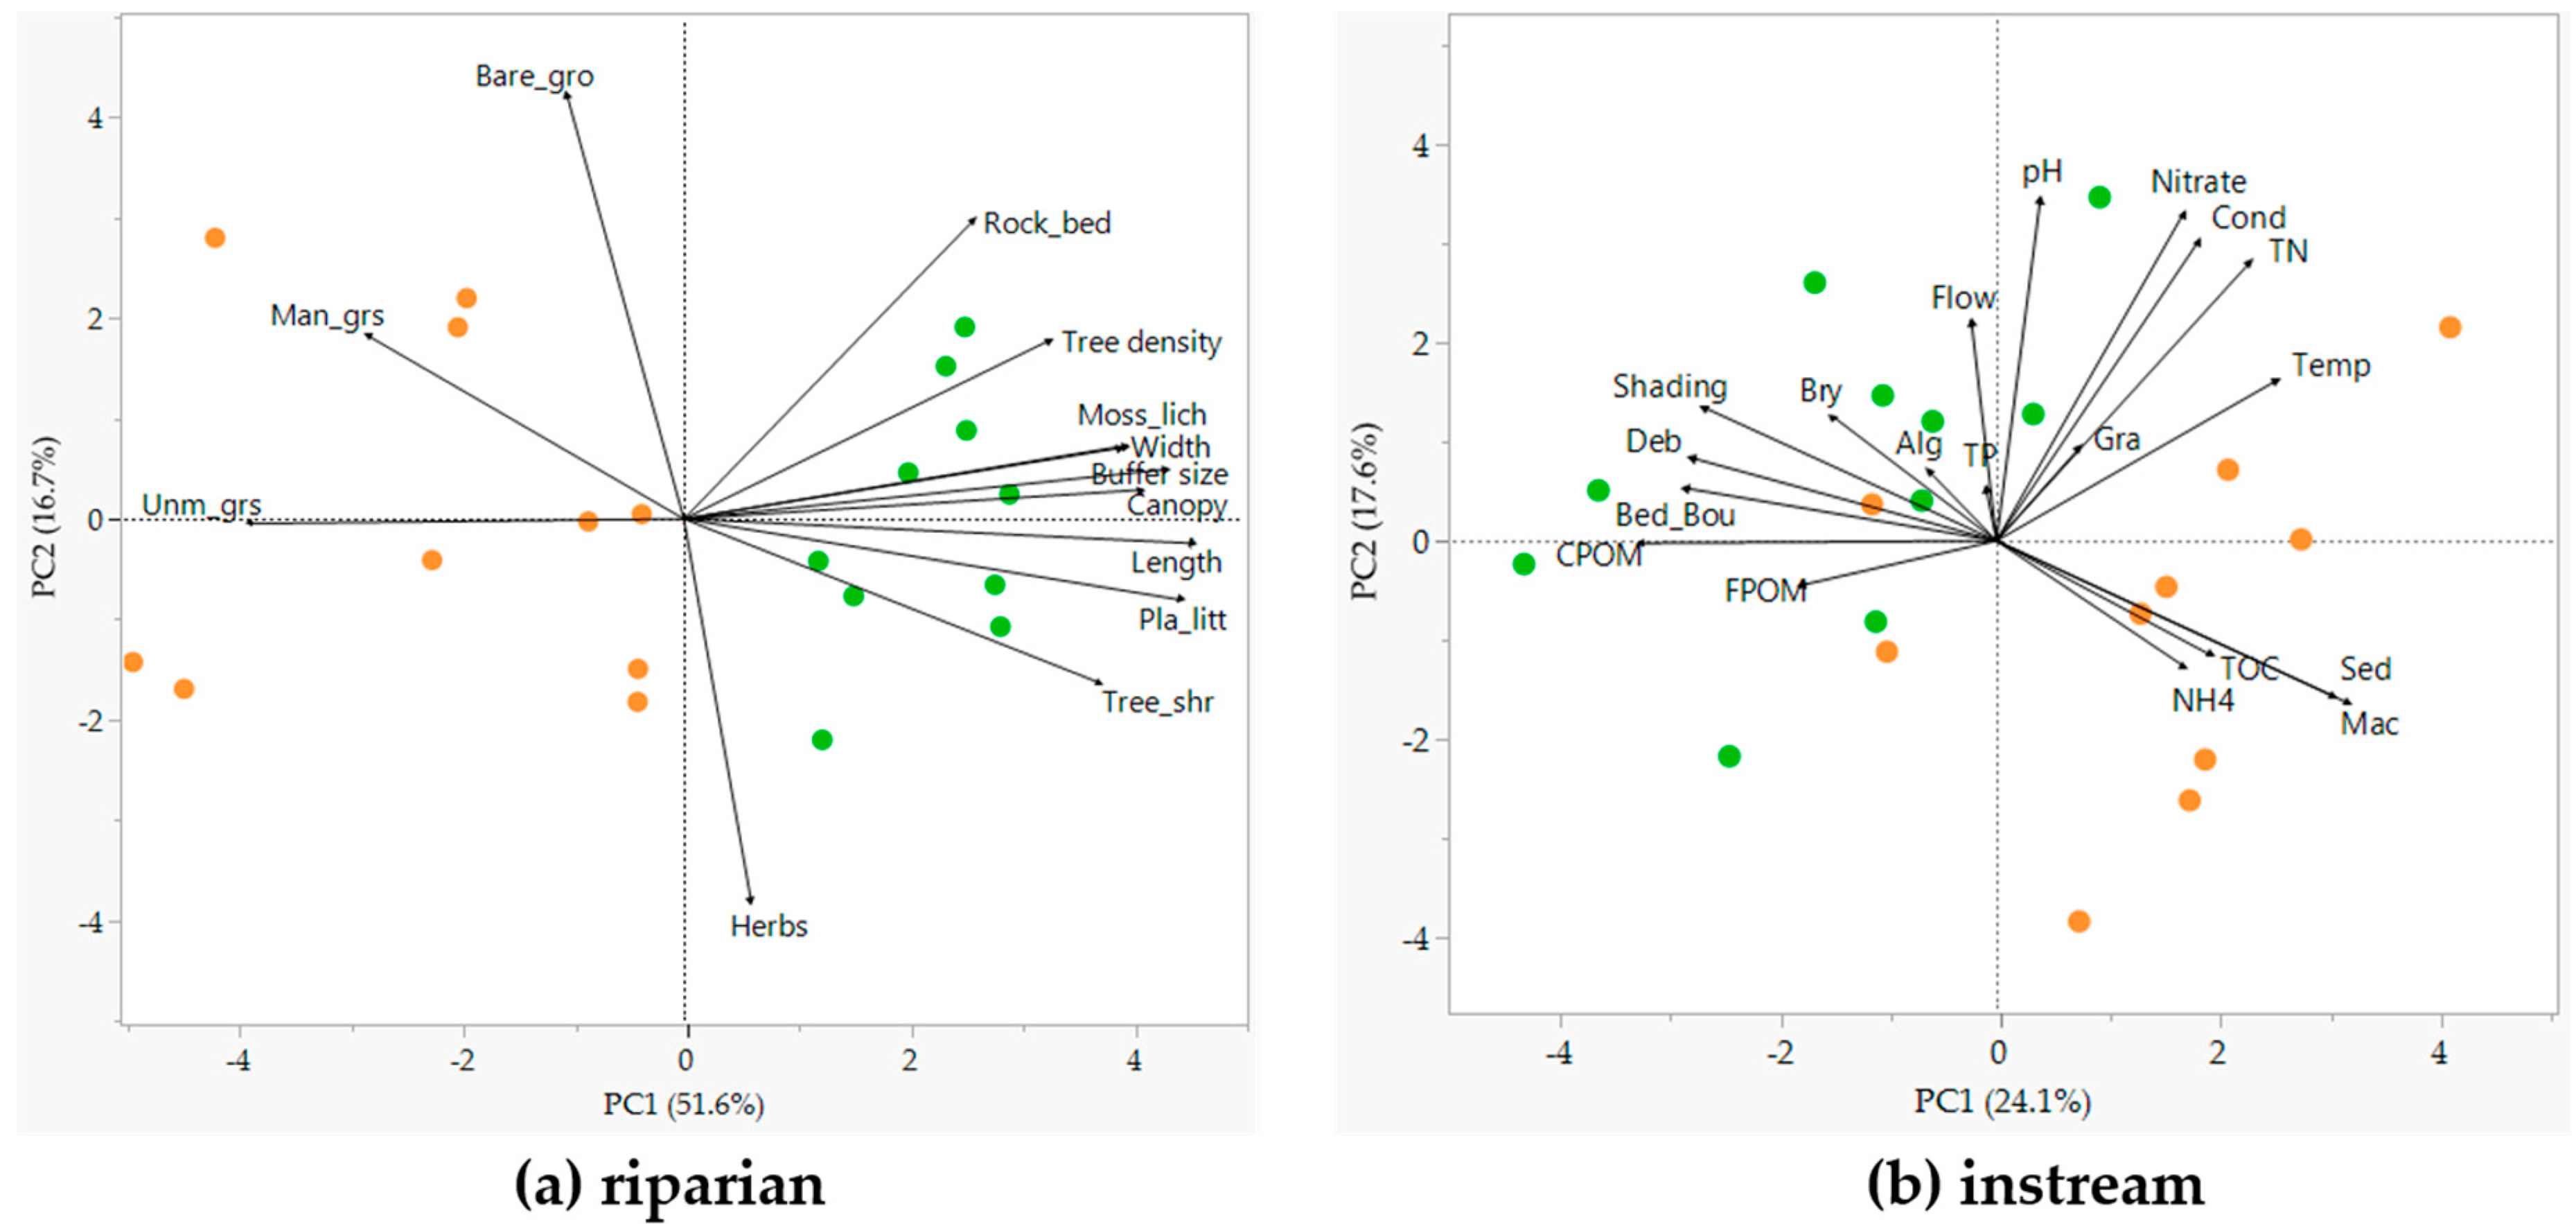
3.1. Riparian and Instream Habitats (Hypothesis 1)

Principal Component Analysis (PCA) of selected environmental variables, describing riparian buffer properties (Figure 2a) and instream characteristics (Figure 2b), showed clear differences between unbuffered and buffered reaches. The first two axes combined explained more variations for riparian properties (68.3%) than instream variables (41.7%), with the first axis for riparian buffer properties explaining the majority of the variation between reaches (51.6%). Furthermore, the two axes in both plots clearly reflected gradients related to changes in the riparian characteristics and vegetation cover between study reaches, with buffered reaches correlated with riparian buffer size (length/width) and percentage of canopy cover and plant litter, as well as instream CPOM (loadings > 0.8 and −0.7 along the first PC axis). Unbuffered reaches, on the other hand, were correlated with the higher presence of unmanaged grass in the riparian zone, as well as instream macrophyte cover and fine sediment (loadings −0.8 and > 0.7 along first PC axis).
Paired t-tests showed significant differences for 17 out of the 34 environmental variables tested (p < 0.05, Table S1). The size, length and width of the riparian buffer zone, percentage of trees/shrubs, plant litter and moss/lichens were higher at buffered than unbuffered reaches, whilst for instream habitat, flow, shading (% canopy cover), pH, CPOM and woody debris differed significantly. Unbuffered reaches had a deeper channel depth, higher percentage of unmanaged and managed grass in the riparian zone, as well as instream macrophyte cover and fine sediment. Nutrient levels did not differ between the reaches. At both unbuffered and buffered reaches, forest was the dominant type of land cover, but catchment land use categories were excluded from the t-tests as the stream pairs (unbuffered, buffered streams reaches) were nested within the same sub-catchments.

3.2. Taxonomic and Trait Differences Between Study Reaches (Hypotheses 2, 3a and 3b)

A total of 94 taxa were recorded among the study reaches, belonging to 62 families and six taxa classified at a higher taxonomical level due to difficulties in identification (e.g., Oligochaeta) (Table S2). In total, 33,097 individuals were identified. Taxon richness and abundance did not differ between the study reaches: 26 ± 6 taxa and 4310 ± 2601 ind/m2 at the buffered reaches and 24 ± 5 taxa and 6705 ± 4393 ind/m2 at the unbuffered reaches. The most abundant families at both study reaches, based on overall abundance means, were Pisidiidae and Gammaridae, followed by Chironomidae, Oligochaeta, Asellidae and Elmidae (Table S2). The percentage of individuals of EPT taxa (Ephemeroptera, Plecoptera and Trichoptera) was higher at buffered (21.1 ± 16.5%) compared to the unbuffered (14.1 ± 7.2%) reaches, even though this trend was not significant at the 5% level (t-ratio = 1.98, p = 0.078).
Contrary to our expectations in the second hypothesis, alpha diversity, measured as Shannon–Wiener, Simpson, evenness and dominance (Table S3), did not differ between the study reaches (paired t-test, p > 0.05). Relative abundances of several individual taxa differed, however (here, we also included nearly significant taxa that might indicate changes between the reaches): Chironomini midges (t-ratio = 2.33, p = 0.045) and the nemourid stonefly Nemoura sp. (t-ratio = 2.31, p = 0.046) were more abundant at unbuffered reaches, whilst elmid riffle beetles Limnius volckmari (t-ratio = −2.57, p = 0.030), the glossamatid Hydraena sp. (t-ratio = −2.17, p = 0.058), the mayfly Baetis rhodani (t-ratio = −2.18, p = 0.057) and the caddisflies Agapetus ochripes (t-ratio = −2.43, p = 0.038) and Ryacophila nubila (t-ratio = −2.25, p = 0.051) were more abundant at buffered reaches, thus supporting our second hypothesis.
Similarly, a number of macroinvertebrate traits differed between unbuffered and buffered reaches, lending support to our third hypothesis. As predicted, community-weighted mean (CWM) traits showing a preference for gravel substrates (t-ratio = −3.33, p = 0.009) and active aerial dispersal (t-ratio = −2.66, p = 0.026) were more prevalent at the buffered reaches, whilst preferences for null flow (<5 cm/s, t-ratio = −2.84, p = 0.019), were more common at the unbuffered reaches. Contrary to our expectations, scraper abundances and plastron respiration (t-ratio = −3.16, p = 0.012) were higher at buffered than unbuffered reaches (t-ratio = −3.57, p = 0.006), while CPOM substrate preference (organic/detritus/litter) (t-ratio = 2.2, p = 0.055) was higher at the unbuffered reaches. Shredder abundances did not differ between reaches (paired t-test, p > 0.05).
Visual inspection of unconstrained ordination (NMDS) of taxonomic and trait community compositions also supported predictions in hypotheses 2, 3a and 3b as unbuffered and buffered reaches tend to group separately (Figure S1). However, PERMANOVA did not detect a systematic differentiation overall (taxa: F = 0.87, p = 0.199; traits: F = 1.28, p = 0.12). Nevertheless, SIMPER analysis showed that the top 10 ranking taxa accounted for 42.5% and top 10 traits accounted for 50.8%, of the macroinvertebrate community dissimilarities between buffered and unbuffered reaches (Table S4). The four top ranked taxa (Gammarus pulex, Pisidium sp., Limnius volckmari and Simuliidae) accounted for >20% of the dissimilarity between reaches. For functional traits, between-reach type dissimilarities were mainly due to differences in life-history traits (size and voltinism), feeding preferences and respiration. The overall dissimilarity between the unbuffered and buffered reaches revealed by SIMPER analysis was higher for taxa (54.6%) than traits (11.2%).

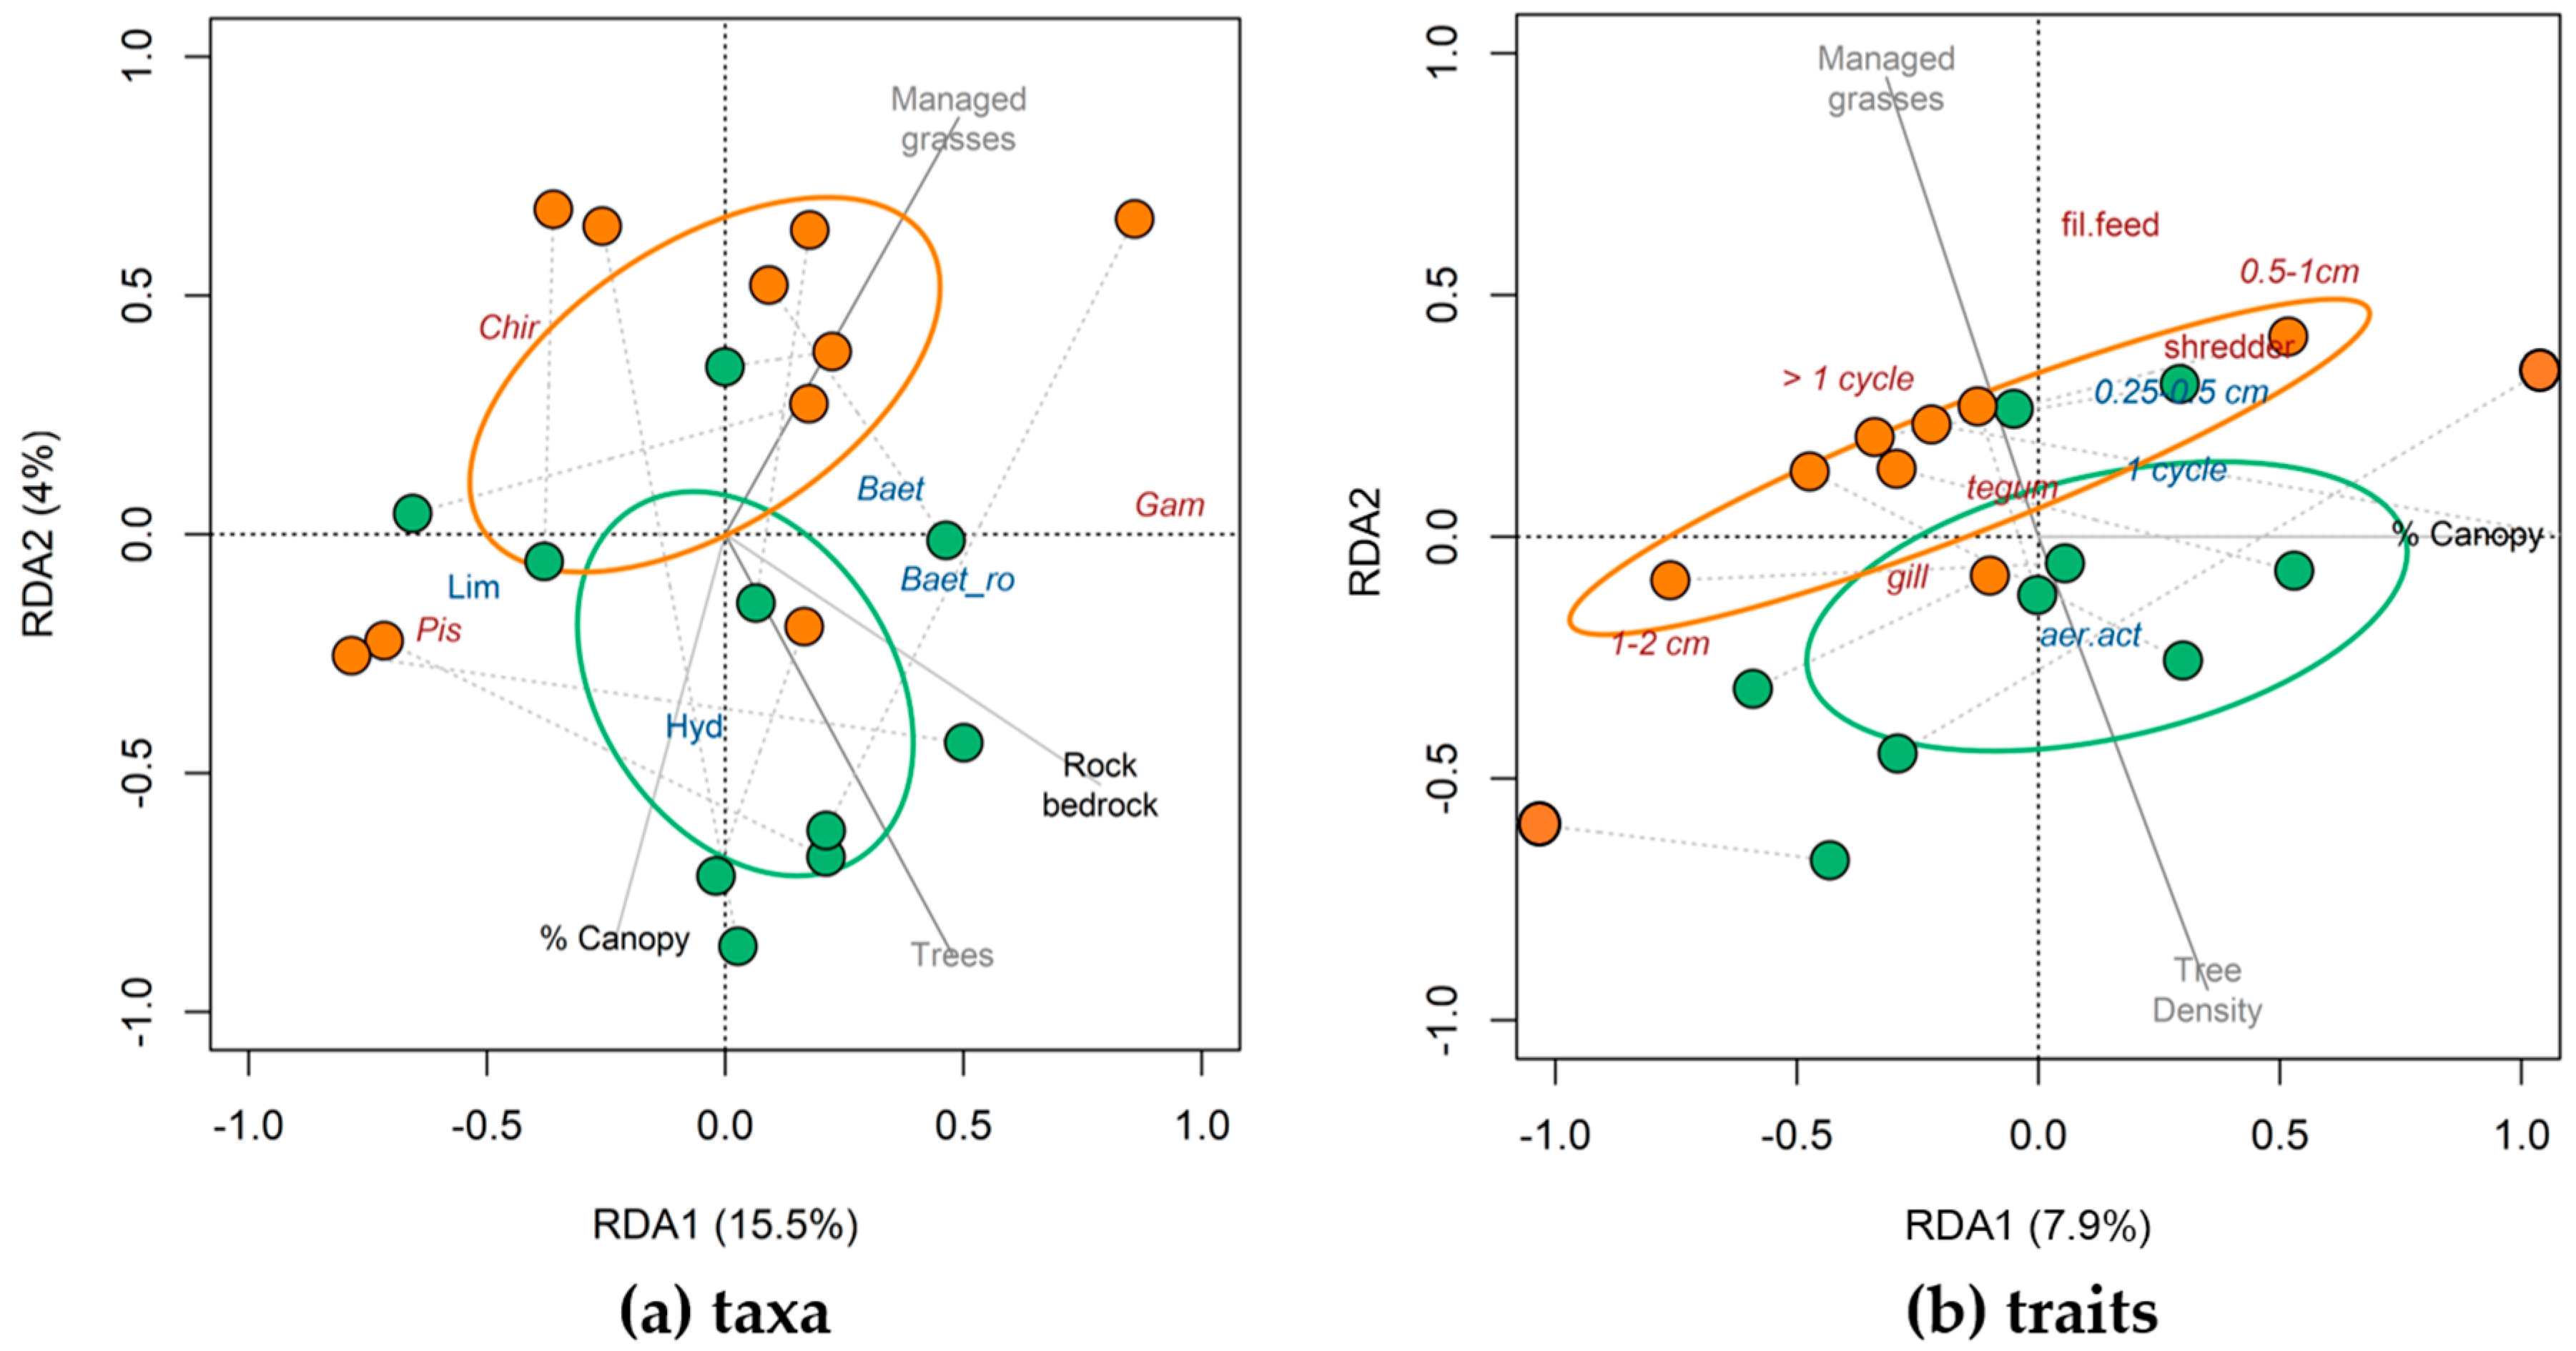
3.3. Taxonomic and Trait Responses to Environmental Variables (Hypothesis 4)

The forward selection procedure (i.e., for redundancy analysis (RDA)) resulted in parsimonious eight-variable model for both taxonomic and trait composition (Table 2). For taxonomic composition, the first two RDA axes explained 34% of total between reach variation. Instream characteristics explained between 4% (% gravel) to 16% (% algae) of the variability, followed by spatial variables (e.g., PCNM1 11%), catchment area (8%) and riparian characteristics (3–7%). By comparison, the first two RDA axes explained 51.3% of between-reach variation in trait composition. Instream variables explained the most variability (13–24%), but catchment area (19%) was a stronger predictor than spatial variability (6–13%), followed by riparian characteristics (8%).
In ordered to test the independent effects of the local habitat attributes and the direct contribution of riparian buffers to macroinvertebrate community composition, as considered in Hypothesis 4, we used partial redundancy analysis (pRDA). These results are presented in Tables S5 and S6. The pRDA model for taxonomic composition (Figure 3a) included two variables (% of canopy cover and % of rock/bedrock) which explained 19.5% variability between the study reaches. The pRDA model for trait composition included only one variable (% canopy cover), which independently explained 7.9% of variation (Figure 3b). The pRDA results are also consistent with the results from our SIMPER analysis.
Variation partitioning showed that riparian characteristics (% of canopy cover and rock/bedrock), catchment area nor spatial location were significant (p > 0.05). However, the shared variation between instream habitat and riparian characteristics explained 2% of the variability in taxonomic composition and 7% in trait composition. More results are available in Figure S2.

4. Discussion

Stream ecosystems are strongly connected to their adjacent terrestrial ecosystems, with riparian characteristics known to be strong predictors of instream physicochemical characteristics and biological communities [46]. Altered or loss of riparian vegetation from human land uses can result in biodiversity loss and shifts in species composition of aquatic communities [15,18]. However, studies of the effects of riparian land use on stream communities are inconsistent. For example, studies have shown both strong [12,46,47,48,49] or only weak effects [5,19] of riparian buffers on instream macroinvertebrate communities. We quantified the importance of forested buffers on instream habitats and macroinvertebrate biodiversity and trait composition using a paired-site approach, with upstream unbuffered and downstream buffered reaches in 10 streams. Our study showed significant differences in instream habitat and macroinvertebrate taxonomic and trait composition between unbuffered and buffered reaches, thus corroborating previous studies [11,12,13].

4.1. Changes in Riparian and Instream Habitats

Consistent with our predictions, ordination analyses and paired t-tests showed clear differences in instream habitat related to riparian characteristics. Indeed, 50% of the variables tested (nine riparian and eight instream) differed significantly between the study reaches. The strongest instream differences were related directly to differences in riparian habitat (e.g., vegetation cover). Buffered reaches had greater canopy cover, increased shading, higher amounts of large woody debris and CPOM, whilst unbuffered reaches were characterized by fine sediments and greater cover of macrophytes. That riparian buffers result in altered instream habitat is well established. For example, Burdon et al. [14] found that degraded riparian condition was associated with changes to instream habitat that included reduced flow velocities and increased sedimentation in agricultural streams. Other studies have similarly shown improved hydromorphological habitat quality in forested reaches when compared with open agricultural reaches [50,51]. While benefits of woody riparian buffers for shading, stream flow and benthic habitats were evident in our study, they were not matched with a significant improvement in water quality (i.e., nutrient concentrations). Our characterization of nutrient levels were based on only a few sampling dates and may not have been sufficient to detect subtle differences between our paired reaches. Nevertheless, these results suggest that the capacity for a local scale mitigation measure (i.e., forested buffers) to achieve dramatic improvements in nutrient pollution arising from land use at the catchment scale may be limited.

4.2. Taxonomic and Trait Changes in Buffered and Unbuffered Reaches

Changes in instream habitat due to the loss of riparian vegetation can have strong effects on invertebrate communities [14,46,50], manifesting in altered macroinvertebrate taxonomic and trait composition between buffered and unbuffered reaches in our study. NMDS and RDA analyses showed that species traits discriminated instream differences between the paired reaches with greater resolution than taxonomic composition; a finding that is consistent with previous work showing that traits better reflect functional patterns and processes than taxonomic composition [52,53]. In our study, life history traits related to voltinism, development time and body size, along with feeding preferences and respiration contributed to the dissimilarity between buffered and unbuffered reaches.
We expected that basal resources would change with a shift from autochthonous to allochthonous food resources in buffered reaches as incident light and stream temperatures decreased. For example, Allan et al. [18] showed that the relative abundance of scrapers decreased with greater vegetation cover and Wallace et al. [8] showed experimentally that excluding leaf litter and woody debris from the streams resulted in a significant decrease in abundance of shredders, gatherers and predators in mixed substrate habitats. In buffered reaches, higher inputs of allochthonous leaf litter and woody debris originating from the adjacent riparian vegetation was expected to result in a higher diversity and proportion of shredders (e.g., [34]). However, although the cover of woody debris and CPOM was higher in buffered reaches, shredder abundances failed to track these changes. This result likely reflects the very high abundances of the crustacean Gammarus pulex in unbuffered reaches, which is often the dominant shredder in southern Swedish streams but feeds on other resources also, including other invertebrates [54].
We found significantly higher abundances of macrophytes in unbuffered reaches supporting the conjecture that lower shading resulted in increased primary production. However, our prediction that unbuffered reaches would also have higher algal coverage and consequently higher scraper abundances was not supported—scraper abundances were significantly higher in buffered reaches. This finding could be due to differences in substrata (e.g., unbuffered reaches were dominated by fine sediment, whilst buffered reaches were more characterized by gravels).
Combined, these findings suggest that much of the macrophyte-driven primary production found in unbuffered reaches is likely entering aquatic food webs through detrital pathways via high abundances of G. pulex feeding on decaying macrophytes. High densities of gammarids potentially divert energy from the aquatic food web into trophic “cul-de-sacs” [55], because cross-habitat connectivity predominantly relies on insects with an adult flying stage as the primary vector for transferring energy and nutrients from aquatic to terrestrial food webs [56].
As predicted, taxa with a preference for gravel substrates and active aerial dispersal were more abundant at buffered reaches. These included EPT taxa, well known for their sensitivity to pollution and their preference for flowing, oxygen-rich waters and hard-bottom substrata [30,32,57]. Three species, in particular, were more abundant: the glossosomatid caddisfly Agapetus ochripes, the rhyacophilid caddisfly Ryacophila nubile and the baetid mayfly Baetis rhodani. The abundances of R. nubila were potentially explained by their preference for areas with moderate to high current velocities, in addition to their known predation of the Simullidae, which are often present in large numbers in these habitats [58,59]. Increased abundances of A. ochripes likely reflected differences in benthic habitat, since Glossosomatidae build cases of stones and cling to boulders, cobbles and large wood in well-oxygenated, flowing stream reaches, feeding on attached algae and FPOM [34]. Contrary to our expectations, we found higher proportion of plastron breathing taxa at the buffered reaches, which is most likely associated with the high abundance of adult coleopterans (i.e., Limnius volckmari, Hydraena sp. and family Haliplidae).
Invertebrate traits associated with depositional habitats (e.g., preference for or tolerance of negligible flow conditions and CPOM substrate preferences) were more prevalent in unbuffered reaches. We observed high abundances of Pisidium which was expected given these filter-feeding molluscs are commonly found in agricultural streams with slow velocities and a predominance of fine sediments [60,61].

4.3. Taxonomic and Trait Response to Environmental Variables

Constrained ordination (RDA) and variation partitioning (pRDA) revealed that the strongest predictors of macroinvertebrate communities between our paired reaches were related to nutrient enrichment, instream productivity and benthic habitat quality (e.g., % gravel). Although riparian characteristics alone explained only a minor proportion of the variability in taxonomic composition between our study reaches and was for the most part a negligible predictor of trait composition, these findings do not imply that riparian characteristics are not robust predictors of changes in the macroinvertebrate communities. The shared variation of functional community composition explained by riparian and instream factors (7%) indicate the strong linkage between aquatic and terrestrial habitats at the reach scale in our study. For example, instream shading was highly correlated with riparian canopy cover and, although our analyses failed to detect a significant effect of shading on instream water temperatures, many other studies have shown shading effects on water temperatures, e.g., [26,46]. In particular, the presence of riparian vegetation has been shown to moderate seasonal and diel variations of instream temperatures, e.g., [26,62,63]. Consequently, reforestation of riparian habitats is consequently used in ecosystem management for reducing or mitigating the effects of climate warming on instream communities [64]. The abundance and type of riparian vegetation also strongly affects instream basal resources directly through inputs of allochthonous organic matter and indirectly by altering incident light and thereby autochthonous production [50,65]. Hence, both water temperatures as a strong physiological driver and basal resources are considered as important determinants of instream biodiversity and function [18].
We implicitly assumed that we would be able to detect strong effects of environ-mental filtering (i.e., species sorting; [66]) on invertebrate communities due to changes in riparian and stream habitat. However, metacommunity theory has emphasized that community structure is determined not only by local abiotic environmental conditions (i.e., environmental filtering leading to species sorting), but also by biotic interactions and dispersal [67]. In particular, mass effects (i.e., the presence of species in environmentally suboptimal reaches due to high dispersal rates from environmentally suitable reaches) may obscure changes in α-diversity [68]. We found that, contrary to our expectations, metrics of α-diversity (e.g., taxa richness) did not differ between buffered and unbuffered reaches. This result might reflect spatial proximities of our paired unbuffered and buffered sites, which could allow mass effects from upstream reaches could influence local diversity patterns. For instance, forested reaches further upstream from our reach pairs could lead to the presence of sensitive taxa at unbuffered, downstream reaches and the relatively short distances between the paired reaches meant that tolerant taxa from unbuffered reaches could also be present downstream even though habitat conditions improved. However, we did see changes in β-diversity patterns between buffered and unbuffered reaches, with abundances of key taxa changing due to environmental filtering. The relative abundances of species and function composition are increasingly used to describe differences in β-diversity patterns [69]. Our trait analyses provided evidence of this with increased abundances of taxa with a preference for gravel substrates matching the change in benthic habitat conditions (% gravel) in the buffered reaches. These changes likely contributed to the increased abundances of sensitive EPT taxa in reaches with a forested riparian buffer.

4.4. Implications for Cross-Ecosystem Connectivity

Active aerial dispersal is typically related to larger insect body sizes and greater development time (e.g., Odonata, Ryacophilidae) and, thus, could reflect differing sensitivities to disturbance and/or reliance on autochthonous and allochthonous food resources [17]. Larger organisms generally live longer and, thus, may be more at risk of environmental fluctuations [70]. This could include extreme events (e.g., pollution, heatwaves) or summer low flows that lead to sedimentation, reduced oxygen concentrations and increased stream temperatures. The increased abundances of caddisflies like R. nubile in buffered reaches could be particularly important as actively aerial dispersers. Ecological theory predicts that larger organisms have greater metabolic demands [71] and, thus, actively aerial dispersing insects could be constrained by food quality and quantity. Allochthonous inputs of terrestrial organic matter were significantly higher in buffered reaches and although macrophytes were more prevalent in unbuffered reaches, filamentous algae cover was not significantly different between reach types.
The higher abundances of aquatic insects with a relatively large body size and aerial dispersal in buffered reaches may have repercussions for the transfer of nutrients and energy into terrestrial food webs [72]. For example, the biomass of stream insects sharing these traits has been correlated with riparian spider biomass and abundances [73]. However, in addition to the higher abundances of invertebrates completely lacking an adult flying stage in unbuffered reaches, the greater prevalence of passively aerial dispersing insects may also dampen cross-habitat connectivity in our streams. We observed more chironomid midges at unbuffered reaches which are weak fliers and their dispersal has been shown to be restricted to the stream edges [74]. Therefore, higher abundances with active aerial dispersing taxa at the buffered reaches in our study indicate the potential for the reciprocal transfer of subsidies to terrestrial ecosystems [5,47,75,76,77].

5. Conclusions

We found evidence of positive influence with changes in stream habitat and increased abundances of sensitive EPT stream insects at buffered reaches. The strong effect of riparian forest on shading was notable because of its potential to help reduce the growths of nuisance aquatic vegetation (i.e., filamentous green algae and macrophytes) and moderate stream temperatures.
We also used invertebrate traits to explore how riparian vegetation structure potentially affects stream-riparian food webs. Some of our results were counter-intuitive (i.e., high abundances of gammarid amphipod G. pulex at unbuffered sites); however, we did see evidence of potentially more stable food webs in buffered reaches, where increased inputs of terrestrial organic matter were complemented by the greater presence of coarse benthic substrate helping to facilitate grazing and scraping invertebrates (i.e., caddisfly A. ochripes). The higher abundances of active aerial dispersing stream insects in the buffered reaches also suggested that cross-habitat connectivity with riparian food webs could be strengthened, reflecting an increased reciprocal transfer of nutrients and energy to terrestrial ecosystems. Future work will focus more on how riparian vegetation structure influences these connections by quantifying feeding linkages and looking at seasonal patterns in insect emergence and riparian predator communities. We contend that forest riparian buffers could be a valuable management tool as a nature-based solution enabling adaptation to climate change in agricultural areas. Our present study has contributed to the development of a general framework for implementing forested riparian buffers in human-impacted landscapes by demonstrating the mitigation of agricultural impacts by riparian forest patches. These improvements add to the broad portfolio of benefits that riparian forest buffers can provide in modified landscapes.

Supplementary Materials

The following are available online at https://www.mdpi.com/article/10.3390/w13081028/s1, Table S1. Environmental variables (mean ± 1 SD) at unbuffered and buffered reaches in 10 boreal streams; Table S2. List of 62 families and 6 higher taxonomic groups, arranged by the highest abundance at the unbuffered sites; Table S3. Average values of invertebrate taxa and biodiversity indices at the buffered and unbuffered reaches; Table S4. Analysis of similarity (SIMPER) of taxonomic and trait community differences between unbuffered (n = 10) and buffered (n = 10) reaches; Table S5. Macroinvertebrate taxa scores (n = 94) from the partial redundancy analysis model (pRDA) conditioning out confounding influences of instream properties as well as spatial structure and catchment characteristics; Table S6. Trait distribution scores (n = 39) from the partial redundancy analysis model (pRDA) conditioning out confounding influences of instream properties as well as spatial structure and catchment characteristics; Figure S1. Unconstrained ordination (NMDS) of reaches based on Hellinger transformed taxa (a) and community weighted means of traits (b); Figure S2. Venn diagram showing variation partitioning (VP) of taxonomic (a) and trait (b) composition of macroinvertebrate communities in 20 study reaches.

Author Contributions

Conceptualization, J.S., R.K.J., F.J.B., B.G.M.; methodology, J.S., R.K.J., B.G.M., F.J.B., A.T., G.R., P.G.; software, F.J.B.; validation, J.S., F.J.B.; formal analysis, J.S., R.K.J., F.J.B., A.T.; investigation, J.S., F.J.B.; resources, F.J.B.; data curation, J.S., F.J.B.; writing—original draft preparation, J.S., R.K.J., F.J.B.; writing—review and editing, J.S., R.K.J., F.J.B., B.G.M., A.T., G.R., P.G.; visualization, J.S., F.J.B.; supervision, R.K.J., F.J.B., B.G.M.; project administration, J.S., F.J.B., B.G.M., G.R., P.G.; funding acquisition, R.K.J., B.G.M., G.R., P.G. All authors have read and agreed to the published version of the manuscript.

Funding

This research was conducted as part of the CROSSLINK project funded through the 2015–2016 BiodivERsA COFUND call for research proposals. National funders: the Swedish Research Council for Sustainable Development (FORMAS, project 2016-01945, and project 2017-00472) and the Swedish Environmental Protection Agency; The Research Council of Norway (NFR, project 264499); The Research Foundation of Flanders (FWO, project G0H6516N), Belgium; the Romanian National Authority for Scientific Research and Innovation (CCCDI—UEFISCDI, project BiodivERsA3-2015-49-CROSSLINK, within PNCDI III); and the Federal Ministry of Education and Research (BMBF, project FKZ: 01LC1621A), Germany.

Institutional Review Board Statement

Not applicable.

Informed Consent Statement

Not applicable.

Data Availability Statement

The data presented in this study are available in Supplementary Materials.

Acknowledgments

We thank landowners for access to the sites. Ellinor Ramberg and Erik Gunnars contributed in the field with technical support from Mikael Östlund. Joel Segersten helped with the GIS data. Karin Wallman and the Geochemical Laboratory processed water samples. Lars Eriksson from the Bio-diversity Laboratory identified macroinvertebrate samples, supported by Magda-Lena Wiklund McKie. Joel Berglund at Länsstyrelsen Uppsala Län provided useful information regarding potential field sites.

Conflicts of Interest

The authors declare no conflict of interest.

References

  1. Naiman, R.J.; Décamps, H. The ecology of interfaces: Riparian Zones. Annu. Rev. Ecol. Syst. 1997, 28, 621–658. [Google Scholar] [CrossRef] [Green Version]
  2. Vidal-Abarca, M.R.; Santos-Martin, F.; Martin-Lopez, B.; Sanchez-Montoya, M.M.; Suarez Alonso, M.L. Exploring the capacity of water framework directive indices to assess ecosystem services in fluvial and riparian systems: Towards a second implementation phase. Environ. Manag. 2016, 57, 1139–1152. [Google Scholar] [CrossRef] [PubMed]
  3. Naiman, R.J.; Décamps, H.; McClain, M.; Likens, G. Biophysical connectivity and riparian functions. In Riparia: Ecology, Conservation, and Management of Streamside Communities; Academic Press: Burlington, NJ, USA, 2005; pp. 159–187. [Google Scholar]
  4. Naiman, R.J.; Decamps, H.; Pollock, M. The role of riparian corridors in maintaining regional biodiversity. Ecol. Appl. 1993, 3, 209–212. [Google Scholar] [CrossRef] [PubMed]
  5. Burdon, F.J.; Ramberg, E.; Sargac, J.; Forio, M.A.E.; de Saeyer, N.; Mutinova, P.T.; Moe, T.F.; Pavelescu, M.O.; Dinu, V.; Cazacu, C.; et al. Assessing the Benefits of Forested Riparian Zones: A Qualitative Index of Riparian Integrity Is Positively Associated with Ecological Status in European Streams. Water 2020, 12, 1178. [Google Scholar] [CrossRef] [Green Version]
  6. Bjelke, U.; Boberg, J.; Oliva, J.; Tattersdill, K.; McKie, B.G. Dieback of riparian alder caused by the Phytophthora alni complex: Projected consequences for stream ecosystems. Freshw. Biol. 2016, 61, 565–579. [Google Scholar] [CrossRef] [Green Version]
  7. Vannote, R.L.; Minshall, G.W.; Cummins, K.W.; Sedell, J.R.; Cushing, C.E. The River Continuum Concept. Can. J. Fish. Aquat. Sci. 1980, 37, 130–137. [Google Scholar] [CrossRef]
  8. Wallace, J.B.; Judy, S.L.E.; Meyer, L.; Webster, J.R. Effects of resource limitation on a detrital-based ecosystem. Ecol. Monogr. 1999, 69, 409–442. [Google Scholar] [CrossRef]
  9. Hagen, E.M.; McTammany, M.E.; Webster, J.R.; Benfield, E.F. Shifts in allochthonous input and autochthonous production in streams along an agricultural land-use gradient. Hydrobiologia 2010, 655, 61–77. [Google Scholar] [CrossRef]
  10. Ledesma, J.L.J.; Futter, M.N.; Blackburn, M.; Lidman, F.; Grabs, T.; Sponseller, R.A.; Laudon, H.; Bishop, K.H.; Köhler, S.J. Towards an improved conceptualization of riparian zones in Boreal forest headwaters. Ecosystems 2017, 21, 297–315. [Google Scholar] [CrossRef] [Green Version]
  11. Dudgeon, D. The influence of riparian vegetation on macroinvertebrate community structure and functional organization in 6 new Guinea streams. Hydrobiologia 1994, 294, 65–85. [Google Scholar] [CrossRef]
  12. Arnaiz, O.L.; Wilson, A.L.; Watts, R.J.; Stevens, M.M. Influence of riparian condition on aquatic macroinvertebrate communities in an agricultural catchment in south-eastern Australia. Ecol. Res. 2010, 26, 123–131. [Google Scholar] [CrossRef]
  13. Verberk, W.C.; Bilton, D.T. Respiratory control in aquatic insects dictates their vulnerability to global warming. Biol. Lett. 2013, 9, 20130473. [Google Scholar] [CrossRef]
  14. Burdon, F.J.; McIntosh, A.R.; Harding, J.S. Habitat loss drives threshold response of benthic invertebrate communities to deposited sediment in agricultural streams. Ecol. Appl. 2013, 23, 1036–1047. [Google Scholar] [CrossRef] [PubMed]
  15. Strand, M.; Merritt, R.W. Impacts of livestock grazing activities on stream insect communities and the riverine environment. Am. Entomol. 1999, 45, 13–29. [Google Scholar] [CrossRef] [Green Version]
  16. McKie, B.G.; Sandin, L.; Carlson, P.E.; Johnson, R.K. Species traits reveal effects of land use, season and habitat on the potential subsidy of stream invertebrates to terrestrial food webs. Aquat. Sci. 2018, 80, 15. [Google Scholar] [CrossRef] [Green Version]
  17. Verberk, W.C.E.P.; Siepel, H.; Esselink, H. Life-history strategies in freshwater macroinvertebrates. Freshw. Biol. 2008, 53, 1722–1738. [Google Scholar] [CrossRef]
  18. Allan, J.D. Landscapes and Riverscapes: The influence of land use on stream ecosystems. Annu. Rev. Ecol. Evol. Syst. 2004, 35, 257–284. [Google Scholar] [CrossRef] [Green Version]
  19. Wooster, D.E.; DeBano, S.J. Effect of woody riparian patches in croplands on stream macroinvertebrates. Arch. Hydrobiol. 2006, 165, 241–268. [Google Scholar] [CrossRef]
  20. Lind, L.; Hasselquist, E.M.; Laudon, H. Towards ecologically functional riparian zones: A meta-analysis to develop guidelines for protecting ecosystem functions and biodiversity in agricultural landscapes. J Environ. Manag. 2019, 249, 109391. [Google Scholar] [CrossRef]
  21. Mander, Ü.; Hayakawa, Y.; Kuusemets, V. Purification processes, ecological functions, planning and design of riparian buffer zones in agricultural watersheds. Ecol. Eng. 2005, 24, 421–432. [Google Scholar] [CrossRef]
  22. Alvarenga, L.A.; Mello, C.R.D.; Colombo, A.; Cuartas, L.A. Hydrologic impacts due to the changes in riparian buffer in a headwater watershed. Cerne 2017, 23, 95–102. [Google Scholar] [CrossRef] [Green Version]
  23. Stutter, M.I.; Chardon, W.J.; Kronvang, B. Riparian buffer strips as a multifunctional management tool in agricultural landscapes: Introduction. J. Environ. Qual. 2012, 41, 297–303. [Google Scholar] [CrossRef] [Green Version]
  24. Tabacchi, E.; Lambs, L.; Guilloy, H.; Planty-Tabacchi, A.-M.; Muller, E.; Decamps, H. Impacts of riparian vegetation on hydrological processes. Hydrol. Process. 2000, 14, 2959–2976. [Google Scholar] [CrossRef]
  25. Burrell, T.; O’Brien, J.; Graham, E.; Simon, K.; Harding, J.; McIntosh, A. Riparian shading mitigates stream eutrophication in agricultural catchments. Freshw. Sci. 2014, 33, 73–84. [Google Scholar] [CrossRef]
  26. Johnson, R.K.; Almlöf, K. Adapting boreal streams to climate change: Effects of riparian vegetation on water temperature and biological assemblages. Freshw. Sci. 2016, 35, 984–997. [Google Scholar] [CrossRef]
  27. Amy, J.; Robertson, A.I. Relationships between livestock management and the ecological condition of riparian habitats along an Australian floodplain river. J. Appl. Ecol. 2001, 38, 63–75. [Google Scholar] [CrossRef]
  28. Cole, L.J.; Stockan, J.; Helliwell, R. Managing riparian buffer strips to optimise ecosystem services: A. review. Agric. Ecosyst. Environ. 2020, 296, 106891. [Google Scholar] [CrossRef]
  29. Angeler, D.G.; Allen, C.R.; Birgé, H.E.; Drakare, S.; McKie, B.G.; Johnson, R.K. Assessing and managing freshwater ecosystems vulnerable to environmental change. Ambio 2014, 43, 113–125. [Google Scholar] [CrossRef] [Green Version]
  30. Johnson, R.K. Freshwater Biomonitoring Using Individuals Organisms, Populations, and Species Assemblages of Benthic Macroinvertebrates; Swedish University of Agricultural Sciences: Uppsala, Sweden, 1993; pp. 40–158. [Google Scholar]
  31. Menezes, S.; Baird, D.J.; Soares, A.M.V.M. Beyond taxonomy: A review of macroinvertebrate trait-based community descriptors as tools for freshwater biomonitoring. J. Appl. Ecol. 2010, 47, 711–719. [Google Scholar] [CrossRef]
  32. Rosenberg, D.M.; Resh, V.H. Freshwater Biomonitoring and Benthic Macroinvertebrates; Springer: New York, NY, USA, 1993. [Google Scholar]
  33. Woodward, G.; Gessner, M.O.; Giller, P.S.; Gulis, V.; Hladyz, S.; Lecerf, A.; Malmqvist, B.; McKie, B.G.; Tiegs, S.D.; Cariss, H.; et al. Continental-scale effects of nutrient pollution on stream ecosystem functioning. Science 2012, 336, 1438–1440. [Google Scholar] [CrossRef] [Green Version]
  34. Merritt, R.W.; Cummins, K.W. An Introduction to The Aquatic Insects of North America; Kendall Hunt Publishing Company: Dubuque, IO, USA, 2008. [Google Scholar]
  35. Verdonschot, R.C.M.; Kail, J.; McKie, B.G.; Verdonschot, P.F.M. The role of benthic microhabitats in determining the effects of hydromorphological river restoration on macroinvertebrates. Hydrobiologia 2016, 769, 5566. [Google Scholar] [CrossRef] [Green Version]
  36. Wentworth, C.K. A scale of grade and class terms for clastic sediments. J. Geol. 1922, 30, 377–392. [Google Scholar] [CrossRef]
  37. Tachet, H.; Richoux, P.; Usseglio-Polatera, P. Invertébrés d’eau douce. Systématique, Biologie, Écologie; CNRS Éditions: Paris, France, 2010. [Google Scholar]
  38. Chevene, F.; Doleadec, S.; Chessel, D. A fuzzy coding approach for the analysis of long-term ecological data. Freshw. Biol. 1994, 31, 295–309. [Google Scholar] [CrossRef]
  39. Lavorel, S.; Grigulis, K.; McIntyre, S.; Williams, N.S.G.; Garden, D.; Dorrough, J.; Berman, S.; Quétier, F.; Thébault, A.; Bonis, A. Assessing functional diversity in the field—Methodology matters! Funct. Ecol. 2008, 22, 134–147. [Google Scholar] [CrossRef]
  40. Clarke, K.R.; Gorley, R.N. PRIMER V5: User Manual/Tutorial; PRIMER-E Ltd.: Plymouth, UK, 2001. [Google Scholar]
  41. Borcard, D.; Gillet, F.; Legendre, P. Numerical Ecology With R.; Springer International Publishing: Cham, Switzerland, 2011. [Google Scholar]
  42. Oksanen, J.; Kindt, R.; Legendre, P.; O’Hara, B.; Simpson, G.; Solymos, P.; Stevens, M.H.H.; Wagner, H.; Oksanen, M. Vegan: Community Ecology Package. Version 1.15-4; R Foundation for Statistical Computing: Vienna, Austria, 2009. [Google Scholar]
  43. Dray, S.; Legendre, P.; Peres-Neto, P.R. Spatial modelling: A comprehensive framework for principal coordinate analysis of neighbour matrices (PCNM). Ecol. Model. 2006, 196, 483–493. [Google Scholar] [CrossRef]
  44. Blanchet, F.G.; Legendre, P.; Borcard, D. Forward selection of explanatory variables. Ecology 2008, 89, 2623–2632. [Google Scholar] [CrossRef] [PubMed]
  45. Hair, J.F.; Black, W.C.; Babin, B.J.; Anderson, R.E.; Tatham, R.L. Multivariate Data Analysis, 7th ed.; Pearson: New York, NY, USA, 2010. [Google Scholar]
  46. Turunen, J.; Elbrecht, V.; Steinke, D.; Aroviita, J. Riparian forests can mitigate warming and ecological degradation of agricultural headwater streams. Freshw. Biol. 2021, 66, 785–798. [Google Scholar] [CrossRef]
  47. Forio, M.A.E.; De Troyer, N.; Lock, K.; Witing, F.; Baert, L.; Saeyer, N.D.; Rîșnoveanu, G.; Popescu, C.; Burdon, F.J.; Kupilas, B.; et al. Small patches of riparian woody vegetation enhance biodiversity of invertebrates. Water 2020, 12, 3070. [Google Scholar] [CrossRef]
  48. Johnson, R.K.; Angeler, D.G.; Hallstan, S.; Sandin, L.; McKie, B.G. Decomposing multiple pressure effects on invertebrate assemblages of boreal streams. Ecol. Indic. 2017, 77, 293–303. [Google Scholar] [CrossRef]
  49. Muenz, T.K.; Golladay, S.W.; Vellidis, G.; Smith, L.L. Stream buffer effectiveness in an agriculturally influenced area, southwestern Georgia: Responses of water quality, macroinvertebrates, and amphibians. J. Environ. Qual. 2006, 35, 1924–1938. [Google Scholar] [CrossRef] [Green Version]
  50. Quinn, J.M.; Cooper, A.B.; Davies-Colley, R.J.; Rutherford, J.C.; Williamson, R.B. Land use effects on habitat, water quality, periphyton, and benthic invertebrates in Waikato, New Zealand, hill-country streams. N Z. J. Mar. Freshw. Res. 1997, 31, 579–597. [Google Scholar] [CrossRef]
  51. Sponseller, R.A.; Benfield, E.F.; Valett, H.M. Relationships between land use, spatial scale and stream macroinvertebrate communities. Freshw. Biol. 2001, 46, 1409–1424. [Google Scholar] [CrossRef] [Green Version]
  52. Townsend, C.R.; Uhlmann, S.S.; Matthaei, C.D. Individual and combined responses of stream ecosystems to multiple stressors. J. Appl. Ecol. 2008, 45, 1810–1819. [Google Scholar] [CrossRef]
  53. Truchy, A.; Göthe, E.; Angeler, D.G.; Ecke, F.; Sponseller, R.A.; Bundschuh, M.; Johnson, R.K.; McKie, B.G. Partitioning spatial, environmental, and community drivers of ecosystem functioning. Landsc. Ecol. 2019, 34, 2371–2384. [Google Scholar] [CrossRef] [Green Version]
  54. Nilsson, L.M.; Otto, C. Effects of population density and of presence of Gammarus pulex L. (Amphipoda) on the growth in larvae of Potamophylax cingulatus steph. (Trichoptera). Hydrobiologia 1977, 54, 109–112. [Google Scholar] [CrossRef]
  55. Power, M.E.; Dietrich, W.E. Food webs in river networks. Ecol. Res. 2002, 17, 451–471. [Google Scholar] [CrossRef]
  56. Burdon, F. Agriculture and Mining Contamination Contribute to a Productivity Gradient Driving Cross-Ecosystem Associations Between Stream Insects and Riparian Arachnids. In Contaminants and Ecological Subsidies: The Land-Water Interface; Kraus, J.M., Walters, D.M., Mills, M.A., Eds.; Springer International Publishing: Cham, Switzerland, 2020; pp. 61–90. [Google Scholar]
  57. Hall, L.W.; Killen, W.D.; Anderson, R.D.; Alden, R.W. The influence of physical habitat, pyrethroids, and metals on benthic community condition in an urban and residential stream in California. Hum. Ecol. Risk Assess. Int. J. 2009, 15, 526–553. [Google Scholar] [CrossRef]
  58. Graf, W.; Murphy, J.; Dahl, J.; Zamora-Muñoz, C.; López-Rodríguez, M.J. Distribution and Ecological Preferences of European Freshwater Species. Volume 1: Trichoptera; Schmidt-Kloiber, A., Hering, D., Eds.; Pensoft Publishers: Sofia, Bulgaria, 2008. [Google Scholar]
  59. Gullefors, B. Nattsländan Rhyacophila nubilas äggläggning (Trichoptera). [The egglaying of the caddisfly Rhyacophila nubila (Trichoptera)]. Entomol. Tidskr. 2014, 135, 147–151. [Google Scholar]
  60. Lenat, J.K.; Crawford, D.R. Effects of Land Use on The Water Quality and Aquatic Biota of Three Streams in The Piedmont Province of North Carolina Streams. Water-Resources Investigations Report 89-4007; U.S. Geological Survey: Reston, VA, USA, 1989.
  61. Stone, M.L.; Whiles, M.R.; Webber, J.A.; Williard, K.W.; Reeve, J.D. Macroinvertebrate communities in agriculturally impacted southern Illinois streams: Patterns with riparian vegetation, water quality, and in-stream habitat quality. J. Environ. Qual. 2005, 34, 907–917. [Google Scholar] [CrossRef]
  62. Battin, J.; Wiley, M.W.; Ruckelshaus, M.H.; Palmer, R.N.; Korb, E.; Bartz, K.K.; Imaki, H. Projected impacts of climate change on salmon habitat restoration. Proc. Natl. Acad. Sci. USA 2007, 104, 6720–6725. [Google Scholar] [CrossRef] [Green Version]
  63. Broadmeadow, S.B.; Jones, J.G.; Langford, T.E.L.; Shaw, P.J.; Nisbet, T.R. The influence of riparian shade on lowland stream water temperatures in southern England and their viability for brown trout. River Res. Appl. 2011, 27, 226–237. [Google Scholar] [CrossRef]
  64. Kristensen, P.B.; Kristensen, E.A.; Riis, T.; Baisner, A.J.; Larsen, S.E.; Verdonschot, P.F.M.; Baattrup-Pedersen, A. Riparian forest as a management tool for moderating future thermal conditions of lowland temperate streams. Hydrol. Earth Syst. Sci. Discuss. 2013, 2013, 6081–6106. [Google Scholar]
  65. Delong, M.D.; Brusven, M.A. Macroinvertebrate community structure along the longitudinal gradient of an agriculturally impacted stream. Environ. Manag. 1998, 22, 445–457. [Google Scholar] [CrossRef]
  66. Poff, N.L. Landscape filters and species traits: Towards mechanistic understanding and prediction in stream ecology. J. N. Am. Benthol. Soc. 1997, 16, 391–409. [Google Scholar] [CrossRef]
  67. Heino, J. The importance of metacommunity ecology for environmental assessment research in the freshwater realm. Biol. Rev. 2013, 88, 166–178. [Google Scholar] [CrossRef]
  68. Burdon, F.J.; Reyes, M.; Alder, A.C.; Joss, A.; Ort, C.; Räsänen, K.; Jokela, J.; Eggen, R.I.L.; Stamm, C. Environmental context and magnitude of disturbance influence trait-mediated community responses to wastewater in streams. Ecol. Evol. 2016, 6, 3923–3939. [Google Scholar] [CrossRef] [PubMed] [Green Version]
  69. Anderson, M.J.; Crist, T.O.; Chase, J.M.; Vellend, M.; Inouye, B.D.; Freestone, A.L.; Sanders, N.J.; Cornell, H.V.; Comita, L.S.; Davies, K.F.; et al. Navigating the multiple meanings of β diversity: A roadmap for the practicing ecologist. Ecol. Lett. 2011, 14, 19–28. [Google Scholar] [CrossRef] [PubMed]
  70. Woodward, G. Biodiversity, ecosystem functioning and food webs in fresh waters: Assembling the jigsaw puzzle. Freshw. Biol. 2009, 54, 2171–2187. [Google Scholar] [CrossRef]
  71. Brown, J.H.; Gillooly, J.F.; Allen, A.P.; Savage, V.M.; West, G.B. Toward a metabolic theory of ecology. Ecology 2004, 85, 1771–1789. [Google Scholar] [CrossRef]
  72. Raitif, J.; Plantegenest, M.; Agator, O.; Piscart, C.; Roussel, J.-M. Seasonal and spatial variations of stream insect emergence in an intensive agricultural landscape. Sci. Total. Environ. 2018, 644, 594–601. [Google Scholar] [CrossRef]
  73. Burdon, F.J.; Harding, J.S. The linkage between riparian predators and aquatic insects across a stream-resource spectrum. Freshw. Biol. 2008, 53, 330–346. [Google Scholar] [CrossRef]
  74. Carlson, P.E.; McKie, B.G.; Sandin, L.; Johnson, R.K. Strong land-use effects on the dispersal patterns of adult stream insects: Implications for transfers of aquatic subsidies to terrestrial consumers. Freshw. Biol. 2016, 61, 848–861. [Google Scholar] [CrossRef]
  75. Mutinova, P.T.; Kahlert, M.; Kupilas, B.; McKie, B.G.; Friberg, N.; Burdon, F.J. Benthic Diatom Communities in Urban Streams and the Role of Riparian Buffers. Water 2020, 12, 2799. [Google Scholar] [CrossRef]
  76. Popescu, C.; Oprina-Pavelescu, M.; Dinu, V.; Cazacu, C.; Burdon, F.J.; Forio, M.A.E.; Kupilas, B.; Friberg, N.; Goethals, P.; McKie, B.G.; et al. Riparian vegetation structure influences terrestrial invertebrate communities in an agricultural landscape. Water 2021, 13, 188. [Google Scholar] [CrossRef]
  77. Ramberg, E.; Burdon, F.J.; Sargac, J.; Kupilas, B.; Rîşnoveanu, G.; Lau, D.C.P.; Johnson, R.K.; McKie, B.G. The structure of riparian vegetation in agricultural landscapes influences spider communities and aquatic-terrestrial Linkages. Water 2020, 12, 2855. [Google Scholar] [CrossRef]
Figure 1. Position and schematic representation of streams and their paired reaches (orange dots—upstream unbuffered reaches; green dots—downstream forested buffered reaches).
Water 13 01028 g001
Figure 2. Principal Components Analysis (PCA) of the unbuffered and buffered reaches using selected environmental variables for: (a) riparian; and (b) instream habitats. Orange dots represent unbuffered and green dots represent buffered reaches. Abbreviations: riparian (a): Bare_gro = Bare ground (%), Man-grs= managed grass (%), Moss_lich = moss/lichens (%), Pla_litt = plant litter (%), Rock_bed = rocks/bedrock (%), Tree_shr = trees/shrubs (%), Unm_grs = unmanaged grass (%). Abbreviations: instream (b): CPOM = coarse particulate organic matter, FPOM = fine particulate organic matter, TOC = total dissolved carbon, Cond = conductivity, TP = total phosphorus, TN = total nitrogen, Alg = algae (%), Bed_Bou = Bedrock, boulders (%), Bry = bryophytes (%), Gra = gravel (%), Mac = macrophytes (%), Sed = fine sediment (%).
Water 13 01028 g002
Figure 3. Results of pRDA for taxonomic (a) and trait (b) composition. Riparian attributes used in the pRDA are shown in black (% canopy, % rock/bedrock) and two riparian variables that are significantly different between the study reaches (% managed grass and % trees, based on t-tests) were shown in grey. The species and traits with the highest scores along the first two pRDA axes are shown in dark brown color (associated to unbuffered reaches with orange ellipse and orange dots) and blue color (associated to buffered reaches with green ellipse and green dots) color. RDA2 (b) is equivalent to PC1 axis, due to a one variable model (% Canopy). Taxa abbreviations: Baet = Baetis sp., Baet_ro = Baetis rhodani, Chir = Chironomidae, Gam = Gammarus pulex, Hyd = Hydropsyche siltalai, Lim = Limnius volckmari, Pis = Pisidium. Trait abbreviations: breathing: gills, tegum = tegument, dispersal: aer.act = aerial active; feeding: shredders, fil.feed = filter feeders; number of cycles per year: <1 cycle, 1 cycle; size: 0.25–0.5 cm, 0.5–1 cm, 1–2 cm.
Water 13 01028 g003
Table 1. List of environmental (explanatory) variables used to assess the difference in the structure of the macroinvertebrate communities between buffered and unbuffered reaches.
1. SPATIAL3. RIPARIAN4. INSTREAM
LatitudeRiparian buffer size (m2)Bankfull width (m)Algae (%)
LongitudeLength (m)Bankfull depth (cm)Bedrock, boulders (%)
Principal Coordinates of Neighbourhood Matrix ((PCNM)Width (m)Channel width (m)Bryophytes (%)
2. CATCHMENTTree density (trees/m2)Channel depth (cm)Coarse particulate organic matter (CPOM %)
ElevationUnmanaged grass (%)Flow (m/s)Large woody debris (%)
Catchment area (m2)Herbs (%)Temperature (°C)Fine particulate organic matter (FPOM %)
Forest: broad-leafed, coniferous and mixed (%)Moss/lichens (%)Instream shading (%)Gravel (%)
Arable land and crops (%)Trees/shrubs (%)pHMacrophytes (%)
Pasture (%)Rocks/bedrock (%)Conductivity (mS/m2)Fine sediment (%)
Natural areas (%)Plant litter (%)Total organic carbon (mg/l)
Urban and industrial (%)Bare ground (%)NH4 (µg/l)
Water (%)Managed grass (%)NO3–N (µg/l)
Wetlands (%) Total N (µg/l)
Other (%) Total P (µg/l)
Table 2. Results of RDA analysis (forward selection) showing environmental variables from each tested model with significant conditional effects on taxonomic (n = 94) and trait (n = 39) composition.
Environmental
Variables
Taxa Traits
Adj R2 FpAdj R2 Fp
Spatial
PCNM10.111.750.044
PCNM90.031.650.0890.132.420.062
PCNM10 0.062.240.066
Catchment
Catchment area (m2)0.081.610.0810.192.030.089
Riparian
Canopy (%)0.031.550.0940.082.650.034
Rock/bedrock (%)0.071.860.041
Instream
Nitrate0.092.960.0020.243.390.018
TP 0.302.290.054
Algae (%)0.162.490.0040.133.90.009
Gravel (%)0.041.720.0470.154.350.004
Publisher’s Note: MDPI stays neutral with regard to jurisdictional claims in published maps and institutional affiliations.

