Article

An Integrated Bottom-Up Approach for Leak Detection in Water Distribution Networks Based on Assessing Parameters of Water Balance Model

State Key Laboratory of Industrial Control Technology, College of Control Science and Engineering, Zhejiang University, Hangzhou 310027, China
*
Author to whom correspondence should be addressed.
Water 2021, 13(6), 867; https://doi.org/10.3390/w13060867
Submission received: 23 February 2021 / Revised: 15 March 2021 / Accepted: 17 March 2021 / Published: 23 March 2021
(This article belongs to the Special Issue Urban Water Networks Modelling and Monitoring)

Abstract

:
Loss of water due to leakage is a common phenomenon observed practically in all water distribution networks (WDNs). However, the leakage volume can be reduced significantly if the occurrence of leakage is detected within minimal time after its occurrence. Based on the discriminative behavior of different consumption in water balance, an integrated bottom-up water balance model is presented for leak detection in WDNs. The adaptive moment estimation (Adam) algorithm is employed to assess the parameters in the model. By analyzing the current value and the rising rate of the assessed parameters, abnormal events (e.g., leak, illegal use, or metering inaccuracy) could be detected. Furthermore, a one-step-slower strategy is proposed to estimate the weighted coefficient of pressure sensors to provide approximate location information of leak. The method was applied in a benchmark WDN and an experimental WDN to evaluate its performance. The results showed that relatively small leak could be detected in near-real-time. In addition, the method was able to identify the pressure sensors near to the leak.

Graphical Abstract

1. Introduction

As one of the most precious natural resources, freshwater has drawn great attention worldwide. However, a large amount of water is lost during water distribution process, which can be largely attributed to bursts and leaks. What is more, bursts and leaks can pose risks of bacteria and pollutant contamination [1]. Large bursts, which are associated with significant pressure drop or other visible consequence, are relatively easier to detect. On the contrary, smaller bursts and leaks are more difficult to detect as the flow or pressure changes produced by leaks are not appreciable [2]. Therefore, reliable leakage detection method, especially the detection of small leaks, is extremely urgent for water safety and sustainable development of urban cities.
So far, the leakage detection methods in water distribution system can be broadly classified into top-down approaches and bottom-up approaches [3]. The top-down approaches offer a crude system-wide estimation of different components in water balance model, generally according to monthly or annual water metering data [4,5]. Berg applied a panel data analysis with fixed effects to assess the major drivers of non-revenue water [6]. Kanakoudis et al. stated that the water balance for Kos town network was assessed on a bimonthly basis, following the water billing period used by the local water utility [7]. Lenzi et al. proposed a method to represent and calculate the Infrastructure Leakage Index for large water systems [8]. For bottom-up approaches, they directly evaluate the amount of water losses based on the most up-to-date high-resolution monitored data [9,10]. Alvisi et al. found that a good estimate of water balance may be obtained through real-time monitoring of only part of the users within a DMA [11]. Xin et al. presented an effective method to calculate the three primary parts of Non-Revenue Water [12]. Mutikanga et al. presented a method to assess different components in apparent losses based on field audit and operational data for Kampala city’s water distribution system in Uganda [13]. Among those methods, leakage detection based on the minimum night flow (MNF) analysis is a typical bottom-up approach for the assessment of real losses consumption and has been widely used in the water distribution industry. The estimation is carried out by subtracting the expected legitimate water consumption from the total MNF, and the leakage is detected based on this. Marzola et al. evaluated the amount of water loss based on the MNF and the water balance [14]. However, this approach could ignore some small leakage due to the inaccuracy of estimation in legitimate water consumption caused by water demand fluctuation over days. Moreover, the approaches mentioned above have some limitations in real-time leakage detection.
To realize real-time leakage detection, various model-based and data-driven methods have been developed based on the hydraulic information (e.g., pressure and flow) gathered by supervisory control and data acquisition (SCADA) system. The core of model-based methods is a well-calibrated hydraulic model of the water distribution networks [15,16]. Moreover, with a well-calibrated model, the residual between measurements and the corresponding estimations of model can be used to detect leaks. Sanz et al. proposed a leakage detection and localization method, which is coupled with a calibration model that identifies geographically distributed parameters [17]. Xie et al. proposed a novel method for hydraulically monitoring and can identify the leakage regions that happened in near-real-time [18]. However, model-based methods are limited when dealing with complex or large-scale water distribution networks (WDNs) as constructing and maintaining well-calibrated hydraulic models are challenging for water companies.
Data-driven approaches have thus become appealing alternatives in practice. Data-driven approaches focus on mining the burst-induced features from vast historical data, and then the leakage detection problem can be turned into a classification or clustering problem [19,20]. Laucelli et al. investigated the effectiveness of the evolutionary polynomial regression paradigm to reproduce the behavior of a WDN using online data recorded by low-cost pressure/flow devices [21]. Palau et al. applied principle component analysis (PCA) to the control of water inflows into DMAs of urban networks [22]. Ye et al. developed a novel burst detection method by using adaptive Kalman filter on hydraulic measurements of flow and pressure at the district meter area level [23]. Various algorithms have been employed to recognize the features containing leakage information from the data. Huang et al. proposed a method to detect bursts in DMAs that can be divided into three steps [24]. Soldevila et al. presented a method for leak localization in WDNs based on Bayesian classifiers [25]. Wu et al. transformed the problem of burst detection into an outlier detection task with the use of data correlation between multiple pressure sensors [26]. However, the approaches mentioned above require a large size of training samples to get accurate burst detection models, and misjudgments may be made when dealing with inexperienced events or small bursts and leaks due to their strongly data dependency.
Generally, quantifying the amount of water losses in water distribution networks or district metering areas can serve as a starting point in the procedure of the leakage detection [27]. By analyzing the water losses, some scholars have realized events detection in the WDNs based on the water balance model indirectly. Tabesh et al. [28] and Farah et al. [29] applied the water balance model as a tool to estimate the severity of leakage within a zone. They used relevant historical data to directly calculate the possible leakage in the WDNs. However, most of the methods based on it are implemented through long-term data and can detect whether there are leakage events over a long period of time. This means the leakage cannot be detected in time. Few researches have directly applied the water balance model to abnormal event detection in the WDNs until now.
This paper proposed a leak detection method based on assessing the real losses consumption. On the basis of water balance, an integrated bottom-up water balance model was presented based on the discriminative behavior of apparent and real losses. The fixed and variable area discharge (FAVAD) theory [30] was employed to model the real losses consumption through pressure data gather from WDNs. Based on the hydraulic information (e.g., pressure, inlet flow, and water usage) gathered by SCADA system, the water losses consumption of water balance model could be estimated. By analyzing the current volume and the rising rate of both apparent and real losses, abnormal events could be detected in near-real-time and different coping strategies could be further employed to enhance the efficiency. Furthermore, the approximate location information of the leak could be provided by comparing the weighted coefficient of pressure sensors. The proposed integrated bottom-up approach was illustrated through a benchmark model and a real pipeline network.

2. Methodology

An integrated bottom-up approach for leakage detection and location was proposed in this paper, based on quantifying the amount of apparent and real losses in WDNs. First, according to the principle of water balance, the movement of water is continuous and maintains a balance between revenue and expenditure in terms of quantity [31]. The water balance model was constructed based on the discriminative behavior of apparent and real losses. Then, based on the hydraulic information (e.g., pressure, inlet flow, and water usage) collected by SCADA system, the Adam algorithm was employed to perform least square estimation to obtain the model parameters. After establishing a leakage identification model according to the parameters estimation, a leak could be detected and different coping strategies could be further employed to enhance the efficiency. Once a leak was detected, the weighted average coefficients of pressure sensors were further estimated. According to the coefficients, the pressure sensors which are the nearest to the leak can be identified, and the leakage location can be found approximately. The design of the scheme is shown in Figure 1, and the details of the method are described in the following sections. Based on the method proposed in this paper, the loss of water can be monitored, resulting from small burst or leakages, and will accumulate over time, to detect the abnormal events rather than monitoring the pressure or flow changes induced by small bursts and leaks, which are submerged in the changes induced by normal demand fluctuations.

2.1. Construction of Water Balance Model

On the basis of water balance, the water losses, defined by the deduction of authorized consumption from the system input volume, can be further divided into apparent losses and real losses [32].

2.1.1. Authorized Consumptions

As described in Table 1, the authorized consumption, denoted as Q a u , is comprised of authorized metered consumption and authorized unmetered consumption. The authorized metered flow rate Q m is measured by all customers’ meters. The authorized unmetered flow rate Q u is the combination of fixed quota user, fire hydrants, system flushing, and so on. For a fixed WDN or a district metering area, the authorized unmetered flow rate can be assumed as an unknown constant during the estimation.
Q a u = Q m + Q u

2.1.2. Apparent Losses

The apparent losses, denoted as Q a l , usually account for 30–40% of the total water losses [4]. The apparent losses refer to the water consumption due to metering inaccuracy and the volume of illegal use. As the components of apparent losses fluctuate similarly with the fluctuation of customers’ water demand, here it is assumed that the apparent losses flow rate is proportion to the authorized metered flow rate Q m [33].
Q a l = k × Q m
where k is the apparent losses coefficient.
When having access to the error characteristics of meters in the WDN, a more accurate estimation of the apparent losses could be achieved.

2.1.3. Real Losses

Real losses, denoted as Q r l , refer to the amount of physical leakage in mains and service connections. Displaying fixed and variable area discharge (FAVAD) theory, the real losses can be modeled through pressure data collected from WDNs [34]. According to the FAVAD theory, the leakage area of a leak can be divided into a fixed area and a variable area. The fixed area is the damaged area of the pipeline under the zero-pressure state. Moreover, the fixed area will expand as the pressure inside the pipeline increases, resulting in a variable area, as shown in Figure 2.
The leakage area, denoted as A, can be regarded as area of an orifice. According to the hydraulic orifice flow equation, the flow rate of leakage can be calculated as
Q = C d × A × 2 × g × H
where C d is the discharge coefficient, g is the local gravity acceleration, and H is the water head (pressure) at the leakage point. The discharge coefficient C d varies between 0.5 and 0.8 in different water distribution systems, with a typical value 0.65 [35].
According to the FAVAD theory, Cassa et al. [36] analyzed the relationship between the leakage area and pressure of pine, with pipes of different materials such as uPVC, cast iron, and steel. The results showed that the leakage area of a specific leak would vary linearly with the pressure of the pipe. That is, the response of the leakage area A to the pressure can be characterized as
A = A 0 + m × H
where m is the head-area slope.
Cassa and Van Zyl [37] employed finite element analysis to analyze the head-area slope m of various leaks. The experimental results indicated that the head-area slope m increased as the initial leakage area A 0 increased. However, the leakage area is a function of the pipe material and many other complex factors, thus an explicit function cannot be obtained. Based on Equation (4), Cassa and Van Zyl decided to fit the head-area slope m using a single power Equation, resulting in a general head-area slope m:
m = 2 × 10 6 × A 0 2.91
With Equations (3)–(5), the real losses can be modeled as pressure-driven water demand:
Q r l = C d × 2 g ( A 0 h 0 0.5 + m h 0 1.5 )

2.1.4. Water Balance Model

On the basis of water balance and Equations (1), (2), and (6), the water balance model of the WDN can be derived:
Q = ( 1 + k ) Q m + C d 2 g ( A 0 h 0 0.5 + m h 0 1.5 ) + Q u
Note that there is an assumption in the model that there is only a leak in the WDN. The water head h 0 used in the model is average zone pressure (AZP), as the leakage could occur in any location in the network. What is more, AZP can simplify the model so that the data needed can be reduced when estimating the parameters in the model. There are three unknown parameters in the model: the apparent losses coefficient k, the leakage area A 0 , and the authorized unmeasured flow rate Q u . The apparent losses coefficient k indicates the apparent losses of the network. The current volume of apparent losses indicates the metering inaccuracy or existence of illegal water use, while the rising rate of k indicates the abnormal event of meters or new illegal water use. Similarly, the leakage area A 0 indicates the real losses in the system, and it will rise when a leak occurs. Thus, the leak could be detected and the abnormal degree can be provided based on the value of A 0 .

2.2. Approximate Location Information of Leak

In the water balance model described by Equation (7), average zone pressure h 0 is used to simplify the model. However, the location information of pressure sensors is lost if multi-sensors are situated in the network. Therefore, the water balance model, described by Equation (7), cannot provide the information of leakage location. To take the location information of pressure sensors into account, the water head in the water balance model can be replaced by a weighted average of multiple pressure sensors:
h = c 1 h 1 + c 2 h 2 + + c n h n s . t . i = 1 n c i = 1
where h i represents the ith pressure sensor and n is the number of pressure sensors in the WDN or DMA.
Unfortunately, the water balance model is an exponential function of water head h, and the exponents of h are 0.5 and 1.5. Once Equation (8) is substituted directly into Equation (7), the complexity of the water balance model will be increased so greatly that it is impossible to solve the problem in an acceptable time (not only the time used to estimate the parameters, but also the time needed to collect enough hydraulic data). Here, the water head used in the model is decomposed into two parts— h 0 with the exponent of 0.5 and h with the exponent of 1:
Q = ( 1 + k ) Q m + C d 2 g ( A 0 h 0 0.5 + m h 0 0.5 h ) + Q u h = c 1 h 1 + c 2 h 2 + + c n h n , i = 1 n c i = 1
where h is the weighted average water head described by Equation (8), and h 0 is a scalar.
The initial value of h 0 could be set as the average zone pressure, and should be updated after updating the weighted coefficients c i each time. That is to say, the update of h 0 is one step slower during the iterative process. By applying this one-step-slower strategy, it is much easier to estimate the weighted coefficients c i since the model is a “linear” function of c i . By analyzing the coefficients, the pressure sensors nearest to the leak can be identified, thus provide some approximate location information of leak.

2.3. Parameters Assessment

The parameters of the model can be estimated according to the data collected by the SCADA system. At present, there are many numerical calculation methods that can be used to solve this problem. The cost function is
J ( θ ) = 1 2 T t = 1 T ( Q t ˜ Q t ) 2
where Q t is the metered system input flow rate at moment t, Q t ˜ is the system input flow rate estimated by the water balance model, θ = [ k , A 0 , Q u , c i ] represents the parameters of the model, and t = 1 , 2 , , T .
As the model is an exponential function of leakage area A 0 , the least square solution of model parameters cannot be directly derived. In this research, the gradient descent method was employed to obtain the optimal solution of the model parameters.
According to the model described by Equation (7), the partial derivative of the cost function J ( θ ) can be derived:
J ( θ ) A 0 = 1 T t = 1 T ( Q t ˜ Q t ) [ C d 2 g ( h 0 0.5 + m ( A 0 ) A 0 h 0 0.5 ) ] J ( θ ) k = 1 T t = 1 T ( Q t ˜ Q t ) Q m
As the magnitude difference between the coefficients of k and A 0 is very large, the convergence rate of the traditional gradient descent method is too slow or even divergent. An improved stochastic gradient descent method, adaptive moment estimation (Adam), is employed to solve the problem. The Adam method was proposed by Kingma [38]. The traditional stochastic gradient descent method uses a single learning rate to update all parameters, and the learning rate does not change during the optimization process. Unlike the traditional stochastic gradient descent method, the Adam method sets independent and adaptive learning rates for different parameters by calculating first-order moment estimations and second-order moment estimations for gradients.
By assessing the parameters in Equation (7), we get a glimpse of the state of WDN. Then, analyzing the current value and the rising rate of the assessed parameters (e.g., a threshold), abnormal events will be detected.

3. Case Study

In this section, the method proposed in this paper was applied in a benchmark WDN model and an experimental WDN to evaluate its performance.

3.1. Case 1

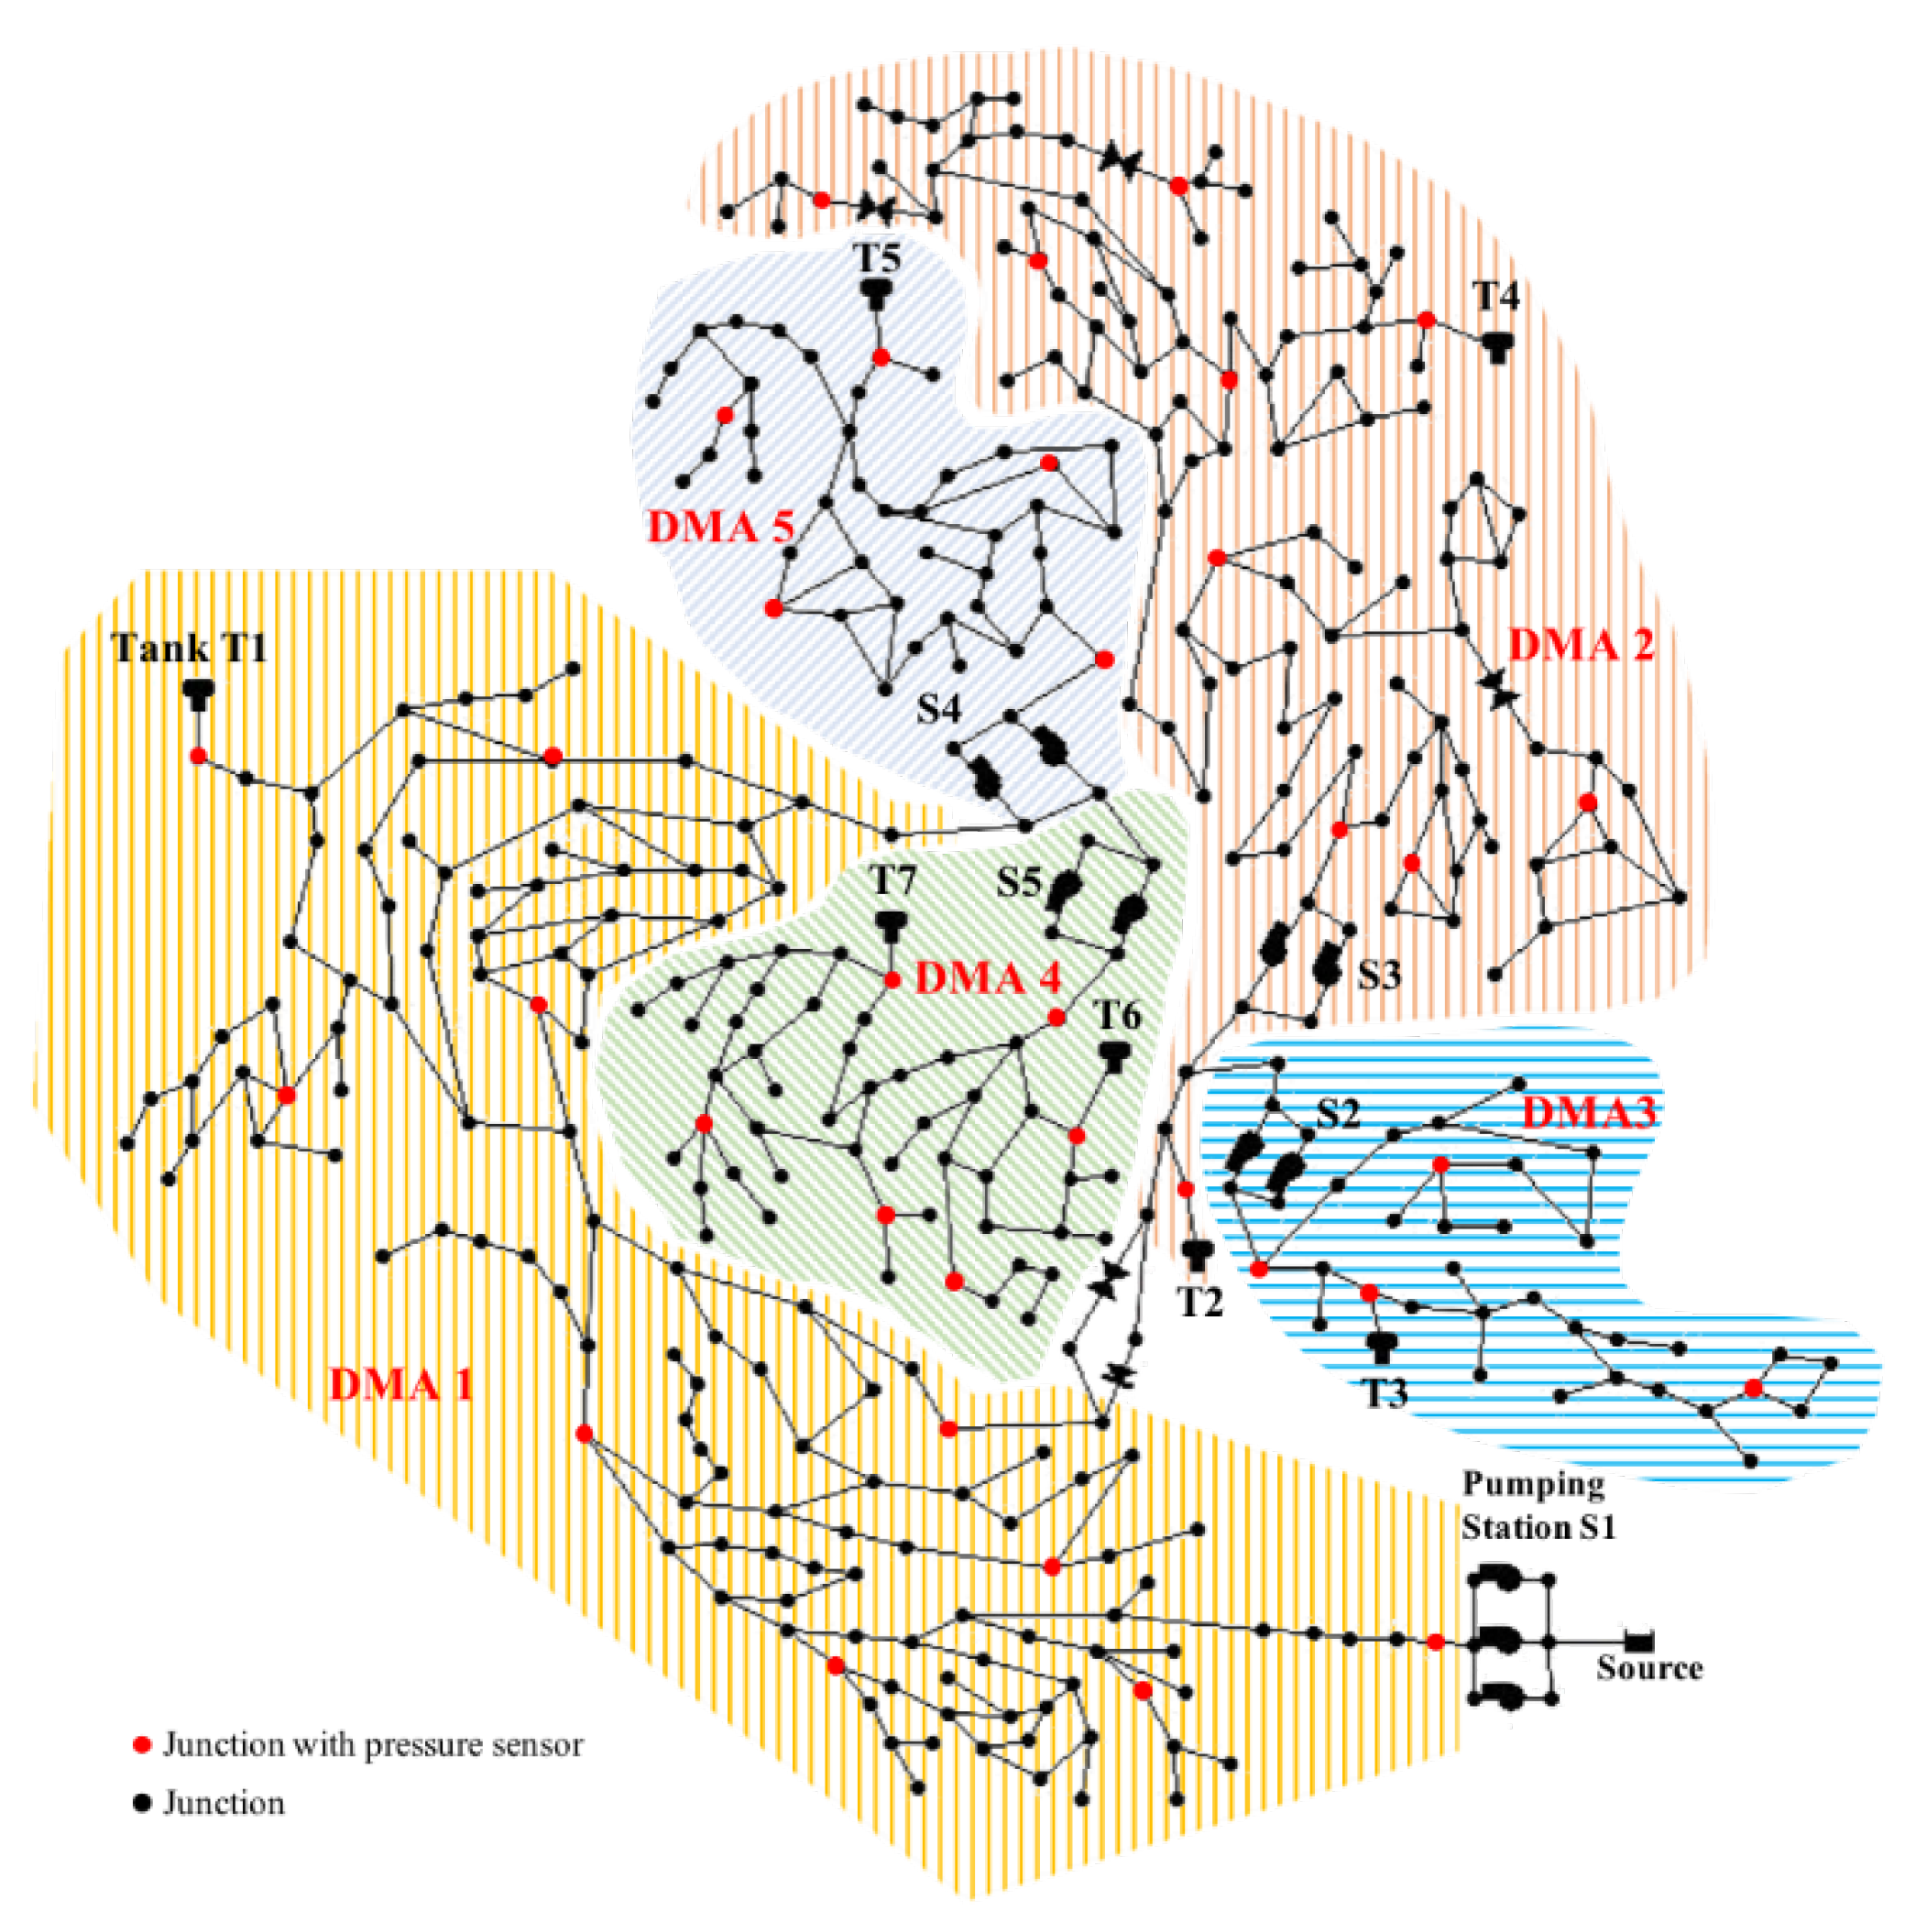
This section concerns the implementation of the proposed method to a widely used benchmark model, named C-Town (EPANET2). This benchmark model is made up of 5 district metering areas (DMA1-DMA5), one source, 5 pump stations (S1–S5), 7 tanks (T1–T7), 388 nodes, 429 pipes, and 35 pressure sensors, as shown in Figure 3.
Note that in order to improve the efficiency of the WDN, the scheduling scheme of the pump stations was optimized during the operation of the C-Town pipe network. Moreover, the water consumption of users was assumed to be obtained by the meters. The introduction of the scheduling scheme has made the pipe network system a very complex nonlinear, non-Gaussian system. During the start/stop process of the pumping stations, the pressure in the network will change drastically, which makes common pressure-based leak detection methods difficult to apply in the pipe network.

3.1.1. Leak Detection Bases on Proposed Method

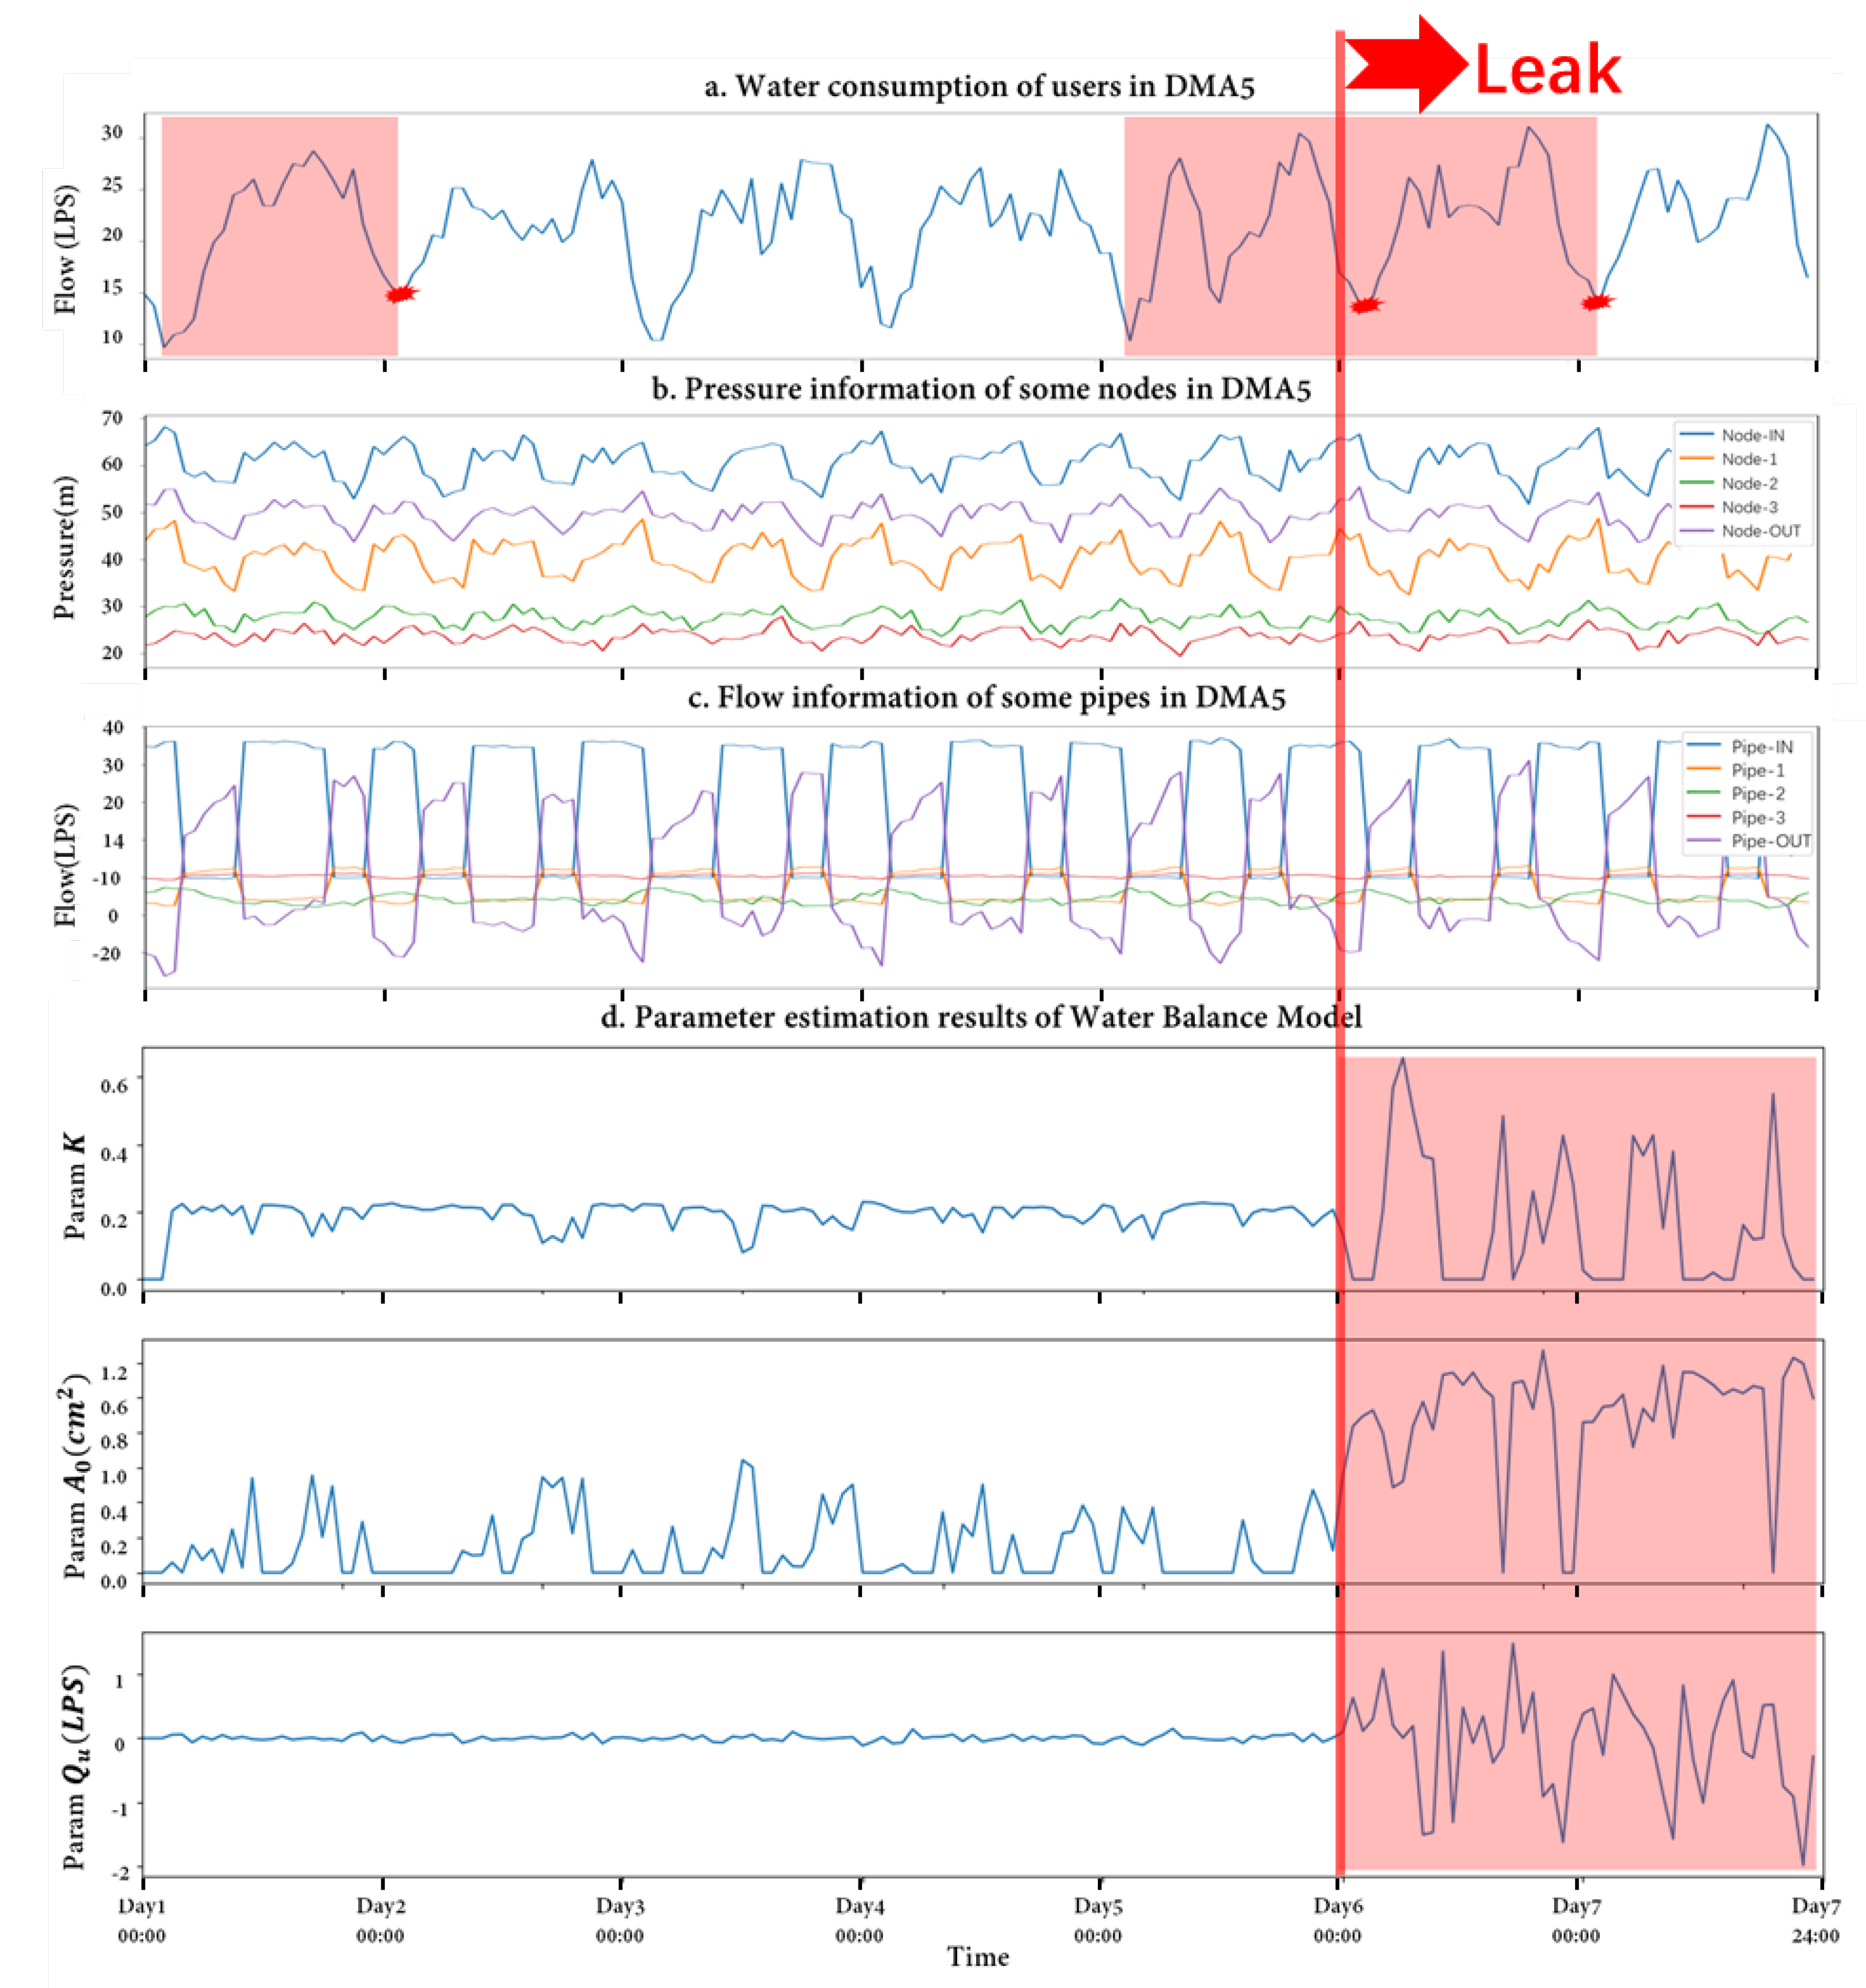
Hourly monitored data over 168 h (i.e., a week), including inlet flow rate of each DMA, demand flow rate of each node, and pressure at each pressure sensors, are provided by SCADA system of C-Town. Some random noise, between ±2% of the measured value, was added to simulate the real measurement value by flow meters having accuracy with class 2. After 5 days of normal operation of the network, a node in DMA 5 was randomly selected to simulate a leak event. The leak event was simulated by adding an emitter to the node and the coefficient of the emitter was set to be 0.25, resulting in real losses accounting for about 7% of the total daily input volume of DMA5. As shown in Figure 4, some results are displayed, including pipe flow of inlet and outlet, node pressure of inlet and outlet, water demand of the whole DMA5, and three parameters calculated based on the water balance model in this paper.
According to the water consumption of users in DMA5, the minimum night flow (MNF) had a significant increase after the leakage event occurred, which can also be seen from the Figure 4a, the specially marked points in the figure represent the minimum night flow points with abnormalities detected. It can be seen that through the threshold calculated by the triple standard deviation criterion, the abnormal points can be discovered. However, there are certain false positives even when there are no abnormal events (e.g., the second night, around the 26th h). This is because the minimum flow value at night still exceeded the set threshold when there are some fluctuations in the water usage patterns. In addition, there exists a certain amount of underreporting, as the judgment can only be made when there is a leakage loss the day before by the minimum flow at night. It can be seen that the abnormal event of the last period was not detected leading to limitation in real-time detection.
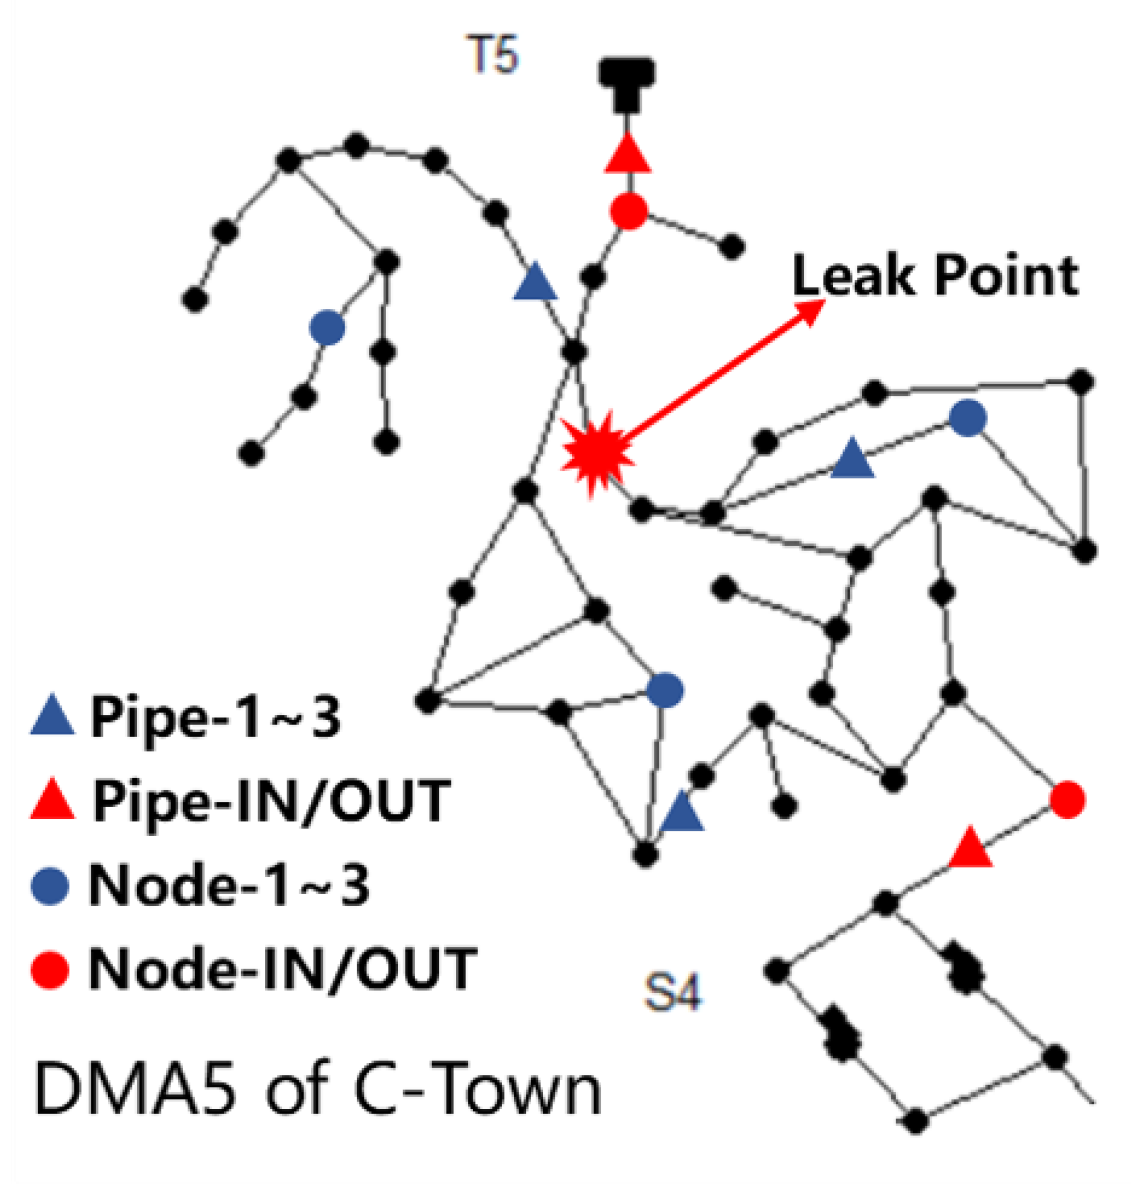
Figure 4b,c demonstrated the changes in the flow and pressure of the inlet, outlet, and some nodes in DMA 5. The inlet and outlet are labeled as Pipe-In and Pipe-Out with red triangles in Figure 5. Other representations with different labels are also explained in Figure 5. Note that the point marked with a explosive pattern is the leakage point set in case1. However, the change is not obvious enough to correctly detect the abnormal events. In addition, due to the existence of the scheduling scheme of pump stations, the pressure in the DMA had obvious fluctuations during the start/stop process of the pumping station, which brought difficulties to the pressure-based leak detection methods.
The data described above were analyzed by the proposed method. The parameters of the water balance model described by Equation (7) were estimated every hour, using the 4 most up-to-date data points. The parameter assessment results, including the apparent losses coefficient k, the leakage area A 0 , and the authorized unmeasured flow rate Q u , are shown in Figure 4d. In the first 5 days, the estimated apparent losses coefficient k and the authorized unmeasured flow rate Q u remained at a steady level, and the parameter A 0 has some peaks caused by the noise added in the beginning. When the leak occurred on the sixth day, three parameters all have huge fluctuations. It is indicated the leakage detection cannot only be judged by the single parameter, like A 0 . Therefore, in this paper, the three parameters were combined into one feature vector to get a better performance. Figure 4d showed that the leakages were detected correctly in time.
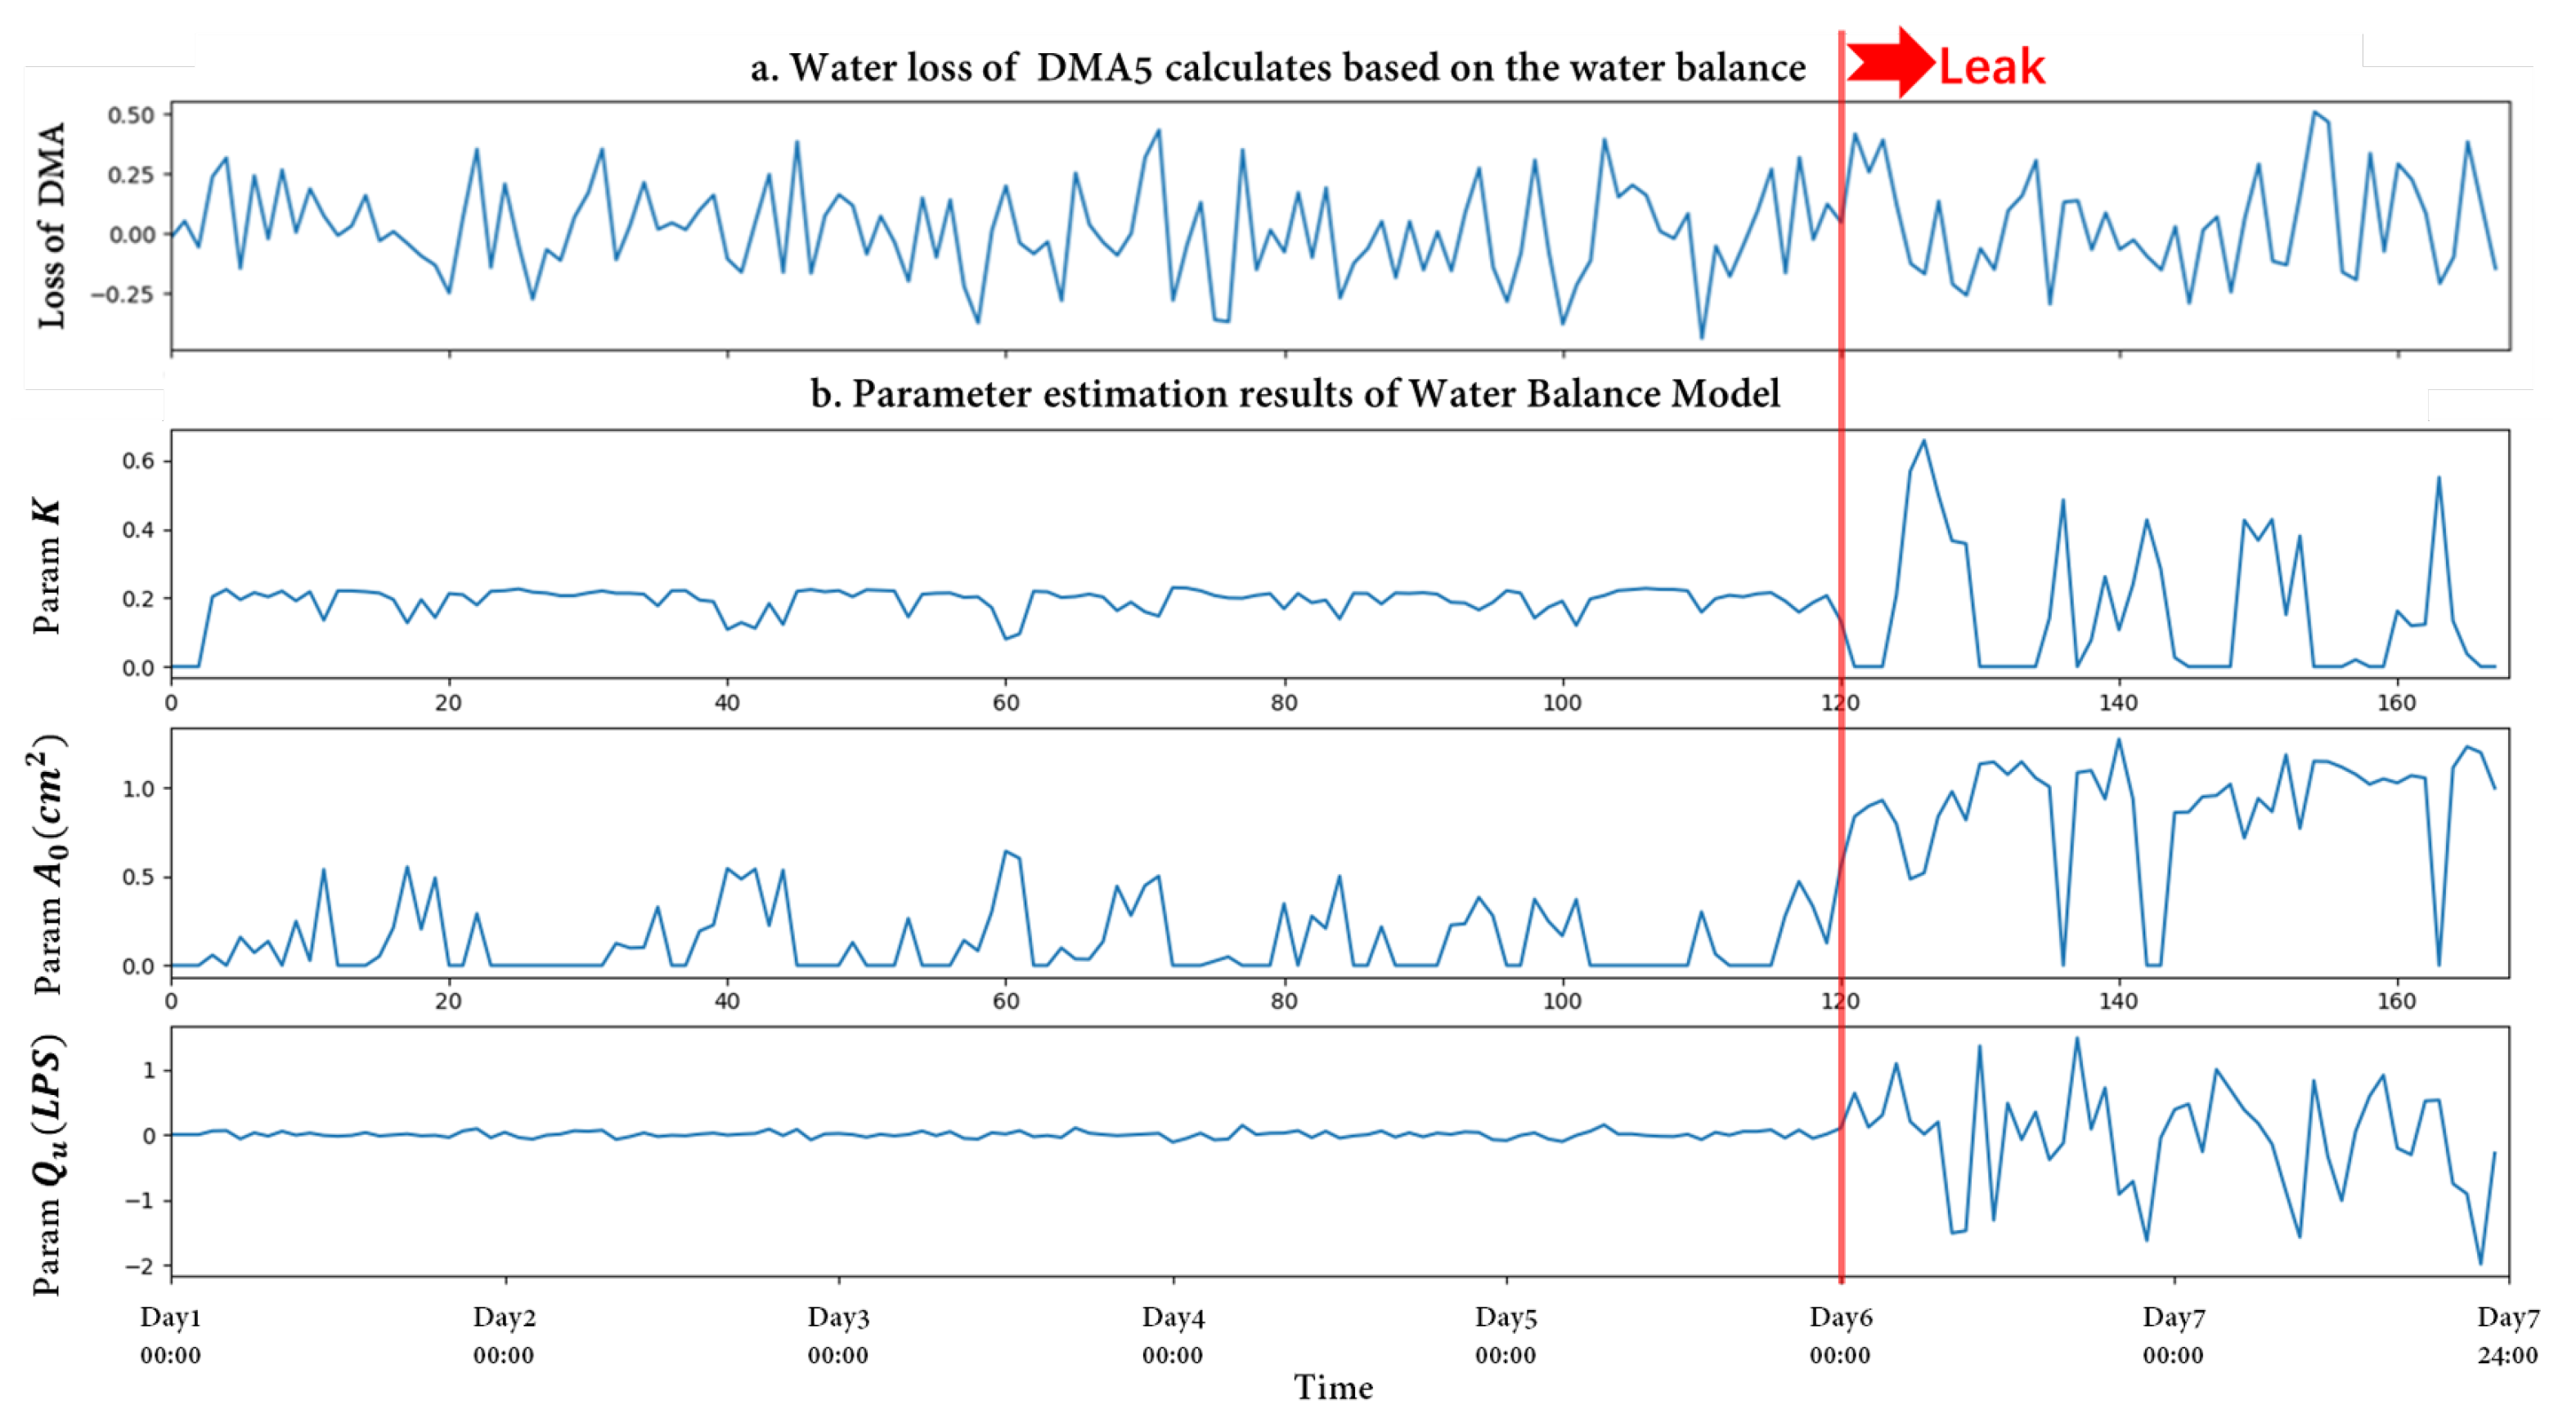
The performance of the proposed method was also compared with the traditional water balance method, which subtracts the users’ water consumption from the total water supply in the district. Figure 6a depicts the water loss in DMA5 calculated based on the traditional water balance method. The remaining parts are the parameters calculated based on the proposed method. It can be seen that leakages can be detected more effective based on the method proposed in this paper, comparing with the traditional water balance method.

3.1.2. Leak Detection Performance Validation

This section concerns the implementation of the proposed method as an online leak detection method, and its performance was compared with the method based on PCA. The five DMAs in C-Town are of different sizes and the fluctuation of water demand in each DMA is different. In each DMA, a node was randomly selected each time to simulate a leak by adding an emitter. The emitter coefficient C E M was set between 0.2 and 0.6, resulting in real losses accounting for about 5.6% to 16.8% of the total daily input volume of the DMA. DMA5 was set as the test area, 100 nodes were randomly selected to repeat the simulation and the duration of each simulation is 168 h, generating 100 abnormal data and a set of normal data.
To compare the performance of two methods, a data set was synthesized later based on the data obtained through EPANET simulation. The data set has a total of 700 pieces of data, including 100 pieces of data that contain abnormal events and 600 pieces of data that do not contain abnormal events.
Using the method proposed in this article, after calculation, three parameters corresponding to each data set, the apparent losses coefficient k, the leakage area A 0 , and the authorized unmeasured flow rate Q u , were obtained. Finally, we can get a 700 × 3 feature matrix can be established by combining these three parameters.
For the method based on PCA, the original data set is 700 × 10. Moreover, the each piece of data input to PCA is
[ Q 0 , , Q 4 , H 0 , , H 4 ]
where Q n denotes flow rate of a pipe and H n denotes the pressure of a node. The data set contains five flow data and five pressure data, including the inlet pipe, outlet pipe, inlet node, outlet nodes, and some pipes or nodes that distribute in the DMA evenly. PCA is the most commonly used method of data dimensionality reduction in machine learning. It can select the feature subset with the best evaluation criteria from the original feature set. Based on PCA, the dimension of the feature was reduced from 10 to 3, consistent with the method mentioned above. Figure 7 indicated that there are some changes in the feature vector when abnormal events were added since the 6th day.
After obtaining the feature vectors of the two methods, SVM was applied to classify and discriminate abnormal events. SVM is a binary classification model. Its basic idea is to solve the separation hyperplane that can correctly divide the training data set and have the largest geometric interval. The recall rate indicator was employed to measure the detection effect of detection methods. Recall rate is calculated as follows:
R e c a l l R a t e = T P T P + F N
where T P represents the number of abnormal events detected correctly, and F N is the number of abnormal events that are not detected.
The proposed method and the method based on PCA were applied to detect the leaks in DMA5. The threshold of leak area A 0 in the proposed method was 15 mm 2 as case 1, while the threshold of minimum night flow method was set based on three standard deviations of normal inlet flow rate of DMA. The recall rates of the proposed method (WB-Method) and the method based on Principal Components Analysis (PCA) are showed in Table 2.
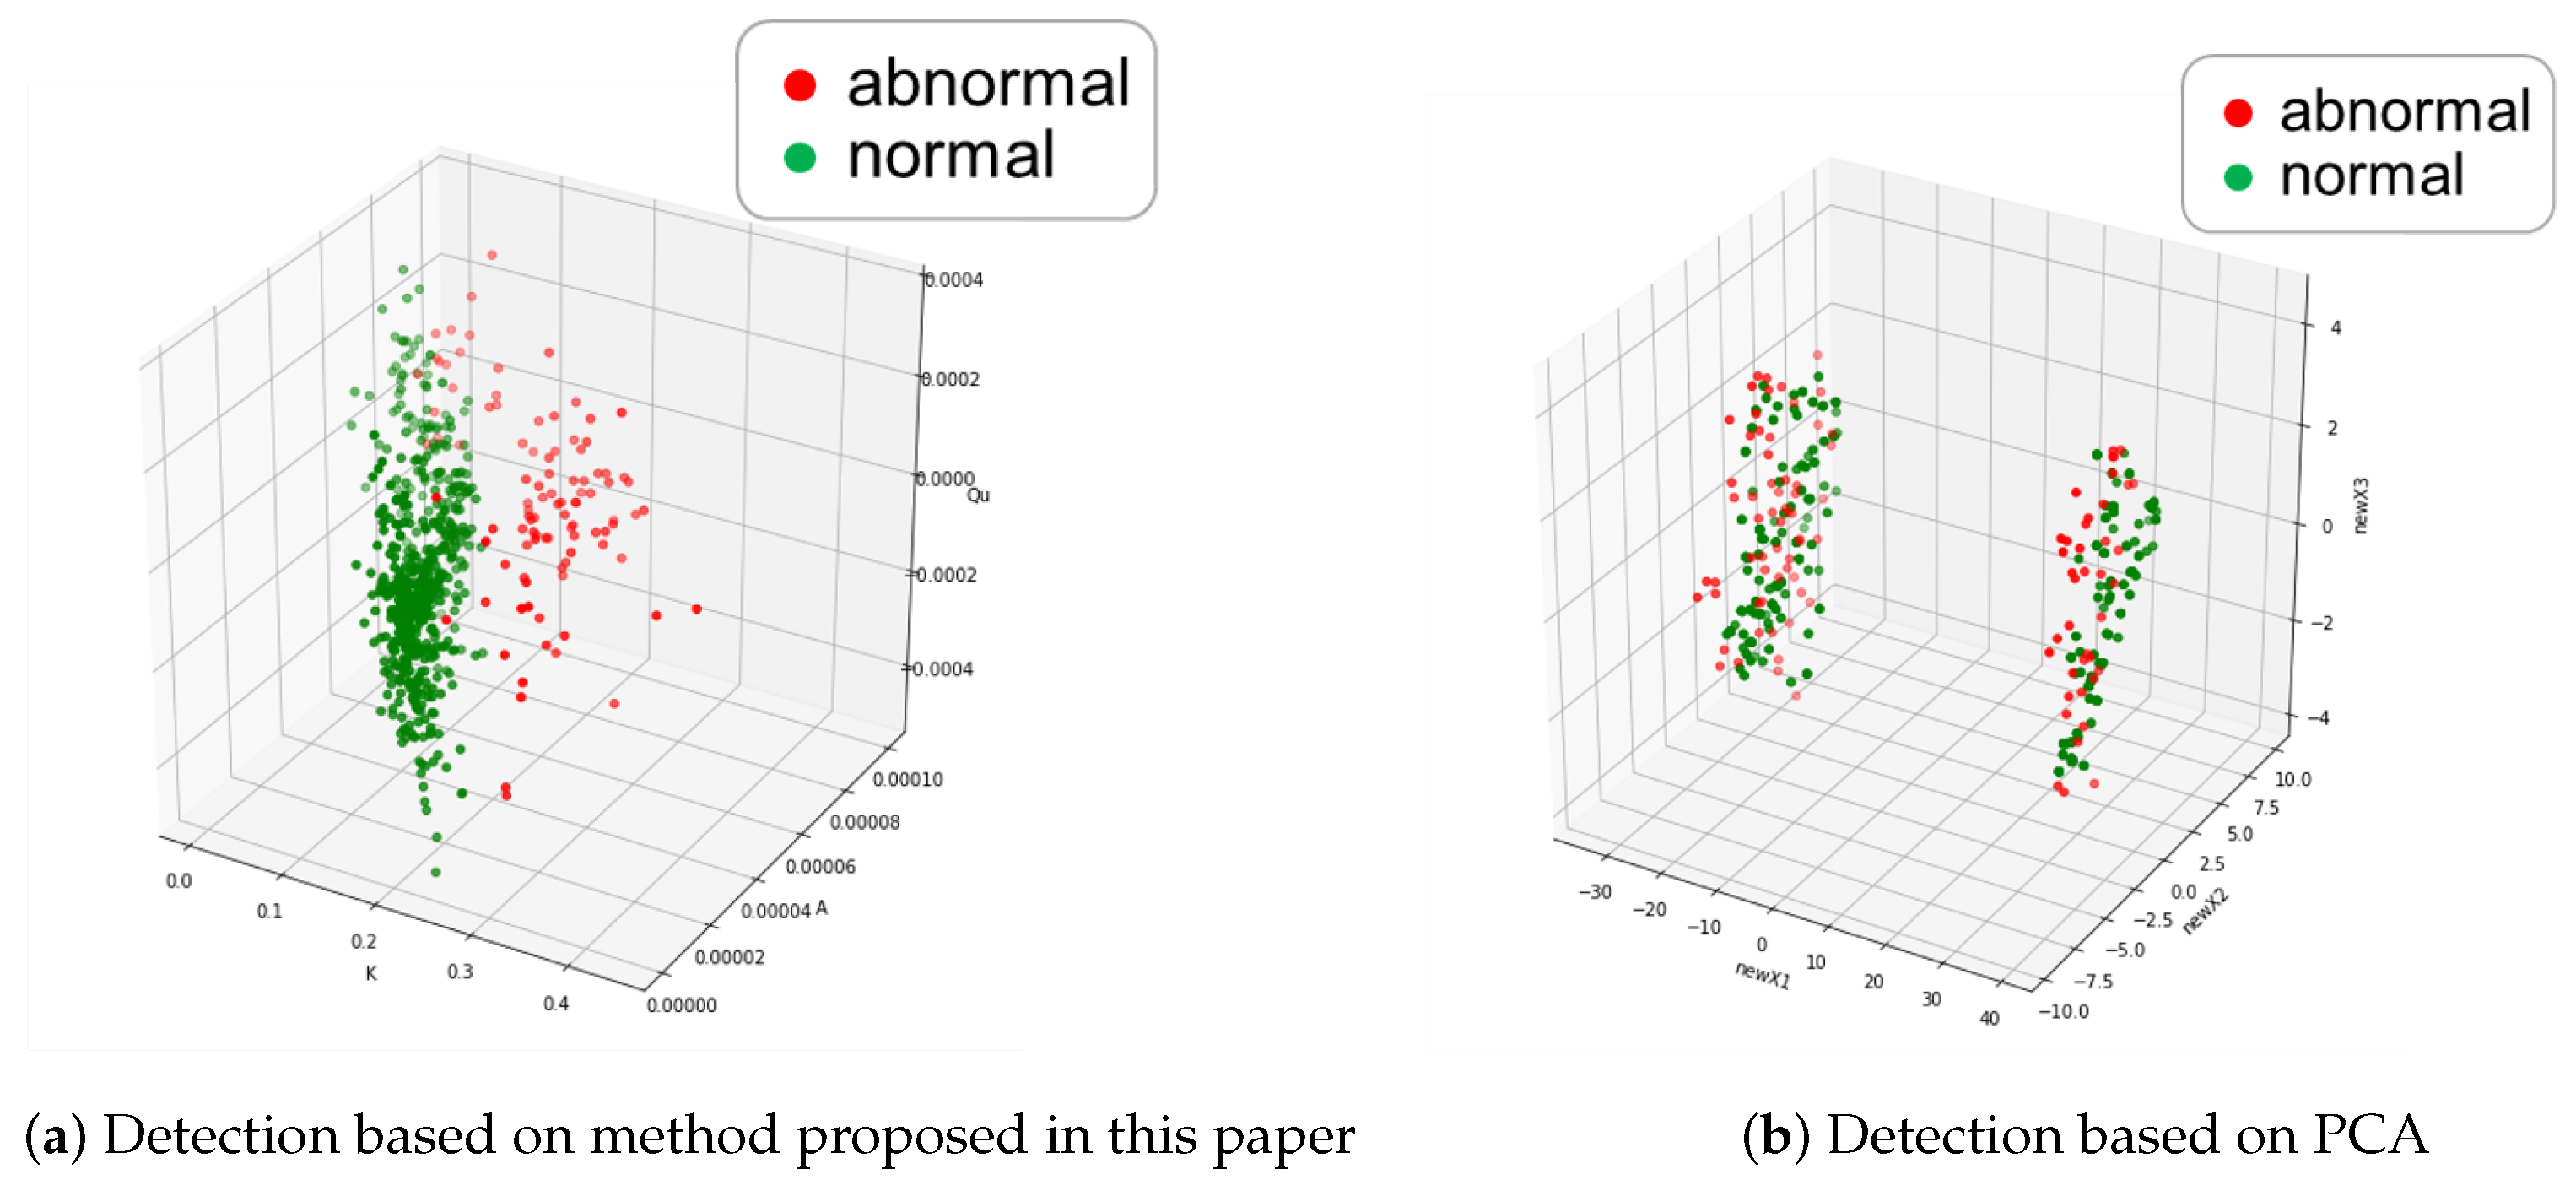
In addition, the performance of the two methods can be seen from the comparison of their feature vectors. As show in Figure 8, the method proposed in this article performed better, as there is distinguishable difference between the abnormal and normal points compared with PCA.
In order to further compare the effectiveness of the features extracted by the proposed method, the recall rates of the two detection methods for different degrees of leakage events were calculated by setting the nozzle flow coefficient C E M in different ranges. The results are shown in Table 3. After the leakage events are divided into different degrees, the result of the proposed method still achieved better detection performance under different amount of leakage condition. When the C E M is between 0.5 and 0.6, the recall rate of the method proposed in this paper reaches 100%. For smaller leakage, the detection performance is still within the satisfaction with results above 90%.
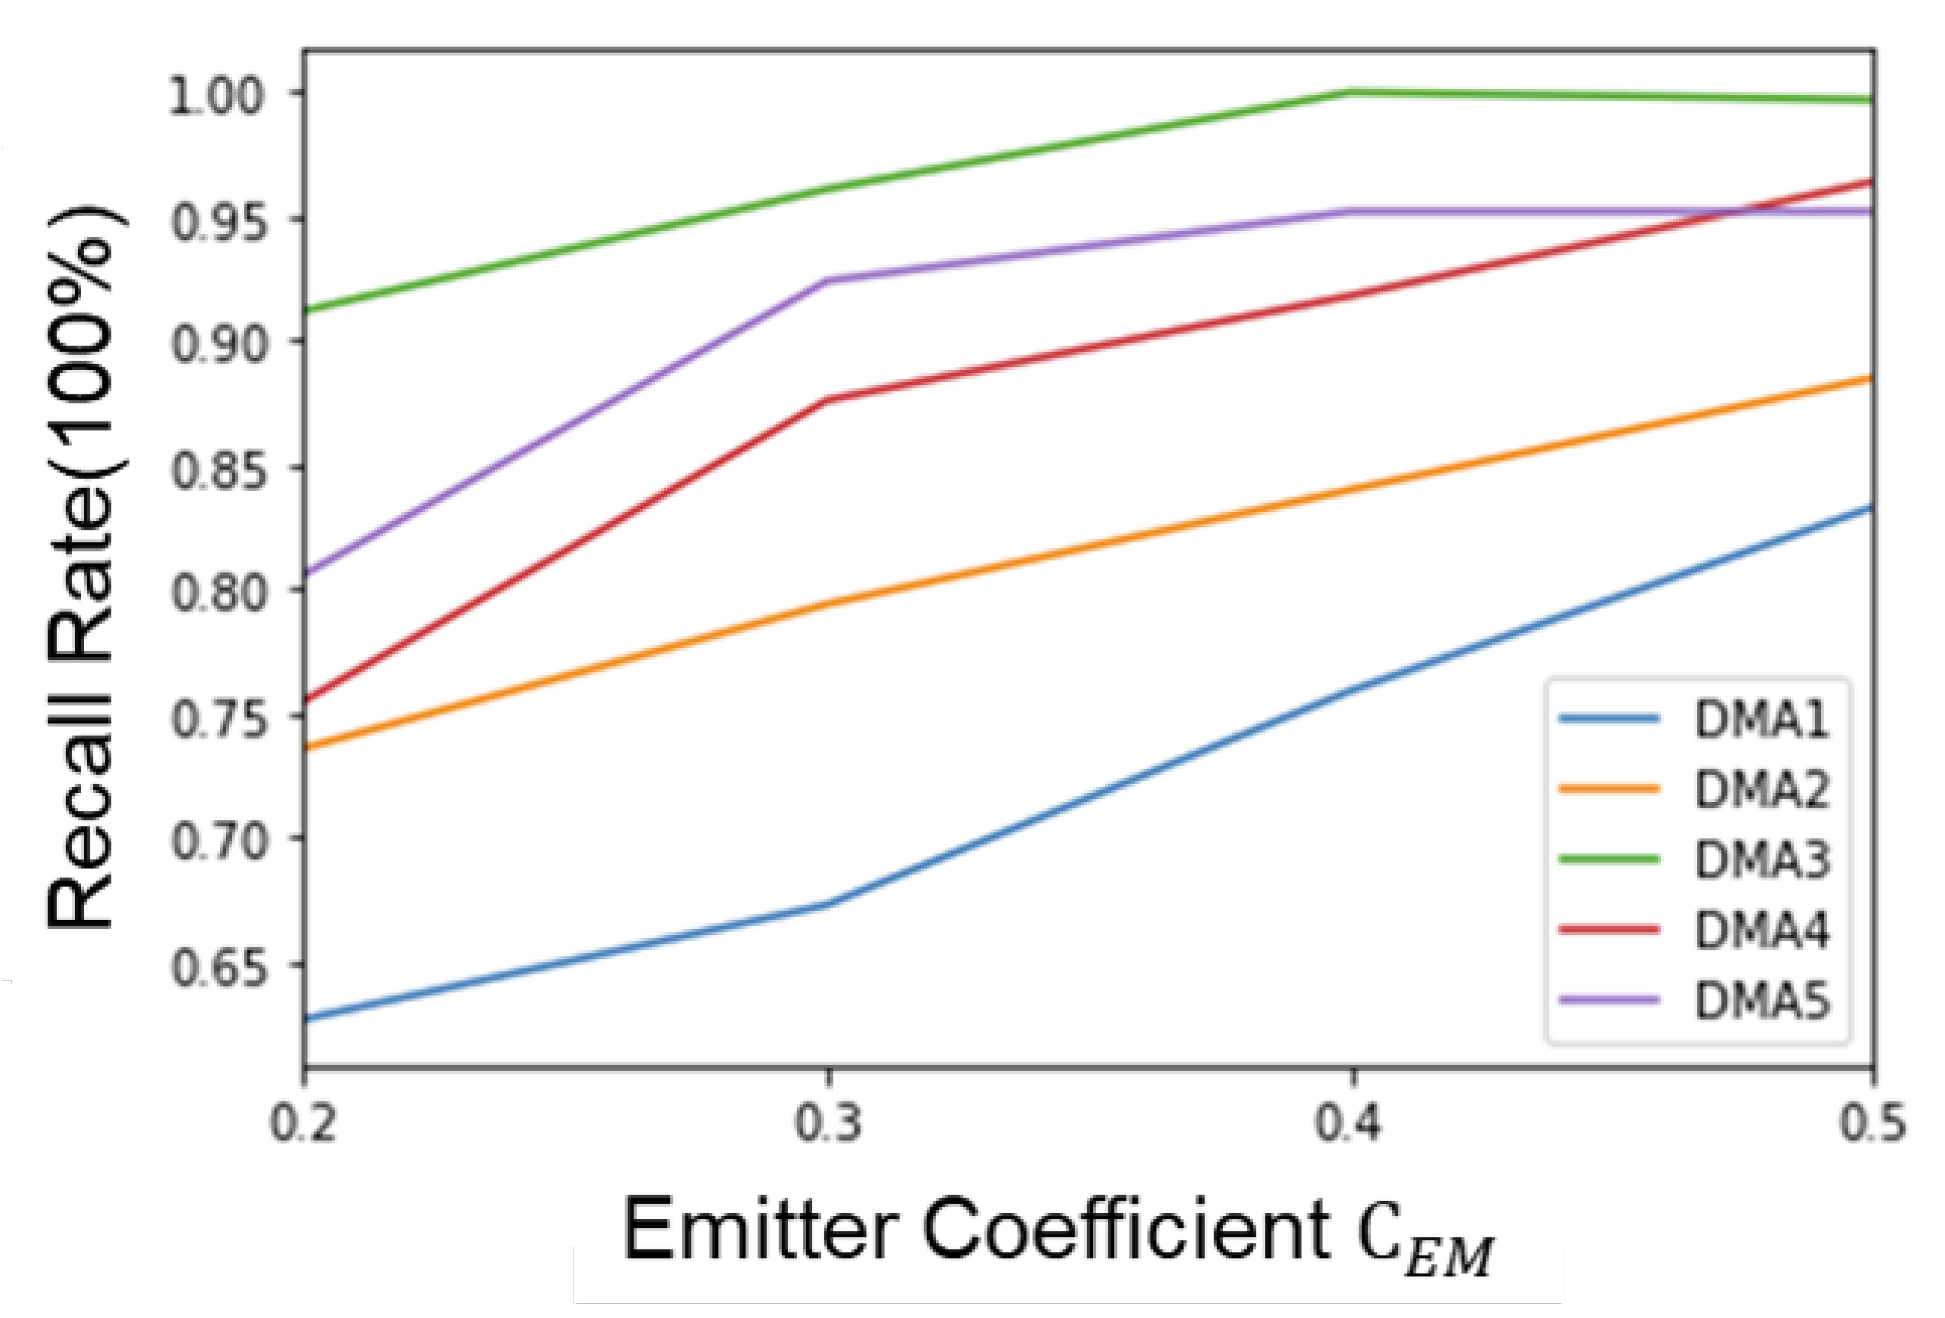
As shown in Figure 9, for each DMA, the recall rate of the proposed method proposed increased with the increase of the emitter coefficient C E M . That is, for each DMA, the larger the leak scale was, the higher the recall rate would be. When the emitter coefficient C E M was 0.5, the recall rate of the proposed method in each DMA can reach above 83%. It indicated that the parameter assessment-based leakage detection method proposed in this paper can effectively identify leak events in water distribution networks in both large and small leakage conditions.
The detection performance of proposed method was also discussed for different DMAs with different time window length. Time window length means the number of data sets used in the parameter assessment; there are three sets of data at least for three unknown parameters. In this case, the data were collected once an hour, meaning 4 sets of data were used in parameters assessment when the time window length equals to 4. As shown in Table 4, the recall rate can reach about 90% when the time window length is just four; there can be a certain improvement with more data sets.

3.1.3. Approximate Location Information of Leakage

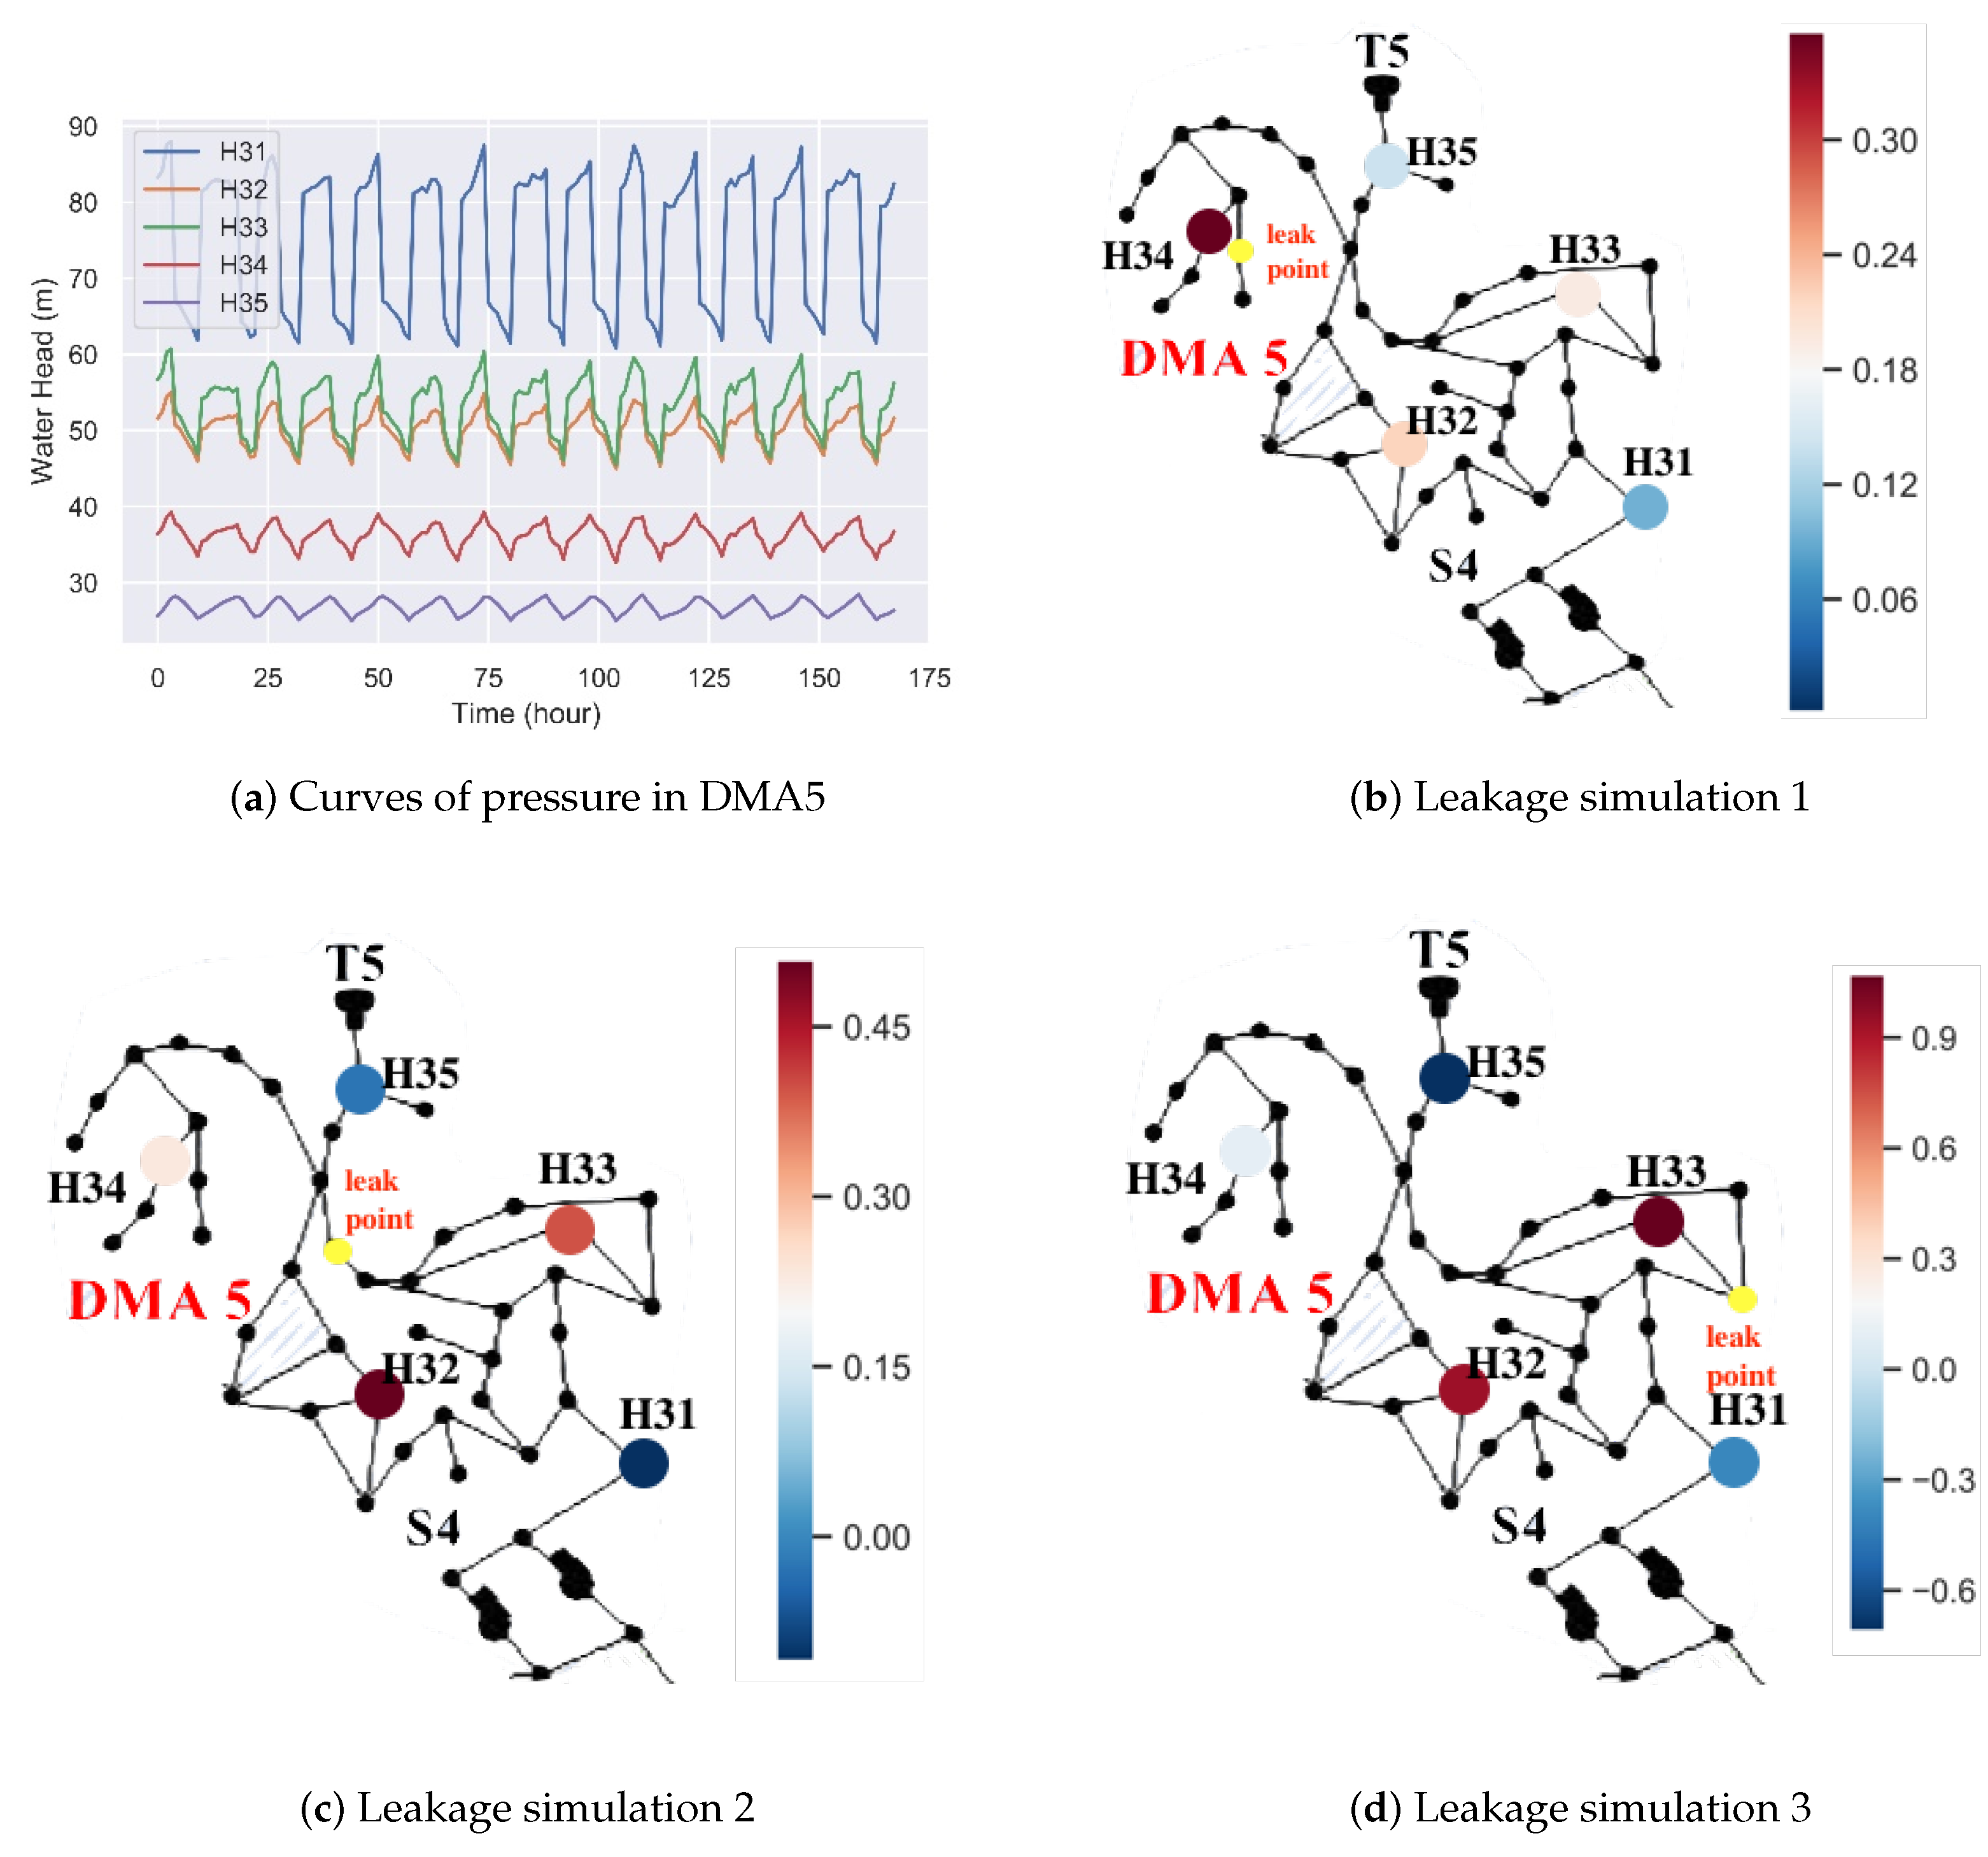
After detecting the occurrence of leak event and gathering more data of the event, the leakage region can be located according to the model represented by Equation (9). According to the curves of pressure in Figure 10a, the pressure sensors were well arranged and covered the range of pressure in DMA5. The estimated weighted coefficients of pressure sensors for leaks in different locations in DMA5 are shown in Figure 10b–d. When the positions of leaks are different, the weighted average coefficients of the pressure sensors are different. The pressure sensors near leak point tended to have larger coefficients. Here, the word “near” means the pressure measured by pressure sensor near to the pressure at the leak point. As shown in Figure 10a, the pressures measured by sensors H32 and H33 were similar. Thus, the coefficients of sensors H32 and H33 are estimated to be similar, but still had some difference, as shown in Figure 10b–d. Therefore, by estimating the weighted average coefficients of the pressure sensors in the DMA or WDN, some approximate location information of leakage can be deduced.

3.2. Case 2

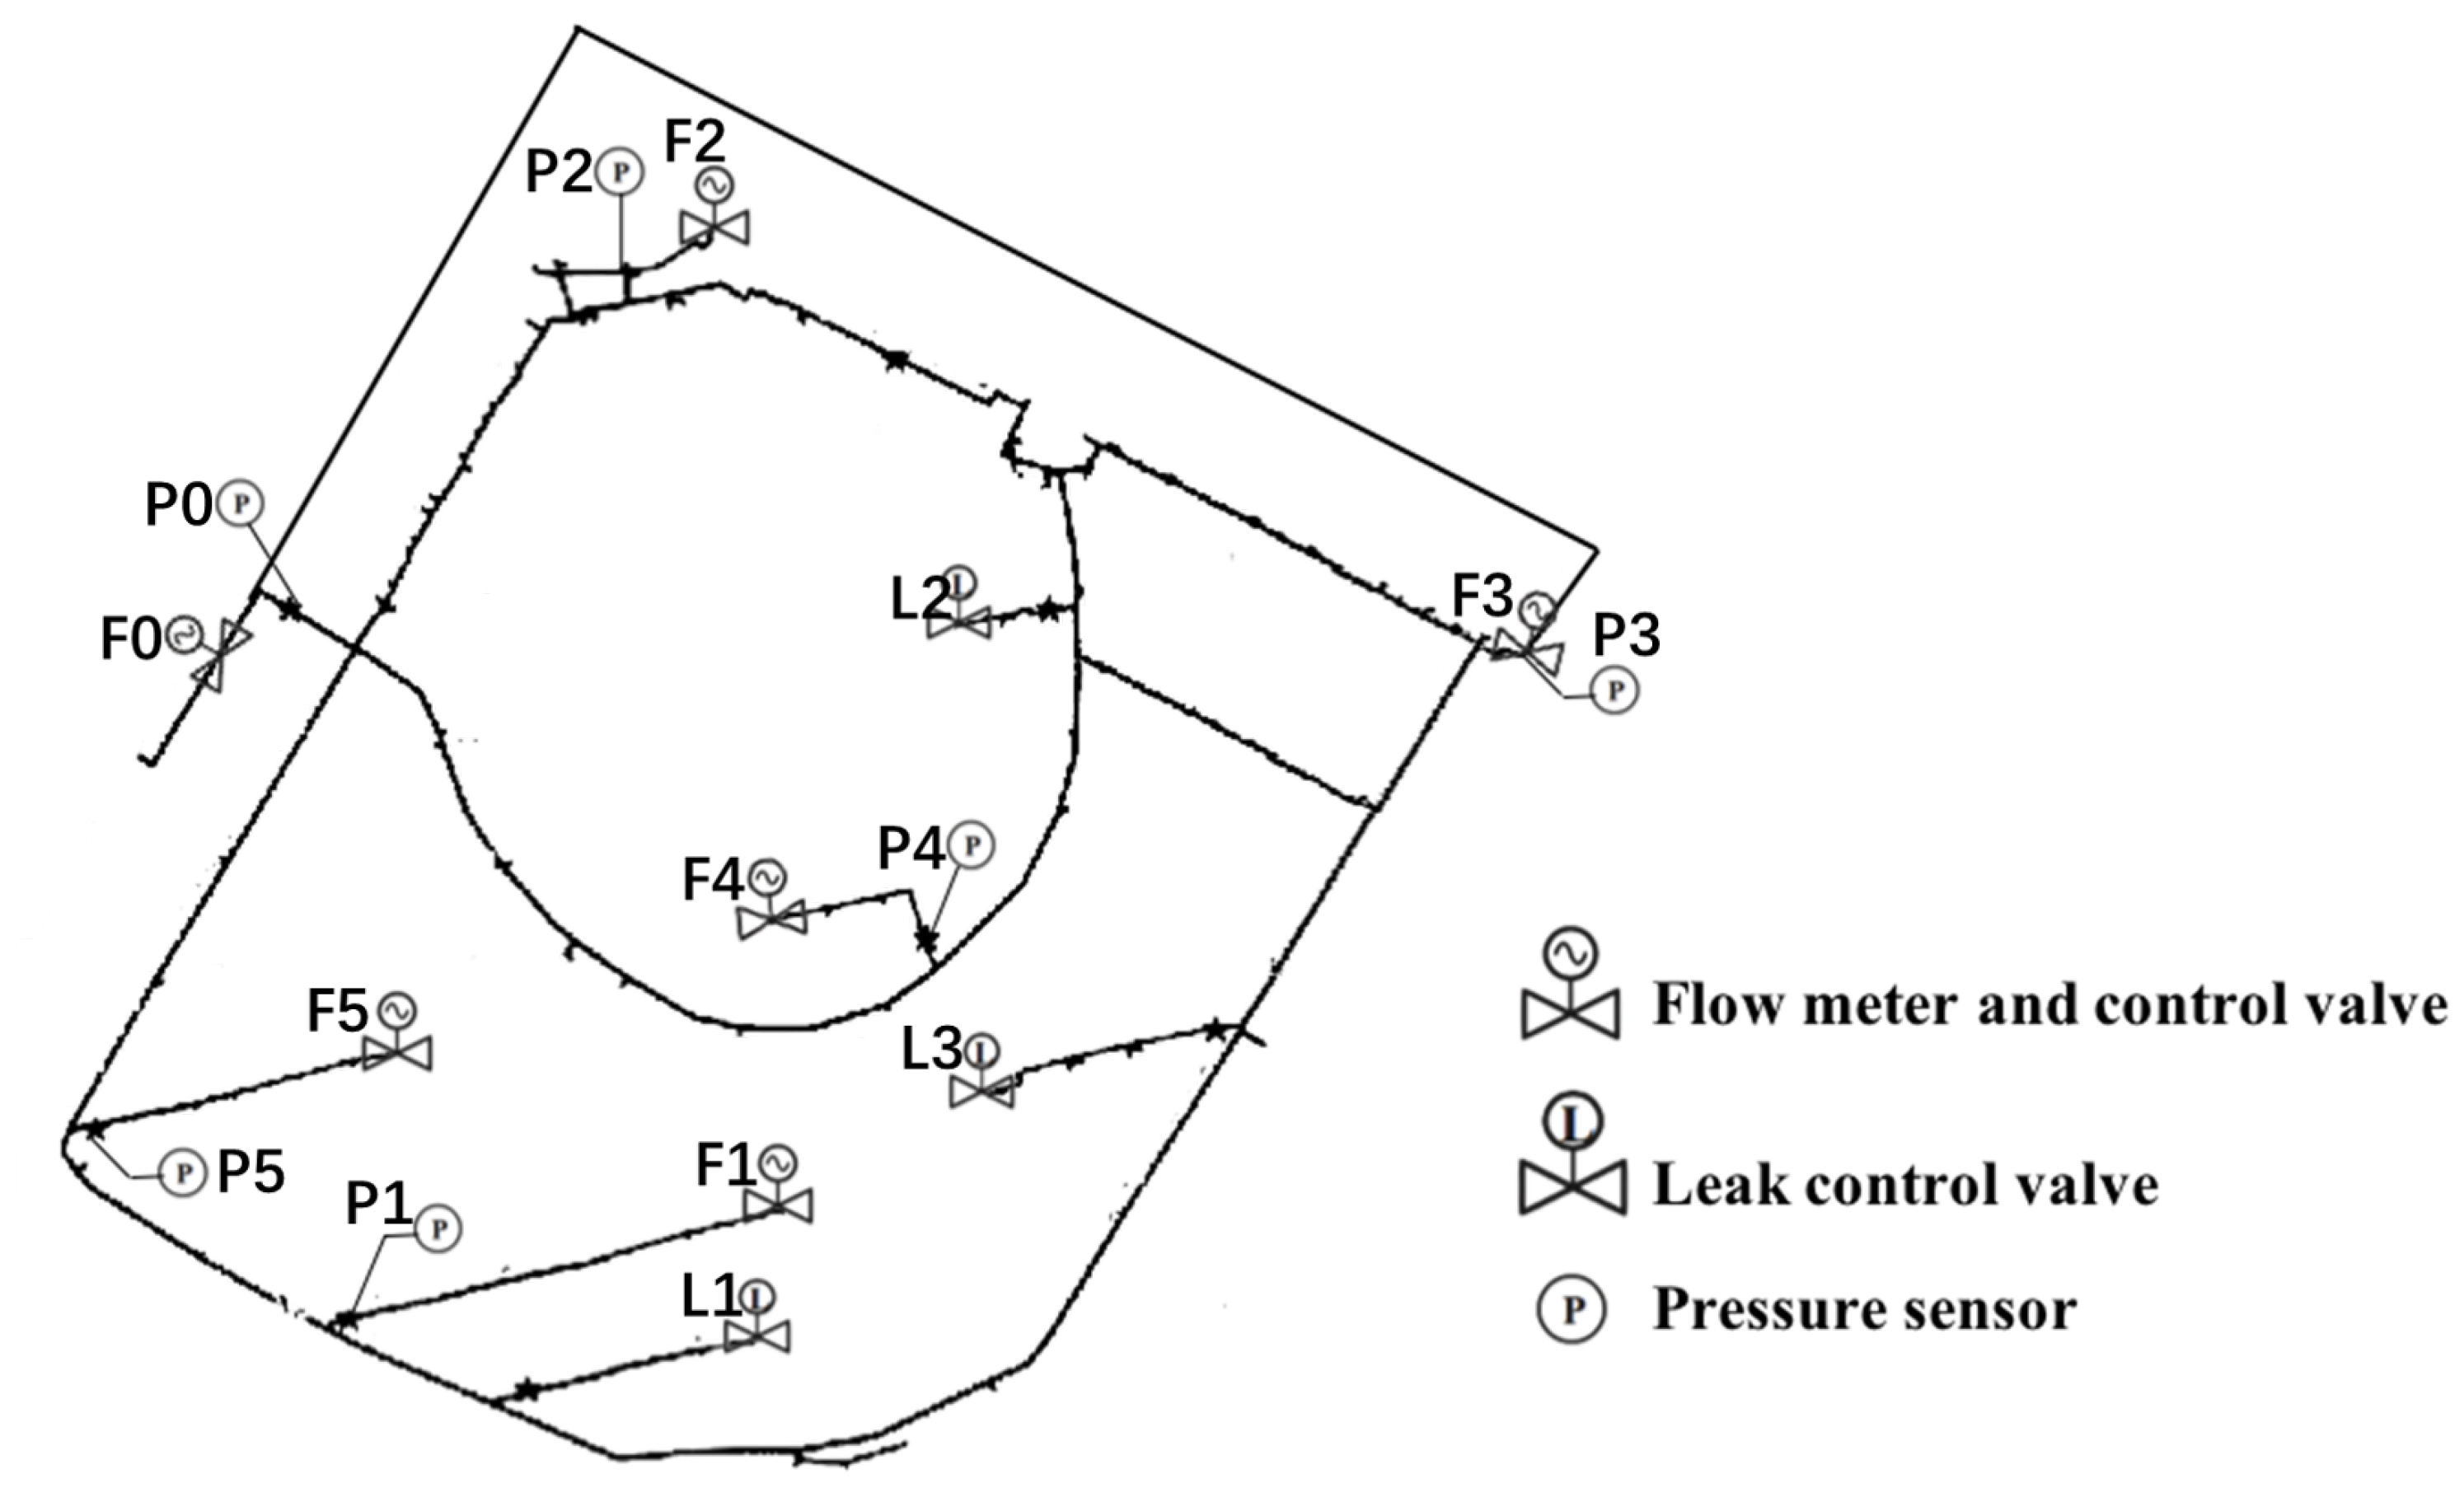
To verify the proposed method on a real pipeline network, an experimental platform was built up based on a real pipeline network. The topology is depicted in the Figure 11. There are 5 nodes in the platform to simulate the customers’ water usage. The flow of each node, labeled in picture as F n , is controlled by an electric flow regulating valve and metered by a flow meter. Six pressure sensors, labeled in picture as P n , are situated in the entry point of the network and other five representative nodes. In addition, three valves, named leakage control valves, are also arranged in the pipeline network to simulate leaks, labeled in picture as L n . Note that the pipe connections in the experimental platform are detachable. By adjusting the valve opening and the position of leakage control valve, different leak types can be simulated. Besides, the topology of the pipe network can be changed by switching the valves of each pipeline on or off.
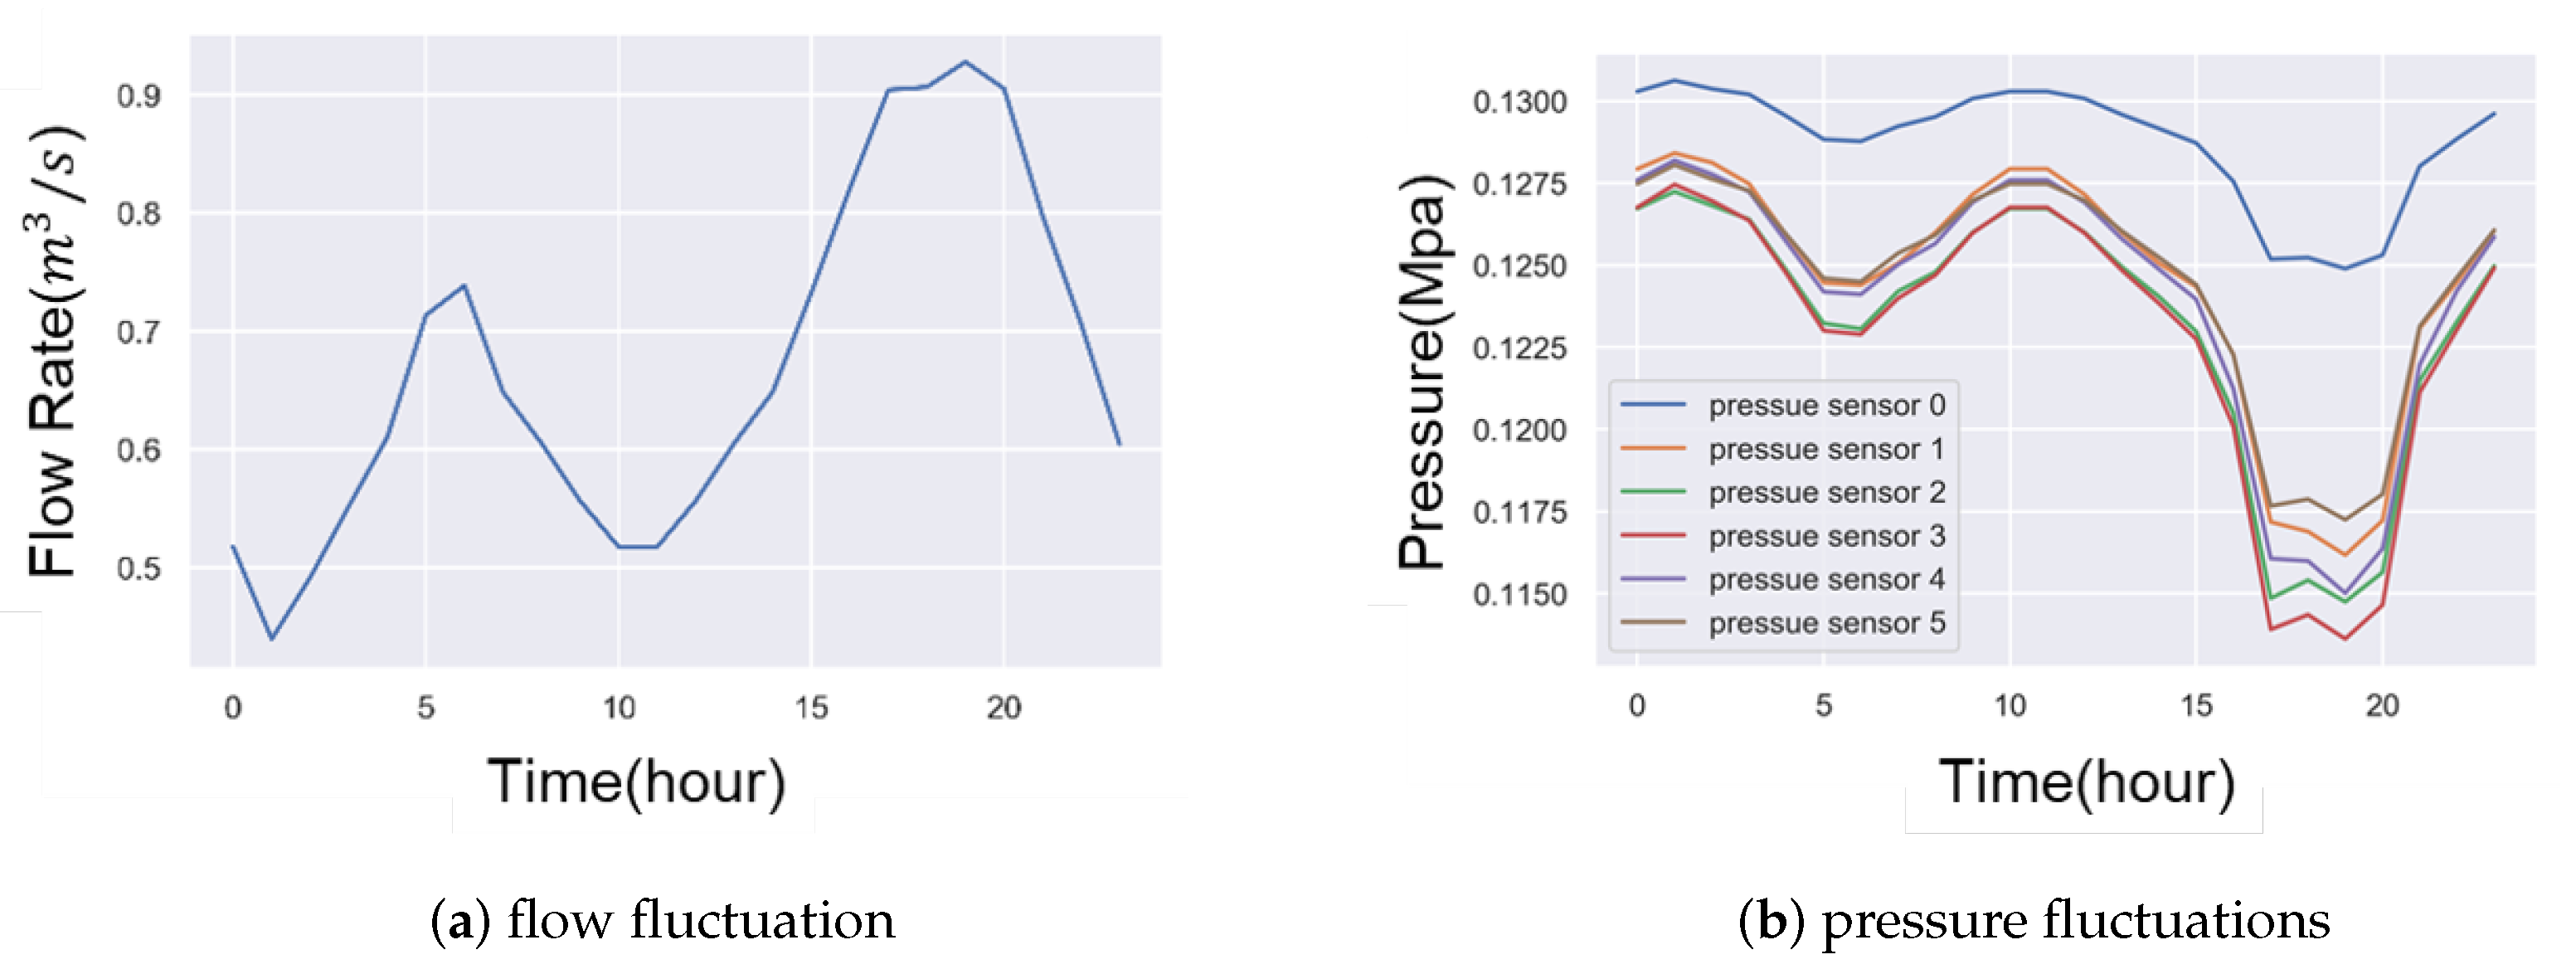
Before the experiments, the water demand of the five customer nodes was set according to a typical residential water demand, as shown in Figure 12.

3.2.1. Parameters Assessment

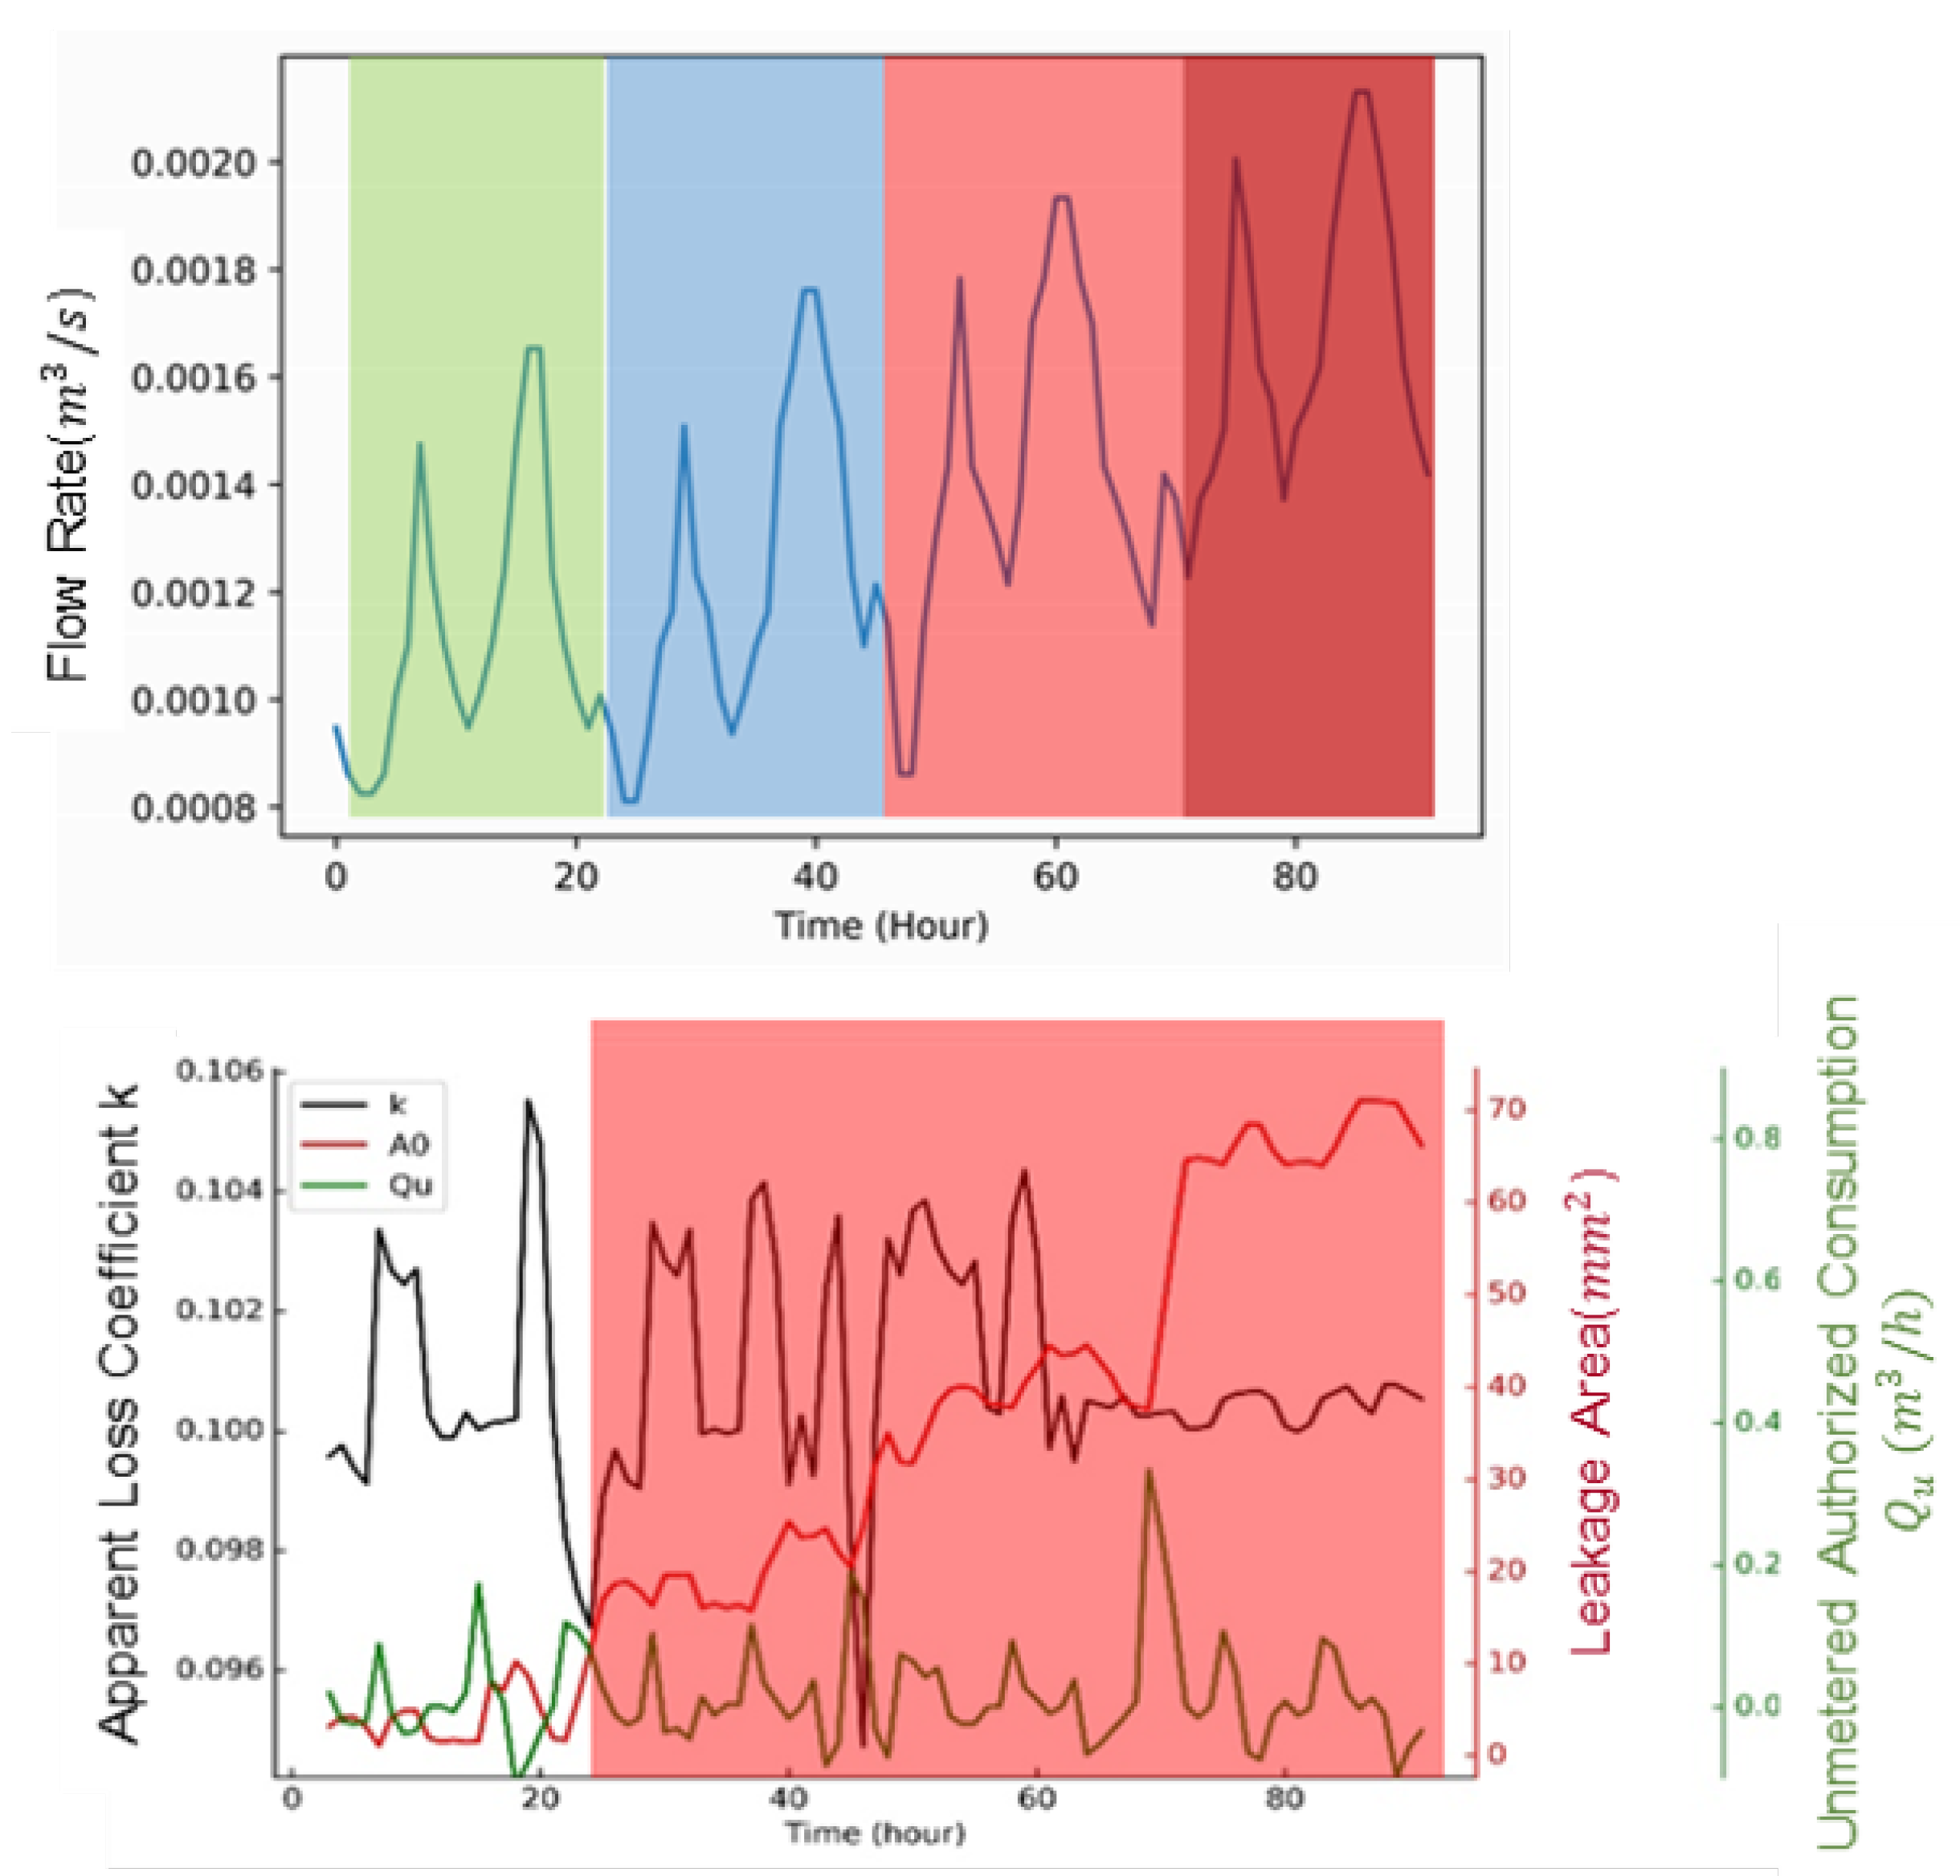
To better evaluate the performance of proposed method, we simulated a leak by opening the No.1 leakage control value, and the valve opening degree was gradually increased (20%, 30%, 50%). When the valve opening degree was 20%, the real losses accounted for about 25% of inlet flow at night demand valley, about 11% at peak demand, and about 16% of the average inlet flow. The proposed method was applied to analyze the data collected from the flow meters and pressure sensors. The curves of system input flow rate and the estimated parameters are shown in Figure 13.
In the initial period, the leakage control valve was off and there were only some background leakages at the junctions of the pipes in the network. In this period, the estimated leakage area A 0 was almost 0 mm 2 (no more than 8 mm 2 ), indicating that the water distribution network was working in a normal state. In the following periods, the estimated leakage area A 0 increased significantly, about 18 mm 2 corresponding to the valve opening degree of 20%, 40 mm 2 corresponding to 30%, and 65 mm 2 corresponding to 50%. Thus, the threshold method, with a threshold value 15 mm 2 of the leakage area A 0 , was simply employed to detect three sizes of the leaks. In addition, it can be seen that the estimated leakage area A 0 was different at different valve opening degrees. The more serious the leakage was, the larger the estimated leakage area A 0 would be. Therefore, the leakage area A 0 can be used as the abnormal degree of the leakage event, which provides convenience for the water company to adopt different strategies.
On the other hand, the apparent loss coefficient k was estimated to maintain at around 0.1, which meant that apparent losses accounted for about 10% of the total system input flow in the pipe network. Studies have shown that apparent losses generally account for about 30–40% of the total amount of water losses in real water distribution systems (Lambert, 2003). Thus, 10% of the total system input flow seems to be a reasonable value. However, for this just-built experimental platform, 10% is obviously an abnormal value of the apparent losses coefficient k. Therefore, at the end of the experiment, we checked all the flow meters in the pipeline network. It was found that the flow meters situated at the customer nodes are turbine flow meters. However, no filtering device was installed in front of the turbine flow meters, resulting in some solid impurities entangling on the turbine. That is the reason why there was a deviation in the measurement of the water consumption at the customer nodes. That is to say, an abnormal event of flow meters in the water distribution system could have directly impacted the apparent losses consumption, resulting in a larger estimated apparent loss coefficient k than the normal state. By analyzing the estimated apparent losses coefficient k, the abnormal events of flow meters in the water distribution system could be effectively identified.

3.2.2. Approximate Location Information of Leak

Next, leakage control valve No.2 was used to simulate another leak, and the valve opening degree was set to be 30%. The hydraulic data from these two leakage events (30% opening degree of valve No.1, and 30% opening degree of valve No.2) were used to estimate the weighted coefficients in Equation (9) separately. The estimation results are shown in Figure 13. It can be seen from Figure 14a that the weighted average coefficients of different sensors were significantly different, and the coefficient of the pressure sensors near the leak point was larger. Here, the word “near” means the pressure measured by pressure sensor near to the pressure at the leak point. With an optimal placement of pressure sensors, the pressure sensors spatially near to the leak point could have larger weighted average coefficients. Unfortunately, the pressure sensors in this experimental platform were manually arranged and all customer nodes’ water demands fluctuated at the same time, resulting in an almost identical pressure measurement at different pressure sensors. From Figure 14b, the pressure sensors could be divided into three groups: node 0 (inlet point), node 2 and 3, and the rest. The first group was greatly different from the other groups, but the difference between groups 2 and 3 was not very significant. The pressure at the leak simulated by valve No.2 lies between groups 2 and 3, resulting in the weighted average coefficients estimated having little difference as shown in Figure 14b. The method proposed in this paper can provide some approximate location information of the leak, based on an optimized placement of the pressure sensors in the WDN.

4. Discussion

An integrated bottom-up approach for leak detection was proposed in this paper to achieve the quantification of different consumptions of water losses and detect leak events in water distribution networks. By analyzing the discriminative behavior of apparent and real losses, an integrated water balance model was constructed. In detail, the FAVAD theory was employed to model the real losses consumption as pressure-driven water demand. Then, the optimal algorithm Adam was employed to obtain an optimal least squares estimation of the parameters in the water balance model.
The method was successfully applied in an experimental real pipeline network and a benchmark WDN. The results showed that the proposed method has the ability to detect relatively small leakages. Moreover, the proposed method has the potential to be used as an online leak detection method, while the MNF method can be only applied at specific time. What is more, the abnormal degree of event could be provided according to the magnitudes of the estimated parameters. Based on the leak detection results in different DMAs, it was recommended that the proposed method should be applied in end-level DMAs. After detecting a leak, the proposed method was able to identify the pressure sensors near to the leak based on an optimized placement of pressure sensors.
However, in order to get the three unknown parameters, Qm, the authorized metered flow rate, must be known, which can be measured by smart meters or other measurement. The speed of failure detection is related to the sampling frequency of device and the time window length setting in the code. For example, it is understood that water supply companies measure the hydraulic parameters in the network 15 min a time, and the time window length sets to 4, so once the anomaly occurred, it can be detected after an hour. The faster sampling frequency and shorter time window length lead to faster detection speed, but the shorter time window length may lead to reduced accuracy. The accuracy of locating method much depends on the layout of device. The accuracy can be boosted through improving the layout and the performance of measuring devices.

Author Contributions

Conceptualization, J.Y. and D.H.; methodology, J.C.; software, L.Z.; validation, J.Y., L.Z. and J.C.; formal analysis, L.Z.; investigation, Y.X.; data curation, L.Z. and Y.X.; writing—original draft preparation, J.C.; writing—review and editing, all of the authors; project administration, D.H. All authors have read and agreed to the published version of the manuscript.

Funding

This research was funded by the National Natural Science Foundation of China (No.61803333; U1509208), the Key Technology Research and Development Program of Zhejiang Province (No. 2021C03177), and the National Key R&D Program of China (2017YFC1403801).

Institutional Review Board Statement

Not applicable.

Informed Consent Statement

Not applicable.

Data Availability Statement

The data presented in this study are available on request from the corresponding author. The data are not publicly available due to internal policies.

Conflicts of Interest

The authors declare no conflict of interest.

Abbreviations

The following abbreviations are used in this manuscript:
WDNswater distribution networks
AdamAdaptive moment estimation
MNFminimum night flow
SCADAsupervisory control and data acquisition
DMAsdistrict metering areas
FAVADfixed and variable area discharge

References

  1. Fontanazza, C.M.; Notaro, V.; Puleo, V.; Nicolosi, P.; Freni, G. Contaminant Intrusion through Leaks in Water Distribution System: Experimental Analysis. Procedia Eng. 2015, 119, 426–433. [Google Scholar] [CrossRef] [Green Version]
  2. Liu, H.; Yan, Z. Pipeline small leak detection based on PSO-SVM. Oil Gas Field Surf. Eng. 2019, 38, 105–110. [Google Scholar]
  3. Fei, L.; Tao, T. Leakage assessment and control method of water supply pipe network. China Water Wastewater 2012, 28, 35–39. [Google Scholar]
  4. Lambert, A. Assessing Non-Revenue Water and its Components: A Practical Approach. Water 2003, 21, 50–51. [Google Scholar]
  5. Oberascher, M.; Möderl, M.; Sitzenfrei, R. Water Loss Management in Small Municipalities: The Situation in Tyrol. Water 2020, 12, 3446. [Google Scholar] [CrossRef]
  6. Van den Berg, C. Drivers of non-revenue water: A cross-national analysis. Util. Policy 2015, 36, 71–78. [Google Scholar] [CrossRef]
  7. Kanakoudis, V.; Tsitsifli, S. Using the bimonthly water balance of a non-fully monitored water distribution network with seasonal water demand peaks to define its actual NRW level: The case of Kos town, Greece. Urban Water J. 2014, 11, 348–360. [Google Scholar] [CrossRef]
  8. Lenzi, C.; Bragalli, C.; Bolognesi, A.; Fortini, M. Infrastructure Leakage Index Assessment in Large Water Systems. Procedia Eng. 2014, 2014, 1017–1026. [Google Scholar] [CrossRef] [Green Version]
  9. McKenzie, R.; Seago, C. Assessment of real losses in potable water distribution systems: Some recent developments. Water Sci. Technol. Water Supply 2005, 5, 33–40. [Google Scholar] [CrossRef]
  10. Adedeji, K.B.; Hamam, Y.; Abu-Mahfouz, A.M. Impact of Pressure-Driven Demand on Background Leakage Estimation in Water Supply Networks. Water 2019, 11, 1600. [Google Scholar] [CrossRef] [Green Version]
  11. Alvisi, S.; Luciani, C.; Franchini, M. Using water consumption smart metering for water loss assessment in a DMA: A case study. Urban Water J. 2019, 16, 77–83. [Google Scholar] [CrossRef]
  12. Xin, K.; Tao, T.; Lu, Y.; Xiong, X.; Li, F. Apparent Losses Analysis in District Metered Areas of Water Distribution Systems. Water Resour. Manag. 2014, 28, 683–696. [Google Scholar] [CrossRef]
  13. Mutikanga, H.; Sharma, S.; Vairavamoorthy, K. Assessment of apparent losses in urban water systems. Water Environ. J. 2011, 25, 327–335. [Google Scholar] [CrossRef]
  14. Marzola, I.; Alvisi, S.; Franchini, M. Analysis of MNF and FAVAD Models for Leakage Characterization by Exploiting Smart-Metered Data: The Case of the Gorino Ferrarese (FE-Italy) District. Water 2021, 13, 643. [Google Scholar] [CrossRef]
  15. Hutton, C.; Kapelan, Z.; Vamvakeridou-Lyroudia, L.; Savic, D. Dealing with uncertainty in water distribution system models: A framework for real-time modeling and data assimilation. Water Resour. Plan. Manag. 2014, 140, 169–183. [Google Scholar] [CrossRef]
  16. Van Zyl, J.; Clayton, C. The effect of pressure on leakage in water distribution systems. Proc. Inst. Civ. Eng. Water Manag. 2007, 160, 109–114. [Google Scholar] [CrossRef]
  17. Sanz, G.; Perez, R.; Kapelan, Z.; Savic, D. Leak detection and localization through demand components calibration. J. Water Resour. Plan. Manag. 2016, 142, 1097–1098. [Google Scholar] [CrossRef] [Green Version]
  18. Xie, X.; Hou, D.; Tang, X.; Zhang, H. Leakage Identification in Water Distribution Networks with Error Tolerance Capability. Water Resour. Manag. 2019, 33, 1233–1247. [Google Scholar] [CrossRef]
  19. Wu, Y.; Liu, S.; Wu, X.; Liu, Y.; Guan, Y. Burst detection in district metering areas using a data driven clustering algorithm. Water Res. 2016, 100, 28–37. [Google Scholar] [CrossRef]
  20. Romano, M.; Kapelan, Z.; Savic, D. Automated detection of pipe bursts and other events in water distribution systems. J. Water Resour. Plan. Manag. 2014, 140, 457–467. [Google Scholar] [CrossRef] [Green Version]
  21. Laucelli, D.; Romano, M.; Savic, D.; Giustolisi, O. Detecting anomalies in water distribution networks using EPR modelling paradigm. J. Hydroinform. 2016, 18, 409–427. [Google Scholar] [CrossRef] [Green Version]
  22. Palau, C.; Arregui, F.; Carlos, M. Burst detection in water networks using principal component analysis. J. Water Resour. Plan. Manag. 2012, 138, 47–54. [Google Scholar] [CrossRef] [Green Version]
  23. Ye, G.; Fenner, R. Kalman filtering of hydraulic measurements for burst detection in water distribution systems. J. Pipeline Syst. Eng. Pract. 2011, 2, 14–22. [Google Scholar] [CrossRef]
  24. Huang, P.; Zhu, N.; Hou, D.; Chen, J.; Xiao, Y.; Yu, J.; Zhang, G.; Zhang, H. Real-Time Burst Detection in District Metering Areas in Water Distribution System Based on Patterns of Water Demand with Supervised Learning. Water 2018, 10, 1765. [Google Scholar] [CrossRef] [Green Version]
  25. Soldevila, A.; Fernandez-Canti, R.; Blesa, J.; Tornil-Sin, S.; Puig, V. Leak localization in water distribution networks using Bayesian classifiers. J. Process Control 2017, 55, 1–9. [Google Scholar] [CrossRef] [Green Version]
  26. Wu, Y.; Liu, S.; Wang, X. Distance-based burst detection using multiple pressure sensors in district metering areas. J. Water Resour. Plan. Manag. 2018, 144, 06018009. [Google Scholar] [CrossRef]
  27. Puust, R.; Kapelan, Z.; Savic, D.; Koppel, T. A review of methods for leakage management in pipe networks. Urban Water J. 2010, 7, 25–45. [Google Scholar] [CrossRef]
  28. Tabesh, M.; Yekta, A.A.; Burrows, R. An integrated model to evaluate losses in water distribution systems. Water Resour. Manag. 2009, 23, 477–492. [Google Scholar] [CrossRef]
  29. Farah, E.; Shahrour, I. Leakage detection using smart water system: Combination of water balance and automated minimum night flow. Water Resour. Manag. 2017, 31, 4821–4833. [Google Scholar] [CrossRef]
  30. Schwaller, J.; van Zyl, J.; Kabaasha, A. Characterising the pressure-leakage response of pipe networks using the FAVAD equation. Water Sci. Technol. Water Supply 2015, 15, 1373–1382. [Google Scholar] [CrossRef]
  31. Chen, X.; Hou, B.; Xiao, W.; Hou, X.; Wang, L. Research on Intelligent Measurement and Leakage Diagnosis System and Method of Industrial Enterprise Dynamic Water Balance. Sci. Technol. Innov. Appl. 2020, 26, 6–9. [Google Scholar]
  32. Farley, M.; Trow, S. Losses in Water Distribution Networks: A Practitioners’ Guide to Assessment, Monitoring and Control. Water Intell. Online 2005. [Google Scholar] [CrossRef]
  33. Almandoz, J.; Cabrera, E.; Arregui, F.; Cabrera, E.; Cobacho, R. Leakage assessment through water distribution network simulation. J. Water Resour. Plan. Manag. 2005, 131, 458–466. [Google Scholar] [CrossRef]
  34. Kabaasha, A.; Piller, O.; van Zyl, J. Incorporating the Modified Orifice Equation into Pipe Network Solvers for More Realistic Leakage Modeling. J. Hydraul. Eng. 2018, 144. [Google Scholar] [CrossRef] [Green Version]
  35. Schwaller, J.; van Zyl, J. Modeling the pressure-leakage response of water distribution systems based on individual leak behavior. J. Hydraul. Eng. 2015, 141. [Google Scholar] [CrossRef]
  36. Cassa, A.; van Zyl, J.; Laubscher, R. A numerical investigation into the effect of pressure on holes and cracks in water supply pipes. Urban Water J. 2010, 7, 109–120. [Google Scholar] [CrossRef]
  37. Cassa, A.; Van Zyl, J.; Laubscher, R. Predicting the pressure-leakage slope of cracks in pipes subject to elastic deformations. J. Water Supply Res. Technol. AQUA 2013, 62, 214. [Google Scholar] [CrossRef]
  38. Kingma, D.; Jimmy, B. Adam: A Method for Stochastic Optimization. In Proceedings of the 3rd International Conference for Learning Representations, San Diego, CA, USA, 7–9 May 2015. [Google Scholar]
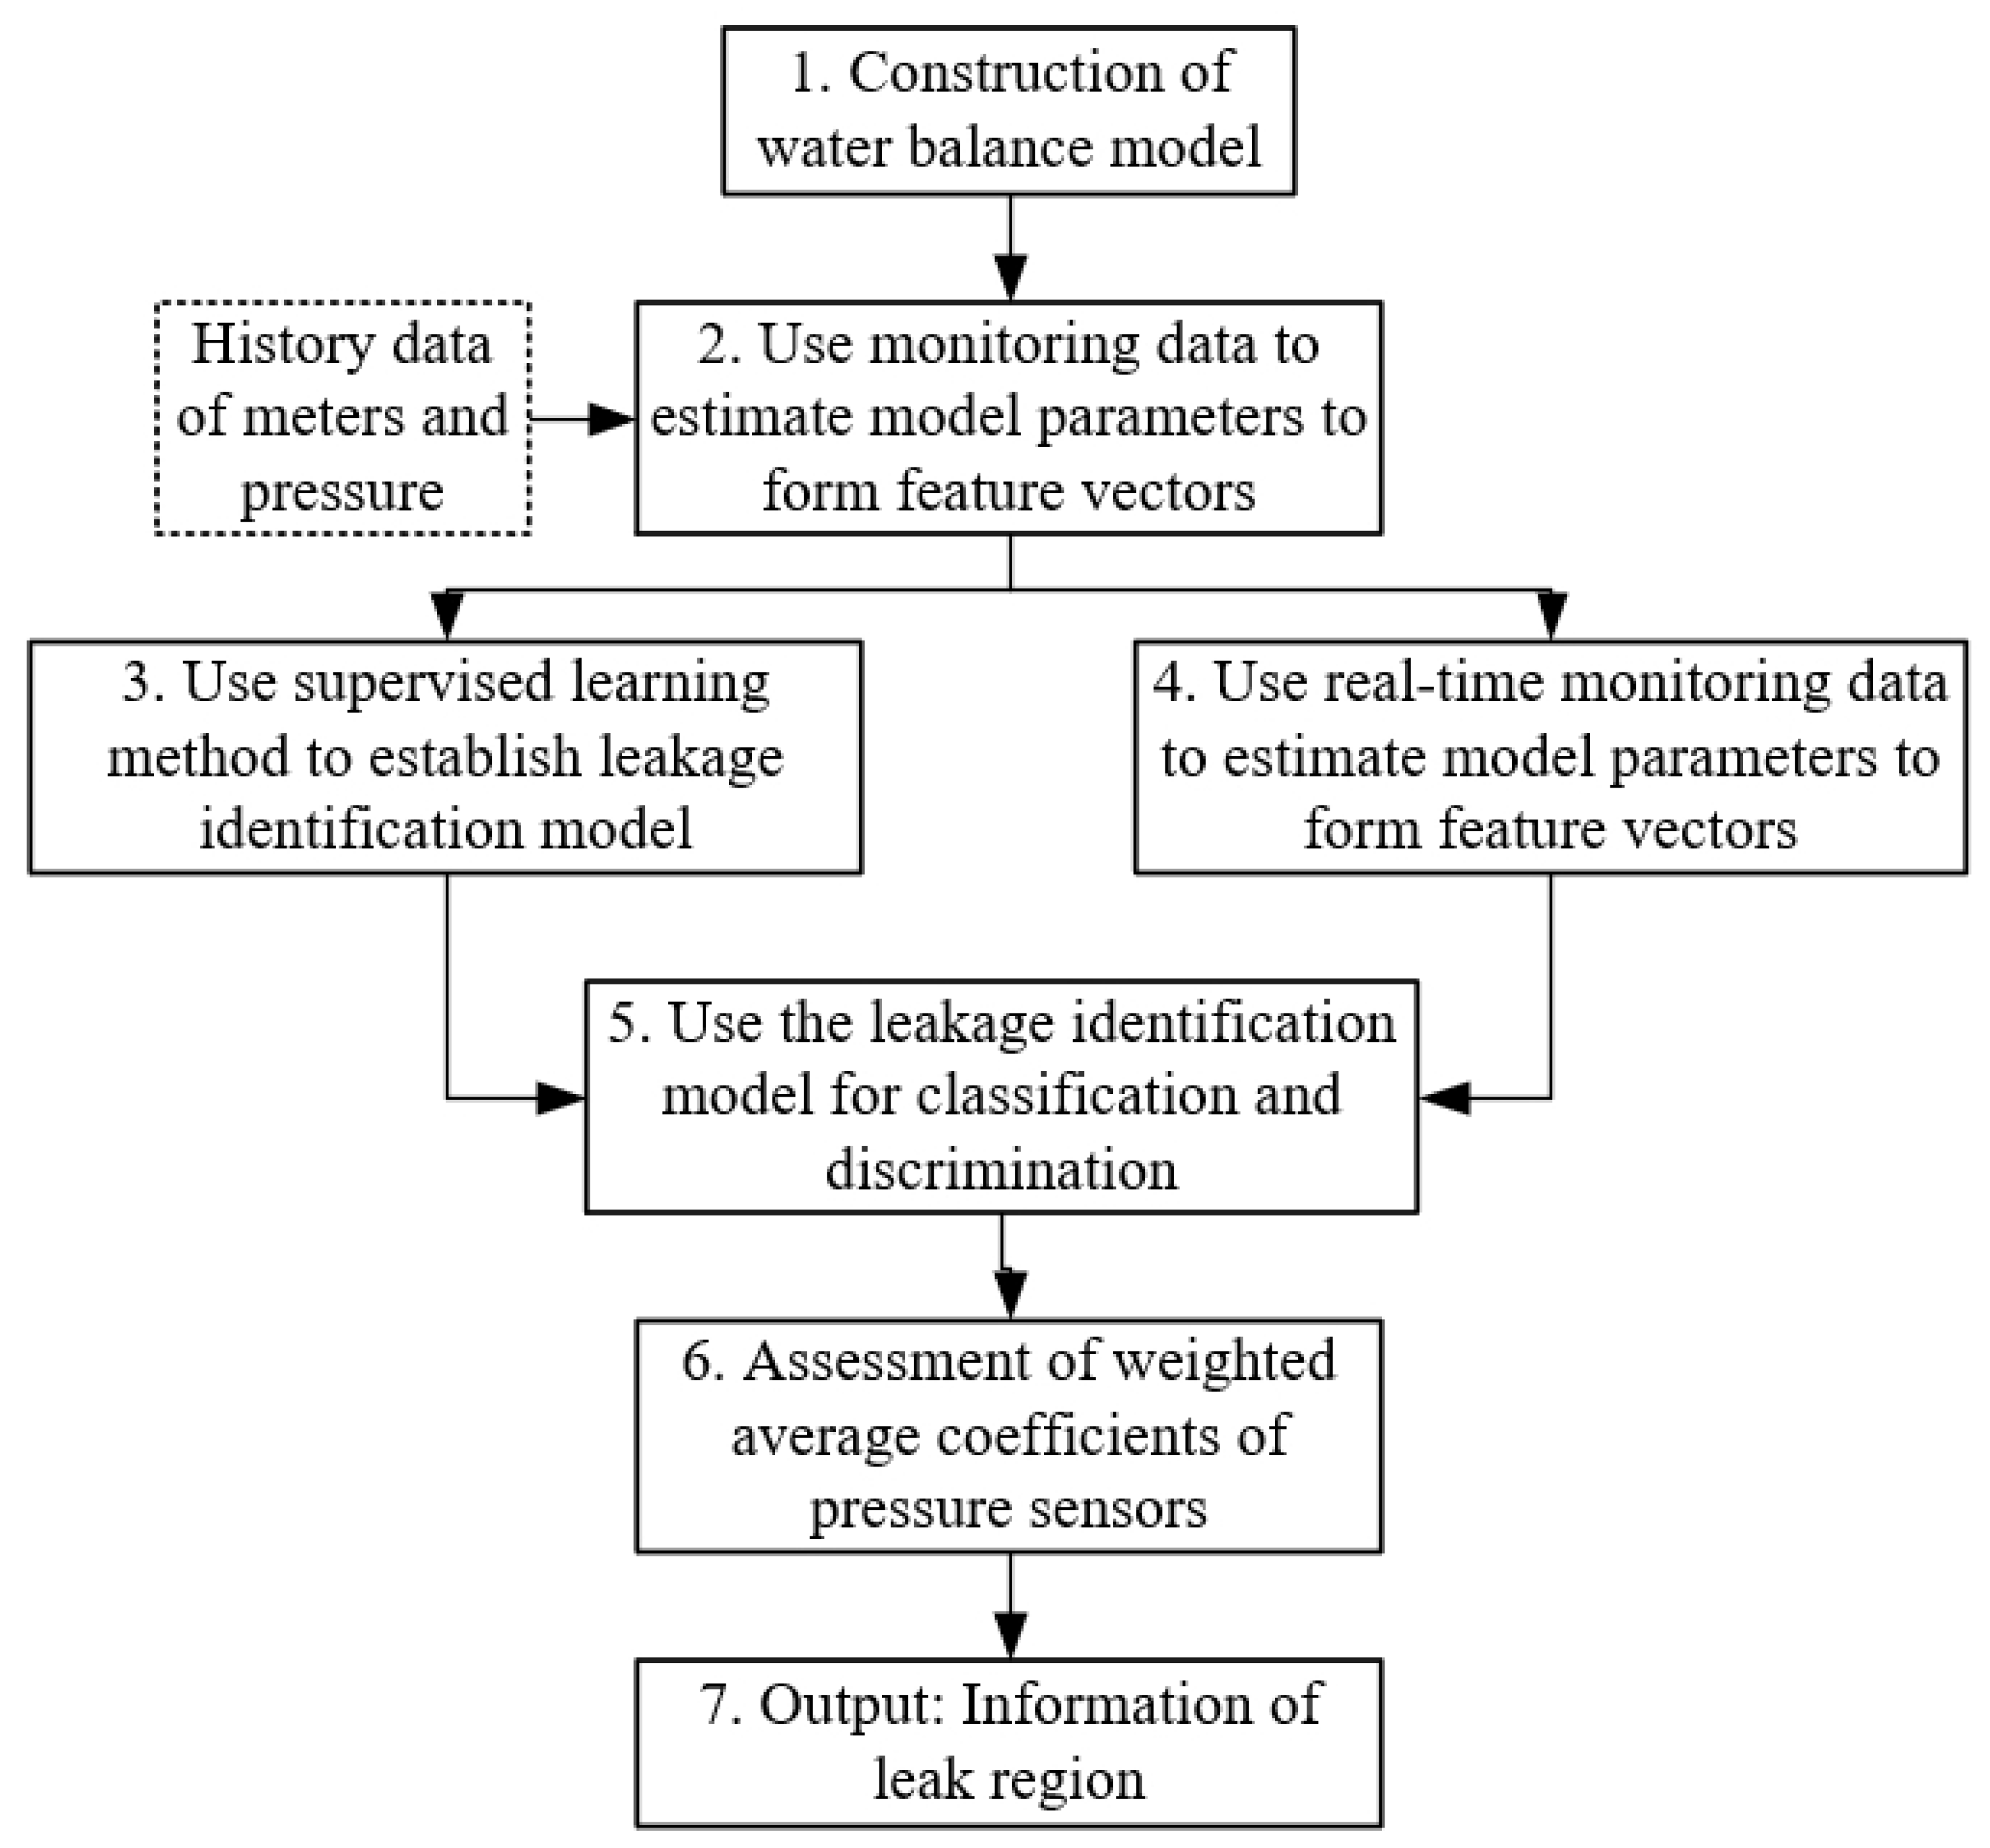
Figure 1. Framework of the proposed method.
Water 13 00867 g001
Figure 2. Fixed and variable areas of a leak.
Water 13 00867 g002
Figure 3. Layout of the C-Town benchmark.
Water 13 00867 g003
Figure 4. Simulate results of case1.
Water 13 00867 g004
Figure 5. Topology of DMA5.
Water 13 00867 g005
Figure 6. Comparison with a method based on “traditional” water balance.
Water 13 00867 g006
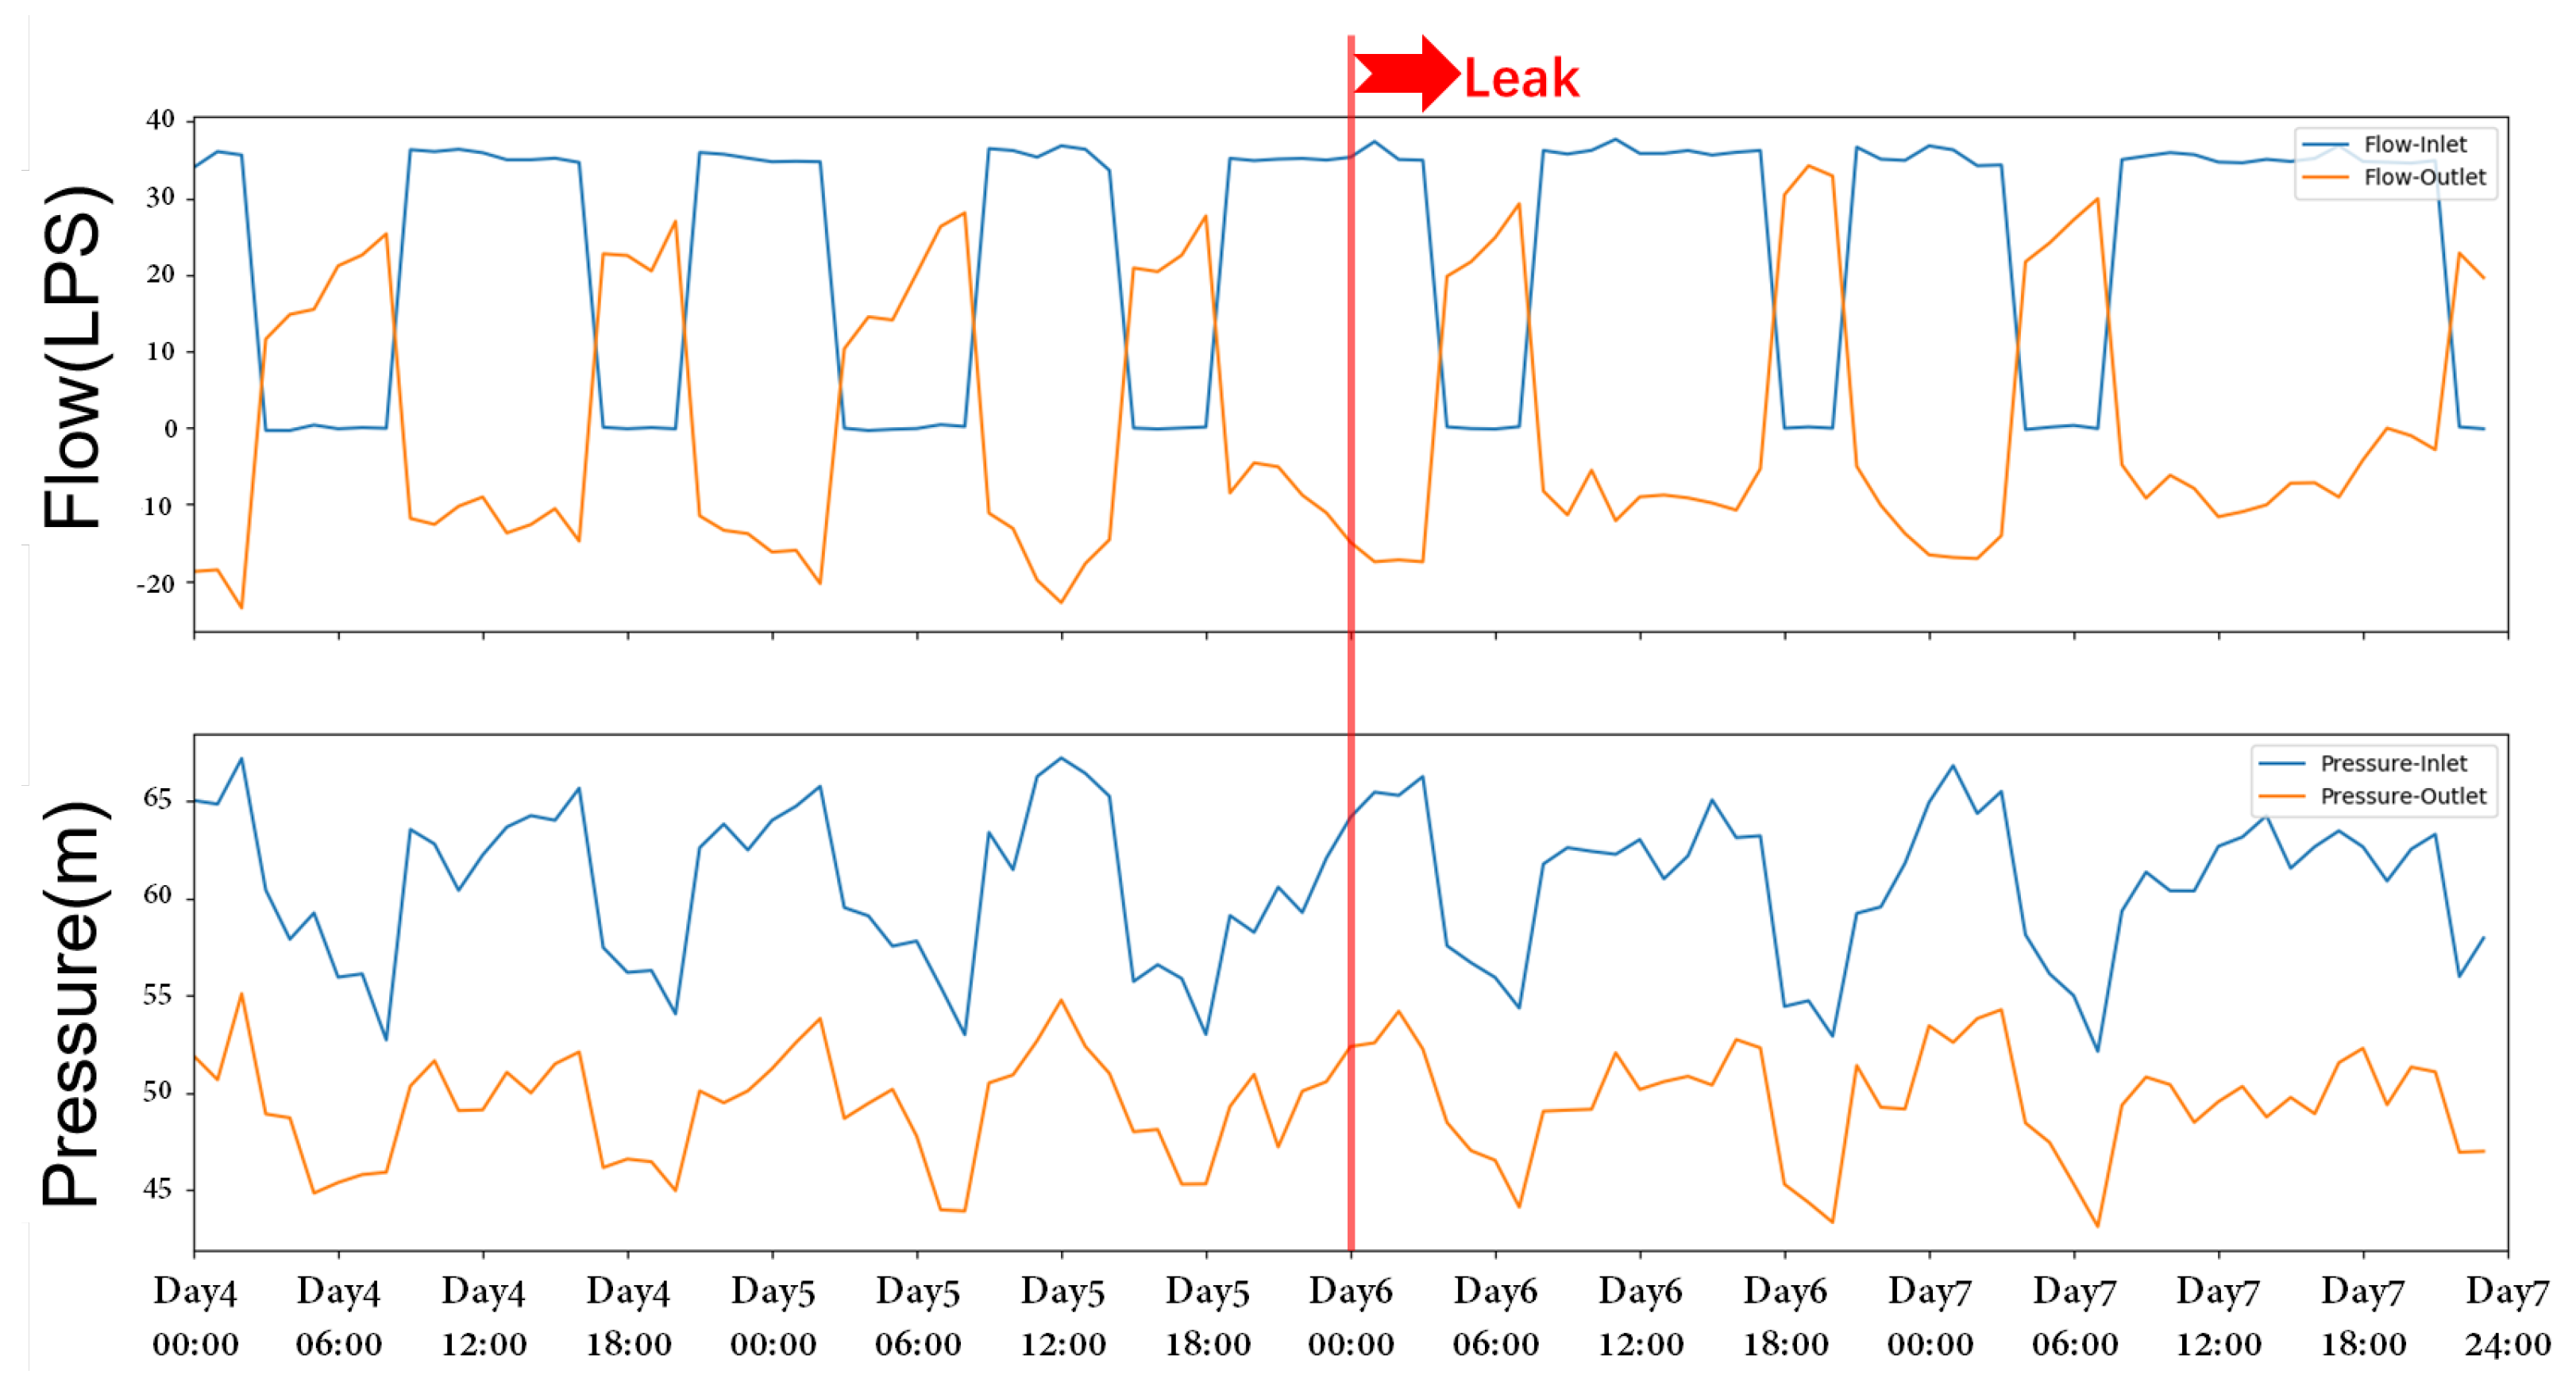
Figure 7. Change curve of hydraulic parameters before and after leakage.
Water 13 00867 g007
Figure 8. Feature point map of the two methods.
Water 13 00867 g008
Figure 9. Recall rates of different district metering areas (DMAs).
Water 13 00867 g009
Figure 10. Weighted average coefficients of pressure sensors under different location of leak.
Water 13 00867 g010
Figure 11. The topology built by experimental platform.
Water 13 00867 g011
Figure 12. Water Demand.
Water 13 00867 g012
Figure 13. Results of parameters estimation at different opening degrees of valve No.1.
Water 13 00867 g013
Figure 14. Coefficients of multiple pressure sensors with leak at different locations.
Water 13 00867 g014
Table 1. Water balance.
System input volumeAuthorized consumptionsMetered consumption
Unmetered consumption
Water lossesApparent losses
Real losses
Table 2. Recall rate of leak detections ( C E M [ 0.2 , 0.6 ) ) .
Detection MethodRecall Rates
WB-Method94.59%
PCA45.83%
Table 3. Recall rate of leak detection in different C E M .
Detection Method C EM [ 0.2 , 0.3 ) C EM [ 0.3 , 0.4 ) C EM [ 0.4 , 0.5 ) C EM [ 0.5 , 0.6 )
WB-Method89.19%94.73%98.95%100%
PCA23.53%33.33%36.84%48.15%
Table 4. Recall rate in different DMAs with different time windows.
Time Window Length468
DMA178.4%83.8%86.5%
DMA285.7%92.9%96.4%
DMA394.6%97.3%97.3%
DMA494.1%97.1%100%
DMA596.4%96.4%100%
Publisher’s Note: MDPI stays neutral with regard to jurisdictional claims in published maps and institutional affiliations.