Article

The “Problem” of New Orleans and Diminishing Sustainability of Mississippi River Management—Future Options

by
John W. Day
1,*,
Rachael Hunter
2,
G. Paul Kemp
1,
Matthew Moerschbaecher
3 and
Christopher G. Brantley
4,†
1
Department of Oceanography and Coastal Sciences, College of the Coast and Environment, Louisiana State University, Baton Rouge, LA 70803, USA
2
Comite Resources, Inc., P.O. Box 66596, Baton Rouge, LA 70896, USA
3
Louisiana Oil Spill Coordinator’s Office, Department of Public Safety and Corrections, Baton Rouge, LA 70806, USA
4
USACE, 7400 Leake Ave, New Orleans, LA 70118, USA
*
Author to whom correspondence should be addressed.
Has retired.
Water 2021, 13(6), 813; https://doi.org/10.3390/w13060813
Submission received: 2 February 2021 / Revised: 3 March 2021 / Accepted: 5 March 2021 / Published: 16 March 2021

Abstract

:
Climate change forcings are having significant impacts in coastal Louisiana today and increasingly affect the future of New Orleans, a deltaic city mostly below sea level, which depends on levee and pumps to protect from a host of water-related threats. Precipitation has increased in the Mississippi River basin generally, increasing runoff, so that in recent years the Mississippi River has been above flood stage for longer periods of time both earlier and later in the year, increasing the likelihood that hurricane surge, traditionally confined to summer and fall, may compound effects of prolonged high water on river levees. The Bonnet Carré Spillway, just upstream of New Orleans has been operated more often and for longer periods of time in recent years than ever before in its nearly 100-year history. Because all rain that falls within the city must be pumped out, residents have been exposed to interior flooding more frequently as high-intensity precipitation events can occur in any season. A sustainable path for New Orleans should involve elevating people and sensitive infrastructure above flood levels, raising some land levels, and creating water storage areas within the city. Management of the lower Mississippi River in the future must include consideration that the river will exceed its design capacity on a regular basis. The river must also be used to restore coastal wetlands through the use of diversions, which will also relieve pressure on levees.

1. Introduction

The Coastal Protection and Restoration Authority (CPRA) of the State of Louisiana, since its inception in 2007, has led the most comprehensive restoration program in progress for any delta globally, at a cost of $0.7B to $1.0B per year [1,2]. This 50-year Coastal Master Plan (CMP) is being conceived, amended and constructed at the same time that massive global change is also taking place [1,2,3]). Deltas are among the coastal systems most threatened by climate change because the stability of the land itself—lying at or close to sea level—is affected by new interactions among stressors that arise in the upstream reaches of watersheds as well as from the coastal ocean [4,5,6,7,8,9,10].
Climate forcings include substantial warming of both oceans and atmosphere, dramatic changes in river discharge to the coastal ocean (increases and decreases), more of the strongest tropical cyclones (Saffir-Simpson Category 3+), as well as more intense precipitation events and prolonged droughts [11]. These changes are already taking place for the Mississippi River, the Mississippi River delta and New Orleans, the pre-eminent North American delta city in ways that will necessarily affect restoration priorities and project sequencing. Other global trends that interact with climate change will exacerbate cumulative impacts and the overall feasibility of restoration, including disruption and destabilization of natural systems, society and the economy, as exemplified by the effects of Hurricane Katrina flooding, and the more recent COVID-19 pandemic [12,13].
Extreme heat with soil drying is affecting tropical and sub-tropical areas of the globe [14,15,16]. Equatorial areas are becoming increasingly unsuited for the ecosystems that today sustain human habitation [17]. Sea level is projected to increase by up to a meter or more by 2100 [18]. The frequency with which Gulf of Mexico hurricanes reach Saffir-Simpson Category (Cat) 4 and 5 is expected to increase [19,20], and hurricanes are projected to grow larger [11,21,22], move slower but intensify more rapidly [23], generate larger peak rainfall rates [24,25] and decay more slowly over land [26].
The Gulf of Mexico is today a semi-tropical sea. It is expected, however, to become fully tropical in this century [27], increasing its role as a heat reservoir in powering extreme weather events. Hurricane Harvey in 2017 reached Cat 4 but stalled off the Texas coast before dropping an unprecedented 1.5 m of rain in 3 days on parts of the City of Houston (Figure 1). Harvey caused $125 billion in flood damage without a major storm surge. This was almost as much as the levee and floodwall breaches caused by Hurricane Katrina’s surge did to New Orleans in 2005. Hurricane Michael, in 2018, was the first storm to strike the Florida panhandle as a Cat 5, intensifying from a tropical storm in 48 h. Hurricane Laura in 2020 hit southwest Louisiana after intensifying rapidly to Cat 4 with the highest maximum wind speeds at landfall of any cyclone to strike Louisiana since 1856.
The 2020 Atlantic hurricane season was unusually long and active, with the first of a record 30 named storms forming in mid-May. This was the sixth consecutive year with a named pre-June cyclone, and almost all, 27 of the 30, set new records for the earliest formation by storm number. The end of the season in October and November also set new records as well, with seven named storms, including four that intensified into major (Cat 3+) hurricanes. Iota, the last storm of the year, reached Cat 5 intensity on November 16 before crashing into Central America.
Ten of the 2020 named Atlantic cyclones, including three major hurricanes, made landfall on the U.S. Gulf Coast, and six of these had New Orleans within the cone of predicted landfall at some point. Fortunately, only one, Hurricane Zeta (Cat 2), actually passed close enough to the city to cause minor damage. If a wet, stalled hurricane like Harvey or a powerful wind storm like Laura were to directly hit New Orleans, damage caused by interior flooding or high winds, respectively, would again be catastrophic even if all post-Katrina surge defenses survived intact, and evacuation was timely and successful.
The occurrence of early, “pre-season” storms raises the potential for hurricane surge to enter the mouth of the Mississippi and drive up river levels that are already at or above flood stage in New Orleans. Hurricanes strike most frequently in August or September when the river is typically low. During Hurricane Katrina (29 August 2005), the mean Mississippi River stage was less than 1.2 m (NAVD88), but the surge added 4 m, pushing river stage briefly close to Flood Stage (Figure 2). When New Orleans is threatened by tropical storms or hurricanes six times in one season, this leads to an almost continuous state of public safety mobilization. Emergency response preparations for navigation channel, levee and floodwall closures, as well as organized evacuations, must begin 72 h in advance of any projected landfall.
Here we apply new projections of global change to the existential “problem” facing New Orleans, namely the sustainability of both the Mississippi River and Tributaries (MR&T), and the Hurricane and Storm Damage Risk Reduction System (HSDRRS) projects through which the U.S. Army Corps of Engineers has managed the Mississippi River since 1927 and New Orleans hurricane surge post Hurricane Katrina and the rebuilding which was largely completed in 2016 [28,29,30]. In this paper, we focus on the potential for simultaneous flooding from the Mississippi River and from the Gulf of Mexico. Over the past century or more, there has been an enormous amount of information generated about these threats to coastal Louisiana and hundreds of billions of dollars expended to counter and deal with them, mostly for flood defenses in the form of river and coastal levees [3,9,30,31,32,33,34,35,36].
Figure 2. Four meter storm surge in the Mississippi River at New Orleans during Hurricane Katrina. Blue diamonds are readings recorded by the Carrollton Gage before failure, and red line is ADCIRC model output from [37].
Water 13 00813 g002

2. The Mississippi River Flood Control System—Past Development and Future Prospects

The Mississippi River and Tributaries (MR&T) project was developed after the catastrophic flood of 1927 to control river flooding and to maintain navigation on the lower Mississippi River from Cairo, Illinois to the mouth of the river (Figure 3). The plan was designed to control the “project flood”, a mythical event conceived in the 1930s as carrying a significantly larger peak flow than during the 1927 flood disaster, then the flood of record. At Cairo, IL, downstream of the entrance of the Ohio River, the project flood is estimated at about 68,850 m3/s (2,360,000 cubic feet per second—cfs). It was estimated at ~85,835 m3s−1 (3,030,000 cfs) at Red River Landing, about 97 km (60 miles) downriver from Natchez, MS, but upstream of the split that carries flow into the Atchafalaya distributary.
The MR&T project shifted the emphasis of river management from “levees only” to “levees and outlets” [38,39], an acknowledgement that eliminating natural distributaries reduced the river’s ability to handle major floods and that levees alone could not offer a permanent fix. The three primary components of the MR&T project are levees for containing flood flows, controlled floodways for the passage of excess flows past critical reaches of the river, dikes and bank hardening to limit meandering and bank slumping while maintaining a fixed low-water navigation channel for ocean going vessels to Baton Rouge for barges upstream from there. A fourth focus was outside the main channel on tributary basin improvements for drainage and flood control (https://www.mvn.usace.army.mil/Missions/Mississippi-River-Flood-Control/Mississippi-River-Tributaries/, accessed on 29 January 2021).
The MR&T authorized levees to contain flood discharge as well as the major floodways that relieve pressure on levees. The Old River Control Structure, which has grown from one to four structures since 1963 is designed to prevent the capture of the Mississippi River by the Atchafalaya River distributary by limiting the rate at which Mississippi River can feed the Atchafalaya. It also prevents backflow from the Red River tributary, ensuring that all Red River discharge goes into the Atchafalaya, which is contained by the levees of the massive Atchafalaya Basin Floodway (Figure 4).
At the latitude of Red River Landing (31° N), when the Mississippi River reaches project flood discharge, the MR&T plan calls for flow to be divided equally, with 42,475 m3s−1 (1,500,000 cfs) continuing down the main river channel and the remainder diverted to the Atchafalaya Basin Floodway via the Old River Control Structures, which take water from the entire depth of the flow, and through overbank structures like the Morganza and West Atchafalaya Floodways. Of the 42,475 m3s−1 (1,500,000 cfs) flowing down the main channel, 7079 m3s−1 (250,000 cfs) can be diverted to Lake Pontchartrain and the Gulf through the Bonnet Carre’ Spillway, another overbank structure, and the remaining 35,397 m3s−1 (1,250,000 cfs) continues downriver to below New Orleans and ultimately to the Gulf of Mexico [40,41].
Because of sea level rise, subsidence and changed river hydraulics, less sand is transported to the river mouth so that the sedimentation depocenter is moving upstream from Head of Passes, and more water is leaving overbank on the east side in the unleveed and ungated Bohemia Spillway. Kemp et al. [40] reported that this favors formation of new, unregulated outlets upstream of Head of Passes and the main Southwest Pass navigation outlet. Such an outlet—now called Mardi Gras Pass—opened through the east bank natural levee in the Bohemia Spillway at the end of the record 2011 flood and now often conveys more than 600 m3s−1 (20,000 cfs) during high water into the marshes and bays just downstream of the end of the federal levee [42]. During the peak of the 2011 flood, only 27% of the 65,000 m3s−1 entering Louisiana reached the Gulf via Head of Passes.
Figure 3. Levees and major floodways for the passage of excess flows past critical reaches of the Mississippi River that are part of the Mississippi River and Tributaries Project flood control system [43].
Water 13 00813 g003
Figure 4. Mississippi River and Tributaries project water diversion plan during a project design flood. Discharge is in 1000 cfs [41].
Water 13 00813 g004
Lower Mississippi River flow and stage data were obtained from the USACE and were reduced to annual maximum, minimum, and mean discharge and elevation for 1901 to 2020. Data were subjected to regression analyses with JMP statistical software. In 1927, peak discharge of the Mississippi River at Vicksburg was 64,000 m3s−1 (2,278,000 cfs), but in 2011 discharge was even higher at 65,000 m3s−1 (2,310,000 cfs). The maximum discharge in 2011 at Natchez, Mississippi, about 120 km south of Vicksburg, was 62,900 m3s−1 (2,220,000 cfs). In general, since the early 1960s stage and discharge of the lower Mississippi River have been increasing over time (Figure 5, Figure 6 and Figure 7). It is especially interesting that the minimum river stage at Natchez and Baton Rouge has increased over time and is the stage most strongly correlated over time (Figure 5 and Figure 7).
These data suggest that sediment deposition is filling in the river above Baton Rouge and reducing conveyance [44]. Wang and Xu [45] analyzed Mississippi River discharge and stage heights at Tarbert Landing (about 10 km downstream from the Old River control complex) and found that for the same flow rate of about 28,300 m3s−1 (1,000,000 cfs), flood heights in 2015 were about 2.2 m higher than in 1988 due to increased sedimentation in the river. In the 2019 flood, the river was above flood stage at Baton Rouge for 211 days. This exceeded the 92-year record of 135 days set in 1927 by 76 days. However, in 2019 the Mississippi River was kept artificially high in New Orleans for an extended period because the Bonnet Carré Spillway was not operated to its fullest capacity to reduce river water input to the Pontchartrain Basin. Diverting additional discharge through the Bonnet Carré Spillway can result in a decline in the hydrograph upstream on the Mississippi River as far as Baton Rouge.
The number of days that the Mississippi River is above flood stage per year has also increased at the Natchez, MS and Baton Rouge, LA gauges (Figure 8 and Figure 9). When 4-year averages are compared for recent years, an increase in average number of days that the Mississippi River was above flood stage of 10.6 m (35 ft) at the Baton Rouge, Louisiana USACE gauge is apparent (Figure 10).
The Morganza Floodway, located at Mississippi River mile 280 Above Head of Passes (AHP) in Louisiana, was built in 1954 and was designed to divert up to about 17,000 m3s−1 (600,000 cfs) of river water into the Atchafalaya Basin Floodway. When Mississippi River flows at Red River Landing are predicted to reach about 42,500 m3s−1 (1,500,000 cfs), the USACE considers opening Morganza. The floodway has only been opened during the major floods of 1973 and 2011, for 56 and 55 days, respectively. The opening of the floodway has serious implications because it can cover the lower Atchafalaya Basin with 3–7 m (10–20 ft) of water and impact 10,000 people and 6000 homes, not including backwater flooding [41]. With larger and more frequent flooding, the need to open the Morganza Floodway may increase in the future.
The Bonnet Carré Spillway is a flood relief outlet situated about 40 km upstream of New Orleans. It was completed in 1936 after the 1927 flood showed the need. Since the first opening in 1937, the spillway has been opened 15 times, and the discharge criteria that must be satisfied to justify an opening have not changed since it was built. Ten of the 15 openings have occurred in the second half of its operational history and five of the openings have been in the four years between 2016 to 2020. The spillway was also opened twice in 2019, something that had never occurred before. The more frequent need for water release through Bonnet Carre’ indicates that large floods are becoming more common, along with a change in the way that the spillway has recently been managed as indicated above. This does result in prolonging high water on the levees.
An important assumption that governs operations of MR&T project is that the river flood season is temporally distinct from that of hurricanes. The annual flood pulse of the Mississippi River generally declines by early June. Although hurricane season officially begins on 1 June, the frequency with which hurricanes come into the Gulf of Mexico, or form there, increases from mid-August to early October [45]. The record-breaking 2019 flood called this thinking into question. After it was opened for the second time that year, the Bonnet Carré Spillway could not be closed until the second week in August while Hurricane Barry made landfall in Louisiana in mid-July. If Barry had sent a large surge up the Mississippi, it could have resulted in some levee overtopping. A Bonnet Carré opening can replace the volume of Lake Pontchartrain by one to four times.
Tao et al. [46] modeled the combined effects of climate change, land use, and river management on discharge of the Mississippi River and projected that peak river discharge may increase by 10–60% during this century. Day et al. [9] plotted the peak discharge at Natchez, MS for the 2011 flood and added 10% to 60% to that discharge. An increase of 60% over the 2011 flood maximum would result in a discharge of 104,000 m3s−1 (3.70 million ft3 s−1), exceeding the maximum conveyance of project flood by about 20% (Figure 11). If increases of this magnitude occur, the MR&T flood control system on the Mississippi River may be overwhelmed [40].
As John Barry notes, “the biggest danger is pressure, constant unrelenting pressure” ([28], p. 191). The Low-Sill Structure is now one of four structures that convey Mississippi River flow into the Atchafalaya Basin Floodway, but it almost failed during the 1973 flood and remains a weak link in the MR&T control system [47,48,49,50].
But prolonged high discharges can threaten earthen levees as well as concrete floodwalls and control structures [51]. Many factors can compromise levees and lead to collapse including cavities due to rotting logs and burrowing animals, soil weakness, sand boils, and piping below the base of the levee. Most of the flaws are not visible until failure is in progress. MR&T levees may fail in the future due to a reduction of the conveyance of the river channel downstream because of sedimentation and increased pressure due to prolonged high water during very large floods [50,51,52,53,54]. The nightmare scenario on the Mississippi River is when stage drops very quickly after a prolonged high water period. This is when the potential for a levee failure is highest because water stranded in the pores of the levee soil cannot drain quickly enough as occurred near Donaldsonville, Louisiana, in 1973 (Figure 12). Given projections for an increase in the peak discharge of the river, even exceeding the Project Flood design criteria, the potential for failure of levees and structures on the lower Mississippi River can be expected to increase [9].

3. Extreme Precipitation Events

Evidence indicates that the intensification of extreme weather events will occur in a warming climate [55,56]. Warmer air holds more moisture, and heavy precipitation events and flooding are expected to increase in intensity with climate change [57,58,59,60,61], and this is certainly the case for the Gulf Coast. Laska [30] provided maps for major precipitation events affecting the Mississippi Delta from 2001 to 2017 (Table 1; Figure 13). This shows how the entire Louisiana coastal zone as well as large non-coastal areas are susceptible to extreme flooding. Several recent examples have occurred in the North-Central Gulf of Mexico. In August 2016, nearly a meter of rain fell in 3 days that led to extensive flooding east of the Mississippi River in the Baton Rouge area with over 10,000 houses flooded. Most of these homes had not been previously identified as vulnerable to flooding on Flood Insurance Rate Maps (FIRM) developed by the U.S. Federal Emergency Management Agency (FEMA). The 2016 storm was associated with a near stationary low-pressure area just offshore in the Gulf. In 2017, Hurricane Harvey stalled over Houston and dumped up to 1.5 m of rain over several days. Such intense storms are occurring with a greater frequency. Because local rivers in Louisiana are low relief coastal plain rivers, the river slope is critical in regulating the quantity and rate at which water can be conveyed from large rain events. Rising sea level will decrease the river slope even further in local tributaries (other than the Mississippi-Atchafalaya system) to the coastal zone and greatly exacerbate flooding of low relief areas.
What then are the options for sustainable management of New Orleans and the MR&T system and how is this related to Mississippi Delta restoration? A fundamental hypothesis of this paper is that neither the New Orleans flood control system (both levees and pumps) nor the MR&T system (levees and structures) are currently managed and operated sustainably for the long-term and that catastrophic failure continues to remain likely unless future climate projections as well as other global change forcings are taken into consideration going forward.

4. A Sustainable New Orleans

New Orleans is a special challenge for sustainable restoration and flood protection in the Mississippi delta. It is the largest metropolitan area in Louisiana and the region is economically important for the state and nation in terms of port activity, tourism, education, and commerce [62,63,64]. The regional economy also includes petrochemicals, oil and gas activity, and commercial and recreational fisheries. Until the late 19th century, New Orleans was still almost completely above sea level, albeit by only a few meters [65]. Over the course of the 20th century, the city spread into adjacent wetlands as they were leveed, large pumps were put in place, and the wetlands were drained. As a consequence, the city expanded from the relatively high natural levees adjacent to the river out to the edge of Lake Pontchartrain as well as up and down river from the original footprint of the city. Unfortunately, this had two unintended and ultimately catastrophic consequences. First, wetlands, especially baldcypress swamps, that served to reduce hurricane surge and waves were lost to urban development. Second, the draining of highly organic wetlands soils exposed them to oxidation and subsidence. Because of this, the city is now up to 5 m below sea level (Figure 14).
Pumping capacity, though extraordinary, is generally less than 3 cm per hour, and is often exceeded causing frequent localized flooding with depths of a meter or more. Since the mid 20th century, catastrophic flooding from hurricanes occurred twice; in 1965 from Hurricane Betsy and in 2005 from Hurricanes Katrina and Rita. As noted above, intensifying climate impacts are increasing the probability of such events in this century. In addition, nuisance flooding has been occurring more frequently inside of the New Orleans levees, including within the central business district.

5. Stormwater Drainage in the New Orleans Metro Area

Most of New Orleans proper (approximately 65%) is at or below mean sea level, as defined by the average elevation of Lake Pontchartrain during the 1983–2001 period, estimated at approximately 0.12 m (0.4 ft) NAVD88 (Figure 14) [66,67]. Unlike natural watersheds that have a downstream outlet, New Orleans consists of several artificial hydrologic areas that are isolated from each other and have no downstream outlet. These are “polders” in the Dutch sense. Rain that falls in New Orleans moves into a storm drain, then into the underground drainage system where it is conveyed to a pumping station. At a typical pumping station, storm water is either pumped from the underground storm sewer network into an outfall canal or pumped from an outfall canal to Lake Pontchartrain. Because the river levees are higher than the lake levees, almost all rainwater is pumped into Lake Pontchartrain, the only exception being a new river pump station in River Ridge, which is close to the River in suburban Jefferson Parish (https://www.wwltv.com/article/news/local/jefferson/new-jp-pump-station-capable-of-removing-9-inches-of-rain-within-24-h/289-540251922, accessed on 7 January 2021). The internal drainage and pumping system is operated by the Sewerage and Water Board of New Orleans (SWBNO) while the perimeter levees, floodwalls and lakeside pumping stations are operated by the east bank New Orleans Flood Authority [68].
Twenty-four drainage pumping stations, collectively housing 120 drainage and constant-duty pumps are required to evacuate stormwater from New Orleans. While drainage pumps are activated to remove rainwater and to prevent flooding, constant-duty pumps work to regulate the amount of water in New Orleans drainage canals on any given day. The SWBNO’s drainage network includes approximately 150 km (90 miles) of open canals and 150 km of subsurface canals (Figure 15). Many of the subsurface canals are large enough to drive a bus through. Since Hurricane Katrina, closure gates have been added to the outfall canals to keep water from surging into the interior drainage system from Lakes Pontchartrain or Borgne during hurricanes [67].
Because almost all rain that falls on the city of New Orleans must be pumped out, the volume of runoff can be approximated by the volume of water pumped, analogous to using the event runoff portion of a hydrograph in a typical stream. The City of New Orleans can be broken up into five main areas that need to be pumped during rainfall that are separated by the Mississippi River, the Inner Harbor Navigation Canal (IHNC), and the Intracoastal Waterway (ICWW). This creates five main polders, or artificial watersheds, within the city, which are independent and labeled as Main, East, Lower 9th, Algiers, and English Turn (Figure 16), respectively [67].
The SWBNO has stated that the drainage capacity is 2.54 cm (1.0 in) in the first hour of an event, followed by 1.27 cm (0.5 in) for each additional hour of rainfall [68]. However, if rain is falling faster than 2.54 cm per hour, the pumps will not be able to remove the water and flooding will occur. As an example, if 25.4 cm (10 in) of rain falls in a five-hour period and then the rain stops, 7.62 cm (3 in) would be pumped out during the 5 h and 17.78 cm (7 in) would be left. It would take the system about 14 h at 1.27 cm (0.5 in) per hour to remove that water, assuming that no more rain falls during that 14-h period. In addition, several analyses have shown that the above estimate by the SWBNO is an ideal maximum that is rarely achieved due to several factors, including:
  • How many pumps are running (an estimated 10 to 15 pumps are down for maintenance at any one time);
  • How well the pumps are running (Veolia [69] and ABS Group [70] concluded that, of a subsample of pumps tested, there was an average of 30% diminished pumping capacity);
  • Location—(e.g., how far the area is from a pump, drain times vary by street);
  • Amount and rate of rainfall;
  • Amount of impervious surfaces (affects runoff vs infiltration)
  • Frequency of storms;
  • and Soil saturation.
For example, drainage times for a rainfall event in Gentilly of 13.5 cm (5.3 in) were recorded for different areas. The SWBNO predicted that it would take 11 h to drain all of the water. On one street in Gentilly it took 8 h to drain, on another it took 10.5 h, and on another it took 23 h [71]. By comparison, over 1.5 m (about 60 in) of rain fell in the Houston area in about three days during Hurricane Harvey. A similar amount of rainfall in New Orleans clearly would lead to catastrophic flooding.
The SWBNO web site states that “The system’s pumping capacity is over 29 billion gallons a day, enough to empty a lake 10 square miles by 13.5 feet deep every 24 h. That flow rate (over 45,000 cubic feet per second) is more than the flow rate of the Ohio River, the nation’s fifth largest river.” However, Lincoln and Schlotzhauer [72] assessed the City’s pumping capacity and calculated hypothetical minimum, nominal, and maximum pumping rates for the New Orleans drainage network at approximately 368 m3s−1 (12,990 cfs), 561 m3s−1 (19,810 cfs), and 663 m3s−1 (23,410 cfs), respectively. The equivalent uniform rates for the minimum, nominal, and maximum pumping rates were 1.27 cm h−1 (0.50 in h−1), 1.93 cm h−1 (0.76 in h−1), and 2.29 cm h−1 (0.90 in h−1), respectively. Rainfall rates and pumping rates estimated during Hurricane Isaac (2008) were measured for the Main polder of New Orleans (Figure 17).
Because of the issues just discussed, New Orleans is one of the most threatened urban areas in the United States. As noted, Katrina led to catastrophic flooding and loss of life due to levee breaches, and the region still has not fully recovered [3,73,74]. After the 2005 hurricanes, many expected that the region would undergo fundamental changes to make the metropolitan area more resilient to hurricane flooding. But most residential and commercial buildings were repaired in place and strong resistance to elevating structures beyond that required to obtain flood insurance through the NFIP resulted in very few flooded structures being raised to levels at or above Hurricane Katrina flood levels [75]. As has been discussed, more than half the metropolitan area is below sea level and climate change is projected to intensify the threat of flooding from different events, sources and directions (accelerated sea-level rise, more frequent stronger hurricanes, higher peak river discharge, and more extreme weather events like the August 2016 flooding and Hurricane Harvey’s impact on Houston). The maintenance of levees and pumped drainage is costly and will likely become increasingly untenable. If the traditional approach to flood protection remains more or less the same, it is plausible and even likely that New Orleans may flood again catastrophically before 2100. Thus, there is a need for new approaches to integrate resilience into the metropolitan area’s long-term sustainability planning. We believe that it is critically important that most residents and infrastructure intolerant of flooding should not remain below sea level.
Erdman et al. [35] proposed a bold new vision to make New Orleans truly resilient and sustainable in the 21st century and beyond. Their vision is to provide additional protection at the lake front and to raise all living areas, ideally to at least 5 m above sea level. They argued that New Orleans provides a case study for all of south Louisiana, as well as coastal cities around the world, especially port cities with areas below sea level, that are increasingly threatened by sea-level rise and strong storms as to how settlement can continue in such a precarious location. They presented a design proposal for elevating parts the city of New Orleans as an adaptive course of action. Their two-part strategy begins by reinforcing the lake edge along Lake Pontchartrain using infill to extend the higher, buildable ground by about an additional 65 km2. This higher ground would be fronted by a cypress swamp and urban edge. The second part of the strategy aims to build a series of leveed polders that they call “marais” based on the French term for “marsh”. These polders could then be developed by filling with river sediment, raising structures inside the polder, or managing them for aquatic and wetland systems that could also serve as flood water detention reservoirs. Erdman et al. [35] estimated that the cost to build the basic infrastructure was about $200 to $400 million dollars per 2.59 km2 (1 mi2). Thus, 25.9 km2 (10 mi2) would cost from 2 to 4 billion dollars and 54.8 km2 (25 mi2) would cost between 5 and 7.5 billion dollars. The design proposal further develops edge and fill tactics to complete elevation of the city, in whole or part. Erdman et al. [36] reviewed different strategies for raising structures and making them more resilient, and Colten and Day [75] reviewed historical examples where urban land has been raised to avoid flooding threats or to enhance sewage removal.

6. Future Management of the Lower Mississippi River Flood Control and Navigation System

Future management of the lower Mississippi River must include consideration that climate change and other forcings will likely lead to discharge levels that by the end of the century regularly exceed the design capacity of the MR&T project—the project flood. How can the river convey larger floods while at the same time maintaining flood protection? The combination of outlets that would both reduce stage levels in the river and lead to large-scale wetland restoration are an option to accomplish both flood protection and wetland restoration at the same time. This would lead to considerable freshening of estuarine waters in the southeast part of the state east of the Mississippi River. Fisher communities in this area are strongly opposed to more freshwater because of the way it pushes the fish they seek away from where they were previously. Thus, there is a strong conflict between flood protection for the New Orleans metropolitan area and maintaining fisheries east of the river. This is an example of the kind of contentious issues that will become more common in deltaic restoration planning.
Engineered sediment diversions, which divert sediment and nutrient-rich freshwater from the Mississippi River to adjacent wetlands, have been identified as critical tools needed to restore the Mississippi River delta plain [1,7,29,32,76,77,78,79,80,81]. Large river diversions are very expensive, costing on the order of a billion dollars [1]. However, after construction diversions have minimal recurring costs [29]. One problem is that the immediate outfall area may tend to fill in, as is the case for the Bonnet Carreé Spillway [82]. One option is to build a conveyance channel like the Wax Lake Outlet that is self-scouring. Diversion structures will likely last for more than a century. For example, the Bonnet Carreé Spillway structure will be 100 years old in 10 years and will likely last many more decades [29,82].
Under natural conditions, river input to the delta plain was dramatically greater than now. Large crevasses occurred every few years with flows that reached upwards of 10,000 m3s−1 and discharged tens of millions of tons of sediment each year [29,82,83,84,85]. Crevasses built up the natural levee and formed large crevasse splays in adjacent wetlands. Some distributaries functioned year-round but most were active seasonally [86]. Sustainable restoration, especially with climate change, will require much greater river input than is currently envisioned and should seek to mimic the past functioning of the river. Rutherford et al. [87,88] showed that a very large diversion (~7000 m3s−1) into the Maurepas Swamp on the east side of the river between Baton Rouge and New Orleans would build and maintain much more land than currently proposed diversions for this area.
Although the first large diversions will be constructed below New Orleans and discharge to the Barataria and Breton Sound basins [1], sediment introduction and retention decreases the closer a diversion is to the river mouth. Diversions into open waters have sediment retention efficiencies of 5–30% e.g., [31,89]. Esposito et al. [81] reported that diversions into settings that are still vegetated have sediment retention efficiencies greater than 75%. If diversions are located in the more inland parts of the delta, sediment retention will increase because of shallower water and the high trapping efficiency of forested wetlands. A large diversion into the Maurepas Swamp would yield several benefits. It would sustain this deteriorating 57,000-ha swamp that provides a variety of ecosystem goods and services, especially hurricane protection, for the critical New Orleans to Baton Rouge corridor [87,88,90,91]. It could also serve as an alternative flood outlet to the Bonnet Carreé Spillway that is filling in [82]. However, as mentioned above, higher freshwater input threatens fisheries and fisher communities.
An intriguing idea is that a large Maurepas diversion may relieve pressure on the Old River control structure and decrease the potential that a larger portion of Mississippi River flow will be captured by the Atchafalaya River. The Maurepas Swamp is approximately the same distance from the Old River complex as the mouth of the Atchafalaya so that the distance advantage of the Atchafalaya would be reduced and make stream capture less likely. Nienhuis et al. [92] used Delft3D modeling to investigate the influence of vegetation and soil compaction on the evolution of a natural levee breach and showed that crevasse splays tend to heal because aggradation reduces the water slope. A way around this is to create a bifurcation at the point of the Maurepas diversion like the lower Atchafalaya and Wax Lake Outlet. This would maintain open the lower Mississippi channel past New Orleans. Control at that point could deliver sediment to the lower river below New Orleans. The Birdsfoot delta would be abandoned with a new sub-delta between New Orleans and the Birdsfoot delta at Head of Passes. The Maurepas lobe would then build out into Lake Maurepas and then into Lake Pontchartrain to enhance wetlands to help protect New Orleans.

7. The Potential to Increase Basin Sediment Input

Coastal restoration will be much more difficult unless sediment input from the basin is increased. There is a need to remobilize sediments trapped behind dams and move them to the delta, especially fine sediments. Sand transport to the delta remains sufficient to build wetlands in shallow, sheltered coastal bays fed by engineered diversions. Allison et al. [44] reported that much of the sand fraction of the river was sequestered in overbank storage and channel bed aggradation inside the flood control levees. Nittrouer and Viparelli [93] concluded that sand supply to the head of the Mississippi delta was unlikely to decrease for centuries. But suspended mud (silt and clay) flux to the coast has dropped from a mean of 390 Mt y−1 in the early 1950s, to about 100 Mt y−1 since 1970 [94]. Unlike sand that is deposited near where it leaves the river, fine-grained sediments can be transported deeper into receiving estuarine basins and play a critical role in sustaining existing wetlands.
Practically all of this now-absent mud once flowed from the Missouri River basin prior to the construction of nearly 100 dams in the Missouri basin. About 100 Mt yr−1 is currently trapped by the large main-stem Upper Missouri River dams completed by 1953. The remaining 200 Mt yr−1 is trapped in impoundments built on tributaries to the Lower Missouri in the 1950s and 1960s. In contrast to the large dams on the upper Missouri, sediment bypassing on the lower river impoundments is part of river management. Sediment flux during the post-dam high discharge years of 1973, 1993, and 2011 approached pre-dam levels when tributaries to the Lower Missouri contributed more water and sediment than did the Upper Missouri. These lower Missouri river tributaries drain a vast, arid part of the Great Plains, while those entering from the east bank traverse the lowlands of the Mississippi floodplain. Both provinces are dominated by highly erodible loess soils. Reducing the continued decline in Mississippi River fine-grained sediment flux is very important now that river diversions are being built for coastal wetland restoration in the deltaic plain. Kemp et al. [10] concluded that tributary dam bypassing in the Lower Missouri basin could increase mud supply to the Mississippi River delta by 100–200 Mt yr−1 within 1–2 decades. Such measures to restore the Mississippi delta are compatible with objectives of the Missouri River Restoration and Platte River Recovery Programs to restore riparian habitat for endangered species [10].

8. Planning for Global Change

There is a pressing need to carry out planning for coastal restoration and protection to a much greater extent within a comprehensive plan that takes into consideration 21st century global change megatrends including climate chaos, energy scarcity, ecosystem degradation, economic constraints, and local cultural preferences. There is a need to recognize the value of ecosystem services and their role in the future ecological, economic, and social health of the state and city and how these goods and services can be sustained. It is also necessary to agree on what is possible, what is not, and what is absolutely critical to have a sustainable system in the Mississippi delta. It is certain that the delta will shrink considerably [95,96], that there will be significant population shifts accompanying managed retreat, and that the river will have to be used to the maximum extent possible for restoration. As this century progresses, much of what is being planned for coastal protection and restoration will become more expensive, perhaps prohibitively so [97,98]. Society will have to adapt to a much more dynamic river and delta system that cannot be controlled as it has been for the last century. The energies of nature must play a much more important role in delta management. This is ecological engineering on a grand scale that must operate in synchronization with complex social processes. This will mean living in a much more open system, accepting natural and social limitations, and utilizing the resources of the river more fully.
From a conceptual perspective, Colten and Day [75] argued that the resilience and sustainability of natural and human systems in the Mississippi Delta are decreasing because human activities have moved the system beyond adaptability due to shifting baselines. In other words, the environmental functioning of the delta has been so altered that it threatens both the natural system and human communities. The functioning and sustainability of deltas depend on regular and episodic, external and internal, inputs of energy and materials that produce benefits over different spatial and temporal scales [7,32,99,100,101]. These scales range from daily tides to development of new delta lobes. Infrequent events such as channel switching, crevasses, large river floods, and strong storms largely control sediment delivery and impact geomorphology. For example, two large floods of the Rhone River that broke dikes formed large depositional splays in the delta [102]. More frequent events maintain salinity gradients and regulate biogeochemical processes. Proposed management outlined in this paper involves using episodic forcings (e.g., large river floods and sediment delivery) as well as rebuilding the elevation capital that is so important for natural and human systems in the delta.
The findings for the Mississippi delta have broader implications for delta restoration. For example, there are a number of deltas globally that have significant areas below sea level (Rhine, Yangtze, Ganges, Po, Sacramento, Yangtze, and Vistula with areas of the Ebro, Rhone, and Nile deltas trending towards below sea level) [7,8]. Land elevation in a number of areas has been raised above flood levels using a combination of raising the level of the land and raising structures [75]. In addition, extreme precipitation events and increased flooding is becoming more common globally [58,59,60] and lessons from the Mississippi on how to deal with increasing high river discharge and utilize and use freshwater and sediment resources to enhance sustainability and resilience will be useful for other coastal areas.

Author Contributions

J.W.D. developed the idea for this review and all authors contributed to the writing and development of this paper. All authors have read and agreed to the published version of the manuscript.

Funding

This research received no external funding.

Institutional Review Board Statement

Not applicable.

Informed Consent Statement

Not applicable.

Data Availability Statement

Not applicable.

Conflicts of Interest

The authors declare no conflict of interest.

References

  1. Coastal Protection and Restoration Authority of Louisiana (CPRA). Louisiana’s Comprehensive Master Plan for a Sustainable Coast; CPRA: Baton Rouge, LA, USA, 2017. Available online: https://coastal.la.gov/our-plan/2017-coastal-master-plan/ (accessed on 20 January 2021).
  2. Wiegman, A.; Rutherford, J.; Day, J. The costs and sustainability of ongoing efforts to restore and protect Louisiana’s coast. In Mississippi Delta Restoration; Day, J., Erdman, J., Eds.; Springer: New York, NY, USA, 2018; pp. 93–111. [Google Scholar]
  3. Day, J.; Rybczyk, J. Global change Impacts on the future of coastal systems: Perverse interactions among climate change, ecosystem degradation, energy scarcity and population. In Coasts and Estuaries-The Future; Wolanski, E., Day, J., Elliott, M., Ramach-andran, R., Eds.; Elsevier: Amsterdam, The Netherlands, 2019; pp. 635–654. [Google Scholar]
  4. Syvitski, J.P.M.; Kettner, A.J.; Overeem, I.; Hutton, E.W.H.; Hannon, M.T.; Brakenridge, G.R.; Day, J.; Vorosmarty, C.; Saito, Y.; Giosan, L.; et al. Sinking deltas due to human activities. Nat. Geosci. 2009, 2, 681–686. [Google Scholar] [CrossRef]
  5. Renaud, F.G.; Syvitski, J.P.M.; Sebesvari, Z.; Werners, S.E.; Kremer, H.; Kuenzer, C.; Ramesh, R.; Jeuken, A.; Friedrich, J. Tipping from the Holocene to the anthropocene: How threatened are major world deltas? Curr. Opin. Env. Sustain. 2013, 5, 644–654. [Google Scholar] [CrossRef] [Green Version]
  6. Giosan, L.; Syvitski, J.; Constantinescu, S.; Day, J. Protect the world’s deltas. Nature 2014, 516, 31–33. [Google Scholar] [CrossRef] [Green Version]
  7. Day, J.; Agboola, J.; Chen, Z.; D’Elia, C.; Forbes, D.; Giosan, L.; Kemp, P.; Kuenzer, C.; Lane, R.; Ramachandran, R.; et al. Approaches to defining deltaic sustainability in the 21st century. Estuar. Coast. Shelf Sci. 2016, 183, 275–291. [Google Scholar] [CrossRef]
  8. Day, J.; Ramachandran, R.; Giosan, L.; Kemp, P. Delta winners and losers in the Anthropocene. In Coasts and Estuaries-The Future; Wolanski, E., Day, J., Elliott, M., Ramachandran, R., Eds.; Elsevier: Amsterdam, The Netherlands, 2019; pp. 149–163. [Google Scholar]
  9. Day, J.; Colten, C.; Kemp, P. Mississippi delta restoration and protection: Shifting baselines, diminishing resilience, and growing non-sustainability. In Coasts and Estuaries-The Future; Wolanski, E., Day, J., Elliott, M., Ramachandran, R., Eds.; Elsevier: Amsterdam, The Netherlands, 2019; pp. 173–192. [Google Scholar]
  10. Kemp, G.P.; Day, J.W.; Rogers, J.D.; Giosan, L.; Peyronnin, N. Enhancing mud supply from the Lower Missouri River to the Mississippi River Delta USA: Dam bypassing and coastal restoration. Estuar. Coast. Shelf Sci. 2016, 183, 304–313. [Google Scholar] [CrossRef]
  11. Knutson, T.R.; Sirutis, J.J.; Zhao, M.; Tuleya, R.E.; Bender, M.; Vecchi, G.A.; Villarini, G.; Chavas, D. Global projections of intense tropical cyclone activity for the late twenty-first century from dynamical downscaling of CMIP5/RCP4.5 scenarios. J. Clim. 2015, 28, 7203–7224. [Google Scholar] [CrossRef] [Green Version]
  12. Brown, J.H.; Burger, J.R.; Burnside, W.R.; Chang, M.; Davidson, A.D.; Fristoe, T.S.; Hamilton, M.J.; Hammond, S.T.; Kodric-Brown, A.; Mercado-Silva, N. Macroecology meets macroeconomics: Resource scarcity and global sustainability. Ecol. Eng. 2014, 65, 24–32. [Google Scholar] [CrossRef] [Green Version]
  13. Day, J.; D’Elia, C.; Wiegman, A.; Rutherford, J.; Hall, C.; Lane, R.; Dismukes, D. The energy pillars of society: Perverse interactions of human resource use, the economy, and environmental degradation. Biophys. Econ. Resour. Qual. 2018, 3, 1–16. [Google Scholar] [CrossRef]
  14. Stott, P.A. Attribution of regional-scale temperature changes to anthropogenic and natural causes. Geophys. Res. Lett. 2003, 30. [Google Scholar] [CrossRef]
  15. Zhang, X.; Yan, X. Spatiotemporal change in geographical distribution of global climate types in the context of climate warming. Clim. Dyn. 2014, 43, 595–605. [Google Scholar] [CrossRef]
  16. Zhang, P.; Jeong, J.; Yoon, J.; Kim, H.; Wang, S.; Linderholm, H.; Fang, F.; Wu, X.; Chen, D. Abrupt shift to hotter and drier climates over inner East Asia beyond the tipping point. Science 2020, 370, 1095–1099. [Google Scholar] [CrossRef] [PubMed]
  17. Xu, C.; Kohler, T.; Lenton, T.; Svenning, J.; Scheffer, M. Future of the human climate niche. Proc. Natl. Acad. Sci. USA 2020, 117, 11350–11355. [Google Scholar] [CrossRef] [PubMed]
  18. DeConto, R.M.; Pollard, D. Contributions of Antarctica to past and future sea-level rise. Nature 2016, 531, 591–597. [Google Scholar] [CrossRef] [PubMed]
  19. Bender, M.A.; Knutson, T.R.; Tuleya, R.E.; Sirutis, J.J.; Vecchi, G.A.; Garner, S.T.; Held, I.M. Modeled impact of anthropogenic warming on the frequency of intense Atlantic hurricanes. Science 2010, 327, 454–458. [Google Scholar] [CrossRef] [Green Version]
  20. Done, J.M.; Holland, G.J.; Bruyere, C.L.; Leung, L.R.; Suzuki-Parker, A. Modeling high-impact weather and climate: Lessons from a tropical cyclone perspective. Clim. Chang. 2012, 129, 381–395. [Google Scholar] [CrossRef] [Green Version]
  21. Yamada, Y.; Satoh, M.; Sugi, M.; Kodama, C.; Noda, A.T.; Nakano, M.; Nasuno, T. Response of tropical cyclone activity and structure to global warming in a high-resolution global nonhydrostatic model. J. Clim. 2017, 30, 9703–9724. [Google Scholar] [CrossRef]
  22. Kim, H.S.; Vecchi, G.A.; Knutson, T.R.; Anderson, W.G.; Delworth, T.L.; Rosati, A.; Zeng, F.; Zhao, M. Tropical cyclone simulation and response to CO2 doubling in the GFDL CM2.5 high-resolution coupled climate model. J. Clim. 2014, 27, 8034–8054. [Google Scholar] [CrossRef]
  23. Kossin, J.P. A global slowdown of tropical cyclone translation speed. Nature 2018, 558, 104–107. [Google Scholar] [CrossRef]
  24. Christensen, J.H.; Kumar, K.K.; Aldrian, E.; An, S.I.; Cavalcanti, I.F.A.; de Castro, M.; Dong, W.; Goswami, P.; Hall, A.; Kanyanga, J.K.; et al. Climate Phenomena and their Relevance for Future Regional Climate Change. In Climate Change 2013: The Physical Science Basis. Contribution of Working Group I to the Fifth Assessment Report of the Intergovernmental Panel on Climate Change; Stocker, T.F., Qin, D., Plattner, G.K., Tignor, M., Allen, S.K., Boschung, J., Nauels, A., Xia, Y., Bex, V., Midgley, P.M., Eds.; Cambridge University Press: Cambridge, UK; New York, NY, USA, 2013. [Google Scholar]
  25. Van Oldenborgh, G.J.; van der Wiel, K.; Sebastian, A.; Singh, R.K.; Arrighi, J.; Otto, F.E.L.; Haustein, K.; Li, S.; Vecchi, G.A.; Cullen, H. Attribution of extreme rainfall from Hurricane Harvey, August 2017. Environ. Res. Lett. 2017, 12, 124009. [Google Scholar] [CrossRef]
  26. Li, L.; Charkraborty, P. Slower decay of landfalling hurricanes in a warming world. Nature 2020, 587, 230–234. [Google Scholar] [CrossRef]
  27. Yanez-Arancibia, A.; Day, J. Environmental sub-regions in the Gulf of Mexico coastal zone: The ecosystem approach as an integrated management tool. Ocean Coast. Manag. 2004, 47, 727–757. [Google Scholar] [CrossRef]
  28. Barry, J. Rising Tide: The Great Mississippi River Flood of 1927 and How It Changed America; Simon Schuster: New York, NY, USA, 1997. [Google Scholar]
  29. Day, J.; Lane, R.; D’Elia, C.; Wiegman, A.; Rutherford, J.; Shaffer, G.; Brantley, C.; Kemp, P. Large infrequently operated river diversions for Mississippi delta restoration. Estuar. Coast. Shelf Sci. 2016, 183, 292–303. [Google Scholar] [CrossRef]
  30. Laska, S. Louisiana’s Response to Extreme Weather: A Coastal State’s Adaptation Challenges and Successes; Springer Nature: Cham, Switzerland, 2020. [Google Scholar]
  31. Blum, M.D.; Roberts, H.H. Drowning of the Mississippi Delta due to insufficient sediment supply and global sea-level rise. Nat. Geosci. 2009, 2, 488–491. [Google Scholar] [CrossRef]
  32. Day, J.; Boesch, D.; Clairain, E.; Kemp, P.; Laska, S.; Mitsch, W.; Orth, K.; Mashriqui, H.; Reed, D.; Shabman, L.; et al. Restoration of the Mississippi Delta: Lessons from Hurricanes Katrina and Rita. Science 2007, 315, 1679–1684. [Google Scholar] [CrossRef] [Green Version]
  33. Day, J.; Cable, J.; Lane, R.; Kemp, P. Sediment deposition at the Caernarvon crevasse during the great Mississippi flood of 1927: Implications for coastal restoration. Water 2016, 8, 38. [Google Scholar] [CrossRef] [Green Version]
  34. Day, J.; Erdman, J. Mississippi Delta Restoration–Pathways to a Sustainable Future; Springer: New York, NY, USA, 2018; p. 261. [Google Scholar]
  35. Erdman, J.A.; James, C.W.; Croakley, G.P.; Williams, E.A. Raising New Orleans: The Marais Design Strategy. In Mississippi Delta Restoration; Day, J., Erdman, J., Eds.; Springer: New York, NY, USA, 2018; pp. 171–200. [Google Scholar]
  36. Erdman, J.A.; Williams, E.A.; James, C.W.; Croakley, G.P. Raising buildings: The resilience of elevated structures. In Mississippi Delta Restoration; Day, J., Erdman, J., Eds.; Springer: New York, NY, USA, 2018; pp. 143–170. [Google Scholar]
  37. Westerink, J. SWAN+ADCIRC Storm Surge and Wave Simulations for Hurricane Katrina within Metropolitan New Orleans and St. Bernard Polder; Expert Report Submitted to U.S. Department of Justice re St. Bernard Parish v. United States, No. 05-1119 (Fed. CI.); p. 156. Available online: http://www.biloximarshlandscorp.com//wp-content/uploads/2017/05/Westerink-2013.pdf (accessed on 24 June 2020).
  38. Reuss, M. Designing the Bayous; The Control of Water in the Atchafalaya Basin; U.S. Government Printing Office: Washington, DC, USA, 1998.
  39. Camillo, C.A.; Pearcy, M.T. Upon Their Shoulders; Mississippi River Commission: Vicksburg, MS, USA, 2004.
  40. Kemp, G.P.; Willson, C.S.; Rogers, J.D.; Westphal, K.A.; Binselam, S.A. Adapting to change in the lowermost Mississippi River: Implications for navigation, flood control and restoration of the delta ecosystem. In Perspectives on the Restoration of the Mississippi Delta; Day, J.W., Kemp, G.P., Freeman, A.M., Muth, D.P., Eds.; Springer Science: Dordrecht, The Netherlands, 2014; pp. 51–84. [Google Scholar]
  41. Camillo, C.A. Divine Providence: The 2011 Flood in the Mississippi River and Tributaries Project; Mississippi River Commission: Vicksburg, MS, USA, 2012; p. 330.
  42. Lopez, J.A.; Baker, A.; Boyd, E.; Henkel, T.; Moshogianis, A.; Hillman, E. Status of Mardi Gras Pass, the Sundown/Eland Permit Application and Alternative Solutions. Presentation to Governor’s Coastal Advisory Commission, 26 February 2013, New Orleans. Available online: http://www.saveourlake.org/PDF-documents/our-coast/Mardi%20Gras%20Pass/Gov-Adv-Comm-Feb2013-Final.pdf (accessed on 26 February 2014).
  43. Kondolf, G.M.; Lopez-Llompart, P. National-local land-use conflicts in floodways of the Mississippi Rier system. Aims Environ. Sci. 2019, 5, 47–63. [Google Scholar] [CrossRef]
  44. Allison, M.A.; Demas, C.R.; Ebersole, B.A.; Kleiss, B.A.; Little, C.D.; Meselhe, E.A.; Powell, N.J.; Pratt, T.C.; Vosburg, B.M. A water and sediment budget for the lower Mississippi-Atchafalaya River in flood years 2008–2010: Implications for sediment discharge to the oceans and coastal restoration in Louisiana. J. Hydrol. 2012, 432, 84–97. [Google Scholar] [CrossRef]
  45. Wang, B.; Xu, J. Long-term geomorphic response to flow regulation in a 10-km reach downstream of the Mississippi-Atchafalaya diversion. J. Hydrol. 2016, 8, 10–25. [Google Scholar] [CrossRef] [Green Version]
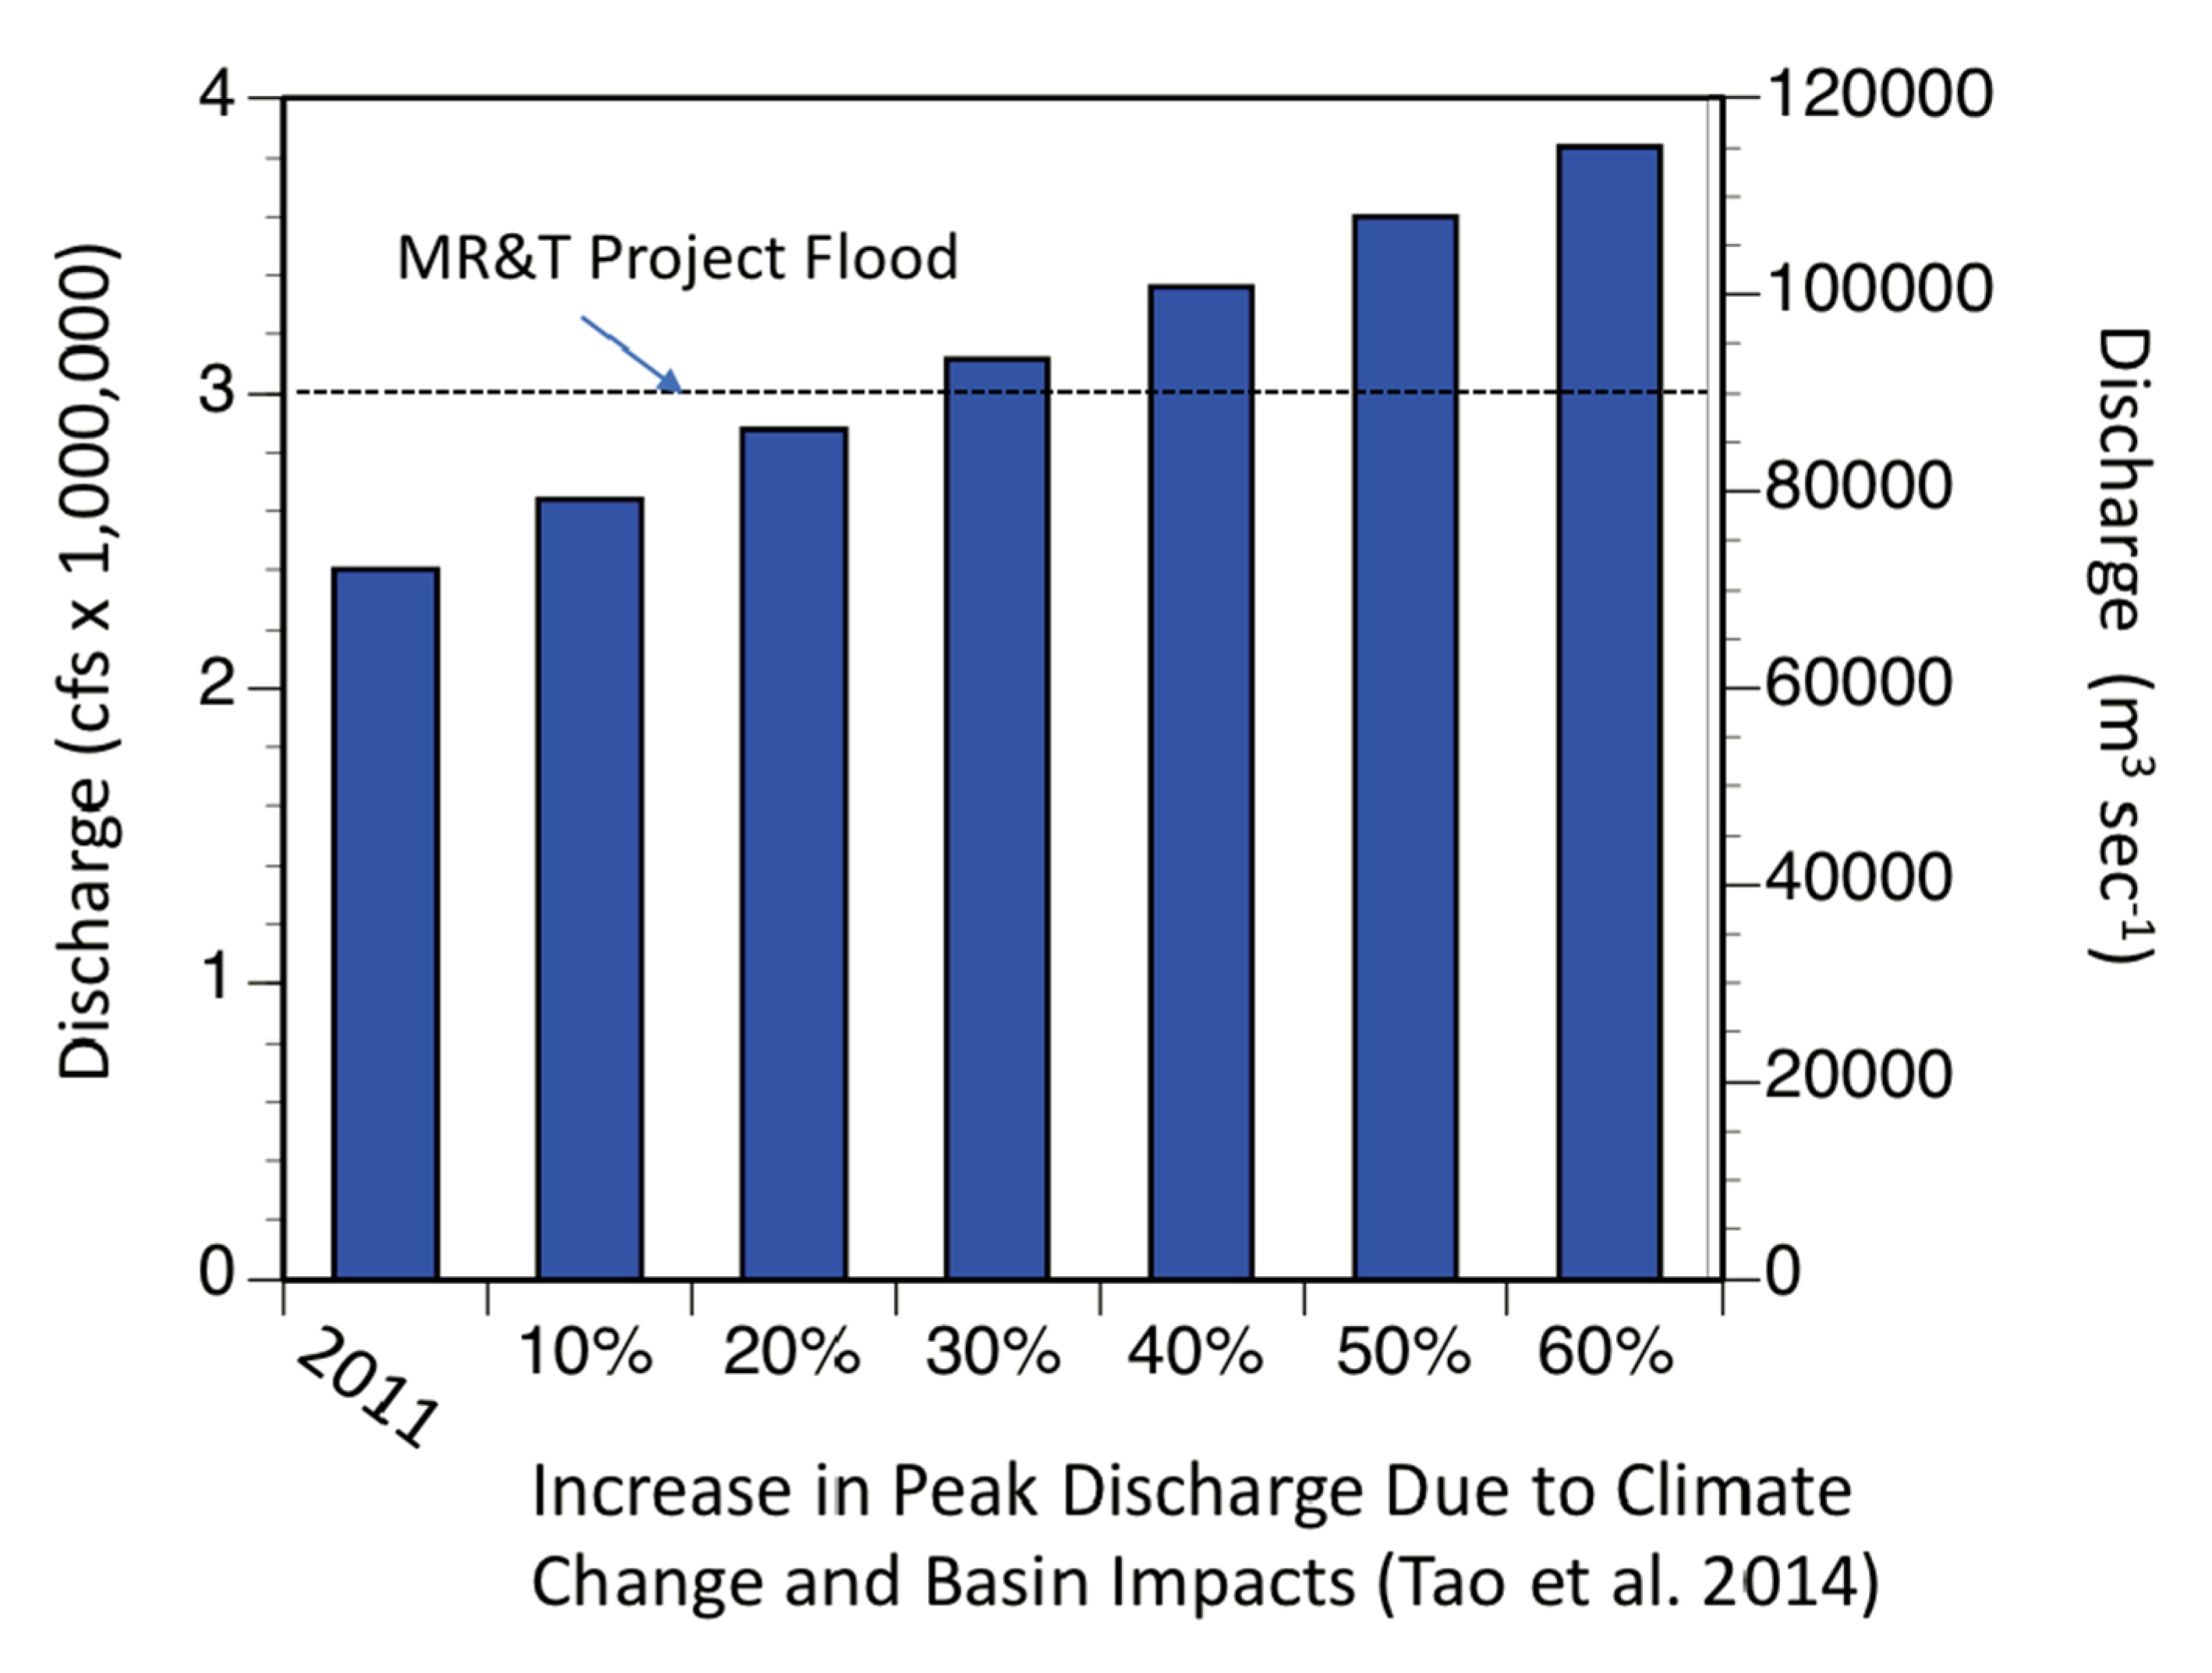
  46. Tao, B.; Tian, H.; Ren, W.; Yang, J.; Yang, Q.; He, R.; Cai, W.; Lohrenz, S. Increasing Mississippi River discharge throughout the 21st century influenced by changes in climate, land use, and atmospheric CO2. Geophys. Res. Lett. 2014, 41, 4978–4986. [Google Scholar] [CrossRef]
  47. Belt, C. The 1973 flood and man’s constriction of the Mississippi River. Science 1975, 189, 681–684. [Google Scholar] [CrossRef] [PubMed]
  48. Kesel, R.; Dunne, K.C.; McDonald, R.C.; Allison, K.R.; Spicer, B.E. Lateral erosion and overbank deposition on the Mississippi River in Louisiana caused by 1973 flooding. Geology 1974, 2, 461–464. [Google Scholar] [CrossRef]
  49. Barnett, J.F. Beyond Control: The Mississippi River’s New Channel to the Gulf of Mexico; University Press of Mississippi: Oxford, MS, USA, 2017. [Google Scholar]
  50. Wang, B.; Xu, J. Dynamics of 30 large channel bars in the lower Mississippi River in response to river engineering from 1985 to 2015. Geomorphology 2018, 300, 31–44. [Google Scholar] [CrossRef]
  51. Wang, B.; Xu, J. Decadal-scale riverbed deformation and sand budget of the last 500 km of the Mississippi river: Insights into natural and river engineering effects on a large alluvial river. J. Geophys. Res. 2018, 123, 874–890. [Google Scholar] [CrossRef]
  52. Wang, B.; Xu, J. Sediment trapping by emerged channel bars in the lowermost Mississippi River during a major flood. Water 2015, 7, 6079–6096. [Google Scholar] [CrossRef] [Green Version]
  53. Joshi, S.; Xu, J. Bedload and suspended load transport in the 140-km reach downstream of the Mississippi River Avulsion to the Atchafalaya River. Water 2017, 9, 716. [Google Scholar] [CrossRef] [Green Version]
  54. Xu, J. What Would Happen if the Mississippi River Changed its Course to the Atchafalaya. In Proceedings of the (Poster) American Geophysical Union Meeting, New Orleans, LA, USA, 12 December 2017. [Google Scholar]
  55. Coumou, D.; Rahmstorf, S. A decade of weather extremes. Nat. Clim. Chang. 2012. [Google Scholar] [CrossRef]
  56. Shukla, P.R.; Skea, J.; Slade, R.; Haughey, E.; Malley, J.; Pathak, M.; Pereira, J. Technical Summary, 2019. In Climate Change and Land: An IPCC Special Report on Climate Change, Desertification, Land Degradation, Sustainable Land Management, Food Security, and Greenhouse Gas Fluxes in Terrestrial Ecosystems; IPCC: London, UK, 2019; 32p. [Google Scholar]
  57. Groisman, P.Y.; Knight, R.W.; Easterling, D.R.; Karl, T.R.; Hegerl, G.C.; Razuvaev, V.N. Trends in intense precipitation in the climate record. J. Clim. 2005, 18, 1326–1350. [Google Scholar] [CrossRef]
  58. Min, S.K.; Zhang, X.; Zwiers, F.W.; Hegert, G.C. Human contributions to more intense precipitation extremes. Nature 2011, 470, 378–381. [Google Scholar] [CrossRef]
  59. Pall, P.; Aina, T.; Stone, D.A.; Stott, P.A.; Nozawa, T.; Hilberts, P.G.J.; Lohmann, D.; Allen, M.R. Anthropogenic greenhouse gas contributions to flood risk in England and Wales in autumn 2000. Nature 2011, 470, 382–385. [Google Scholar] [CrossRef] [PubMed]
  60. Schiermeier, Q. Increased flood risk linked to global warming. Nature 2011, 470, 316. [Google Scholar] [CrossRef] [PubMed] [Green Version]
  61. Prein, A.F.; Rasmussen, R.M.; Ikeda, K.; Liu, C.; Clark, M.P.; Holland, G.P. The future intensification of hourly precipitation extremes. Nat. Clim. Chang. 2017, 7, 48–52. [Google Scholar] [CrossRef]
  62. Batker, D.; Mack, S.K.; Sklar, F.H.; Nuttle, W.K.; Kelly, M.E.; Freeman, A.M. The importance of Mississippi delta restoration on the local and national economies. In Perspectives on the Restoration of the Mississippi Delta; Day, J.W., Kemp, G.P., Freeman, A.M., Muth, D.P., Eds.; Springer: Dordrecht, The Netherlands, 2014; pp. 141–154. [Google Scholar]
  63. Batker, D.; de la Torre, I.; Costanza, R.; Day, J.W.; Swedeen, P.; Boumans, R. The threats to the value of ecosystem goods and services of the Mississippi Delta. In Perspectives on the Restoration of the Mississippi Delta; Day, J.W., Kemp, G.P., Freeman, A.M., Muth, D.P., Eds.; Springer: Dordrecht, The Netherlands, 2014; pp. 155–173. [Google Scholar]
  64. Batker, D.; de la Torre, I.; Costanza, R.; Swedeen, P.; Day, J.; Boumans, R.; Bagstad, K. Gaining Ground: Wetlands, Hurricanes and the Economy: The Value of Restoring the Mississippi River Delta; Earth Economics, Inc.: Tacoma, WA, USA, 2010; p. 98. [Google Scholar]
  65. Day, J.; Carney, J. Introduction – Changing conditions in the Mississippi delta from 1700 to 2100 and Beyond: Avoiding Folly. In Mississippi Delta Restoration; Day, J., Erdman, J., Eds.; Springer: New York, NY, USA, 2018; pp. 1–10. [Google Scholar]
  66. McCulloh, R.; Heinrich, P.; Good, B. Geology and Hurricane-Protection Strategies in the Greater New Orleans Area; Louisiana Geological Survey, Public Information Series No. 11; Louisiana Geological Survey: Baton Rouge, LA, USA, 2006; pp. 31, 98. [Google Scholar]
  67. Schlotzhauer, D.; Lincoln, W. Using New Orleans Pumping Data to Reconcile Gauge Observations of Isolated Extreme Rainfall due to Hurricane Isaac. J. Hydrol. Eng. 2016, 21. [Google Scholar] [CrossRef]
  68. Lincoln, W.S. Rainfall analysis for the August 5, 2017, New Orleans Flash Flood Event; NWS Lower Mississippi River Forecast Center: Slidell, LA, USA, 2018; p. 27.
  69. Veolia. Drainage System Condition Assessment; Report Prepared for the Sewerage and Water Board of New Orleans; New Orleans, LA, USA, 2018; p. 56. Available online: https://htv-prod-media.s3.amazonaws.com/files/veolia-nola-cond-assessment-final-report-3-18-2018-v8-1521655763.pdf (accessed on 24 June 2020).
  70. ABS Group. City of New Orleans Stormwater Drainage System Root Cause Analysis Draft Report; Report submitted to the City of New Orleans, LA under proposal number 4059986; Contract K18-111: New Orleans, LA, USA, 2018; p. 172. [Google Scholar]
  71. Yale Climate Connections. Summer Storms Reveal that New Orleans has More than just a Pump Problem. Available online: https://yaleclimateconnections.org/2018/05/new-orleans-has-more-than-just-a-pump-problem/ (accessed on 24 July 2020).
  72. Lincoln, W.S.; Schlotzhauer, D. Reconciling New Orleans Pumping Data with Gauge Observations of Isolated Extreme Rainfall; NWS Lower Mississippi River Forecast Center: Slidell, LA, USA, 2013; p. 47.
  73. Kates, R.W.; Colten, C.E.; Laska, S.; Leatherman, S.P. Reconstruction of New Orleans after Hurricane Katrina: A research perspective. Proc. Natl. Acad. Sci. USA 2006, 103, 14653–14660. [Google Scholar] [CrossRef] [Green Version]
  74. Glavovic, B. Waves of Adversity, Layers of Resilience: Floods, Hurricanes, Oil Spills and Climate Change in the Mississippi Delta. In Adapting to Climate Change: Lessons from Natural Hazards Planning; Glavovic, B.C., Smith, G.P., Eds.; Springer: Dordrecht, The Netherlands, 2014; pp. 369–403. [Google Scholar]
  75. Colten, C.; Day, J. Resilience of natural systems and human communities in the Mississippi Delta: Moving beyond adaptability due to shifting baselines. In Sustainable Coastal Design and Planning; Mossop, E., Ed.; CRC Press; Taylor & Francis: Boca Raton FL, USA, 2018; pp. 209–222. [Google Scholar]
  76. Day, J.; Lane, R.; D’Elia, C.; Wiegman, A.; Rutherford, J.; Shaffer, G.; Brantley, C.; Kemp, P. Large infrequently operated river diversions for Mississippi delta restoration. In Mississippi Delta Restoration; Day, J., Erdman, J., Eds.; Springer: New York, NY, USA, 2018; pp. 113–133. [Google Scholar]
  77. Kim, W.; Mohrig, D.; Twilley, R.; Paola, C.; Parker, G. Is it feasible to build new land in the Mississippi River Delta? EOS 2009, 90, 373–374. [Google Scholar] [CrossRef]
  78. Allison, M.A.; Meselhe, E.A. The use of large water and sediment diversions in the lower Mississippi River (Louisiana) for coastal restoration. J. Hydrol. 2010, 387, 346–360. [Google Scholar] [CrossRef]
  79. Paola, C.; Twilley, R.R.; Edmonds, D.A.; Kim, W.; Mohrig, D.; Parker, G.; Viparelli, E.; Voller, V.R. Natural processes in delta restoration: Application to the Mississippi Delta. Annu. Rev. Mar. Sci. 2011, 3, 67–91. [Google Scholar] [CrossRef] [PubMed]
  80. Wang, H.; Steyer, G.D.; Couvillion, B.R.; Rybczyk, J.M.; Beck, H.J.; Sleavin, W.J.; Meselhe, E.A.; Allison, M.A.; Boustany, R.G.; Fischenich, C.J.; et al. Forecasting landscape effects of Mississippi River diversions on elevation and accretion in Louisiana deltaic wetlands under future environmental uncertainty scenarios. Estuar. Coast. Shelf Sci. 2014, 138, 57–68. [Google Scholar] [CrossRef]
  81. Esposito, C.R.; Shen, A.; Tornqvist, T.E.; Marshak, J.; White, C. Efficient retention of mud drives land building on the Mississippi Delta plain. Earth Surf. Dynam. 2017, 5, 387–397. [Google Scholar] [CrossRef] [Green Version]
  82. Day, J.W.; Hunter, R.; Keim, R.; DeLaune, R.; Shaffer, G.; Evers, E.; Reed, D.; Brantley, C.; Kemp, P.; Day, J.; et al. Ecological response of forested wetlands with and without large-scale Mississippi River input: Implications for management. Ecol. Eng. 2012, 42, 57–67. [Google Scholar] [CrossRef]
  83. Saucier, R.T. Recent Geomorphic History of the Pontchartrain Basin; Louisiana State University Press: Baton Rouge, LA, USA, 1963. [Google Scholar]
  84. Davis, D.W. Historical perspective on crevasses, levees, and the Mississippi River. In Transforming New Orleans and Its Environs: Centuries of Changes; Colten, C.E., Ed.; University of Pittsburgh Press: Pittsburgh, PA, USA, 2000. [Google Scholar]
  85. Shen, Z.; Tornqvist, T.E.; Mauz, B.; Chamberlain, E.L.; Nijhuis, A.G.; Sandoval, L. Episodic overbank deposition as a dominant mechanism of floodplain and delta-plain aggradation. Geology 2015, 43, 875–878. [Google Scholar] [CrossRef]
  86. Fisk, H.N. Geological Investigation of the Alluvial Valley of the Lower Mississippi River; U.S. Department of the Army Mississippi River Commission: Vicksburg, MS, USA, 1944; p. 78.
  87. Rutherford, J.; Day, J.; D’Elia, C.; Wiegman, A.; Willson, C.; Caffey, R.; Shaffer, G.; Lane, R.; Batker, D. Evaluating trade-offs of a large, infrequent sediment diversion for restoration of a forested wetland in the Mississippi delta. Estuar. Coast. Shelf Sci. 2017, 203, 80–89. [Google Scholar] [CrossRef]
  88. Rutherford, J.; Wiegman, A.; Day, J.; Lane, R. Energy and Climate–Global trends and their implications for delta restoration. In Mississippi Delta Restoration; Day, J., Erdman, J., Eds.; Springer: New York, NY, USA, 2018; pp. 77–92. [Google Scholar]
  89. Xu, K.; Bentley, S.J.; Robichaux, P.; Sha, X. Implications of texture and erodibility for sediment retention in receiving basins of coastal Louisiana diversions. Water 2016, 8, 26. [Google Scholar] [CrossRef] [Green Version]
  90. Shaffer, G.; Day, J.; Mack, S.; Kemp, P.; van Heerden, I.; Poirrier, M.; Westphal, K.; FitzGerald, D.; Milanes, A.; Morris, C.; et al. The MRGO navigation project: A massive human-induced environmental, economic, and storm disaster. J. Coast. Res. 2009, 54, 206–224. [Google Scholar] [CrossRef]
  91. Shaffer, G.P.; Day, J.W.; Lane, R.R. Optimum use of fresh water to restore baldcypress-water tupelo swamps and freshwater marshes and protect against salt water intrusion: A case study of the Lake Pontchartrain Basin. In Mississippi Delta Restoration; Day, J., Erdman, J., Eds.; Springer: New York, NY, USA, 2018; pp. 61–76. [Google Scholar]
  92. Nienhuis, J.H.; Tornqvist, T.E.; Esposito, C.R. Crevasse splays versus avulsions: A recipe for land building with levee breaches. Geophys. Res. Lett. 2018, 45, 4058–4067. [Google Scholar] [CrossRef]
  93. Nittrouer, J.A.; Viparelli, E. Sand as a stable and sustainable resource for nourishing the Mississippi River delta. Nat. Geosci. 2014, 7, 350–354. [Google Scholar] [CrossRef]
  94. Meade, R.H.; Moody, J.A. Causes for the decline of suspended-sediment discharge in the Mississippi River system, 1947–2007. Hydrol. Process. 2009, 24, 35–49. [Google Scholar]
  95. Chamberlain, E.L.; Tornqvist, T.E.; Shen, Z.; Mauz, B.; Wallinga, J. Anatomy of Mississippi Delta growth and its implications for coastal restoration. Sci. Adv. 2018, 4, 1–9. [Google Scholar] [CrossRef] [PubMed] [Green Version]
  96. Reed, D.; Wang, Y.; Meselhe, E.; White, E. Modeling wetland transitions and loss in coastal Louisiana under scenarios of future relative sea-level rise. Geomorphology 2020, 352, 106991. [Google Scholar] [CrossRef]
  97. Tessler, Z.D.; Vörösmarty, C.J.; Grossberg, M.; Gladkova, I.; Aizenman, H.; Syvitski, J.P.M.; Foufoula-Georgiou, E. Profiling risk and sustainability in coastal deltas of the world. Science 2015, 349, 638–643. [Google Scholar] [CrossRef] [Green Version]
  98. Wiegman, R.; Day, J.; D’Elia, C.; Rutherford, J.; Morris, J.; Roy, E.; Lane, R.; Dismukes, D.; Snyder, B. Modeling impacts of sea-level rise, oil price, and management strategy on the costs of sustaining Mississippi delta marshes with hydraulic dredging. Sci. Total. Environ. 2018, 618, 1547–1559. [Google Scholar] [CrossRef]
  99. Odum, W.; Odum, E.; Odum, H. Nature’s pulsing paradigm. Estuaries 1995, 18, 547–555. [Google Scholar] [CrossRef]
  100. Day, J.; Martin, J.; Cardoch, L.; Templet, P. System functioning as a basis for sustainable management of deltaic ecosystems. Coastal Mngt. 1997, 25, 115–154. [Google Scholar] [CrossRef]
  101. Day, J.; Gunn, J.; Folan, W.; Yáñez-Arancibia, A.; Horton, B. Emergence of complex societies after sea level stabilized. EOS 2007, 88, 170–171. [Google Scholar] [CrossRef] [Green Version]
  102. Pont, D.; Day, J.; Ibáñez, C. The impact of two large floods (1993-1994) on sediment deposition in the Rhone delta: Implications for sustainable management. Sci. Total. Environ. 2017. [Google Scholar] [CrossRef] [PubMed]
Figure 1. Rainfall during Hurricane Harvey in the Houston vicinity. Peak rainfall was more than 1.5 m over three days. (https://www.climate.gov/news-features/event-tracker/reviewing-hurricane-harveys-catastrophic-rain-and-flooding accessed on 7 January 2021).
Water 13 00813 g001
Figure 5. Minimum, mean, and maximum stage of the Mississippi River at the Natchez, Mississippi USACE gauge. The red horizontal line indicates flood stage at Natchez (https://rivergages.mvr.usace.army.mil, accessed on 15 January 2021).
Water 13 00813 g005
Figure 6. Minimum, mean, and maximum discharge of the Mississippi River at the Natchez, Mississippi USACE gauge (https://rivergages.mvr.usace.army.mil, accessed on 15 January 2021).
Water 13 00813 g006
Figure 7. Minimum, mean, and maximum stage of the Mississippi River by year at the. Baton Rouge, Louisiana USACE gauge. The red horizontal line indicates flood stage at Baton Rouge (https://rivergages.mvr.usace.army.mil, accessed on 15 January 2021).
Water 13 00813 g007
Figure 8. Number of days that the Mississippi River was above flood stage of 16 m (48 ft) at the Natchez, Mississippi USACE gauge between 1901 and 2020. Note that 2020 is not a complete data set (https://rivergages.mvr.usace.army.mil, accessed on 15 January 2021).
Water 13 00813 g008
Figure 9. Number of days that the Mississippi River was above flood stage of 11.7 m (35 ft) at the Baton Rouge, Louisiana USACE gauge between 1935 and 2020 (https://rivergages.mvr.usace.army.mil accessed on 15 January 2021).
Water 13 00813 g009
Figure 10. Comparing 4-year averages starting with 2005 to 2008 and ending with 2017 to 2020 showing an increase in average number of days that the Mississippi River was above flood stage of 10.6 m (35 ft) at the Baton Rouge, Louisiana USACE gauge extending late into spring (May) and later still into summer hurricane season (June through August) (https://rivergages.mvr.usace.army.mil; accessed on 1 March 2021).
Water 13 00813 g010
Figure 11. Potential increase in peak Mississippi River discharge of the 2011 flood (left discharge column) due to climate change and land use changes in the basin (based on model predictions from 46). MR&T is the Mississippi River and Tributaries project flood.
Water 13 00813 g011
Figure 12. Bank failure of levee at Donaldsonville, Louisiana during the 1973 flood. Such failures are most common when water levels drop precipitously after prolonged high flows. Photo courtesy of J. David Rogers.
Water 13 00813 g012
Figure 13. Top. Flooding due to individual extreme precipitation events. Bottom. Combination of all storms shown in Table 1. From [30]. Used by permission.
Water 13 00813 g013
Figure 14. New Orleans elevation relative to mean sea level [67]. Inset shows New Orleans elevation from the Mississippi River to Lake Pontchartrain.
Water 13 00813 g014
Figure 15. Stormwater pump station map of New Orleans (https://www.swbno.org/Stormwater/Overview; accessed on 7 January 2021).
Water 13 00813 g015
Figure 16. Polders of the New Orleans storm drainage network [67].
Water 13 00813 g016
Figure 17. Rainfall and pumping rates for the Main polder of the City of New Orleans during Hurricane Isaac. The hypothetical minimum and maximum pumping rates for the system are specified, as well as the nominal rate provided by SWBNO [72].
Water 13 00813 g017
Table 1. The 34 major Louisiana flood events of the 21st century. Storms in bold are shown in Figure 13. Modified from [30].
Event NumberEventDateLandfall LocationParishes with Flooding
1Tropical Storm AllisonJune 2001Morgan City, LACameron, St. Tammany, St. Bernard, E. Baton Rouge
2Tropical Storm BerthaAugust 2002Mouth of MS RiverSt. Tammany, E. Feliciana
3Hurricane IsidoreSeptember 2002Grand Isle, LASt. Tammany, upper Jefferson
4Hurricane Lili (Cat 1)October 2002Vermillion Bay, LAVermillion, Acadia
5Tropical Storm BillJune 2003Central LA CoastTerrebonne, St. Tammany
6Hurricane IvanSeptember 2004Cameron, LACameron, Calcasieu, Caddo
7Tropical Storm MatthewOctober 2004Central LA coast at Frenier, LATerrebonne, Lafourche
8Hurricane Cindy
(Cat 1)
July 2005Grand Isle, LAOrleans
9Hurricane Katrina
(Cat 3)
August 2005Mouth of MS RiverMost coastal parishes
10Hurricane Rita (Cat 3)September 2005LA-TX borderVermillion, Cameron, Calcasieu, Vernon, Beauregard, Jefferson Davis, Allen
11Western/Northern River floodOctober 2006Not applicableVernon, St. Landry, Calcasieu
12Hurricane Humberto (Cat 1)September 2007Vinton, LALafayette, Beauregard
13Tropical Storm EdouardAugust 2008Gilchrist, TXCalcasieu
14Hurricane Gustav
(Cat 2)
September 2008Mouth of MS RiverMost coastal parishes
15Hurricane Ike (Cat 1)September 2008Point Bolivar, TXCameron, Vermillion
16Tropical Storm BonnieJuly 2010Mouth of MS RiverWashington, W. Baton Rouge
17Tropical Depression 5August 2010LA-MS borderOrleans, Avoyelles
18MS and Atchafalaya rivers floodApril 2011Not applicableAvoyelles, Iberville, W. Baton Rouge, Pointe Coupee, Iberia
19Tropical Storm LeeSeptember 2011Vermillion Bay, LASt. Tammany, Orleans, Plaquemines, St. Bernard, Jefferson
20Hurricane Isaac (Cat 1)August 2012Port Fourchon, LAMost coastal parishes
21Red River floodJune 2015Not applicableCaddo, Bossier, Natchitoches, Rapides
22MS River floodJanuary 2016Not applicableW. Baton Rouge, W. Feliciana, Pointe Coupee
23Northern LA rivers floodMarch 2016Not applicableTangipahoa, St. Tammany, Washington, Livingston, Ascension, Calcasieu, Beauregard, Vernon, Ouachita, Caldwell, Richland, Madison, Bienville, Natchitoches
24Eastern LA rivers floodAugust 2016Not applicableAscension, Livingston, E. Baton Rouge, W. Baton Rouge, Tangipahoa, St. Helena, Rapides, Pointe Coupee, Vermillion, Acadia, Evangeline, St. Martin
25Tropical Storm CindyJune 2017LA-TX borderCameron, Calcasieu, Vermillion, Iberia
26Hurricane HarveyAugust 2017Cameron, LACameron, Jefferson Davis, Acadia, Vermillion, St. Martin, Acadia, Lafayette, Calcasieu, Iberia, Terrebonne
27Red River FloodMarch 2018Not applicableNatchitoches, Bossier, Caddo
28Hurricane Nate (Cat 1)October 2017Mouth of MS RiverSt. Tammany
29Hurricane Barry (Cat 1)July 2019Marsh Island, LASt. Martin, Terrebonne, Lafourche
30Tropical Storm OlgaOctober 2019Central LA coastTerrebonne, Lafourche, St. Tammany
31Tropical Storm CristobalJune 2020SE LAJefferson
32Tropical Storm MarcoAugust 2020Mouth of MS RiverNo major flooding in LA
33Hurricane Laura (Cat 4)August 2020LA-TX borderCameron, Calcasieu
34Hurricane Delta (Cat 2)August 2020LA-TX borderCameron, Calcasieu
35Hurricane Zeta (Cat 2)October 2020Cocodrie, LA
Publisher’s Note: MDPI stays neutral with regard to jurisdictional claims in published maps and institutional affiliations.

