Article

Alkylphenols and Chlorophenols Remediation in Vertical Flow Constructed Wetlands: Removal Efficiency and Microbial Community Response

by
Inês P. F. M. Montenegro
1,2,
Ana P. Mucha
1,3,
Maria Paola Tomasino
1,
Carlos Rocha Gomes
1,2 and
Cristina Marisa R. Almeida
1,2,*
1
Centro Interdisciplinar de Investigação Marinha e Ambiental (CIIMAR/CIMAR), Universidade do Porto, Terminal de Cruzeiros do Porto de Leixões, Av. General Norton de Matos s/n, 4450-208 Matosinhos, Portugal
2
Departamento de Química e Bioquímica, Faculdade de Ciências, Universidade do Porto, Rua do Campo Alegre, 687, 4169-007 Porto, Portugal
3
Departamento de Biologia, Faculdade de Ciências, Universidade do Porto, Rua do Campo Alegre, s/n, 4169-007 Porto, Portugal
*
Author to whom correspondence should be addressed.
Water 2021, 13(5), 715; https://doi.org/10.3390/w13050715
Submission received: 23 January 2021 / Revised: 19 February 2021 / Accepted: 1 March 2021 / Published: 6 March 2021

Abstract

:
This study aims to investigate the effect of two different groups of phenolic compounds (the alkylphenols nonylphenol (NP) and octylphenol (OP), and the chlorophenol pentachlorophenol (PCP)) on constructed wetlands (CWs) performance, including on organic matter, nutrients and contaminants removal efficiency, and on microbial community structure in the plant bed substrate. CWs were assembled at lab scale simulating a vertical flow configuration and irrigated along eight weeks with Ribeira de Joane (an urban stream) water not doped (control) or doped with a mixture of NP and OP or with PCP (at a 100 μg·L−1 concentration each). The presence of the phenolic contaminants did not interfere in the removal of organic matter or nutrients in CWs in the long term. Removals of NP and OP were >99%, whereas PCP removals varied between 87% and 98%, mainly due to biodegradation. Microbial richness, diversity and dominance in CWs substrate were generally not affected by phenolic compounds, with only PCP decreasing diversity. Microbial community structure, however, showed that there was an adaptation of the microbial community to the presence of each contaminant, with several specialist genera being enriched following exposure. The three more abundant specialist genera were Methylotenera and Methylophilus (methylophilaceae family) and Hyphomicrobium (hyphomicrobiaceae family) when the systems were exposed to a mixture of NP and OP. When exposed to PCP, the three more abundant genera were Denitromonas (Rhodocyclaceae family), Xenococcus_PCC_7305 (Xenococcaceae family) and Rhodocyclaceae_uncultured (Rhodocyclaceae family). To increase CWs efficiency in the elimination of phenolic compounds, namely PCP which was not totally removed, strategies to stimulate (namely biostimulation) or increase (namely bioaugmentation) the presence of these bacteria should be explore. This study clearly shows the potential of vertical flow CWs for the removal of phenolic compounds, a still little explored subject, contributing to promote the use of CWs as nature-based solutions to remediate water contaminated with different families of persistent and/or emergent contaminants.

1. Introduction

Endocrine disrupting chemicals (EDCs) are characterized as external agents that obstruct the formation, release, transport, attachment, activity or displacement of body natural hormones regulating homeostasis, development, reproduction and behavior [1]. Various synthetic chemicals with known endocrine disruption capacity have been identified. Alkylphenols, such as nonylphenol (NP) and octylphenol (OP), and chlorophenols, such as pentachlorophenol (PCP), are examples of phenolic EDCs [2,3]. Due to their potential adverse effects on ecosystems and human health, these phenolic compounds were listed as a priority substance in the EU Water Framework Directive [4] and classified as persistent organic pollutants in the environment for many countries [5,6], indicating that different strategies should be develop to reduce their input into the environment.
Alkylphenols are degradation products of alkylphenols ethoxylates (APEOs), which are commonly used in the formulation of a large variety of detergents, paints, lubricants, resins and pesticides [7]. APEOs are of concern because the microbial breakdown of nonylphenol polyethoxylates (NPnEO) and octylphenol polythoxylates (OPnEO) originate NP and OP, respectively, which are more toxic than the parent compounds [2].
Among chlorinated phenols, PCP has been extensively used in industry as a wood preservative product as well as in pesticide and biocide for crops, leathers and textiles [8]. This synthetic polychlorinated aromatic organic compound can be released into the environment after its use. PCP is toxic to all forms of life, because it is an oxidative phosphorylation inhibitor [9].
The release of EDCs from wastewater treatment plants (WWTPs) and the subsequent occurrence of EDCs in receiving waters have been well documented [10,11] and despite progress being achieved by WWTPs treatments regarding the elimination of EDCs, residual EDCs are still released in WWTPs effluents at concentrations above environmental disturbance thresholds having a potential risk, for instance, to aquatic organisms [12,13]. Some technologies and processes have been used to treat effluents contaminated with these organic contaminants in an attempt to minimize their potential adverse effects on ecosystems and human health [14,15].
In recent years constructed wetlands (CWs) have been applied successfully for the removal of nutrients, organic matter and diverse trace inorganic and organic contaminants [16], including EDCs [17,18,19,20,21,22]. However, currently, available data of NP, OP or PCP effects on CWs performance, including on CWs microbial community, are still limited and more research is needed to fully assess their removal potentialities. CWs pollutants removal occurs through a combination of physical, chemical and biological processes in which CWs plants and microorganisms can have a significant influence. Therefore, knowledge of the impact of these contaminants on CWs components, particularly on microbial communities which are responsible for organic contaminants biodegradation, is needed to fully optimize the CWs removal potential. Moreover, one must assure that EDCs do not affect the removal of conventional water contaminants (e.g., organic matter and nutrients) to potentiate the use of this green technology that can also have considerable contributions to the circular economy as wastewater after proper treatment can be reuse.
This study aimed to investigate the effect of two different groups of phenolic EDCs compounds on CWs performance, including on organic matter, nutrients and contaminants removal efficiency, and on microbial community structure in the plant bed substrate, improving the knowledge regarding the processes occurring in CWs to be able to promote the implementation and good operation of these green systems. For that, water from an anthropogenic impacted urban stream doped with two types of phenolic compounds, either a mixture of NP and OP (at a 100 μg·L−1 concentration each) or PCP (at a 100 μg·L−1 concentration), was treated in CWs at lab scale, in controlled conditions, for eight weeks.

2. Materials and Methods

2.1. Chemicals and Materials

Methanol of HPLC Grade, supplied by Fisher Scientific (Loughborough, UK), was used. Ethanol absolute PA and sodium carbonate anhydride were supplied by Panreac (Barcelona, Spain). Sodium chloride for analysis, acetic anhydride extra pure and sulfuric acid were supplied by Merck (Darmstadt, Germany). Standards of 4-tert-octylphenol and 4-nonylphenol (NP) from Sigma Aldrich (Steinhein, Germany) were obtained from Supelco. The stock solutions of OP and NP at 1 g·L−1 were prepared in methanol by dissolving an appropriate amount of the respective compound and stored at 4 °C. Working standard solutions of a mixture of OP with NP (defined as OP_NP) were prepared at 1 mg·L−1 and stored at 4 °C for a maximum of one week. A standard solution of pentachlorophenol (PCP) from Dr. Ehrenstorfer wrapped (Augsburg, Germany) was used. The stock solutions of PCP at 1 g·L−1 were prepared in ethanol by dissolving an appropriate amount of the respective compound and stored at 4 °C. Working standard solutions were prepared at 1 mg·L−1 and stored at 4 °C for a maximum of one week.
All material used was properly decontaminated by washing with deionized water, immersion in a 20% (v/v) nitric acid solution overnight, washing with deionized water and dried in an oven at 30 °C.

2.2. Microcosm Experiments

Phragmites australis, sediment in contact with plant roots and sand used to assemble the CW systems, were collected in the Lima River estuary (north of Portugal). P. australis were collected with the sediment attached to their belowground structures which were removed and brought to the lab to be used as plant root substrate. Plants with good physiological condition and similar biomass were selected.
Six CWs were assembled at lab scale simulating a vertical flow configuration (VFCW), as described in [23], and adapted to operate with an automatically recirculating water system (flow rate ca. 10 mL·min−1) as described in [24], with a recirculation period of 12 h followed by a 12 h non-recirculation period (Figure S1). Water level was maintained just above the substrate surface, i.e., the CWs substrates were kept at their water saturation level. Each microcosm was set up in plastic boxes (56 × 39 × 28 cm). Each box had three layers: the top layer was the plant roots’ bed substrate, composed by sediment and sand mixed in a proportion of 1:2 (16 cm), the intermediate layer containing the porous substrate lava rock (2 cm) and the drainage layer on the bottom which was filled with gravel (4 cm). The top layer supported the P. australis rhizomes and roots, maintaining the plant rhizosphere native microbial community. About 40 plants with stems of the same length and in good physiological condition were transplanted to each microcosm. For simulating CWs conditions, each box was wrapped in aluminum foil. After assembling, systems were acclimatized for one week with Hoagland nutrient solution to provide suitable nutritional conditions to plants. Then, the six CWs systems were irrigated with 1.5 L of water from the urban stream Ribeira de Joane for two weeks to complete the acclimatization of the systems.
The water from Ribeira de Joane used in the experiments was collected weekly from its mouth located next to Paraíso beach in Matosinhos, Portugal (41°13′33.5″ N, 8°43′00.4″ W). The Ribeira de Joane runs 3.7 km through a very urbanized area, being mainly canalized. This urban stream receives untreated wastewater as well as storm water, being a crucial element in the rural activity located along the stream banks.
Two experiments were carried out to test two different groups of phenolic compounds. For each experiment, experiments were initiated after the acclimatization period mentioned above. Experiment#1 was carried out in spring of 2018, evaluating the removal of a mixture of NP and OP. Experiment#2 was carried out in spring of 2019, after re-assembling CW microcosms with new materials similarly to that described above, evaluating the removal of PCP. For each experiment, three of the microcosms (defined as CWs doped) were weekly irrigated with 1.5 L of Ribeira de Joane water doped with 100 μg·L−1 of each target compound (NP and OP in experiment#1 and PCP in experiment#2). The doping concentration was based on real concentrations previously found in environmental waters [25]. In each experiment, the other three microcosms (defined as CWs control) were irrigated only with 1.5 L of Ribeira de Joane water, each. Ribeira de Joane water, doped or not doped (control), was treated in one-week cycles over eight weeks per experiment. Therefore, after one week the CWs water was completely drained and new water (not-doped or doped) was added. Water losses by evapotranspiration processes were daily compensated by adding deionized water.
For each experiment, the six CWs systems were kept under “greenhouse” conditions, namely in a nature light cycle. In experiment#1, minimum temperature ranged between 10 and 13 °C and maximum temperature between 22 and 30 °C, while in experiment#2, minimum temperature ranged between 15 and 22 °C and maximum temperature between 23 and 27 °C. Temperature differences were due to the time period in which each experiment took place (spring 2018 vs. spring 2019). The same seasonal period was chosen for both experiments, spring time being chosen so that plants were in their high productivity stage.

2.3. CWs Sampling

Weekly CWs influent and effluent water samples were collected for analysis of organic matter (through chemical oxygen demand (COD) measurements), nutrients (ammonium (NH4+), nitrate (NO3), nitrite (NO2) and phosphate (PO43−) ions) and the target compounds (NP, OP and PCP) levels.
Plant root bed substrate samples were collected from CWs systems at time T0 (at the beginning of the experiment) and time T8 (in the last week of the experiment) (Figure S2). In these samples, the target compounds (NP, OP and PCP) were analyzed and the microbial community was characterized (Figure S2). Substrate was collected from different points in each microcosm at the plant roots height (5–8 cm below surface sediment), which were then thoroughly homogenized. For phenolic compounds, samples were kept at −20 °C and lyophilized before analysis. For microbial community characterization, ca. 2 g of each homogenized sample was stored in sterile Eppendorf tubes at −20 °C until analysis.
For each compound, the percentage of removal (removal efficiency) was calculated as:
removal   efficiency   % = Cin   Cout Cin × 100
where Cin and Cout are the concentration of the respective compound in CWs influent and effluent, respectively.

2.4. Analytical Methodologies

2.4.1. Nutrient and COD Analysis

For nutrient analysis, NH4+, NO2 and PO43− ions were quantified using methods described in [26]. NO3 was measured using an adaptation of the spongy cadmium reduction technique [27], with NO2 value subtracted from the total. Analysis was carried out in an Ultraviolet and Visible Absorption spectrometer (V-1200; Perkin Elmer, Waltham, MA, USA). Organic matter content was estimated through COD measurements carried out with HANNA instruments kit (HI 839800) following manufacture instructions.

2.4.2. Phenolic Compounds Analysis

Before analysis target compounds (NP, OP or PCP) were extracted from sediments with methanol in an ultrasonic bath (Transsonic-460/H, with a working frequency 40 kHz (1000 W)) for 15 min. After the extraction, the solution was centrifuged (5 min at 2500 rpm), transferred to a new vial and a new extraction of the sediment was done. After centrifuging the extracts were combined and stored at −20 °C in the dark until analysis. Each sample was prepared in triplicate.
Analysis of the target compounds in the influent and effluent of CWs and in sediment extracts was carried out by headspace-solid phase microextraction (HS-SPME) with gas chromatography–mass spectrometry (GC-MS). The salting-out technique, addition of sodium chloride to a solution, was used following a methodology previously optimized [28]. For NP and OP analysis, HS-SPME was carried out in a 20 mL headspace vial closed with Teflon-lined septa (Supelco). For water analysis, 3 g of NaCl were added to 10 mL of the sample. For sediment, 3 g of NaCl and 200 μL of sediment extract were added to 9.8 mL of deionized water. For PCP, HS-SPME was carried out in 20 mL headspace vial closed with Teflon-lined septa (Supelco) containing 1 g of NaCl, 0.5 mL of a solution of Na2CO3 (20% w/v; daily prepared), 0.1 mL acetic anhydride and 9.4 mL of water sample (for water analysis) or 200 μL of sediment extract plus 9.2 mL of deionized water (for sediment analysis). The mixture was pre-equilibrated at 70 °C for 10 min and shaken at 500 rotation per minute (rpm), being afterwards subject to HS-SPME (60 min at 70 °C and 250 rpm) in an automatic sampler CTC Analytic, CombiPal model (San Diego, CA, USA), using a 60 μm polyethylene glycol (PEG) fiber (Supelco) for NP and OP analysis and a 65 μm polydimethylsiloxane /divinylbenzene (PDMS/DVB) fiber (Supelco) for PCP analysis. GC-MS analysis was carried out with a capillary column CP-Sil 5 CB low bleed/MS (60 m length, 0.25 mm internal diameter and 0.25 μm stationary phase film thickness) in a Varian 3900 GC coupled to a Varian MS using previously optimized conditions [28]. The carrier gas was helium (99.9995%). The ions monitored were 107, 108, 115 and 220 for NP, 41, 57, 97, 105, 135 and 206 for OP and 265.9, 266.8, 268.4 and 270.0 for PCP.
Compounds’ quantifications were obtained through calibration curves made with standard solutions of the compounds prepared in deionized water. During phenolic compounds analysis, blanks, standard solutions and doped samples were routinely analyzed, with recoveries ranging between 80 and 120%. For NP and OP, concentrations ranged from 1 to 60 μg·L−1 and for PCP from 0.01 to 1.5 μg·L−1. Limits of detection for water analysis were 0.25 μg·L−1 for OP, 0.33 μg·L−1 for NP and 4 × 10⁻⁵ μg·L−1 for PCP. For sediments, limits of detection (LODs) were 0.12 μg·g−1 for NP and OP and 0.030 ng·g−1 for PCP.

2.5. Microbial Communities’ Characterisation

2.5.1. DNA Extraction, PCR Amplification and Sequencing

Environmental DNA (eDNA) from plant root bed substrate was extracted using DNeasy PowerSoil Kit (Qiagen, Hilden, Germany) following the manufacturers protocol. The qualitative and quantitative estimation of the extracted eDNA was performed by Quant-it ds DNA HS assay kit and Qubit 4 fluorometer (Thermo Fisher Scientific, Inc., Waltham, MA, USA). Samples were then prepared and submitted to Genoinseq (Cantanhede, Portugal) for Next Generation Sequencing (NGS) analysis of the prokaryotic community. The V4-V5 hypervariable region of 16S rRNA gene (≈412 bp) was amplified (using primer set 515F-Y 5′-GTGYGCMGCCGCGGTAA-3′ and 926R 5′-CCGYCAATTYMTTTRAGTTT-3′ reported in [29]) and the paired-end sequencing was carried out by an Illumina MiSeq® platform with the V3 chemistry, according to manufacturer’s instructions (Illumina, Inc., San Diego, CA, USA) at Genoinseq facilities.

2.5.2. Bioinformatics Analysis

The methodology about sequence data processing used in this study is fully described in Bragança et al. [30] and Calheiros et al. [31]. Raw reads were extracted from Illumina MiSeq® System in fastq format and quality-filtered with PRINSEQ version 0.20.4 to remove sequencing adapters, reads with less than 100 bases and trim bases with an average quality lower than Q25 in a window of 5 bases. The forward and reverse reads were merged by overlapping paired-end reads with Adapter Removal version 2.1.5 using default parameters. The filtered merged amplicons received from sequencing company (Genoinseq) in fastq format were converted into fasta format by Mothur software (mothur v.1.43.0; [32]) and processed by the automatic pipeline Silva Next Generation Sequencing (SILVAngs, https://ngs.arb-silva.de/silvangs/ (accessed on 30 May 2020)) of the SILVA rRNA gene database project (SILVAngs 1.3). The taxonomic characterization of the prokaryotic community of the sediment samples was determined using SIlVAngs pipeline default settings. Briefly, after quality control steps, unique sequences were clustered into operational taxonomic units (OTUs) at 98% of similarity; the classification was performed by a local nucleotide BLAST search (2.2.30+; https://blast.ncbi.nlm.nih.gov/Blast.cgi (accessed on 30 July 2020)) against the non-redundant version of the SILVA SSU Ref dataset (132 version) using blastn with standard setting [33]. Sequences without any BLAST hits or reads with weak BLAST hits remained unclassified and were labelled as “no Relative”. Undesirable lineages, “Chloroplast”, “Mitochondria” and “Eukaryota” were removed from the dataset.

2.5.3. Diversity and Community Composition of Microbial Community

Taxonomic abundance tables obtained from SILVAngs analysis were imported into R environment [34] to perform the downstream analysis that included the taxonomic profile, alpha and beta diversity of the microbial community. Alpha diversity was estimated using the “vegan” R-package [35] and included the following estimators: OTU richness (Observed unique OTUs in each sample), Shannon-index, Berger Parker-index. Constructed box plots were used to explore diversity among times and treatments using the function “ggboxplot” in the “ggplot2” R package [36]. Beta diversity analysis included Nonmetric Multidimensional Scaling (NMDS) based on Bray–Curtis dissimilarity matrix calculated using phyloseq R-package [37], and by hierarchical clustering constructed using the Hellinger transformation that reduces the asymmetry of heavily shewed abundance data (using “decostand” function in the “vegan” R package). Hierarchical clustering of samples into groups was based on Hellinger dissimilarity calculated by the “vegdist” function and “hclust” function in the “vegan” R package. The function “vegdist” was used to find the dissimilarities between samples and “hclust” function was used to complete linkage method for hierarchical clustering. R package “phyloseq” was also used to plot the taxonomic profile of the prokaryotic community across the samples.

2.6. Statistical Analysis

To evaluate statistically significant differences (p < 0.05) in the performances of CWs treatments for the removal of each compound a parametric one-way analysis of variance (ANOVA) was applied. The presence of significant differences was detected by a multiple Tukey comparison test.
For microbial communities, statistical analysis was conducted using the R software [34]. In alpha diversity analysis, differences were considered significant at the level of α = 5% and estimated using Kruskal–Wallis statistical methods. Non-metric multivariate scaling (NMDS) analysis of data was transformed by “phyloseq” function and the Bray–Curtis dissimilarity matrix was used to ordinate. The “clamtest” function from “vegan” R package and described in [38] was used for statistical approach for classifying generalists and specialists in two distinct treatments.

3. Results

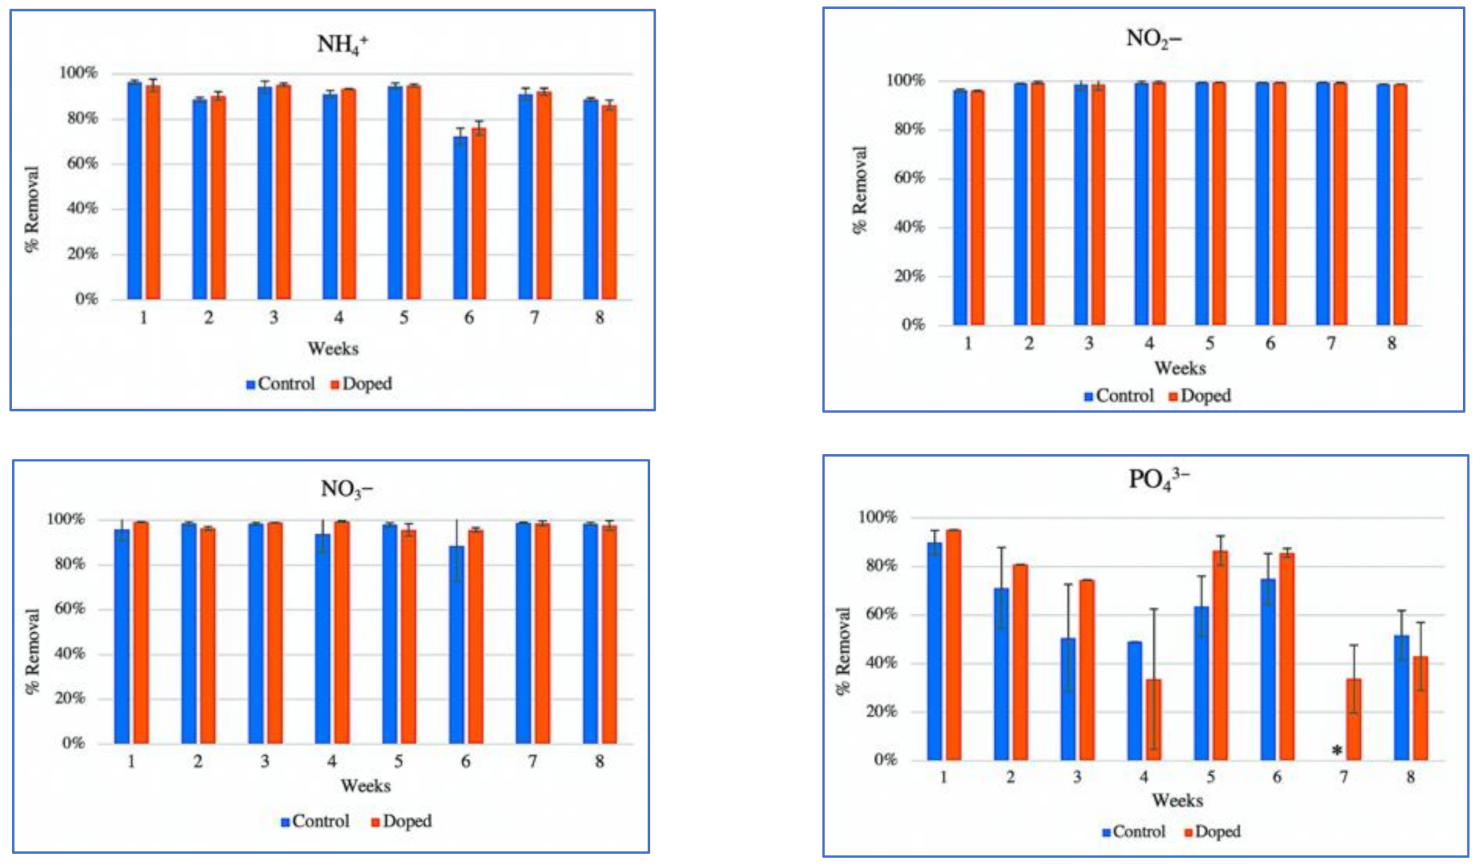
3.1. Removal of a Mixture of Alkylphenol Compounds and Nutrients from Contaminated Water by CWs Microcosms

Plants of all systems showed vitality (by visual inspection) and even new plant shoots appeared along the 8 weeks of experiment.
Alkylphenol compounds removals by CWs were assessed in each one-week cycle along the eight weeks period. In the water of Ribeira de Joane (influent of CWs) and in CWs effluents, the NP and OP concentrations were always below the limit of detection (0.25 μg·L−1 for OP and 0.33 μg·L−1 for NP), even when the stream water was doped with a mixture of NP and OP, indicating a significant removal (always >99%) of both alkylphenol compounds in CWs.
In the plant root bed substrate, collected at the beginning (T0) and end (T8) of the experiment, no NP was detected (LOD of 0.12 μg g¹), indicating that the compound was totally removed from the system. Regarding OP, the compound was detected in both T0 e T8 plant root bed substrate in both control and doped systems, all values being statistically identical (p > 0.05) (ca. 0.45 μg·g−1). The compound was also detected in the sediment of estuary of Rio Lima collected to prepare the plant root bed substrate (0.53 ± 0.03 μg·g−1), being probably this the source of the compound. Results indicate that only OP added to CW systems by doping the CW influent was removed/degraded.
To evaluate a possible effect of the mixture of alkylphenol compounds on the CWs performance, organic matter (through COD) and nutrients (NH4+, NO2, NO3 and PO43− ions) removals were determined.
COD of Ribeira de Joane water varied between 15 and 83 mg·L−1 along the experimental period (Table 1). COD removal values also varied significantly ranging from non-removal to 73.0% in control systems (not doped water) and from non-removal to 83% in systems with water doped with both NP and OP. A high variability among CWs replicates was observed. In the first weeks there was no removal of organic matter or that removal was very low, probably due to an adaptation of the systems, adaptation that was longer for the doped systems. In fact, in the latter there was a tendency for removals to increase over time (after week 5 an increase from 53% to 83% was observed, although differences were not statistically significant (p > 0.05), whereas in control systems, after the adaption period (first two weeks), removals were mostly constant, being statistically identical (p > 0.05). Therefore, NP and OP showed some impact in COD removal efficiency in the initial period.
Along the eight weeks of the experiment, NH4+ ion concentrations in CWs influent varied between 34 and 163 μM (Table S1). Removal of NH4+ ions was always higher than 85%, with the exception of week 6, with no significant differences (p > 0.05) between control and doped systems (Figure 1). CWs influent concentration of NO2 ion varied between 6.3 and 53 μmol·L−1 (Table S1). Removal percentages of NO2 ions were always higher than 96%, with no significant differences (p > 0.05) between control and doped systems (Figure 1). The concentration of NO3 ion varied between 211 and 655 μmol·L−1 in CWs influent (Table S1). The removal percentage of NO3 ions was always higher than 85%, with no significant differences (p > 0.05) between control and doped systems (Figure 1).
The concentration of PO43− ions in CWs influent varied between 2.0 and 20 μmol·L−1 (Table S1). PO43− ions removal showed a significant variation in removal percentages (removals between 0 and 95%) (Figure 1). The presence of NP and OP did not interfere with PO43− ions removal, with removal percentages being statically identical (p > 0.05) between control and doped systems, except in weeks 5 and 7 with slightly lower removals in control systems.
Therefore, the presence of the two contaminants (NP and OP) did not interfere with the removal of nutrients in CWs.

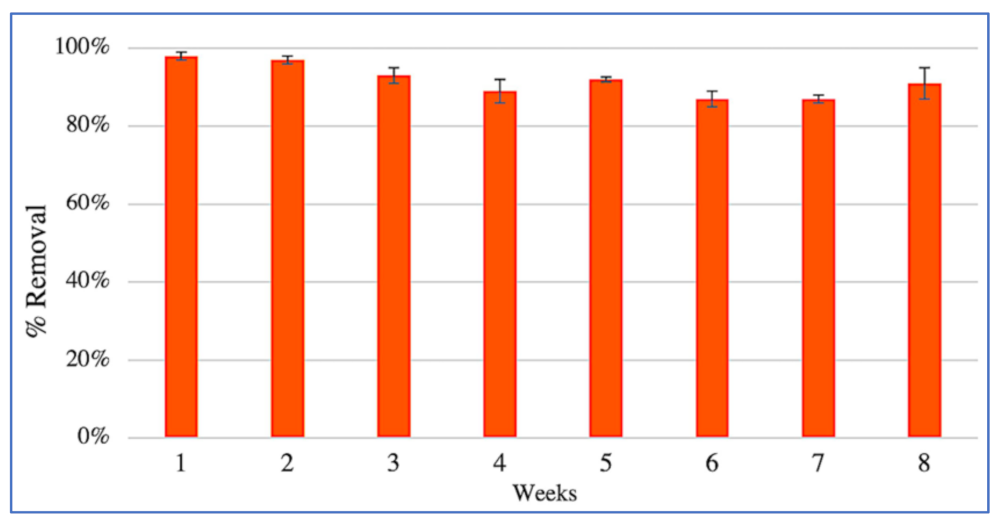
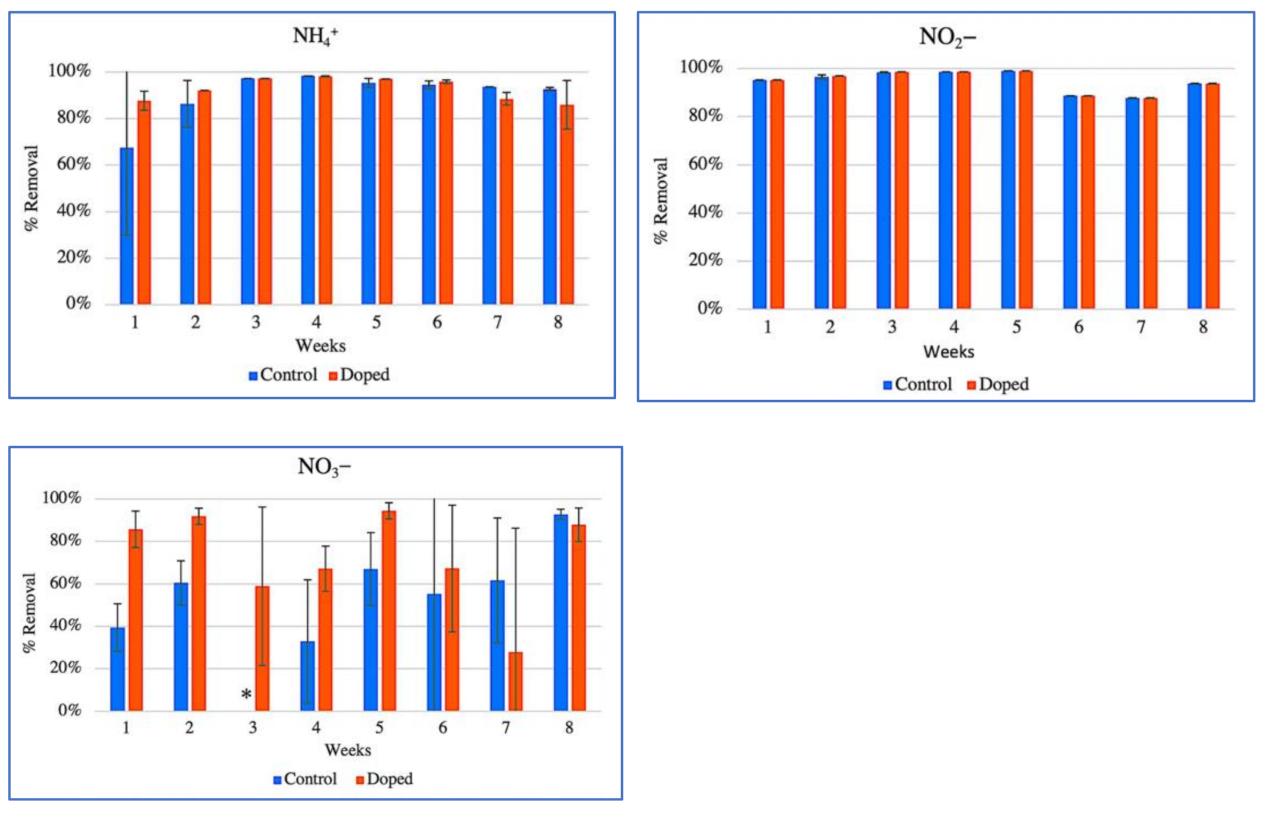
3.2. Removal of PCP and Nutrients from Contaminated Water by CWs Microcosms

Plants of all systems showed some decrease in their vitality (by visual inspection) along the 8 weeks of experiment.
PCP concentration in water from Ribeira de Joane and CWs effluents of control systems was always below detection limit (<4 × 10⁻⁵ μg·L−1). In CW effluents of the doped systems PCP was always detected, concentrations varying between 2.5 and 13 μg·L−1 (Table 2). Removals varied between 87% and 98% (Figure 2), being significantly higher (p < 0.05) in the first two weeks and statistically identical (p > 0.05) in the following weeks.
No PCP was detected in initial plant root bed substrate (T0) nor in plant root bed substrate from control systems at the end of the experiment (T8), with concentrations below the detection limit (<0.030 ng·g−1). In plant roots bed substrate from doped systems, PCP was detected (20 ± 9 ng·g−1) at the end of the experiment period (T8) indicating that the compound was retained in the CW systems without total degradation. Taking in consideration the amount of substrate in each microcosm (ca. 35 Kg), the amount of PCP introduced along the 8 weeks in each microcosm (1.2 g of PCP) and the amount of PCP still presented in the treated water, the amount of PCP detected in the substrate was ca. 66% of the PCP amount introduced in each CW system.
To evaluate a possible effect of PCP in CWs performance, organic matter (through COD) and nutrients (NH4+, NO2, NO3 and PO43− ions) removals were determined.
COD concentrations in water of Ribeira de Joane varied between 19 and 55 mg·L−1 (Table 3). COD removal percentages varied between 3% and 35% in control systems and between 8% and 48% in doped systems. COD removal percentages varied through time but no significant difference in COD removal percentages were observed (p > 0.05) between control and doped systems, except in week two. Therefore, the presence of PCP did not interfere with the removal efficiency of the CWs systems.
The NH4+ concentrations in CWs influent varied between 18 and 84 μmol·L−1 (Table S2). The NH4+ removal percentage in the systems was above 85%, except in week one of control with a removal percentage of 68 (±37)% (Figure 3). There were no significant differences between control and doped systems removal percentages (p > 0.05). The presence of PCP did not interfere with the removal capacity of CWs for this nutrient. The NO2 concentrations varied between 2.2 and 26.8 μmol·L−1 in influent of CWs (Table S2). In both systems, the removal percentages were always above 85% over the experimental period (Figure 3). No significant differences between systems (p > 0.05) were observed, therefore, the presence of PCP did not interfere with the removal efficiency of NO2. In influent of CWs the NO3 concentrations varied between 32 and 938 μM (Table S2). Along the 8 weeks, a high variation was observed in NO3 removal percentages for both systems (Figure 3). Up to week five it appears that the presence of PCP promoted the removal of NO3, but afterwards removals were identical. There was no relationship between influent concentration and removal percentage over time in both systems.
The PO43− concentration varied between 2.7 and 8.4 μmol·L−1 in influent of CWs (Table S2). Throughout the experimental time, there were no removals of PO43− by CWs systems, with the concentrations slightly increasing in CWs effluents.

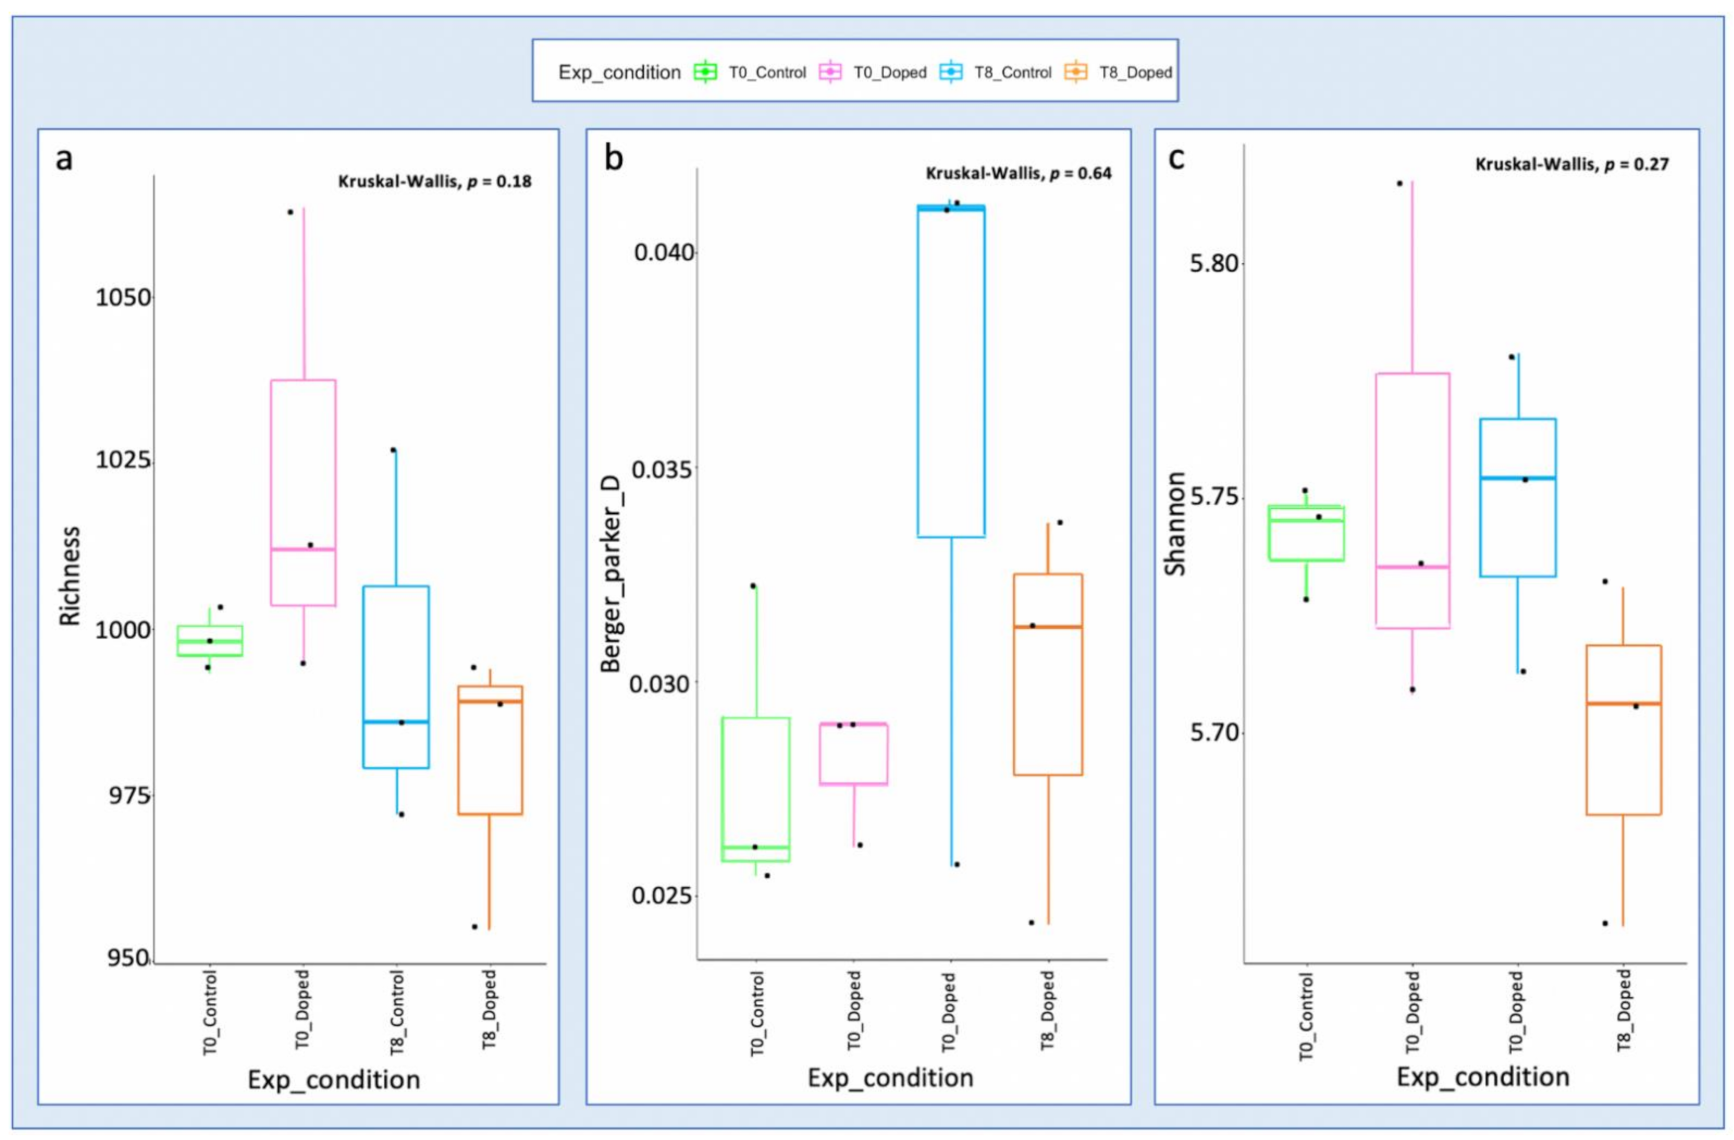
3.3. Impact of a Mixture of Alkylphenol Compounds on CWs Substrate Microbial Community

For the 12 collected samples, a total of 877,881 of V4–V5 16S rRNA gene sequences were generated by Illumina MiSeq which decreased to a total of 870,156 after the quality filtering performed by the sequencing company. A total of 767,470 quality checked merged reads (around 88% of the total dataset) were then submitted and processed by SILVAngs automatic pipeline that clustered into 172,430 OTUs and classified them using the SILVA reference database. The total number of sequences per sample ranged from 28,965 to 92,696 with an average of 63,956 ± 17,540 reads per sample. The number of OTUs per sample ranged from 7400 to 21,254 with an average of 14,369 ± 3380 sequence variants per sample (see details in Table S3). Bacteria domain represented around 96% of the total dataset, Archaea domain represented around 1% while the remaining 3% was classified into “No Relative” group (without any close relatives).
The alpha diversity varied between control and doped CWs systems (Figure 4), but no significant differences (Kruskal–Wallis, p > 0.05) were observed in terms of richness (number of observed OTUs), diversity (Shannon diversity index) or dominance (Berger–Parker index).
The analyses of the cluster dendrogram (Figure 5a) showed two groups according to similarity: the group of T0 (beginning of the experiment) and the group of T8 (end of the experiment) samples. The samples in T0 (samples from plant root bed before being subjected to doped stream water) were more similar to each other than to the T8 samples. The same is observed based on NMDS analysis (Figure 5b), two groups are formed in function of the experimental time (T0 and T8). The existence of similarity between initial samples was expected as plant roots bed origin was the same. Over the experimental time the experimental conditions influenced the microbial community structure, which showed a tendency towards greater specificity.
Taxonomic profile of the bacteria communities was performed at phylum, class and genus levels. At the phylum level, the three most abundant taxa were Proteobacteria (abundance up to 41%), Bacteroidetes (abundance up to 21%) and Planctomycetes (abundance up to 10%) (Figure 6a), being very similar among samples. Relatively to class level, four classes represented more than 50% of those with abundance > 1%. Three of those classes belong to the Proteobacteria phylum (classes Gammaproteobacteria, Alphaproteobacteria and Deltaproteobacteria) and the other class to the Acteroidetes phylum (class Bacteridia) (Figure 6b). When the analysis was made at the genus level, the 15 genera abundance across the samples represented up to 23% of genera community (Figure 6c) (average total number of genera per sample 453 ± 51, cut-off of 0.90%).
Multinominal Species Classification Method (CLAM) analysis was performed to identify the potential specialist taxa present in T8 doped (Figure 7b) when compared with T8 control (Figure 7a). CLAM uses a multinominal model based of relative abundance of estimated OTUs for two distinct conditions (“generalist” and “specialist”). Looking more specifically at samples collected at the end of the experiment, in samples from control CWs 25 different genera specialists were observed while in samples from doped CWs only 11 different genera specialists were observed. The most abundant specialist genera in control CWs were Kamptonema_PCC_6407 (13%), Rheinheimera (13%) and Pseudomonas (11%), while the doped CWs were dominated by Methylotenera (43%), Hyphomicrobium (19%) and Methylophilus (14%).
Regarding Archaea communities (which represented only ca. 1% of the entire community), the taxonomic profile showed they were represented by seven phyla (Altiarchaeota, Altiarchaeota, Asgardaeota, Crenarchaeota, Diapherotrites, Euryarchaeota, Nanoarchaeaeota, Thaumarchaeota) (Figure S3a). The most abundant taxa across all the samples, ca. 87% of the total community, were Thaumarchaeote (34–72%), Crenarchaeota (9–35%) and Nanoarchaeaeota (7–18%). At the class level, the three most abundant taxa across all the samples were Nitrososphaeria (34–72%), Bathyarchaeia (9–35%) and Woesearchaeia (6–18%) (Figure S3b). The presence of the mixture of NP and OP caused a significant decreased in Thaumarchaeote phylum (Nitrososphaeria class) and a significant increase in Crenarchaeota phylum (Bathyarchaea class).

3.4. Impact of PCP on CWs Substrate Microbial Community

For the 12 collected samples, a total of 887,135 of V4–V5 16S rRNA gene sequences were generated by Illumina MiSeq which decreased to a total of 883,920 after the quality filtering performed by the sequencing company. A total of 789,722 quality checked merged reads (around 89% of the total dataset) were then submitted and processed by SILVAngs automatic pipeline that clustered into 185,748 OTUs and classified them using the SILVA reference database. The total number of sequences per sample ranged from 52,216 to 95,767 with an average of 65,810 ± 13,681 reads per sample. The number of OTUs per sample range from 11,316 to 20,710 with an average of 15,479 ± 2847 sequence variants per sample (see details in Table S4). Bacteria domain represented around 94% of the total dataset, Archaea domain represented around 2% while the remaining 4% was classified into “No Relative” group (without any close relatives).
The alpha diversity varied between systems (Figure 8), but no significant differences (Kruskal–Wallis, p > 0.05) were observed in terms of richness (number of observed OTUs) or dominance (Berger–Parker index). In terms of diversity (Shannon diversity index), significant differences were observed among samples from control and from doped CWs systems at the end of the experiment (Kruskal–Wallis; p < 0.05), showing that the presence of PCP leads to a decrease in the microbial diversity.
The analyses of the cluster dendrogram (Figure 9a) showed two groups according with similarity, the group of T0 (beginning of the experiment) and the group of T8 (end of the experiment) samples. The samples in T8 were more similar to each other than to the T0 samples. T0 samples refer to plant root bed before being subjected to doped stream water. The same is observed based on the NMDS analysis (Figure 9b) and two groups are formed in the function of the experimental time (T0 and T8). The existence of similarity between initial samples was expected as plant root bed origin was the same. Over the experimental time, the experimental conditions influenced similarly the microbial community, which showed a tendency towards greater specificity.
For the bacteria domain, the three most abundant phyla were the same (Figure 10a): Proteobacteria, Bacteroidetes and Planctomycetes, being the percentage composition very similar among samples. Relatively to class level, four classes represented more than 50% of the group with abundance >1%. Three of those classes belong to Proteobacteria phylum (classes Gammaproteobacteria, Alphaproteobacteria and Deltaproteobacteria) and the other to Acteroidetes phylum (class Bacteridia) (Figure 10b). When the analysis was made at genus level, the fifteen genera more abundance represented between 20 to 26% of the total number of genera (Figure 10c) (average total number of genera per sample 799 ± 61, cut-off of 0.95%).
Looking more specifically at samples collected at the end of the experiment (T8), in samples from control CWs 25 different genera specialists were observed while in samples from doped CWs only 22 different genera specialists were observed, Figure 11a,b, respectively. The most abundant specialist genera in control CWs were Arenomonas (23%) and Liminiphilus (10%) while the doped CWs were dominated by Denitromonas (40%) and Xenococcus (33%).
Taxonomic profile of the Archaea community (which represent ca. 2% of the total community) showed that they were represented by seven phyla (Altiarchaeota, Asgardaeota, Crenarchaeota, Diapherotrites Euryarchaeota, Nanoarchaeaeota, Thaumarchaeota) (Figure S4a). At the phylum level, the three most abundant taxa, representing more than 80% of the total community, across all the samples were Thaumarchaeote (abundance between 60–87%), Crenarchaeota (6–19%) and Asgardaeota (3–10%). At the class level, the most abundant taxa across all the samples were Nitrososphaeria (abundance between 55–85%), Bathyarchaeia (5–18%), Woesearchaeia (1–7%) and Lokiaechaeia (2–8%) (Figure S4b). The presence of PCP did not interfere with the Archaea community, however, over time the experimental conditions influenced the Archaea community, with a slight increase of the dominant phylum Thaumarchaeota (Nitrososphaeria class).

4. Discussion

4.1. CW Performance

When testing the potential of CWs for the removal of persistent or emergent contaminants, one must assure that those contaminants do not affect the removal of conventional water parameters (e.g., organic matter and nutrients), which represents the main function of CWs. In the present study CWs microcosms maintained, in general, their function despite the presence of either a mixture of NP and OP or PCP.
In fact, NP and OP showed a negative impact on COD removal in an initial period, but the system was able to recover. PCP on the other hand did not showed any effect. Zhao et al. [39] also observed a decreased in COD removal when 4-clorophenol (4-CP) was present in the wastewater, also only in an initial stage after which the microbial community adapted to the presence of the contaminant.
CWs with vertical flow system can achieve high COD removal due to the high oxygen transfer from macrophyte roots into the rhizosphere through the wetland system [40], which can be potentiated with water recirculation as done in the current study, as higher amount of oxygen can stimulated microorganisms of the system to degrade organic matter [40]. COD removals were variable but were similar to those reported in other studies (e.g., [40,41]), in which removals depended on influent COD concentrations. COD concentration in influent varied along each experiment and between experiments. In fact, the composition of Ribeira de Joane stream water varied along time, being also affected by some heavy rains which lead to a higher flow and a dilution effect. COD concentrations variation in CWs effluents can also be related with system performance, namely with other oxygen-consuming reactions such as nitrification of ammonia and/or plants life cycle [42].
The main mechanisms for nitrogen removal in CWs are plant uptake, mineralization, nitrification, denitrification, volatilization, adsorption and sedimentation [43]. Not all CWs system types can perform high nitrogen removal efficiency, for instance, VFCWs are advantage for nitrification [43]. In this study, accordingly, NH4+ and NO2 removals were high, reaching values above 85% in both experiments, similar to other studies (e.g., [43]). Despite some removal variability, no relationship with influent concentrations was observed. On the other hand, removals of NO3 varied between experiments, being higher than 85% in experiment#1 and between 60 and 80% in experiment #2 with high variability. In the case of VFCWs, denitrification process can happen in anaerobic microsites and during the loading phase of the CWs substrate bed [44]. The process is also significantly affected by temperature, carbon source, loading rate as well as dissolved oxygen [44]. NO3 influent concentrations varied along time and were lower in experiment#2, along also with lower COD levels. Low carbon amount can restrict the process of denitrification [44]. This can explain the difference between experiments. In both experiments, the presence of target contaminants (NP plus OP and PCP) did not interfered in nitrogen removal, although other studies reported that some pollutants (e.g., PAHs) can inhibited the abundance and activity of nitrifying bacteria decreasing NH4+ removal [45]. In the present study, PCP seemed to slightly promote NO3 removal in the initial period. PCP can be an extra carbon source, as observed in another study where PAHs promoted denitrification [45].
Phosphorus removal occurs mainly due to physical-chemical processes such as precipitation, sedimentation and substrate adsorption and uptake by plants [43]. In experiment#1 PO43− removal was observed, although with a high variability, whereas in experiment#2 PO43− was not removed. Removal efficiency of PO43− can depended on input concentrations [46], but also on the substrate used. PO43− removal in CWs is generally low [43] and substrate saturation can lead to PO43− released in effluents, showing an insufficient high capacity to bind phosphorus for a prolonged period. In the present study, in experiment#2 the substrate, although identical to that of experiment#1, probably did not adsorb this nutrient. Moreover, PO43− can also be released by plants aboveground tissues during plant decay [43]. In fact, some plants of CWs in experiment#2 showed signs of aging during experimental period. The presence of target contaminants (NP plus OP and PCP) did not interfere in phosphorus removal. Other studies have reported an inhibitory effect in PO43− removal due to the presence of other contaminants, namely norfloxacin [47] and ciprofloxacin [48].
Therefore, in the present study, phenolic contaminants did not affect CW performance for nutrients removal.

4.2. Alkylphenols and Chlorophenols Removal in CW Systems

In this study, both alkylphenols NP and OP were completely removed, indicating that CWs were able to effectively remove a mixture of these compounds from the doped stream water. To our knowledge no studies have reported the removal of NP and OP in CW with vertical flow. Removals in CWs with other designs were in general lower: 54% NP removal in horizontal flow CW [49]; 58% for OP and 32% for NP removal in a hybrid CW [50]; 90% for NP and 85% for OP removal in free water surface CW [51].
For PCP slightly lower removal percentages (between 87 and 98%) than those of NP and OP were observed, removals similar to those reported in other studies [52], for instance, 89% of PCP removal from pulp and paper mill wastewater through VFCW planted with Canna indica.
In CWs, alkylphenols and chlorophenol compounds may be removed by a number of processes, including adsorption and absorption, microbial degradation and uptake by plants [50,52]. Considering the high log Kow (4.5, 5.3 and 5.0 for NP, OP and PCP, respectively) and low solubility (7 mg·L−1, 5 mg·L−1 and 14 mg·L−1 for NP, OP and PCP, respectively), high adsorption/absorption of the compounds to CWs substrate is expected [53,54], as observed in other studies [52]. In the present study, NP was not detected in CW substrate, whereas PCP and OP were detected, indicating that adsorption occurred. However, other processes such as microbial degradation and plant uptake certainly occurred, leading to compound removal.
OP was detected in CW substrate of both systems (irrigated with stream water not doped or doped), with no significant differences between them. This indicates that the presence of OP in CW substrate was probably not related to the water doping done weekly. Sediment collected in the estuary of Lima river-Viana do Castelo and used as substrate in CW after mixing with sand, was already contaminated with OP (0.53 ± 0.03 μg·g−1) but not with NP (NP below detection limit). This result indicates that probably the new OP contamination (OP added to Ribeira de Joane stream water) was more easily available than the old contamination, the compound being more strongly bound in the latter due to significant diffusion into particle inner structure. Lower release from aged soil relatively to freshly contaminated soil could be due to differences in sediment-water partitioning (Kp) values and the compartmentation of sorbed molecules in soil matrix leading to nonlabile vs. labile sorbed fraction [55]. A similar behavior of OP desorption from sediment has been reported [56], showing that in the long-term OP can become more persistent. In addition, biodegradation may be limited due to slow desorption kinetics especially when dealing with aged sediments [57]. Several studies observed that bioavailability of contaminants in aged soil can be considerably lower than in spiked soil [58,59,60], which can also justify the detection of OP in CW substrate. Additionally, characteristics like acidity, alkalinity, polarity and polarization of organic contaminants also affect the adsorption behavior of charged substances. According to Hamker and Thompsom [61], slightly acidic organic contaminants dissociate to form anionic substances repulsive to negative charges on soil surface in an alkaline environment, resulting in a poor adsorption of the contaminants by soil. The acidic characteristic of PCP (pKa = 4.7) and strong acidic characteristic of NP and OP (both pKa = 10) and the alkaline environment (pH = 8) of CWs systems might also not favor strong adsorption to CW substrate when a fresh input occurs. On the other hand, the concentration of organic matter in CW substrate might also affect this process [62]. In the case of PCP, adsorption of the fresh input occurred with all the mentioned processes contributing for its retention within the system. The adsorption/absorption process suggests transfer of the compound from the water column to the substrate which is not a definitive elimination, as in the future the residues adsorbed could become bioavailable and be a source of toxicity to aquatic environments. In this sense, the degradation and/or transformation in a less toxic compound needs to take place for a permanent elimination.
As mentioned, the undetected or low detected concentration of the target compounds in effluent and substrate of CWs exposed to doped stream water, showed that, beyond the adsorption/absorption process, other biologic processes promoted by plants and/or microbial communities (i.e., uptake, accumulation and degradation and/or transformation) probably took place in CWs systems. In fact, NP and OP introduced in the CW systems were eliminated and for PCP ca. 33% was also removed (only 66% of the doped PCP amount was detected in the CW substrate). Wetland macrophytes have shown great potential for the phytoremediation of organic contaminants [19,63,64,65]. According to Zhang et al. [66], when the molecular mass (MM) of an organic pollutant is below 1000, it can be easily taken up by plant roots. Based on this information, in the present work, the uptake NP (MM = 220 g·mol−1), OP (MM = 206 g·mol−1) and PCP (MM = 266.3 g·mol−1) by P. australis might have occurred. For instance, Zhao et al. [67] observed that emergent macrophytes (P. communi, T. orientalis, S. validus) can uptake and accumulated PCP in their belowground parts. The difficulty in the transport from root tissues to upper part tissues of the plant observed by Zhao et al. [67] was attributed to the high hydrophobicity of PCP (log Kow 5.01). High log Kow indicate a limited ability of compounds to be taken up through the plant cell membrane [68], but can imply absorption by root epidermis [66]. In this sense, the high hydrophobicity of the NP (log Kow 5.76) and OP (log Kow 4.8) might have promoted the accumulation of these compounds in belowground part of P. australis in the present work. Furthermore, hydrophobic chemicals have affinity to be retained in the lipids of the root epidermis and surrounding mucilage [69]. The high root density of P. australis allows the interaction of the influent to contact with a high area of root surface and associated biological films facilitating microbial degradation and possibly plant uptake of estrogenic compounds [21].
Moreover, numerous studies have shown that plants promote microbial degradation of organic pollutants [14,70] by an increase in microbial abundance, enhancement of microbial activity and/or modifications of the microbial community structure in the rhizosphere [71]. For instance, Toro-Vélez et al. [19] observed a clear increased in removal percentage of NP in the presence of plants. These authors also observed that Heliconia sp. showed a higher efficiency for NP removal than P. australis, possibly due to microenvironments associated to the Heliconia sp. rhizosphere. In the case of PCP, similar results was observed by Hechmi et al. [72], with PCP removal rate increasing significantly (between 15 and 20%) in the presence of P. australis. Additionally, these authors also observed a significant positive correlation between indicators of soil microbial activity (dehydrogenase activity-DHA) and removal of PCP in planted soil, which implied that plant root exudates promoted the rhizosphere microorganisms and enzyme activity, thereby improving biodegradation of PCP. Additionally, Hechmi et al. [73] observed that P. australis rhizosphere soil compared to the other terrestrial plants also showed a greater PCP biodegradation efficiency.
According to Huang et al. [74], the definitive removal of compounds from sediments/soils can be the synergetic effects of plants and microorganisms, and sometimes the effect of microorganisms may contribute the most. Rhizodegradation of alkylphenols, specifically NP and OP, occurs in aerobic conditions in various environments [75,76,77]. Some microorganisms possess the ability to assimilate alkylphenols as a sole carbon and energy source [78,79] and Toyama et al. [80] isolated bacteria with ability to degrade NP and OP from P. australis rhizosphere. In the case of PCP, DʹAngelo and Reddy [81] observed that under laboratory conditions no PCP degradation occurred in wetland soil which had been sterilized but the compound was degraded in nonsterile soil, suggesting that PCP degradation was due to biological activity and that most wetland soils contain microorganisms with capacity to degrade PCP despite no known history of contamination. However, these authors consider that this soil capacity was regulated by contamination level, type of electron acceptors and donors and microbial biomass. Therefore, current results indicate a potential degradation of the target compounds by microbial communities present in plant bed substrate, with the CWs system providing chemical and biological conditions for this biological process to occur.
Therefore, CWs were able to remediate water contaminated with a mixture of NP and OP, with a significant removal of the compounds from the water and from the CWs systems, showing that CWs with vertical flow can be a suitable option due to the combined action of plants and microorganisms. Nevertheless, OP removal only occurred for a fresh contamination indicating the need for the compound to be bioavailable. However, for PCP, despite the high removal observed, a small percentage of the compound was still present in CWs effluent (<10%). Moreover, PCP was also detected in CW substrate indicating that the microbial community was not able to totally degrade this compound. Therefore, optimization of CW processes is needed to fully remove this compound. Microbial communities’ characterization can help to highlight the processes occurring in CWs, contributing for its improvement.

4.3. Microbial Communities’ Characterization

Alpha diversity analysis showed that the alkylphenol compounds (NP and OP) did not significantly impact the microbial community, whereas the presence of PCP leaded to a decrease of the microbial diversity in CWs substrate at the end of the experiment. The impact of PCP in microbial diversity has been already observed in compost bacterial community [82], in aerobic granular sludge doped with PCP [83] and in soil acclimated with PCP [84]. In addition, Xu et al. [85] observed that the microbial community of a mangrove soil was greatly influenced by PCP, with the preferential growth of bacterial groups that were active during PCP transformation, which might inhibit and compete with other bacteria for the limited living space and resources. Therefore, CWs microbial communities adapted to the presence of the contaminants, probably selecting the communities with capability to resist and degrade the compounds, leading also to the compounds biodegradation observed in CWs systems.
However, microbial community structure showed that there was also an adaptation of the microbial community to the CW system conditions and not only to the presence of each contaminant. In both experiments, the “initial” microbial community (in T0) was different of the microbial community at the end of the experiment (in T8) independently of the exposure to non-doped or doped stream water. Over time, a natural species selection in the microbial community of each CW microcosms was observed, showing an adaptation to the experimental conditions.
In the current study, the following bacterial phyla with abundance above 1% in CW substrate were detected: Acidobacteria, Actinobacteria, Bacteroidetes, Dependentiae, Chloroflexi, Cyanobacteria, Firmicutes, Gemmatimonadetes, Thaumarchaeota, Nitrospirae, Planctomycetes, Proteobacteria and Verrucomicrobia. With the exception of the phylum Dependentiae that was identified only in microbial community of experiment#2 (exposure to PCP), the remaining bacterial phyla were identified in CWs substrate from both experiments. A similar bacterial community with capacity to degraded NP was detected in river sediment: Acidobacteria, Actinobacteria, Bacteroidetes, Chloroflexi, Cyanobacteria, Firmicutes, Gemmatimonadetes, Nitrospirae, Planctomycetes, Proteobacteria and Verrucomicrobia [86].
Most of the phyla identified in this study have been discussed in the literature on their contribution in CWs treating wastewater, e.g., [87,88,89,90] and on their contribution to the biodegradation or biotransformation of different types of emerging contaminants [87,91,92].
Plant species-specificity, with similar rhizobacterial communities, can be found in different environments where the same plant is present [93,94]. For instance, Calheiros et al. [95] have studied the microbial community of the same plant used in this study (P. australis) but retrieved from substrate samples of the CWs treating industrial wastewater and reported several phyla similar to those observed in this work, such as Proteobacteria, Bacteroidetes, Firmicutes and Actinobacteria.
The microbial degradation is reported to be the more important process by which organic compounds are biodegraded/biotransformed into less toxic, persistent and complex metabolites [96]. In this study, the Proteobacteria, Bacteroidetes and Planctomycetes were the three more abundant phyla in both experiments with relative abundance 58–72%. Due to their diversity and marked adaptability, these dominant phyla are able to degrade a variety of environmental organic contaminants, and also dominate the microbial community of the CW rhizosphere in wastewater treatment, e.g., [87,89,90]. Previous studies reported that Proteobacteria and Bacteroidetes are part of the dominant phyla group in NP anaerobic degradation in river sediments [86,97], Proteobacteria and Firmicutes [98] are important in OP biodegradation in granular sludge and Proteobacteria, Bacteroidetes and Firmicutes can be the predominant phyla responsible for the dechlorination of chlorinated compounds like PCP [99,100]. Therefore, in this work, the dominant phyla present in P. australis rhizosphere of CWs may have contributed to the effective biodegradation/biotransformation of NP, OP and PCP. Moreover, Xu et al. [85] reported that the abundance of Bacteroidetes, Firmicutes, Proteobacteria and Euyarchaeota varied greatly during PCP dechlorination process.
The impact of OP to bacterial community of CWs substrate remains poorly understood. On the other hand, a few previous studies indicated that NP addition showed no or little impact on aquatic bacterial community structure [101,102,103]. In contrast, Stenrød et al. [104] and Wang et al. [105] found that NP affected soil bacterial community structure. Moreover, Wang et al. [86] verify that NP presence and biodegradation altered the sediment bacterial community structure at the phylogenetic levels of phylum, class and genus. Nevertheless, compounds concentrations can affect microbial communities’ response. Domene et al. [106] indicated that soil microbial community did not change significantly at NP concentration below 90 μg·g−1, but changed at 270 μg·g−1. Wang et al. [86] reported that an NP concentration of 100 μg·g−1 had a strong impact on sediment bacterial community structure at phylogenetic levels of phylum, class and genus. Regarding OP toxicity, Liu et al. [98] reported a toxicity effect for degrading microorganisms present in granular sludge at a concentration of 220 μg·L−1, but not for concentrations of 120 and 30 μg·L−1, the toxicity affecting the degradation rate of OP.
Comparison of substrate exposed to doped stream water with that of control systems showed that several specialist genera were enriched following exposure to the alkylphenol compounds, suggesting a growth benefit for target compounds biodegradation. In doped systems substrate, the three more abundant specialist genera were Methylotenera (methylophilaceae family), Hyphomicrobium (hyphomicrobiaceae family) and Methylophilus (methylophilaceae family). The genera Methylotenera and Methylophilus are from the same family, the Methylophilaceae. Members of this family have been previously described to utilize some organic pollutants as an energy source [107], degrading benazolin-ethyl from activated sludge [108], methanol present in industrial sewage [109] and PAH [110]. Lu et al. [110] have suggested that this family might have the ability to use ring-hydroxylating-dioxygenase (RHDα) genes in pollutants degradation. These genes encode for dioxygenases and monooxygenases enzymes, that are involved in aerobic degradation pathways [111]. According to Tuan et al. [112], the hydroxylases and ring-cleavage dioxygenase are involved in long-chain alkylphenol degradation pathways. This same study identified in Methylobacterium genus, from Methylophilaceae family, the presence of the genes that encode these key enzymes in alkylphenol degradation pathways. Moreover, Methylobacillus genus from this family has been linked to degradation of a variety of phenolic compounds [113]. Considering the great representation that the members of Methylophilaceae family have in groups of “specialist genera” in the presence of NP and OP, members of Methylophilaceae family probably had an important role in the degradation of NP and OP in the present study. The genus Hyphomicrobium, from Hyphomicrobiaceae family are linked to degradation of a variety of phenolic compounds [113] more specifically to NP degradation in lab-scale column soil [114] and in sludge at lab condition [115]. Based in these reports and in the presence of this genus among the “specialist genera” in systems doped with NP and OP in the present study, this genus probably played an important role in the NP and OP degradation.
As previous mention, PCP can affect the structure of the microbial community. For instance, Liu et al. [83] reported changes in aerobic granular sludge microbial community but only at PCP concentrations between 100 and 200 μg·g−1, with no changes below 100 μg·g−1. In the present study, the comparison of substrate exposed to doped stream water with that of control systems, indicated that several specialist genera were enriched following exposure to the chlorophenol compound, suggesting a growth benefit for target compounds biodegradation. The three more abundance genera in doped samples were: Denitromonas (Rhodocyclaceae family), Xenococcus_PCC_7305 (Xenococcaceae family) and Rhodocyclaceae_uncultured (Rhodocyclaceae family). Members of the Rhodocyclaceae family have been described to use organic pollutants as a food source [107] and have a prominent role in the degradation of aromatic compounds such as toluene [116], benzene [117], quinoline [118] and PAHs [119,120], including pyrene [121] and phenanthrene [122]. Important genes in PAH biodegradation, PAH-specific dioxygenase genes, are found in this bacterial family [122], showing anaerobic pathway for aromatic degradation that includes the benzylsuccinate synthase genes and central benzoyl-CoA reductase in Dechloromonas genus [123]. This bezoyl-CoA reductase is an important enzyme in pathway PCP degradation [124,125]. According to Tong et al. [126], the Dechloromonas genus is associated with PCP anaerobic degradation process. The biodegradation of PCP can occur by different processes: hydroxylation, oxygenolysis and reductive dichlorination [127,128]. Moreover, the intermediates of PCP metabolism indicated that carbon ring-cleavage had taken place after dichlorination process [126]. In the PCP degradation, two important steps for ring-cleavage, including hydroxylation and carboxylation, can occur [129]. Microorganisms belonging to the family of Rhodocyclaceae, i.e., Azoarcus or Thauera genus [117,130] can act as the degraders into these two steps [126]. Therefore, the Denitromonas genus may have had an important role in degradation of PCP in this work. The Xenococcus_PCC_7305 from Xenococcaceae family is the cyanobacteria species with higher proportion in the group of “specialist genera”. There is no information about the Xenococcaceae family (Nostocales order) being associated to degradation of organic compounds. Sometimes cyanobacteria do not have a direct role in the degradation process, but cyanobacteria exudates can provide an endogenous source of growth substrates to bacteria [131], promoting degradation of contaminants.
Regarding Archaea, which represented only 1–2% of the global microbial community, the phylum with more representation was Thaumarchaeota (Nitrososphaeria class). This phylum has shown an important role in nitrification process [131], as well as the capacity to aerobically degrade of crude oil [130]. However, no information is available regarding their possible role in alkylphenol and/or chlorophenol compounds degradation.

5. Conclusions

Obtained results show that CWs can be a suitable option for the removal of different families of phenolic compounds. In fact, CWs systems, assembled in controlled laboratory conditions, showed to be able to remove totally, in the case of alkylphenolic compounds, or in high amounts, in the case of a chlorophenolic compound, these contaminants from a contaminated stream water. In addition, in both experiments, CWs systems were able to maintain high removal rates of organic matter and nutrients and the presence of either contaminant, alone or in a mixture, did not interfere with this removal process. Therefore, phenolic compounds presence did not affect significantly CWs functionality.
The microbial community in CW substrates was composed mostly by bacteria. Richness, diversity or dominance of microbial community was not affected by the presence of alkyphenolic compounds (a mixture of NP and OP), but the presence of PCP cause a decrease in microbial community diversity. Microbial community characterization in CW plant root bed substrate showed several phyla commonly present in CWs substrate, namely those characteristic of P. australis rhizosphere, and those commonly associated with contaminants degradation. Moreover, there was a selection, at least at the genera level, of bacteria with capacity to degrade the select phenolic compounds. Different bacteria were observed comparing systems exposed to alkylphenol and chlorophenol compounds, bacteria that probably contributed for compounds biodegradation, decreasing their amount in CW systems. Promotion of the presence of these bacteria, through for instance, bioaugmentation strategies, could be an option to increase the performance of CWs for the remediation of water contaminated with phenolic compounds, particularly for PCP which showed lower degradation rates, deserving further research.
The present study contributes to increase the knowledge regarding CWs performance and to promote the use of this nature-based solution for the treatment of waters contaminated with different families of phenolic contaminants, a relevant issue taken in consideration their negative impact on the environment. CWs can contribute to eliminate or reduce that impact, protecting ecosystems.

Supplementary Materials

The following are available online at https://www.mdpi.com/2073-4441/13/5/715/s1, Figure S1: Schematic graphical assembly of CWs with a flow recirculation and a modified bed used in both experimental works, Figure S2: The experimental design (a) and sediment sampling in each CW (b), Figure S3: (A) Abundance of the major phyla and (B) classes with abundance > 1% of Archae across the different CWs systems substrates, irrigated along eight weeks with Ribeira de Joane water not doped (control) or doped with NP and OP. Samples collected at the beginning (T0) and at the end of the experiment (T8) (n = 3), Figure S4: (A) Abundance of the major phyla and (B) classes with abundance > 1% of Archae across the different CWs systems substrates, irrigated along eight weeks with Ribeira de Joane water not doped (control) or doped with PCP. Samples collected at the beginning (T0) and at the end of the experiment (T8) (n = 3), Table S1: Concentration of ammonia (NH4+), nitrite (NO2), nitrate (NO3) and phosphate (PO43−) ions in influent and effluent of CWs (mean and standard deviation, n = 3), irrigated along eight weeks with Ribeira de Joane water not doped (control) or doped with NP and OP, Table S2: Concentration of ammonia (NH4+), nitrite (NO2), nitrate (NO3) and phosphate (PO43−) ions in influent and effluent of CWs (mean and standard deviation, n = 3), irrigated along eight weeks with Ribeira de Joane water not doped (control) or doped with PCP. Table S3: Summary statistics of 16S rRNA gene amplicon sequencing for experiment#1, Table S4: Summary statistics of 16S rRNA gene amplicon sequencing for experiment#2.

Author Contributions

Conceptualization, I.P.F.M.M., A.P.M. and C.M.R.A.; methodology, I.P.F.M.M., M.P.T., A.P.M. and C.M.R.A.; validation, I.P.F.M.M., M.P.T., A.P.M. and C.M.R.A.; formal analysis, I.P.F.M.M. and M.P.T.; investigation, I.P.F.M.M., A.P.M. and C.M.R.A.; resources, A.P.M., C.R.G. and C.M.R.A.; writing—original draft preparation, I.P.F.M.M.; writing—review and editing, M.P.T., C.R.G., C.M.R.A. and A.P.M.; supervision, C.R.G., A.P.M. and C.M.R.A.; project administration, A.P.M. and C.M.R.A.; funding acquisition, A.P.M. and C.M.R.A. All authors have read and agreed to the published version of the manuscript.

Funding

This research was partially supported by national funds through FCT—Foundation for Science and Technology within the scope of UIDB/04423/2020 and UIDP/04423/2020 and by the structured program of R&D&I ATLANTIDA—Platform for the monitoring of the North Atlantic Ocean and tools for the sustainable exploitation of the marine resources (reference NORTE-01-0145-FEDER-000040), supported by the North Portugal Regional Operational Program (NORTE2020), through the European Regional Development Fund (ERDF).

Institutional Review Board Statement

Not applicable.

Informed Consent Statement

Not applicable.

Data Availability Statement

All data is included in the article and respective supplementary material.

Acknowledgments

Authors would like to thank Cristina Rocha and Sofia Dias for collaboration in the phenolic compounds analysis, Filipa Santos for collaboration in molecular biology analysis and Roberta Piredda for insight about results of molecular biology.

Conflicts of Interest

The authors declare no conflict of interest.

References

  1. United States Environmental Protection Agency. Special Report on Environmental Endocrine Disruption: An Effects Assessment and Analysis; UESPA: Washington, DC, USA, 1997. [Google Scholar]
  2. Sharma, V.K.; Anquandah, G.A.K.; Yngard, R.A.; Kim, H.; Fekete, J.; Bouzek, K.; Ray, A.K.; Golovko, D. Nonylphenol, Octylphenol, and Bisphenol-A in the Aquatic Environment: A Review on Occurrence, Fate, and Treatment. J. Environ. Sci. Health Part A Toxic Hazard. Subst. Environ. Eng. 2009, 44, 423–442. [Google Scholar] [CrossRef]
  3. Orton, F.; Lutz, I.; Kloas, W.; Routledge, E.J. Endocrine Disrupting Effects of Herbicides and Pentachlorophenol: In Vitro and In Vivo Evidence. Environ. Sci. Technol. 2009, 43, 2144–2150. [Google Scholar] [CrossRef] [PubMed]
  4. Water Framework Directive. Directive of the European Parliament and of the Council 2000/60/EC. Off. J. Eur. Parliam. 2000, 327, 1–82. [Google Scholar]
  5. United States Environmental Protection Agency. USEPA 2008. US Environmental Protection Agency. In Registration Eligibility Decision for Pentachlorophenol. Available online: http://www.epa.gov/oppsrrd1/REDs/pentachlorophenol_red.pdf (accessed on 30 January 2020).
  6. Routt, R.J.; Roberts, J.R. Recognition and Management of Pesticide Poisonings; USEPA: Washington, DC, USA, 1999; p. 236. [Google Scholar]
  7. Renner, R. European Bans on Surfactant Trigger Transatlantic Debate. Environ. Sci. Technol. 1997, 31, 316–320. [Google Scholar] [CrossRef]
  8. Visvanathan, C.; Thu, L.N.; Jegatheesan, V.; Anotai, J. Biodegradation of Pentachlorophenol in a Membrane Bioreactor. Desalination 2005, 183, 455–464. [Google Scholar] [CrossRef]
  9. Yang, S.; Shibata, A.; Yoshida, N.; Katayama, A. Anaerobic Mineralization of Pentachlorophenol (PCP) by Combining PCP-Dechlorinating and Phenol-Degrading Cultures. Biotechnol. Bioeng. 2009, 102, 81–90. [Google Scholar] [CrossRef] [PubMed]
  10. Furuichi, T.; Kannan, K.; Giesy, J.P.; Masunaga, S. Contribution of Known Endocrine Disrupting Substances to the Estrogenic Activity in Tama River Water Samples from Japan Using Instrumental Analysis and in Vitro Reporter Gene Assay. Water Res. 2004, 38, 4491–4501. [Google Scholar] [CrossRef]
  11. Zhang, Z.; Feng, Y.; Gao, P.; Wang, C.; Ren, N. Occurrence and Removal Efficiencies of Eight EDCs and Estrogenicity in a STP. J. Environ. Monit. 2011, 13, 1366–1373. [Google Scholar] [CrossRef]
  12. Sun, Y.; Huang, H.; Sun, Y.; Wang, C.; Shi, X.-L.; Hu, H.-Y.; Kameya, T.; Fujie, K. Ecological Risk of Estrogenic Endocrine Disrupting Chemicals in Sewage Plant Effluent and Reclaimed Water. Environ. Pollut. 2013, 180, 339–344. [Google Scholar] [CrossRef]
  13. Leech, D.M.; Snyder, M.T.; Wetzel, R.G. Natural Organic Matter and Sunlight Accelerate the Degradation of 17ß-Estradiol in Water. Sci. Total Environ. 2009, 407, 2087–2092. [Google Scholar] [CrossRef]
  14. Yang, X.; Flowers, R.C.; Weinberg, H.S.; Singer, P.C. Occurrence and Removal of Pharmaceuticals and Personal Care Products (PPCPs) in an Advanced Wastewater Reclamation Plant. Water Res. 2011, 45, 5218–5228. [Google Scholar] [CrossRef]
  15. Zhang, D.Q.; Gersberg, R.M.; Hua, T.; Zhu, J.; Tuan, N.A.; Tan, S.K. Pharmaceutical Removal in Tropical Subsurface Flow Constructed Wetlands at Varying Hydraulic Loading Rates. Chemosphere 2012, 87, 273–277. [Google Scholar] [CrossRef]
  16. Matamoros, V.; Bayona, J.M. Behavior of emerging pollutants in constructed wetlands. In Emerging Contaminants from Industrial and Municipal Waste; Barceló, D., Petrovic, M., Eds.; Springer: Berlin/Heidelberg, Germany, 2008; Volume 5, pp. 199–214. [Google Scholar] [CrossRef]
  17. Wirasnita, R.; Mori, K.; Toyama, T. Effect of Activated Carbon on Removal of Four Phenolic Endocrine-Disrupting Compounds, Bisphenol A, Bisphenol F, Bisphenol S, and 4-Tert-Butylphenol in Constructed Wetlands. Chemosphere 2018, 210, 717–725. [Google Scholar] [CrossRef] [PubMed]
  18. Fujii, D.A.D.; Soda, S.; Machimura, T.; Ike, M. Removal of Phenol, Bisphenol A, and 4-Tert-Butylphenol from Synthetic Landfill Leachate by Vertical Flow Constructed Wetlands. Sci. Total Environ. 2017, 578, 566–576. [Google Scholar] [CrossRef]
  19. Toro-Vélez, A.F.; Madera-Parra, C.A.; Peña-Varón, M.R.; Lee, W.Y.; Bezares-Cruz, J.C.; Walker, W.S.; Cárdenas-Henao, H.; Quesada-Calderón, S.; García-Hernández, H.; Lens, P.N.L. BPA and NP Removal from Municipal Wastewater by Tropical Horizontal Subsurface Constructed Wetlands. Sci. Total Environ. 2016, 542, 93–101. [Google Scholar] [CrossRef] [PubMed]
  20. Papaevangelou, V.A.; Gikas, G.D.; Tsihrintzis, V.A.; Antonopoulou, M.; Konstantinou, I.K. Removal of Endocrine Disrupting Chemicals in HSF and VF Pilot-Scale Constructed Wetlands. Chem. Eng. J. 2016, 294, 146–156. [Google Scholar] [CrossRef]
  21. Song, H.-L.; Nakano, K.; Taniguchi, T.; Nomura, M.; Nishimura, O. Estrogen Removal from Treated Municipal Effluent in Small-Scale Constructed Wetland with Different Depth. Bioresour. Technol. 2009, 100, 2945–2951. [Google Scholar] [CrossRef] [PubMed]
  22. Song, H.-L.; Yang, X.-L.; Nakano, K.; Nomura, M.; Nishimura, O.; Li, X.-N. Elimination of Estrogens and Estrogenic Activity from Sewage Treatment Works Effluents in Subsurface and Surface Flow Constructed Wetlands. Int. J. Environ. Anal. Chem. 2011, 91, 600–614. [Google Scholar] [CrossRef]
  23. Carvalho, P.N.; Araújo, J.L.; Mucha, A.P.; Basto, M.C.P.; Almeida, C.M.R. Potential of Constructed Wetlands Microcosms for the Removal of Veterinary Pharmaceuticals from Livestock Wastewater. Bioresour. Technol. 2013, 134, 412–416. [Google Scholar] [CrossRef]
  24. Gorito, A.M.; Ribeiro, A.R.; Gomes, C.R.; Almeida, C.M.R.; Silva, A.M.T. Constructed Wetland Microcosms for the Removal of Organic Micropollutants from Freshwater Aquaculture Effluents. Sci. Total Environ. 2018, 644, 1171–1180. [Google Scholar] [CrossRef]
  25. Gorito, A.M.; Ribeiro, A.R.; Almeida, C.M.R.; Silva, A.M.T. A Review on the Application of Constructed Wetlands for the Removal of Priority Substances and Contaminants of Emerging Concern Listed in Recently Launched EU Legislation. Environ. Pollut. 2017, 227, 428–443. [Google Scholar] [CrossRef] [PubMed]
  26. Grasshoff, K.; Ehrhardt, M.; Kremling, K. Methods of Seawater Analysis. Second, Revised and Extended Edition. Chemical Oceanography; Academia Press: London, UK; New York, NY, USA, 1983. [Google Scholar]
  27. Jones, M.N. Nitrate Reduction by Shaking with Cadmium: Alternative to Cadmium Columns. Water Res. 1984, 18, 643–646. [Google Scholar] [CrossRef]
  28. De Morais, P.; Stoichev, T.; Basto, M.C.P.; Carvalho, P.N.; Vasconcelos, M.T.S.D. A Headspace SPME-GC-ECD Method Suitable for Determination of Chlorophenols in Water Samples. Anal. Bioanal. Chem. 2011, 399, 2531–2538. [Google Scholar] [CrossRef] [PubMed]
  29. Parada, A.E.; Needham, D.M.; Fuhrman, J.A. Every Base Matters: Assessing Small Subunit RRNA Primers for Marine Microbiomes with Mock Communities, Time Series and Global Field Samples. Environ. Microbiol. 2016, 18, 1403–1414. [Google Scholar] [CrossRef]
  30. Bragança, I.; Mucha, A.P.; Tomasino, M.P.; Santos, F.; Lemos, P.C.; Delerue-Matos, C.; Domingues, V.F. Deltamethrin Impact in a Cabbage Planted Soil: Degradation and Effect on Microbial Community Structure. Chemosphere 2019, 220, 1179–1186. [Google Scholar] [CrossRef]
  31. Calheiros, C.S.C.; Carecho, J.; Tomasino, M.P.; Almeida, C.M.R.; Mucha, A.P. Floating Wetland Islands Implementation and Biodiversity Assessment in a Port Marina. Water 2020, 12, 3273. [Google Scholar] [CrossRef]
  32. Schloss, P.D.; Westcott, S.L.; Ryabin, T.; Hall, J.R.; Hartmann, M.; Hollister, E.B.; Lesniewski, R.A.; Oakley, B.B.; Parks, D.H.; Robinson, C.J.; et al. Introducing Mothur: Open-Source, Platform-Independent, Community-Supported Software for Describing and Comparing Microbial Communities. Appl. Environ. Microbiol. 2009, 75, 7537–7541. [Google Scholar] [CrossRef] [Green Version]
  33. Camacho, C.; Coulouris, G.; Avagyan, V.; Ma, N.; Papadopoulos, J.; Bealer, K.; Madden, T.L. BLAST+: Architecture and Applications. BMC Bioinform. 2009, 10, 421. [Google Scholar] [CrossRef] [Green Version]
  34. R Core Team. R Core Team, 2008a language and environment for statistical computing. R Foundation for Statistical Computing. Available online: https://www.r-project.org/ (accessed on 30 January 2020).
  35. Oksanen, J.F.; Blanchet, G.; Friendly, M.; Kindt, R.; Legendre, P.; McGlinn, D.; Peter, R.; Minchin, R.B.; O’Hara, G.L.; Simpson, P.; et al. Vegan: Community Ecology Package (R package Version 2.5-5). Available online: https://CRAN.R-project.org/package=vegan (accessed on 30 January 2020).
  36. Wickham, H. Getting started with Qplot. In Ggplot2: Elegant Graphics for Data Analysis; Springer: New York, NY, USA, 2009; pp. 9–26. [Google Scholar] [CrossRef]
  37. McMurdie, P.J.; Holmes, S. Phyloseq: An R Package for Reproducible Interactive Analysis and Graphics of Microbiome Census Data. PLoS ONE 2013, 8, e61217. [Google Scholar] [CrossRef] [Green Version]
  38. Chazdon, R.L.; Chao, A.; Colwell, R.K.; Lin, S.-Y.; Norden, N.; Letcher, S.G.; Clark, D.B.; Finegan, B.; Arroyo, J.P. A Novel Statistical Method for Classifying Habitat Generalists and Specialists. Ecology 2011, 92, 1332–1343. [Google Scholar] [CrossRef] [PubMed]
  39. Zhao, J.; Li, Y.; Chen, X.; Li, Y. Effects of Carbon Sources on Sludge Performance and Microbial Community for 4-Chlorophenol Wastewater Treatment in Sequencing Batch Reactors. Bioresour. Technol. 2018, 255, 22–28. [Google Scholar] [CrossRef]
  40. Cooper, P. A Review of the Design and Performance of Vertical-Flow and Hybrid Reed Bed Treatment Systems. Water Sci. Technol. 1999, 40, 1–9. [Google Scholar] [CrossRef]
  41. Li, L.; Li, Y.; Biswas, D.K.; Nian, Y.; Jiang, G. Potential of Constructed Wetlands in Treating the Eutrophic Water: Evidence from Taihu Lake of China. Bioresour. Technol. 2008, 99, 1656–1663. [Google Scholar] [CrossRef]
  42. Liu, X.; Zhang, Y.; Li, X.; Fu, C.; Shi, T.; Yan, P. Effects of Influent Nitrogen Loads on Nitrogen and COD Removal in Horizontal Subsurface Flow Constructed Wetlands during Different Growth Periods of Phragmites Australis. Sci. Total Environ. 2018, 635, 1360–1366. [Google Scholar] [CrossRef] [PubMed]
  43. Vymazal, J. Removal of Nutrients in Various Types of Constructed Wetlands. Sci. Total Environ. 2007, 380, 48–65. [Google Scholar] [CrossRef]
  44. Sirivedhin, T.; Gray, K.A. Factors Affecting Denitrification Rates in Experimental Wetlands: Field and Laboratory Studies. Ecol. Eng. 2006, 26, 167–181. [Google Scholar] [CrossRef]
  45. Kang, Y.; Xie, H.; Li, B.; Zhang, J.; Hao Ngo, H.; Guo, W.; Guo, Z.; Kong, Q.; Liang, S.; Liu, J.; et al. Performance of Constructed Wetlands and Associated Mechanisms of PAHs Removal with Mussels. Chem. Eng. J. 2019, 357, 280–287. [Google Scholar] [CrossRef]
  46. Martín, M.; Gargallo, S.; Hernández-Crespo, C.; Oliver, N. Phosphorus and Nitrogen Removal from Tertiary Treated Urban Wastewaters by a Vertical Flow Constructed Wetland. Ecol. Eng. 2013, 61, 34–42. [Google Scholar] [CrossRef]
  47. Xu, Q.; Liu, X.; Yang, G.; Wang, D.; Wu, Y.; Li, Y.; Huang, X.; Fu, Q.; Wang, Q.; Liu, Y.; et al. Norfloxacin-Induced Effect on Enhanced Biological Phosphorus Removal from Wastewater after Long-Term Exposure. J. Hazard. Mater. 2020, 392, 122336. [Google Scholar] [CrossRef] [PubMed]
  48. Zhang, L.; Yue, Q.; Yang, K.; Zhao, P.; Gao, B. Enhanced Phosphorus and Ciprofloxacin Removal in a Modified BAF System by Configuring Fe-C Micro Electrolysis: Investigation on Pollutants Removal and Degradation Mechanisms. J. Hazard. Mater. 2018, 342, 705–714. [Google Scholar] [CrossRef]
  49. Belmont, M.A.; Metcalfe, C.D. Feasibility of Using Ornamental Plants (Zantedeschia Aethiopica) in Subsurface Flow Treatment Wetlands to Remove Nitrogen, Chemical Oxygen Demand and Nonylphenol Ethoxylate Surfactants—A Laboratory-Scale Study. Ecol. Eng. 2003, 21, 233–247. [Google Scholar] [CrossRef]
  50. Dai, Y.; Tao, R.; Tai, Y.; Tam, N.F.; Dan, A.; Yang, Y. Application of a Full-Scale Newly Developed Stacked Constructed Wetland and an Assembled Bio-Filter for Reducing Phenolic Endocrine Disrupting Chemicals from Secondary Effluent. Ecol. Eng. 2017, 99, 496–503. [Google Scholar] [CrossRef]
  51. Hsieh, C.Y.; Liaw, E.T.; Fan, K.M. Removal of Veterinary Antibiotics, Alkylphenolic Compounds, and Estrogens from the Wuluo Constructed Wetland in Southern Taiwan. J. Environ. Sci. Health Part A 2015, 50, 151–160. [Google Scholar] [CrossRef] [PubMed]
  52. Choudhary, A.K.; Kumar, S.; Sharma, C. Removal of Chlorophenolics from Pulp and Paper Mill Wastewater through Constructed Wetland. Water Environ. Res. Res. Public Water Environ. Fed. 2013, 85, 54–62. [Google Scholar] [CrossRef]
  53. David, A.; Fenet, H.; Gomez, E. Alkylphenols in Marine Environments: Distribution Monitoring Strategies and Detection Considerations. Mar. Pollut. Bull. 2009, 58, 953–960. [Google Scholar] [CrossRef]
  54. Olaniran, A.O.; Igbinosa, E.O. Chlorophenols and Other Related Derivatives of Environmental Concern: Properties, Distribution and Microbial Degradation Processes. Chemosphere 2011, 83, 1297–1306. [Google Scholar] [CrossRef] [PubMed]
  55. Connaughton, D.F.; Stedinger, J.R.; Lion, L.W.; Shuler, M.L. Description of Time-Varying Desorption Kinetics: Release of Naphthalene from Contaminated Soils. Environ. Sci. Technol. 1993, 27, 2397–2403. [Google Scholar] [CrossRef]
  56. Zhou, J.L. Sorption and Remobilization Behavior of 4-Tert-Octylphenol in Aquatic Systems. Environ. Sci. Technol. 2006, 40, 2225–2234. [Google Scholar] [CrossRef] [PubMed]
  57. Lee, S.; Pardue, J.H.; Moe, W.M.; Valsaraj, K.T. Mineralization of Desorption-Resistant 1,4-Dichlorobenzene in Wetland Soils. Environ. Toxicol. Chem. 2003, 22, 2312–2322. [Google Scholar] [CrossRef] [PubMed]
  58. Schwartz, E.; Scow, K.M. Repeated Inoculation as a Strategy for the Remediation of Low Concentrations of Phenanthrene in Soil. Biodegradation 2001, 12, 201–207. [Google Scholar] [CrossRef]
  59. Allard, A.-S.; Remberger, M.; Neilson, A.H. The Negative Impact of Aging on the Loss of PAH Components in a Creosote-Contaminated Soil. Int. Biodeterior. Biodegrad. 2000, 46, 43–49. [Google Scholar] [CrossRef]
  60. Wick, L.Y.; Colangelo, T.; Harms, H. Kinetics of Mass Transfer-Limited Bacterial Growth on Solid PAHs. Environ. Sci. Technol. 2001, 35, 354–361. [Google Scholar] [CrossRef]
  61. Hamker, J.W.; Thompsom, J.M. Adsorption. In Organic Chemicals in Soil Environment; Goring, C., Hamaker, J., Eds.; Marcel Dekker, Inc.: New York, NY, USA, 1971; Volume 1. [Google Scholar]
  62. Chien, S.-W.C.; Chen, S.-H.; Li, C.-J. Effect of Soil PH and Organic Matter on the Adsorption and Desorption of Pentachlorophenol. Environ. Sci. Pollut. Res. Int. 2018, 25, 5269–5279. [Google Scholar] [CrossRef]
  63. Braeckevelt, M.; Rokadia, H.; Imfeld, G.; Stelzer, N.; Paschke, H.; Kuschk, P.; Kastner, M.; Richnow, H.H.; Weber, S. Assessment of in Situ Biodegradation of Monochlorobenzene in Contaminated Groundwater Treated in a Constructed Wetland. Environ. Pollut. 2007, 148, 428–437. [Google Scholar] [CrossRef]
  64. Braeckevelt, M.; Mirschel, G.; Wiessner, A.; Rueckert, M.; Reiche, N.; Vogt, C.; Schultz, A.; Paschke, H.; Kuschk, P.; Kaestner, M. Treatment of Chlorobenzene-Contaminated Groundwater in a Pilot-Scale Constructed Wetland. Ecol. Eng. 2008, 33, 45–53. [Google Scholar] [CrossRef]
  65. Ma, X.; Havelka, M.M. Phytotoxicity of Chlorinated Benzenes to Typha Angustifolia and Phragmites Communis. Environ. Toxicol. 2009, 24, 43–48. [Google Scholar] [CrossRef] [PubMed]
  66. Zhang, C.; Feng, Y.; Liu, Y.; Chang, H.; Li, Z.; Xue, J. Uptake and Translocation of Organic Pollutants in Plants: A Review. J. Integr. Agric. 2017, 16, 1659–1668. [Google Scholar] [CrossRef] [Green Version]
  67. Zhao, L.; Zhu, C.; Gao, C.; Jiang, J.; Yang, J.; Yang, S. Phytoremediation of Pentachlorophenol-Contaminated Sediments by Aquatic Macrophytes. Environ. Earth Sci. 2011, 64, 581–588. [Google Scholar] [CrossRef]
  68. Hübner, T.M.; Tischer, S.; Tanneberg, H.; Kuschk, P. Influence of Phenol and Phenanthrene on the Growth of Phalaris Arundinacea and Phragmites Australis. Int. J. Phytoremediation 2000, 2, 331–342. [Google Scholar] [CrossRef]
  69. Schröder, P.; Collins, C. Conjugating Enzymes Involved in Xenobiotic Metabolism of Organic Xenobiotics in Plants. Int. J. Phytoremediation 2002, 4, 247–265. [Google Scholar] [CrossRef]
  70. Liste, H.-H.; Alexander, M. Plant-Promoted Pyrene Degradation in Soil. Chemosphere 2000, 40, 7–10. [Google Scholar] [CrossRef]
  71. Yang, C.; Yulai, W.; Wang, M.; Chen, H. Plant Species Influence Microbial Metabolic Activity and Butachlor Biodegradation in a Riparian Soil from Chongming Island, China. Geoderma 2013, 193, 165–171. [Google Scholar] [CrossRef]
  72. Hechmi, N.; Aissa, N.B.; Abdenaceur, H.; Jedidi, N. Evaluating the Phytoremediation Potential of Phragmites Australis Grown in Pentachlorophenol and Cadmium Co-Contaminated Soils. Environ. Sci. Pollut. Res. Int. 2014, 21, 1304–1313. [Google Scholar] [CrossRef]
  73. Hechmi, N.; Ben Aissa, N.; Abdenaceur, H.; Jedidi, N. Uptake and Bioaccumulation of Pentachlorophenol by Emergent Wetland Plant Phragmites Australis (Common Reed) in Cadmium Co-Contaminated Soil. Int. J. Phytoremediation 2015, 17, 109–116. [Google Scholar] [CrossRef] [PubMed]
  74. Huang, H.; Zhang, S.; Christie, P.; Wang, S.; Xie, M. Behavior of Decabromodiphenyl Ether (BDE-209) in the Soil-Plant System: Uptake, Translocation, and Metabolism in Plants and Dissipation in Soil. Environ. Sci. Technol. 2010, 44, 663–667. [Google Scholar] [CrossRef] [Green Version]
  75. Ekelund, R.; Granmo, Å.; Magnusson, K.; Berggren, M.; Bergman, Å. Biodegradation of 4-Nonylphenol in Seawater and Sediment. Environ. Pollut. 1993, 79, 59–61. [Google Scholar] [CrossRef]
  76. Nishio, E.; Ichiki, Y.; Tamura, H.; Morita, S.; Watanabe, K.; Yoshikawa, H. Isolation of Bacterial Strains That Produce the Endocrine Disruptor, Octylphenol Diethoxylates, in Paddy Fields. Biosci. Biotechnol. Biochem. 2002, 66, 1792–1798. [Google Scholar] [CrossRef] [Green Version]
  77. Ying, G.-G.; Williams, B.; Kookana, R. Environmental Fate of Alkylphenols and Alkylphenol Ethoxylates—A Review. Environ. Int. 2002, 28, 215–226. [Google Scholar] [CrossRef]
  78. Fujii, K.; Urano, N.; Kimura, S.; Nomura, Y.; Karube, I. Microbial Degradation of Nonylphenol in Some Aquatic Environments. Fish. Sci. 2000, 66, 44–48. [Google Scholar] [CrossRef]
  79. Ushiba, Y.; Takahara, Y.; Ohta, H. Sphingobium amiense sp. Nov., a Novel Nonylphenol-Degrading Bacterium Isolated from a River Sediment. Int. J. Syst. Evol. Microbiol. 2003, 53, 2045–2048. [Google Scholar] [CrossRef] [Green Version]
  80. Toyama, T.; Ojima, T.; Tanaka, Y.; Mori, K.; Morikawa, M. Sustainable Biodegradation of Phenolic Endocrine-Disrupting Chemicals by Phragmites Australis–Rhizosphere Bacteria Association. Water Sci. Technol. 2013, 68, 522–529. [Google Scholar] [CrossRef]
  81. D’Angelo, E.M.; Reddy, K.R. Aerobic and Anaerobic Transformations of Pentachlorophenol in Wetland Soils. Soil Sci. Soc. Am. J. 2000, 64, 933–943. [Google Scholar] [CrossRef] [Green Version]
  82. Zeng, G.; Yu, Z.; Chen, Y.; Zhang, J.; Li, H.; Yu, M.; Zhao, M. Response of Compost Maturity and Microbial Community Composition to Pentachlorophenol (PCP)-Contaminated Soil during Composting. Bioresour. Technol. 2011, 102, 5905–5911. [Google Scholar] [CrossRef]
  83. Liu, H.; Li, G.; Li, X.; Chen, J. Molecular Characterization of Bacterial Community in Aerobic Granular Sludge Stressed by Pentachlorophenol. J. Environ. Sci. 2008, 20, 1243–1249. [Google Scholar] [CrossRef]
  84. Beaulieu, M.; Bécaert, V.; Deschênes, L.; Villemur, R. Evolution of Bacterial Diversity during Enrichment of PCP-Degrading Activated Soils. Microb. Ecol. 2000, 40, 345–355. [Google Scholar] [CrossRef] [PubMed]
  85. Xu, Y.; He, Y.; Tang, X.; Brookes, P.C.; Xu, J. Reconstruction of Microbial Community Structures as Evidences for Soil Redox Coupled Reductive Dechlorination of PCP in a Mangrove Soil. Sci. Total Environ. 2017, 596, 147–157. [Google Scholar] [CrossRef]
  86. Wang, Z.; Yang, Y.; He, T.; Xie, S. Change of Microbial Community Structure and Functional Gene Abundance in Nonylphenol-Degrading Sediment. Appl. Microbiol. Biotechnol. 2015, 99, 3259–3268. [Google Scholar] [CrossRef]
  87. Chen, Y.; Wen, Y.; Zhou, J.; Zhou, Q.; Vymazal, J.; Kuschk, P. Transformation of Chloroform in Model Treatment Wetlands: From Mass Balance to Microbial Analysis. Environ. Sci. Technol. 2015, 49, 6198–6205. [Google Scholar] [CrossRef]
  88. Guan, W.; Yin, M.; He, T.; Xie, S. Influence of Substrate Type on Microbial Community Structure in Vertical-Flow Constructed Wetland Treating Polluted River Water. Environ. Sci. Pollut. Res. Int. 2015, 22, 16202–16209. [Google Scholar] [CrossRef]
  89. He, T.; Guan, W.; Luan, Z.; Xie, S. Spatiotemporal Variation of Bacterial and Archaeal Communities in a Pilot-Scale Constructed Wetland for Surface Water Treatment. Appl. Microbiol. Biotechnol. 2016, 100, 1479–1488. [Google Scholar] [CrossRef]
  90. Lang, X.; Chen, X.; Xu, A.; Song, Z.; Wang, X.; Wang, H. Variation of Bacterial and Archaeal Community Structures in a Full-Scale Constructed Wetlands for Wastewater Treatment. Archaea 2018, 2018, 9319345. [Google Scholar] [CrossRef] [PubMed]
  91. Liao, X.; Li, B.; Zou, R.; Dai, Y.; Xie, S.; Yuan, B. Biodegradation of Antibiotic Ciprofloxacin: Pathways, Influential Factors, and Bacterial Community Structure. Environ. Sci. Pollut. Res. 2016, 23, 7911–7918. [Google Scholar] [CrossRef]
  92. Zhang, S.; Courtois, S.; Gitungo, S.; Raczko, R.F.; Dyksen, J.E.; Li, M.; Axe, L. Microbial Community Analysis in Biologically Active Filters Exhibiting Efficient Removal of Emerging Contaminants and Impact of Operational Conditions. Sci. Total Environ. 2018, 640–641, 1455–1464. [Google Scholar] [CrossRef] [PubMed]
  93. Smalla, K.; Wieland, G.; Buchner, A.; Zock, A.; Parzy, J.; Kaiser, S.; Roskot, N.; Heuer, H.; Berg, G. Bulk and Rhizosphere Soil Bacterial Communities Studied by Denaturing Gradient Gel Electrophoresis: Plant-Dependent Enrichment and Seasonal Shifts Revealed. Appl. Environ. Microbiol. 2001, 67, 4742–4751. [Google Scholar] [CrossRef] [Green Version]
  94. Berg, G.; Smalla, K. Plant Species and Soil Type Cooperatively Shape the Structure and Function of Microbial Communities in the Rhizosphere. FEMS Microbiol. Ecol. 2009, 68, 1–13. [Google Scholar] [CrossRef] [Green Version]
  95. Calheiros, C.S.C.; Duque, A.F.; Moura, A.; Henriques, I.S.; Correia, A.; Rangel, A.O.S.S.; Castro, P.M.L. Changes in the Bacterial Community Structure in Two-Stage Constructed Wetlands with Different Plants for Industrial Wastewater Treatment. Bioresour. Technol. 2009, 100, 3228–3235. [Google Scholar] [CrossRef]
  96. Haritash, A.K.; Kaushik, C.P. Biodegradation Aspects of Polycyclic Aromatic Hydrocarbons (PAHs): A Review. J. Hazard. Mater. 2009, 169, 1–15. [Google Scholar] [CrossRef]
  97. Wang, Z.; Yang, Y.; Dai, Y.; Xie, S. Anaerobic Biodegradation of Nonylphenol in River Sediment under Nitrate- or Sulfate-Reducing Conditions and Associated Bacterial Community. J. Hazard. Mater. 2015, 286, 306–314. [Google Scholar] [CrossRef]
  98. Liu, Y.; Wang, F.; Xia, S.; Zhao, J. Study of 4-t-Octylphenol Degradation and Microbial Community in Granular Sludge. J. Environ. Sci. 2008, 20, 167–171. [Google Scholar] [CrossRef]
  99. Li, H.; Shen, T.-T.; Wang, X.-L.; Lin, K.-F.; Liu, Y.-D.; Lu, S.-G.; Gu, J.-D.; Wang, P.; Lu, Q.; Du, X.-M. Biodegradation of Perchloroethylene and Chlorophenol Co-Contamination and Toxic Effect on Activated Sludge Performance. Bioresour. Technol. 2013, 137, 286–293. [Google Scholar] [CrossRef]
  100. Yu, H.; Feng, C.; Liu, X.; Yi, X.; Ren, Y.; Wei, C. Enhanced Anaerobic Dechlorination of Polychlorinated Biphenyl in Sediments by Bioanode Stimulation. Environ. Pollut. 2016, 211, 81–89. [Google Scholar] [CrossRef]
  101. De Weert, J.; Viñas, M.; Grotenhuis, T.; Rijnaarts, H.; Langenhoff, A. Aerobic Nonylphenol Degradation and Nitro-Nonylphenol Formation by Microbial Cultures from Sediments. Appl. Microbiol. Biotechnol. 2010, 86, 761–771. [Google Scholar] [CrossRef] [PubMed] [Green Version]
  102. Jontofsohn, M.; Stoffels, M.; Hartmann, A.; Pfister, G.; Jüttner, I.; Severin-Edmair, G.; Schramm, K.-W.; Schloter, M. Influence of Nonylphenol on the Microbial Community of Lake Sediments in Microcosms. Sci. Total Environ. 2002, 285, 3–10. [Google Scholar] [CrossRef]
  103. Zhang, Y.; Sei, K.; Toyama, T.; Ike, M.; Zhang, J.; Yang, M.; Kamagata, Y. Changes of Catabolic Genes and Microbial Community Structures during Biodegradation of Nonylphenol Ethoxylates and Nonylphenol in Natural Water Microcosms. Biochem. Eng. J. 2008, 39, 288–296. [Google Scholar] [CrossRef]
  104. Stenrød, M.; Klemsdal, S.S.; Norli, H.R.; Eklo, O.M. Effects of Picoxystrobin and 4-n-Nonylphenol on Soil Microbial Community Structure and Respiration Activity. PLoS ONE 2013, 8, e66989. [Google Scholar] [CrossRef] [PubMed]
  105. Wang, Z.; Yang, Y.; Sun, W.; Xie, S.; Liu, Y. Nonylphenol Biodegradation in River Sediment and Associated Shifts in Community Structures of Bacteria and Ammonia-Oxidizing Microorganisms. Ecotoxicol. Environ. Saf. 2014, 106, 1–5. [Google Scholar] [CrossRef]
  106. Domene, X.; Chelinho, S.; Sousa, J.P. Effects of Nonylphenol on a Soil Community Using Microcosms. J. Soils Sediments 2010, 10, 556–567. [Google Scholar] [CrossRef]
  107. Rodríguez, J.; Gallampois, C.M.J.; Timonen, S.; Andersson, A.; Sinkko, H.; Haglund, P.; Berglund, Å.M.M.; Ripszam, M.; Figueroa, D.; Tysklind, M.; et al. Effects of Organic Pollutants on Bacterial Communities Under Future Climate Change Scenarios. Front. Microbiol. 2018, 9, 2926. [Google Scholar] [CrossRef] [Green Version]
  108. Cai, T.; Qian, L.; Cai, S.; Chen, L. Biodegradation of Benazolin-Ethyl by Strain Methyloversatilis Sp. Cd-1 Isolated from Activated Sludge. Curr. Microbiol. 2011, 62, 570–577. [Google Scholar] [CrossRef]
  109. Trotsenko, Y.A.; Doronina, N.V.; Khmelenina, V.N. Biotechnological Potential of Aerobic Methylotrophic Bacteria: A Review of Current State and Future Prospects. Appl. Biochem. Microbiol. 2005, 41, 433–441. [Google Scholar] [CrossRef]
  110. Lu, C.; Hong, Y.; Liu, J.; Gao, Y.; Ma, Z.; Yang, B.; Ling, W.; Waigi, M.G. A PAH-Degrading Bacterial Community Enriched with Contaminated Agricultural Soil and Its Utility for Microbial Bioremediation. Environ. Pollut. 2019, 251, 773–782. [Google Scholar] [CrossRef] [PubMed]
  111. Yagi, J.M.; Sims, D.; Brettin, T.; Bruce, D.; Madsen, E.L. The Genome of Polaromonas Naphthalenivorans Strain CJ2, Isolated from Coal Tar-Contaminated Sediment, Reveals Physiological and Metabolic Versatility and Evolution through Extensive Horizontal Gene Transfer. Environ. Microbiol. 2009, 11, 2253–2270. [Google Scholar] [CrossRef] [PubMed]
  112. Tuan, N.N.; Hsieh, H.-C.; Lin, Y.-W.; Huang, S.-L. Analysis of Bacterial Degradation Pathways for Long-Chain Alkylphenols Involving Phenol Hydroxylase, Alkylphenol Monooxygenase and Catechol Dioxygenase Genes. Bioresour. Technol. 2011, 102, 4232–4240. [Google Scholar] [CrossRef]
  113. Ma, W.; Nie, C.; Chen, B.; Cheng, X.; Lun, X.; Zeng, F. Adsorption and Biodegradation of Three Selected Endocrine Disrupting Chemicals in River-Based Artificial Groundwater Recharge with Reclaimed Municipal Wastewater. J. Environ. Sci. 2015, 31, 154–163. [Google Scholar] [CrossRef]
  114. Ma, W.; Yan, Y.; Ma, M.; Zhang, Y.; Nie, C.; Lun, X. Effect of Biochar on Migration and Biodegradation of 4-n-Nonylphenol (NP) during River-Based Groundwater Recharge with Reclaimed Water. Desalin. Water Treat. 2016, 57, 29316–29327. [Google Scholar] [CrossRef]
  115. Yang, C.-W.; Chang, B.-V.; Chen, L.-Y.; Tang, S.-L. Removal of Nonylphenol by Earthworms and Bacterial Community Change. Int. Biodeterior. Biodegrad. 2014, 96, 9–17. [Google Scholar] [CrossRef]
  116. Táncsics, A.; Szalay, A.R.; Farkas, M.; Benedek, T.; Szoboszlay, S.; Szabó, I.; Lueders, T. Stable Isotope Probing of Hypoxic Toluene Degradation at the Siklós Aquifer Reveals Prominent Role of Rhodocyclaceae. FEMS Microbiol. Ecol. 2018, 94, 88. [Google Scholar] [CrossRef] [PubMed]
  117. Kasai, Y.; Takahata, Y.; Manefield, M.; Watanabe, K. RNA-Based Stable Isotope Probing and Isolation of Anaerobic Benzene-Degrading Bacteria from Gasoline-Contaminated Groundwater. Appl. Environ. Microbiol. 2006, 72, 3586–3592. [Google Scholar] [CrossRef] [PubMed] [Green Version]
  118. Wang, Y.; Tian, H.; Huang, F.; Long, W.; Zhang, Q.; Wang, J.; Zhu, Y.; Wu, X.; Chen, G.; Zhao, L.; et al. Time-Resolved Analysis of a Denitrifying Bacterial Community Revealed a Core Microbiome Responsible for the Anaerobic Degradation of Quinoline. Sci. Rep. 2017, 7, 14778. [Google Scholar] [CrossRef]
  119. Gutierrez, T.; Singleton, D.R.; Aitken, M.D.; Semple, K.T. Stable Isotope Probing of an Algal Bloom to Identify Uncultivated Members of the Rhodobacteraceae Associated with Low-Molecular-Weight Polycyclic Aromatic Hydrocarbon Degradation. Appl. Environ. Microbiol. 2011, 77, 7856–7860. [Google Scholar] [CrossRef] [Green Version]
  120. Corteselli, E.M.; Aitken, M.D.; Singleton, D.R. Rugosibacter Aromaticivorans Gen. Nov., Sp. Nov., a Bacterium within the Family Rhodocyclaceae, Isolated from Contaminated Soil, Capable of Degrading Aromatic Compounds. Int. J. Syst. Evol. Microbiol. 2017, 67, 311–318. [Google Scholar] [CrossRef]
  121. Singleton, D.R.; Hu, J.; Aitken, M.D. Heterologous Expression of Polycyclic Aromatic Hydrocarbon Ring-Hydroxylating Dioxygenase Genes from a Novel Pyrene-Degrading Betaproteobacterium. Appl. Environ. Microbiol. 2012, 78, 3552–3559. [Google Scholar] [CrossRef] [Green Version]
  122. Regonne, R.K.; Martin, F.; Mbawala, A.; Ngassoum, M.B.; Jouanneau, Y. Identification of Soil Bacteria Able to Degrade Phenanthrene Bound to a Hydrophobic Sorbent in Situ. Environ. Pollut. 2013, 180, 145–151. [Google Scholar] [CrossRef]
  123. Salinero, K.K.; Keller, K.; Feil, W.S.; Feil, H.; Trong, S.; Di Bartolo, G.; Lapidus, A. Metabolic Analysis of the Soil Microbe Dechloromonas Aromatica Str. RCB: Indications of a Surprisingly Complex Life-Style and Cryptic Anaerobic Pathways for Aromatic Degradation. BMC Genom. 2009, 10, 351. [Google Scholar] [CrossRef] [Green Version]
  124. Li, Z.-L.; Nan, J.; Huang, C.; Liang, B.; Liu, W.-Z.; Cheng, H.-Y.; Zhang, C.; Zhang, D.; Kong, D.; Kanamaru, K.; et al. Spatial Abundance and Distribution of Potential Microbes and Functional Genes Associated with Anaerobic Mineralization of Pentachlorophenol in a Cylindrical Reactor. Sci. Rep. 2016, 6, 19015. [Google Scholar] [CrossRef] [Green Version]
  125. Harwood, C.S.; Burchhardt, G.; Herrmann, H.; Fuchs, G. Anaerobic Metabolism of Aromatic Compounds via the Benzoyl-CoA Pathway. FEMS Microbiol. Rev. 1998, 22, 439–458. [Google Scholar] [CrossRef]
  126. Tong, H.; Liu, C.; Li, F.; Luo, C.; Chen, M.; Hu, M. The Key Microorganisms for Anaerobic Degradation of Pentachlorophenol in Paddy Soil as Revealed by Stable Isotope Probing. J. Hazard. Mater. 2015, 298, 252–260. [Google Scholar] [CrossRef]
  127. McAllister, K.A.; Lee, H.; Trevors, J.T. Microbial Degradation of Pentachlorophenol. Biodegradation 1996, 7, 1–40. [Google Scholar] [CrossRef]
  128. Mohn, W.W.; Kennedy, K.J. Reductive Dehalogenation of Chlorophenols by Desulfomonile Tiedjei DCB-1. Appl. Environ. Microbiol. 1992, 58, 1367–1370. [Google Scholar] [CrossRef] [PubMed] [Green Version]
  129. Chakraborty, R.; Coates, J.D. Hydroxylation and Carboxylation–Two Crucial Steps of Anaerobic Benzene Degradation by Dechloromonas Strain RCB. Appl. Environ. Microbiol. 2005, 71, 5427–5432. [Google Scholar] [CrossRef] [PubMed] [Green Version]
  130. Shinoda, Y.; Sakai, Y.; Uenishi, H.; Uchihashi, Y.; Hiraishi, A.; Yukawa, H.; Yurimoto, H.; Kato, N. Aerobic and Anaerobic Toluene Degradation by a Newly Isolated Denitrifying Bacterium, Thauera Sp. Strain DNT-1. Appl. Environ. Microbiol. 2004, 70, 1385–1392. [Google Scholar] [CrossRef] [PubMed] [Green Version]
  131. Kirkwood, A.E.; Nalewajko, C.; Fulthorpe, R.R. The Effects of Cyanobacterial Exudates on Bacterial Growth and Biodegradation of Organic Contaminants. Microb. Ecol. 2006, 51, 4–12. [Google Scholar] [CrossRef] [PubMed]
Figure 1. Removal percentage (%, mean and standard deviation, n = 3) of ammonia (NH4+), nitrite (NO2), nitrate (NO3) and phosphate (PO43−) ions in CWs irrigated for eight weeks with Ribeira de Joane water not doped (control) or doped with NP and OP. * In week seven of control treatment there was no PO43− ions removal.
Water 13 00715 g001
Figure 2. Removal percentage (%, mean and standard deviation, n = 3) of PCP in CWs, irrigated for eight weeks with Ribeira de Joane water doped with 100 μg·L−1 of PCP per week.
Water 13 00715 g002
Figure 3. Removal percentage (%, mean and standard deviation, n = 3) of ammonia (NH4+), nitrite (NO2) and nitrate (NO3) ions in CWs, irrigated for eight weeks with Ribeira de Joane water not doped (control) or doped with PCP. * no NO3 removal in CWs.
Water 13 00715 g003
Figure 4. Alfa diversity index of the microbial community in the different CWs systems, irrigated for eight weeks with Ribeira de Joane water not doped (control) or doped with NP and OP. Samples collected at the beginning (T0) and at the end of the experiment (T8) (n = 3). (a) Richness (number of observed OTUs); (b) dominance (Berger–Parker index); (c) diversity (Shannon diversity index).
Water 13 00715 g004
Figure 5. (a) Cluster dendrogram analysis of Hellinger transformation using the Bray–Curtis dissimilarity matrix and (b) Nonmetric Multidimensional Scaling (NMDS) analysis of data transformed by “phyloseq” function and based on Bray–Curtis dissimilarity matrix to ordinate microbial community composition of the different CWs systems, irrigated for eight weeks with Ribeira de Joane water not doped (control) or doped with NP and OP. Samples collected at the beginning (T0) and at the end of the experiment (T8) (n = 3). The Kruskal–Wallis test was conducted to examine the difference between microbial communities of each sample.
Water 13 00715 g005
Figure 6. (a) Abundance of the major phyla, (b) classes with abundance > 1% and (c) genera more abundant of bacteria across the different CWs systems substrates, irrigated for eight weeks with Ribeira de Joane water not doped (control) or doped with NP and OP. Samples collected at the beginning (T0) and at the end of the experiment (T8) (n = 3). <1% abund.: groups the phyla with abundance lower than 1%; “No_Relative_NA” groups the phyla without any close relatives.
Water 13 00715 g006aWater 13 00715 g006b
Figure 7. Relative abundance of the specialist genera in plant root bed substrate samples: (a) in control CWs and (b) in doped CWs collected at the end of the experiment (after 8 weeks). Systems irrigated along eight weeks with Ribeira de Joane water not doped (control) or doped with NP and OP. Only genera with abundance > 1% are shown.
Water 13 00715 g007
Figure 8. Alfa diversity index of the microbial community in the different CWs systems, irrigated for eight weeks with Ribeira de Joane water not doped (control) or doped with PCP. Samples collected at the beginning (T0) and at the end of the experiment (T8) (n = 3). (a) Richness (number of observed OTUs); (b) dominance (Berger–Parker index); (c) diversity (Shannon diversity index).
Water 13 00715 g008
Figure 9. (a) Cluster dendrogram analysis of Hellinger transformation using the Bray–Curtis dissimilarity matrix and (b) NMDS analysis of data transformed by “phyloseq” function and based on the Bray–Curtis dissimilarity matrix to ordinate microbial community composition of the different CWs systems, irrigated for eight weeks with Ribeira de Joane water not doped (control) or doped with PCP. Samples collected at the beginning (T0) and at the end of the experiment (T8) (n = 3). The Kruskal–Wallis test was conducted to examine the difference between microbial communities of each sample.
Water 13 00715 g009
Figure 10. (a) Abundance of the major phyla, (b) classes with abundance > 1% and (c) genera more abundant of bacteria across the different CWs systems substrates, irrigated for eight weeks with Ribeira de Joane water not doped (control) or doped with PCP. Samples collected at the beginning (T0) and at the end of the experiment (T8) (n = 3). <1% abund. groups the phyla with abundance lower than 1%; and “No_Relative_NA” groups the phyla without any close relatives.
Water 13 00715 g010
Figure 11. Relative abundance of the specialist genera of bacteria in plant roots bed substrate samples, (a) in control CWs and (b) in doped CWs collected at the end of the experiment (after 8 weeks). Systems irrigated for eight weeks with Ribeira de Joane water not doped (control) or doped with PCP. Only genera with abundance > 1% are shown.
Water 13 00715 g011
Table 1. Concentration of chemical oxygen demand (COD) (mg O2 l−1 water) in constructed wetlands (CWs) influents and effluent (mean ± standard deviation, n = 3) and percentage of removal (%, mean ± standard deviation, n = 3) in CWs irrigated along eight weeks with Ribeira de Joane water not doped (control) or doped with nonylphenol (NP) and octylphenol (OP). n.r. indicates that there was no COD removal in CWs system.
WeekCW Influent (mg·L−1)CW Effluent
Control (mg·L−1)% of RemovalDoped (mg·L−1)% of Removal
145114 ± 7n.r.112 ± 12n.r.
28386 ± 42n.r.70 ± 6115 ± 74
34318 ± 858 ± 1836 ± 4216 ± 97
45923 ± 1061 ± 1861 ± 20n.r.
5154.0 ± 0.173.0 ± 0.17 ± 553 ± 35
62713 ± 252 ± 76 ± 178 ± 4
73495 ± 12n.r.64 ± 13n.r.
84614 ± 269 ± 58 ± 783 ± 15
Table 2. Concentration of pentachlorophenol (PCP) (μg·L−1) in influent and effluent CWs (mean and standard deviation, n = 3), irrigated for eight weeks with Ribeira de Joane water not doped (control) or doped with 100 μg·L−1 PCP per week. * PCP concentration below the detection limit (LOD = 4 × 10⁻⁵ μg·L−1) when not doped.
PCP (μg·L−1)
WeekInfluentEffluent
ControlDoped
1<4 × 10⁻⁵ *<4 × 10−5 *2.5 ± 0.5
23.1 ± 0.6
37 ± 2
411 ± 4
58 ± 2
613 ± 2
713 ± 1
89 ± 4
Table 3. Concentration of COD (mg·L−1 water) in CWs influents and effluent (mean ± standard deviation, n = 3) and percentage of removal (%, mean ± standard deviation, n = 3) for eight weeks. n.r. means that there was no COD removal in the systems.
WeekCW Influent (mg·L−1)CW Effluent
Control (mg·L−1)% of RemovalDoped (mg·L−1)% of Removal
12322 ± 63 ± 2515 ± 335 ± 15
24235 ± 116 ± 339 ± 18 ± 2
35536 ± 435 ± 629 ± 148 ± 2
44639 ± 516 ± 1036 ± 422 ± 8
52821 ± 526 ± 1821 ± 224 ± 5
62227 ± 3n.r.30 ± 1n.r.
72216 ± 229 ± 919 ± 714 ± 32
81924 ± 4n.r.26 ± 8n.r.
Publisher’s Note: MDPI stays neutral with regard to jurisdictional claims in published maps and institutional affiliations.

