
Role of Ion Chemistry and Hydro-Geochemical Processes in Aquifer Salinization—A Case Study from a Semi-Arid Region of Haryana, India

 ,
,  , ,
, ,  , ,
, , 
Abstract
1. Introduction
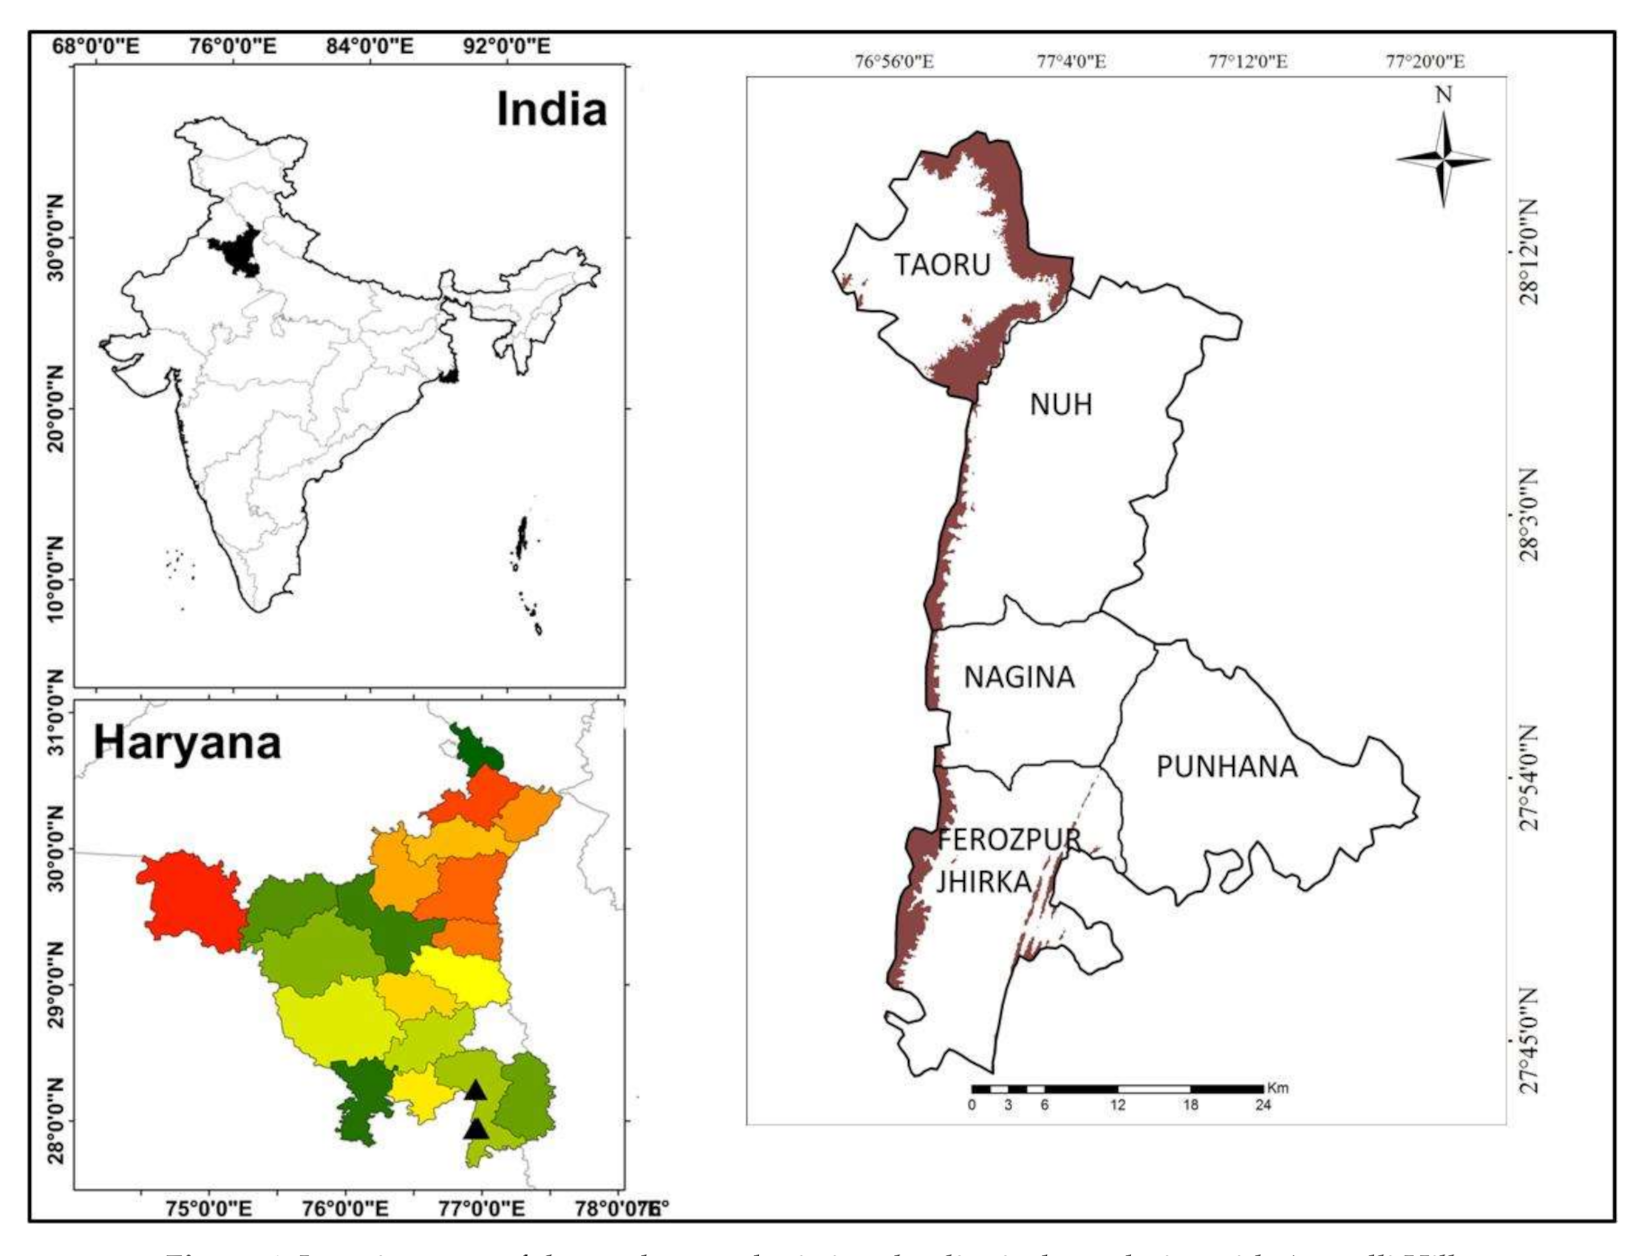
2. Study Area
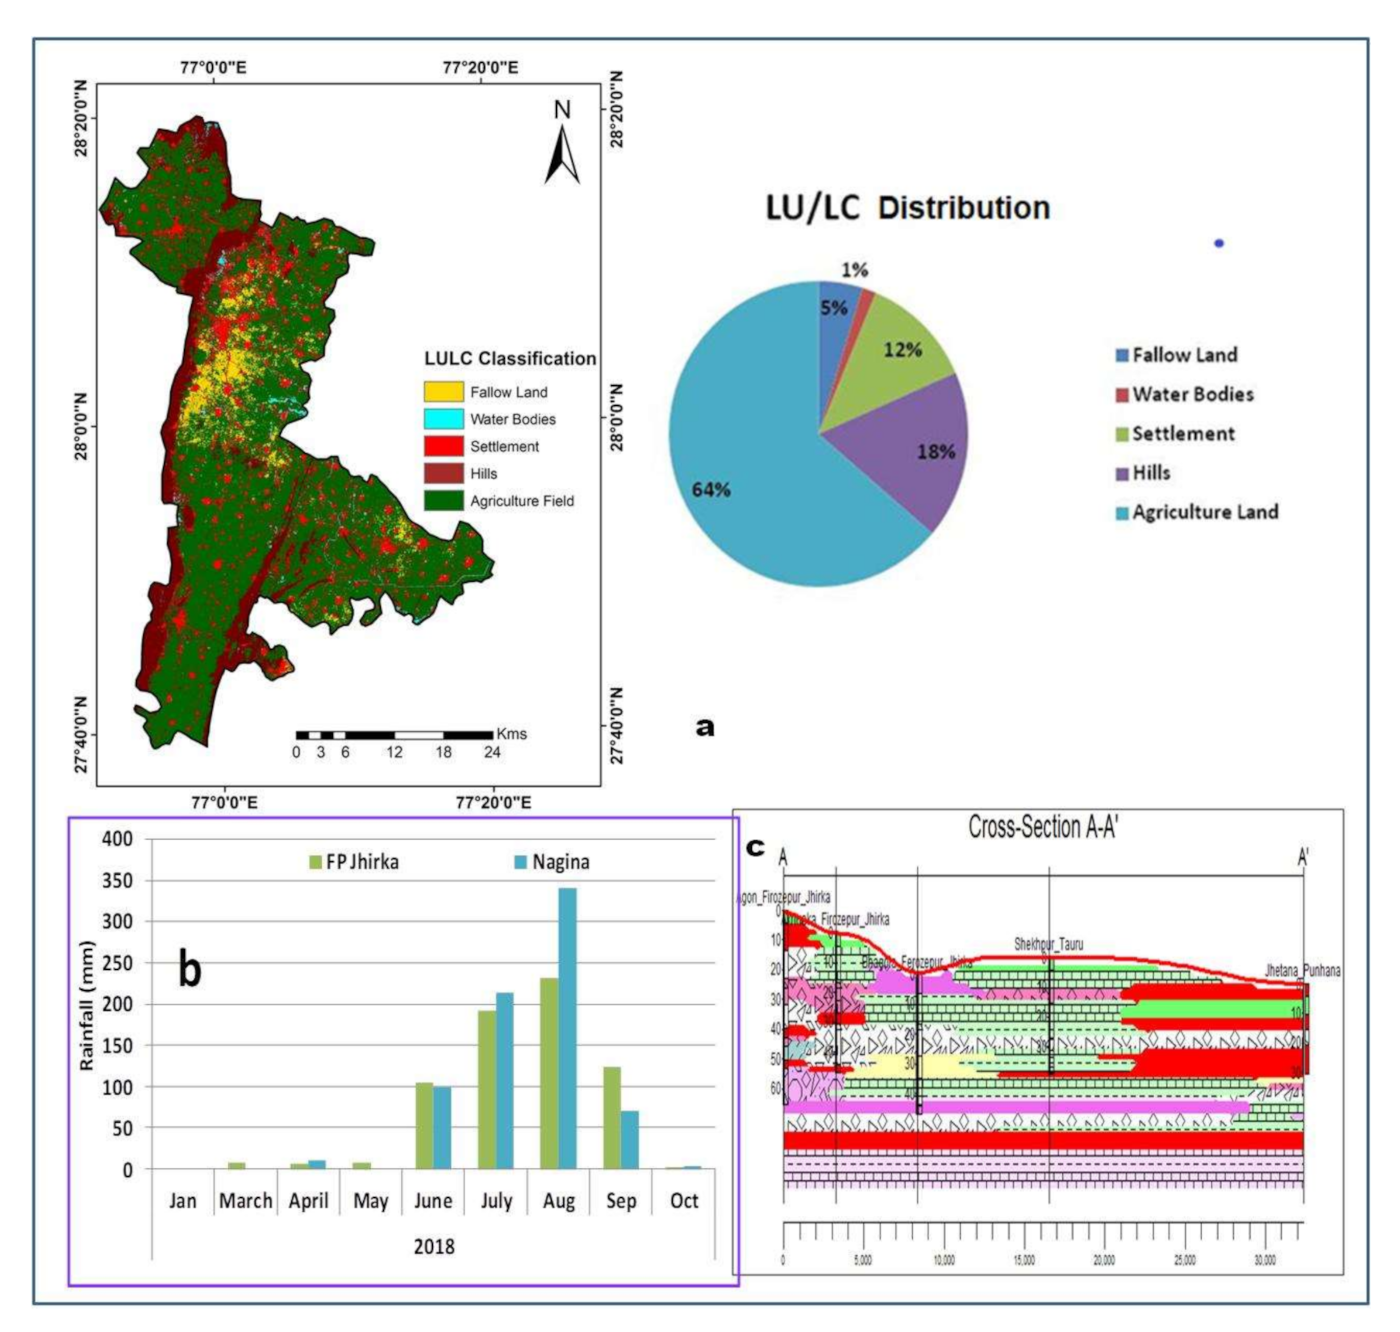
2.1. Location and Climate
2.2. Geomorphology and Soil
2.3. Hydrogeology
2.4. Landuse and Land Cover
3. Methodology
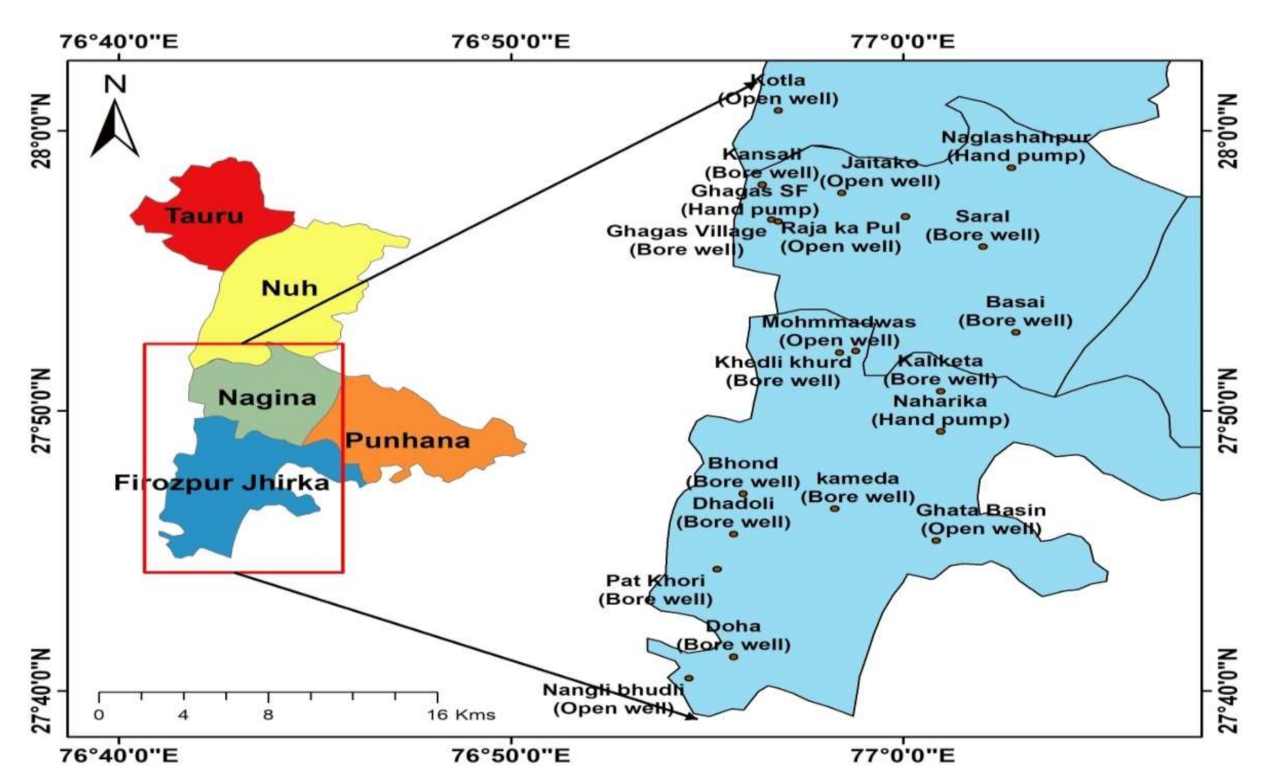
3.1. Sample Collection and Analysis
3.2. Data Analysis
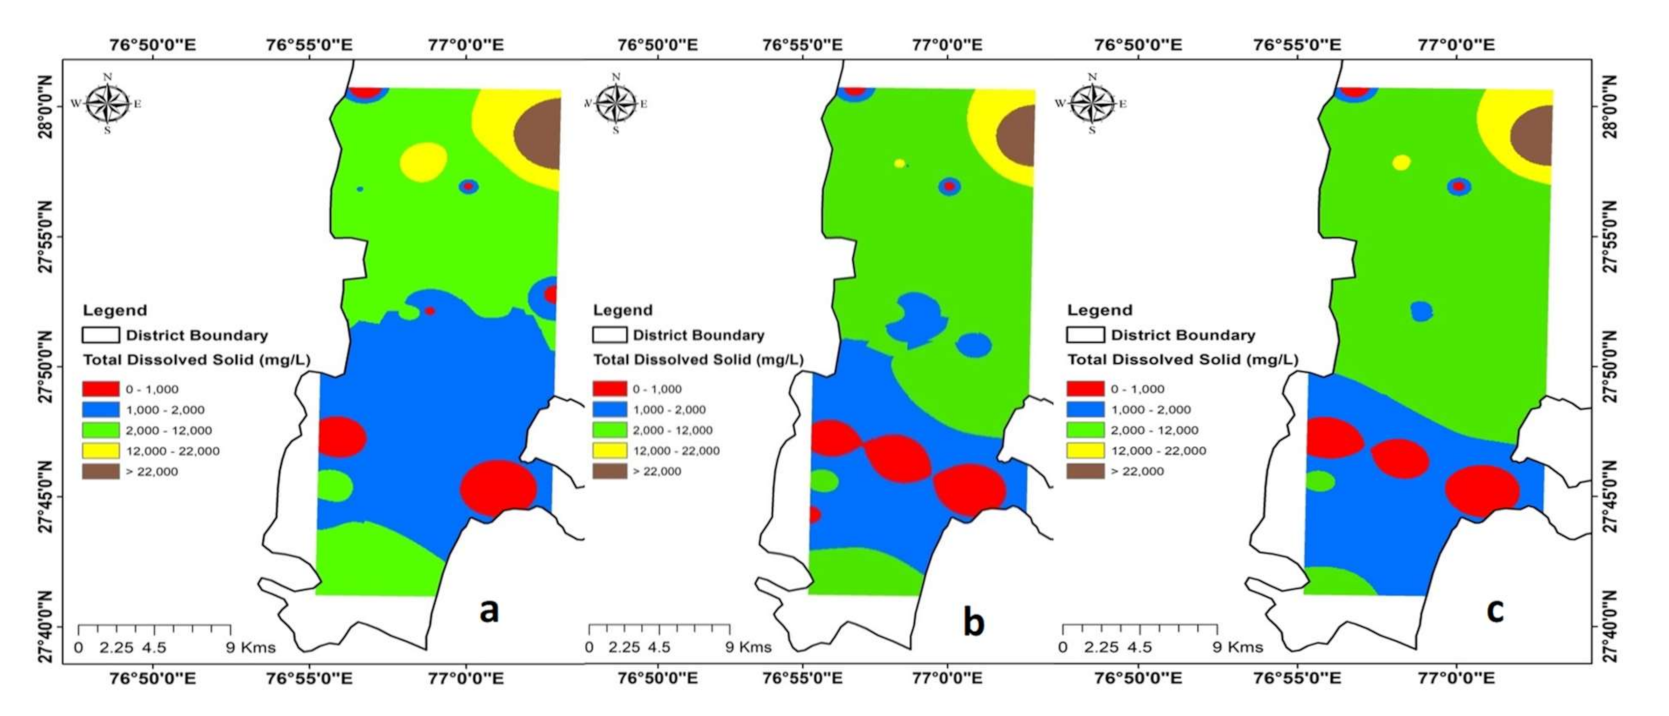
4. Results and Discussion
4.1. Multiple Regression Analysis
4.2. Sources of Anions and Cations Causing Groundwater Salinization
4.2.1. Weathering
4.2.2. Ion Exchange
4.2.3. Anthropogenic Sources
4.2.4. Evaporation
5. Conclusions
Author Contributions
Funding
Institutional Review Board Statement
Informed Consent Statement
Data Availability Statement
Acknowledgments
Conflicts of Interest
References
- Bonsor, H.C.; MacDonald, A.M.; Ahmed, K.M.; Burgess, W.G.; Basharat, M.; Calow, R.C.; Dixit, A.; Foster, S.S.D.; Gopal, K.; Lapworth, D.; et al. Hydrogeological typologies of the Indo-Gangetic basin alluvial aquifer, South Asia. Hydrogeol. J. 2017, 25, 1377–1406. [Google Scholar] [CrossRef]
- Krishan, G.; Bisht, M.; Ghosh, N.C.; Prasad, G. Groundwater salinity in north west of India: A critical appraisal. In Environment Management; WSTL Book Series; Springer: Berlin/Heidelberg, Germany, 2019; Chapter 19. [Google Scholar]
- Lapworth, D.J.; MacDonald, A.M.; Krishan, G.; Rao, M.S.; Gooddy, D.C.; Darling, W.G. Groundwater recharge and age-depth profiles of intensively exploited groundwater resources in northwest India. Geophys. Res. Lett. 2015, 42. [Google Scholar] [CrossRef]
- MacDonald, A.; Bonsor, H.; Ahmed, K.; Burgess, W.; Basharat, M.; Calow, R.; Dixit, A.; Foster, S.; Krishan, G.; Lapworth, D.; et al. Groundwater depletion and quality in the Indo-Gangetic Basin mapped from in situ observations. Nat. Geosci. 2016, 9, 762–766. [Google Scholar] [CrossRef]
- Malik, A.; Bhagwat, A. Modelling groundwater level fluctuations in urban areas using artificial neural network. Groundw. Sustain. Dev. 2021, 12, 100484. [Google Scholar] [CrossRef]
- Rodell, M.; Velicogna, I.; Famiglietti, J.S. Satellitebased estimates of groundwater depletion in India. Nature 2009. [CrossRef]
- Krishan, G. Groundwater Salinity. Curr. World Environ. 2019, 14, 186–188. [Google Scholar] [CrossRef]
- Lapworth, D.; Krishnan, G.; Macdonald, A.; Rao, M. Groundwater quality in the alluvial aquifer system of northwest India: New evidence of the extent of anthropogenic and geogenic contamination. Sci. Total Environ. 2017, 599–600, 1433–1444. [Google Scholar] [CrossRef] [PubMed]
- Misra, A.K.; Mishra, A. Study of quaternary aquifer in Ganga Plains, India: Focus on groundwater salinity, fluoride and fluorosis. J. Hazard. Mater. 2006, 144, 438–448. [Google Scholar] [CrossRef]
- Pazand, K.; Ardeshir, H. Investigation of hydrochemical characteristics of groundwater in the Bukan basin, North. Iran. Appl. Water Sci. 2012, 2, 309–315. [Google Scholar] [CrossRef][Green Version]
- Lakshmanan, A.R.; Kannan, M.; Senthil, K. Major ion chemistry and identification of hydrogeochemical processes of groundwater in a part of Kancheepuram district, Tamil Nadu, India. Environ. Geosci. 2003, 10, 157–166. [Google Scholar] [CrossRef]
- Anjali, P.; Saravanan, V.S.; Jayanti, C. Interlacing Water and Human Health: Case Studies from South Asia; SAGE Publishing Pvt. Ltd.: Thousand Oaks, CA, USA, 2012; pp. 201–207. [Google Scholar]
- CENSUS. 2011. Available online: http://www.census2011.co.in/census/district/226-mewat.html (accessed on 1 August 2020).
- Central Ground Water Board. Ground Water Information Booklet, Mewat District, Haryana. 2012. Available online: www.cgwb.gov.in/district_profile/haryana/mewat.pdf (accessed on 1 August 2020).
- APHA. Standard Methods for The Examination of Water and Wastewater, 21st ed.; American Public Health Association: Washington, DC, USA; New York, NY, USA, 2005. [Google Scholar]
- Piper, A.M. A graphical procedure in the geochemical interpretation of water analysis. Eos Trans. Am. Geophys. Union 1944, 25, 914–928. [Google Scholar] [CrossRef]
- Gibbs, R.J. Mechanisms Controlling World Water Chemistry. Science 1970, 170, 1088–1090. [Google Scholar] [CrossRef]
- Krishan, G.; Ghosh, N.C.; Kumar, C.P.; Sharma, L.M.; Yadav, B.; Kansal, M.L.; Singh, S.; Verma, S.K.; Prasad, G. Understanding stable isotope systematics of salinity affected groundwater in Mewat, Haryana, India. J. Earth Syst. Sci. 2020, 129, 109. [Google Scholar] [CrossRef]
- Krishan, G.; Kumar, C.P.; Prasad, G.; Kansal, M.L.; Yadav, B.; Verma, S.K. Stable Isotopes and Inland Salinity Evidences for Mixing and Exchange. In Proceedings of the Roorkee Water Conclave (RWC-2020), Uttarakhand, India, 26–28 February 2020. [Google Scholar]
- Singh, A.K.; Mondal, G.C.; Kumar, S.; Singh, T.B.; Tewary, B.K.; Sinha, A. Major ion chemistry, weathering processes and water quality assessment in upper catchment of Damodar River basin, India. Environ. Geol. 2007, 54, 745–758. [Google Scholar] [CrossRef]
- Subba Rao, N.; Surya Rao, P. Major ion chemistry of groundwater in a River basin: A study of India. Environ. Earth Sci. 2009. [CrossRef]
- Freeze, R.A.; Cherry, J.A. Groundwater; Presentice Hall: Upper Saddle River, NJ, USA, 1979. [Google Scholar]
- Hem, J.D. Study and Interpretation of the Chemical Characteristics of Natural Water; Scientific Publisher: Jodhpur, India, 1991; p. 2254. [Google Scholar]
- Todd, D.K. Groundwater Hydrology, 2nd ed.; John Wiley: New York, NY, USA; Chichester, UK; Brisbane, Australia; Toronto, ON, Canada, 1980; Volume xiii, p. 535. [Google Scholar]
- Craw, D. Water-rock interaction and acid neutralization in a large schist debris dam, Otago, New Zealand. Chem. Geol. 2000, 171, 17–32. [Google Scholar] [CrossRef]
- Malov, A.I. Water–rock interaction in vendian sandy–clayey rocks of the Mezen Syneclise. Lithol. Miner. Res. 2004, 39, 345–356. [Google Scholar] [CrossRef]
- Holland, H.D. The Chemistry of the Atmosphere and Ocean; Wiley—Intersciences: New York, NY, USA, 1978; p. 351. [Google Scholar]
- Fisher, R.S.; Mullican, W.F. Hydrochemical evolution of sodium sulphate and sodium-chloride groundwater beneath the Northern Chihuahuan desert, Trans-Pecos, Texas, USA. Hydrogeol J. 1997, 5, 4–16. [Google Scholar] [CrossRef]
- Schoeller, H. Qualitative evaluation of groundwater resources. In Methods and Techniques of Groundwater Investigations and Development; UNESCO Water Resources Series 33; UNESCO: Paris, France, 1965; pp. 44–52. [Google Scholar]
- Schoeller, H. Geochemistry of groundwater. In Groundwater Studies—An International Guide for Research and Practice; UNESCO: Paris, France, 1977; Chapter 15; pp. 1–18. [Google Scholar]
- Rajmohan, N.; Elango, L. Hyrogeochemistry and its relation to groundwater level fluctuation in the Palar and Cheyyar River basins, southern India. Hydrol. Process 2006, 20, 2415–2427. [Google Scholar] [CrossRef]
- Gurdak, J.J.; Hanson, R.T.; McMohan, P.B.; Bruce, B.W.; McCray, J.E.; Thyne, G.D.; Reedy, R.C. Climate variability controls on unsaturated water and chemical movement, High Plans Aquifer, USA. Vadose Zone J. 2007, 6, 533–547. [Google Scholar] [CrossRef]
- Subba Rao, N. Groundwater quality in crystalline terrain of Guntur district, Andhra Pradesh. Visakhapatnam J. Sci. 1998, 2, 51–54. [Google Scholar]
- Krishan, G.; Prasad, G.; Anjali; Kumar, C.; Patidar, N.; Yadav, B.; Kansal, M.; Singh, S.; Sharma, L.; Bradley, A.; et al. Identifying the seasonal variability in source of groundwater salinization using deuterium excess- A case study from Mewat, Haryana, India. J. Hydrol. Reg. Stud. 2020, 31, 100724. [Google Scholar] [CrossRef]
- Krishan, G.; Vashisth, R.; Sudersan, N.; Rao, M.S. Groundwater salinity and isotope characterization: A case study from south-west Punjab, India. Environ. Earth Sci. 2021, (in press).
- Krishan, G.; Ghosh, N.C.; Kumar, B.; Kumar, C.P.; Rao, M.S.; Sudarsan, N.; Singh, S.; Sharma, A.; Kumar, S.; Jain, S.K. Aquifer Salinization in Punjab; Report-CS-175/GWHD/2019-20 Submitted to PSFC; Government of Punjab: Chandigarh, India, 2021; p. 178.


| Parameters | Pre-Monsoon | Monsoon | Post-Monsoon | ||||||
|---|---|---|---|---|---|---|---|---|---|
| Na+, Cl−, Mg2+, Ca2+, SO42−, HCO3− | Trail | No. of Parameters | Dominant Ions | Trail | No. of Parameters | Dominant Ions | Trail | No. of Parameter | Dominant Ions |
| 1 | 6 | Ca2+, Na+& Cl−, SO42− | 1 | 6 | Ca2+,Na+& Cl−,HCO3− | 1 | 6 | Mg2+,Na+Cl−, SO42− | |
| 2 | 5 (*Exc. Mg2+) | Ca2+, Na+& Cl−, SO42− | 2 | 5 (*Exc. SO42−) | Ca2+Na+& Cl−,HCO3− | 2 | 5 (*Exc. HCO3−) | Mg2+,Na+,Cl SO42- | |
| 3 | 4 (*Exc. HCO3− & Mg2+) | Ca2+,Na+& Cl−, SO42− | 3 | 4 (*Exc. SO42− & Mg2+) | Ca2+Na+& Cl−,HCO3− | 3 | 4 (*Exc. HCO3−& Cl−) | Mg2+,Na+,Cl SO42− | |
| R2 | 0.99 | 0.99 | 0.94 | ||||||
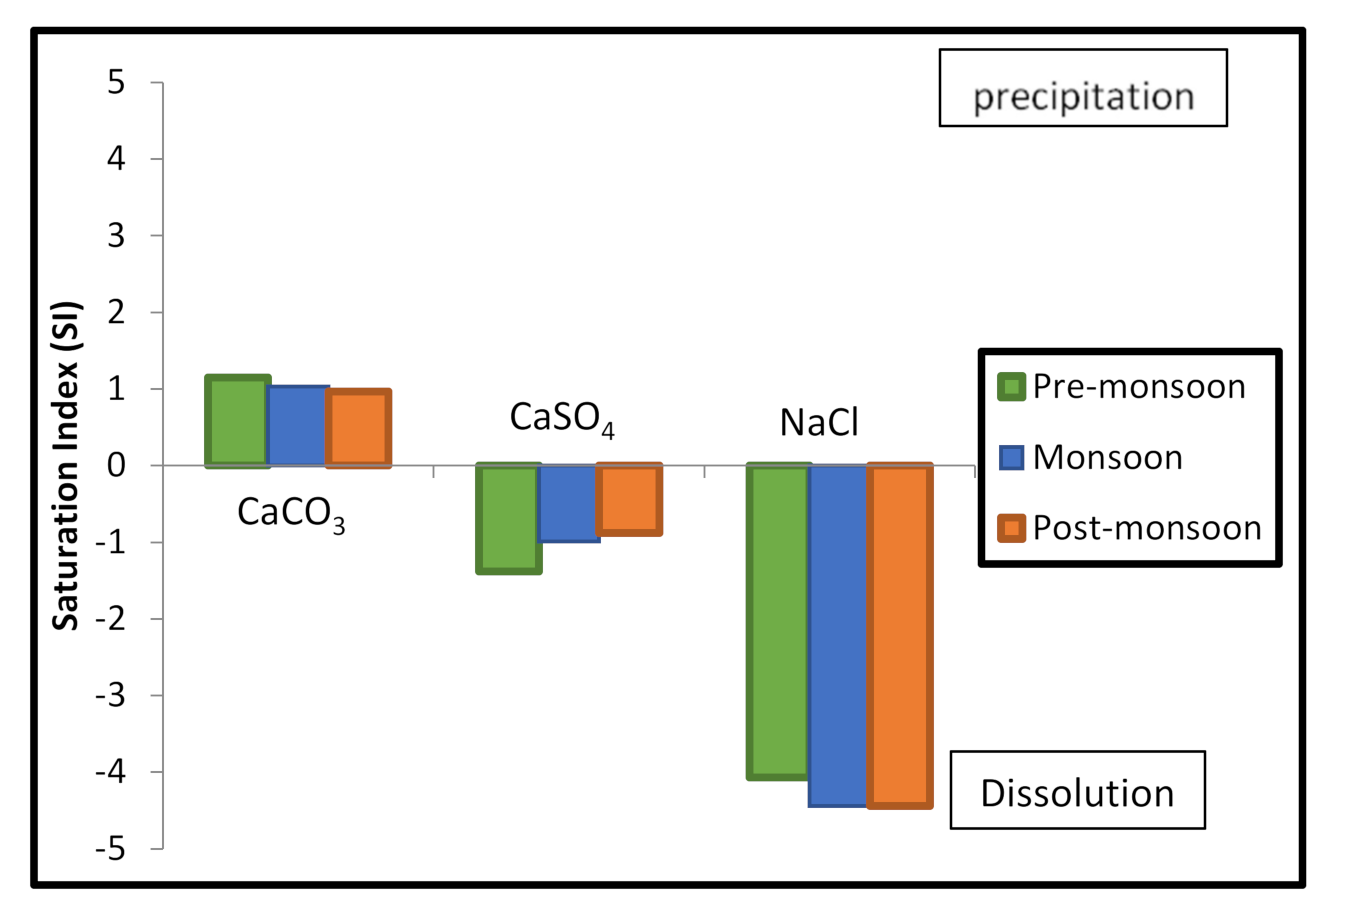
| Seasons | CaCO3 | CaSO4 | NaCl |
|---|---|---|---|
| Pre-monsoon | 1.15 | −1.38 | −4.07 |
| Monsoon | 1.03 | −0.99 | −4.44 |
| Post-monsoon | 0.97 | −0.88 | −4.44 |
Publisher’s Note: MDPI stays neutral with regard to jurisdictional claims in published maps and institutional affiliations. |
© 2021 by the authors. Licensee MDPI, Basel, Switzerland. This article is an open access article distributed under the terms and conditions of the Creative Commons Attribution (CC BY) license (http://creativecommons.org/licenses/by/4.0/).
Share and Cite
Krishan, G.; Sejwal, P.; Bhagwat, A.; Prasad, G.; Yadav, B.K.; Kumar, C.P.; Kansal, M.L.; Singh, S.; Sudarsan, N.; Bradley, A.; et al. Role of Ion Chemistry and Hydro-Geochemical Processes in Aquifer Salinization—A Case Study from a Semi-Arid Region of Haryana, India. Water 2021, 13, 617. https://doi.org/10.3390/w13050617
Krishan G, Sejwal P, Bhagwat A, Prasad G, Yadav BK, Kumar CP, Kansal ML, Singh S, Sudarsan N, Bradley A, et al. Role of Ion Chemistry and Hydro-Geochemical Processes in Aquifer Salinization—A Case Study from a Semi-Arid Region of Haryana, India. Water. 2021; 13(5):617. https://doi.org/10.3390/w13050617
Chicago/Turabian StyleKrishan, Gopal, Priyanka Sejwal, Anjali Bhagwat, Gokul Prasad, Brijesh Kumar Yadav, Chander Prakash Kumar, Mitthan Lal Kansal, Surjeet Singh, Natarajan Sudarsan, Allen Bradley, and et al. 2021. "Role of Ion Chemistry and Hydro-Geochemical Processes in Aquifer Salinization—A Case Study from a Semi-Arid Region of Haryana, India" Water 13, no. 5: 617. https://doi.org/10.3390/w13050617
APA StyleKrishan, G., Sejwal, P., Bhagwat, A., Prasad, G., Yadav, B. K., Kumar, C. P., Kansal, M. L., Singh, S., Sudarsan, N., Bradley, A., Sharma, L. M., & Muste, M. (2021). Role of Ion Chemistry and Hydro-Geochemical Processes in Aquifer Salinization—A Case Study from a Semi-Arid Region of Haryana, India. Water, 13(5), 617. https://doi.org/10.3390/w13050617