Eco-Efficiency Assessment of Control Actions in Wastewater Treatment Plants
Abstract
1. Introduction
2. Materials and Methods
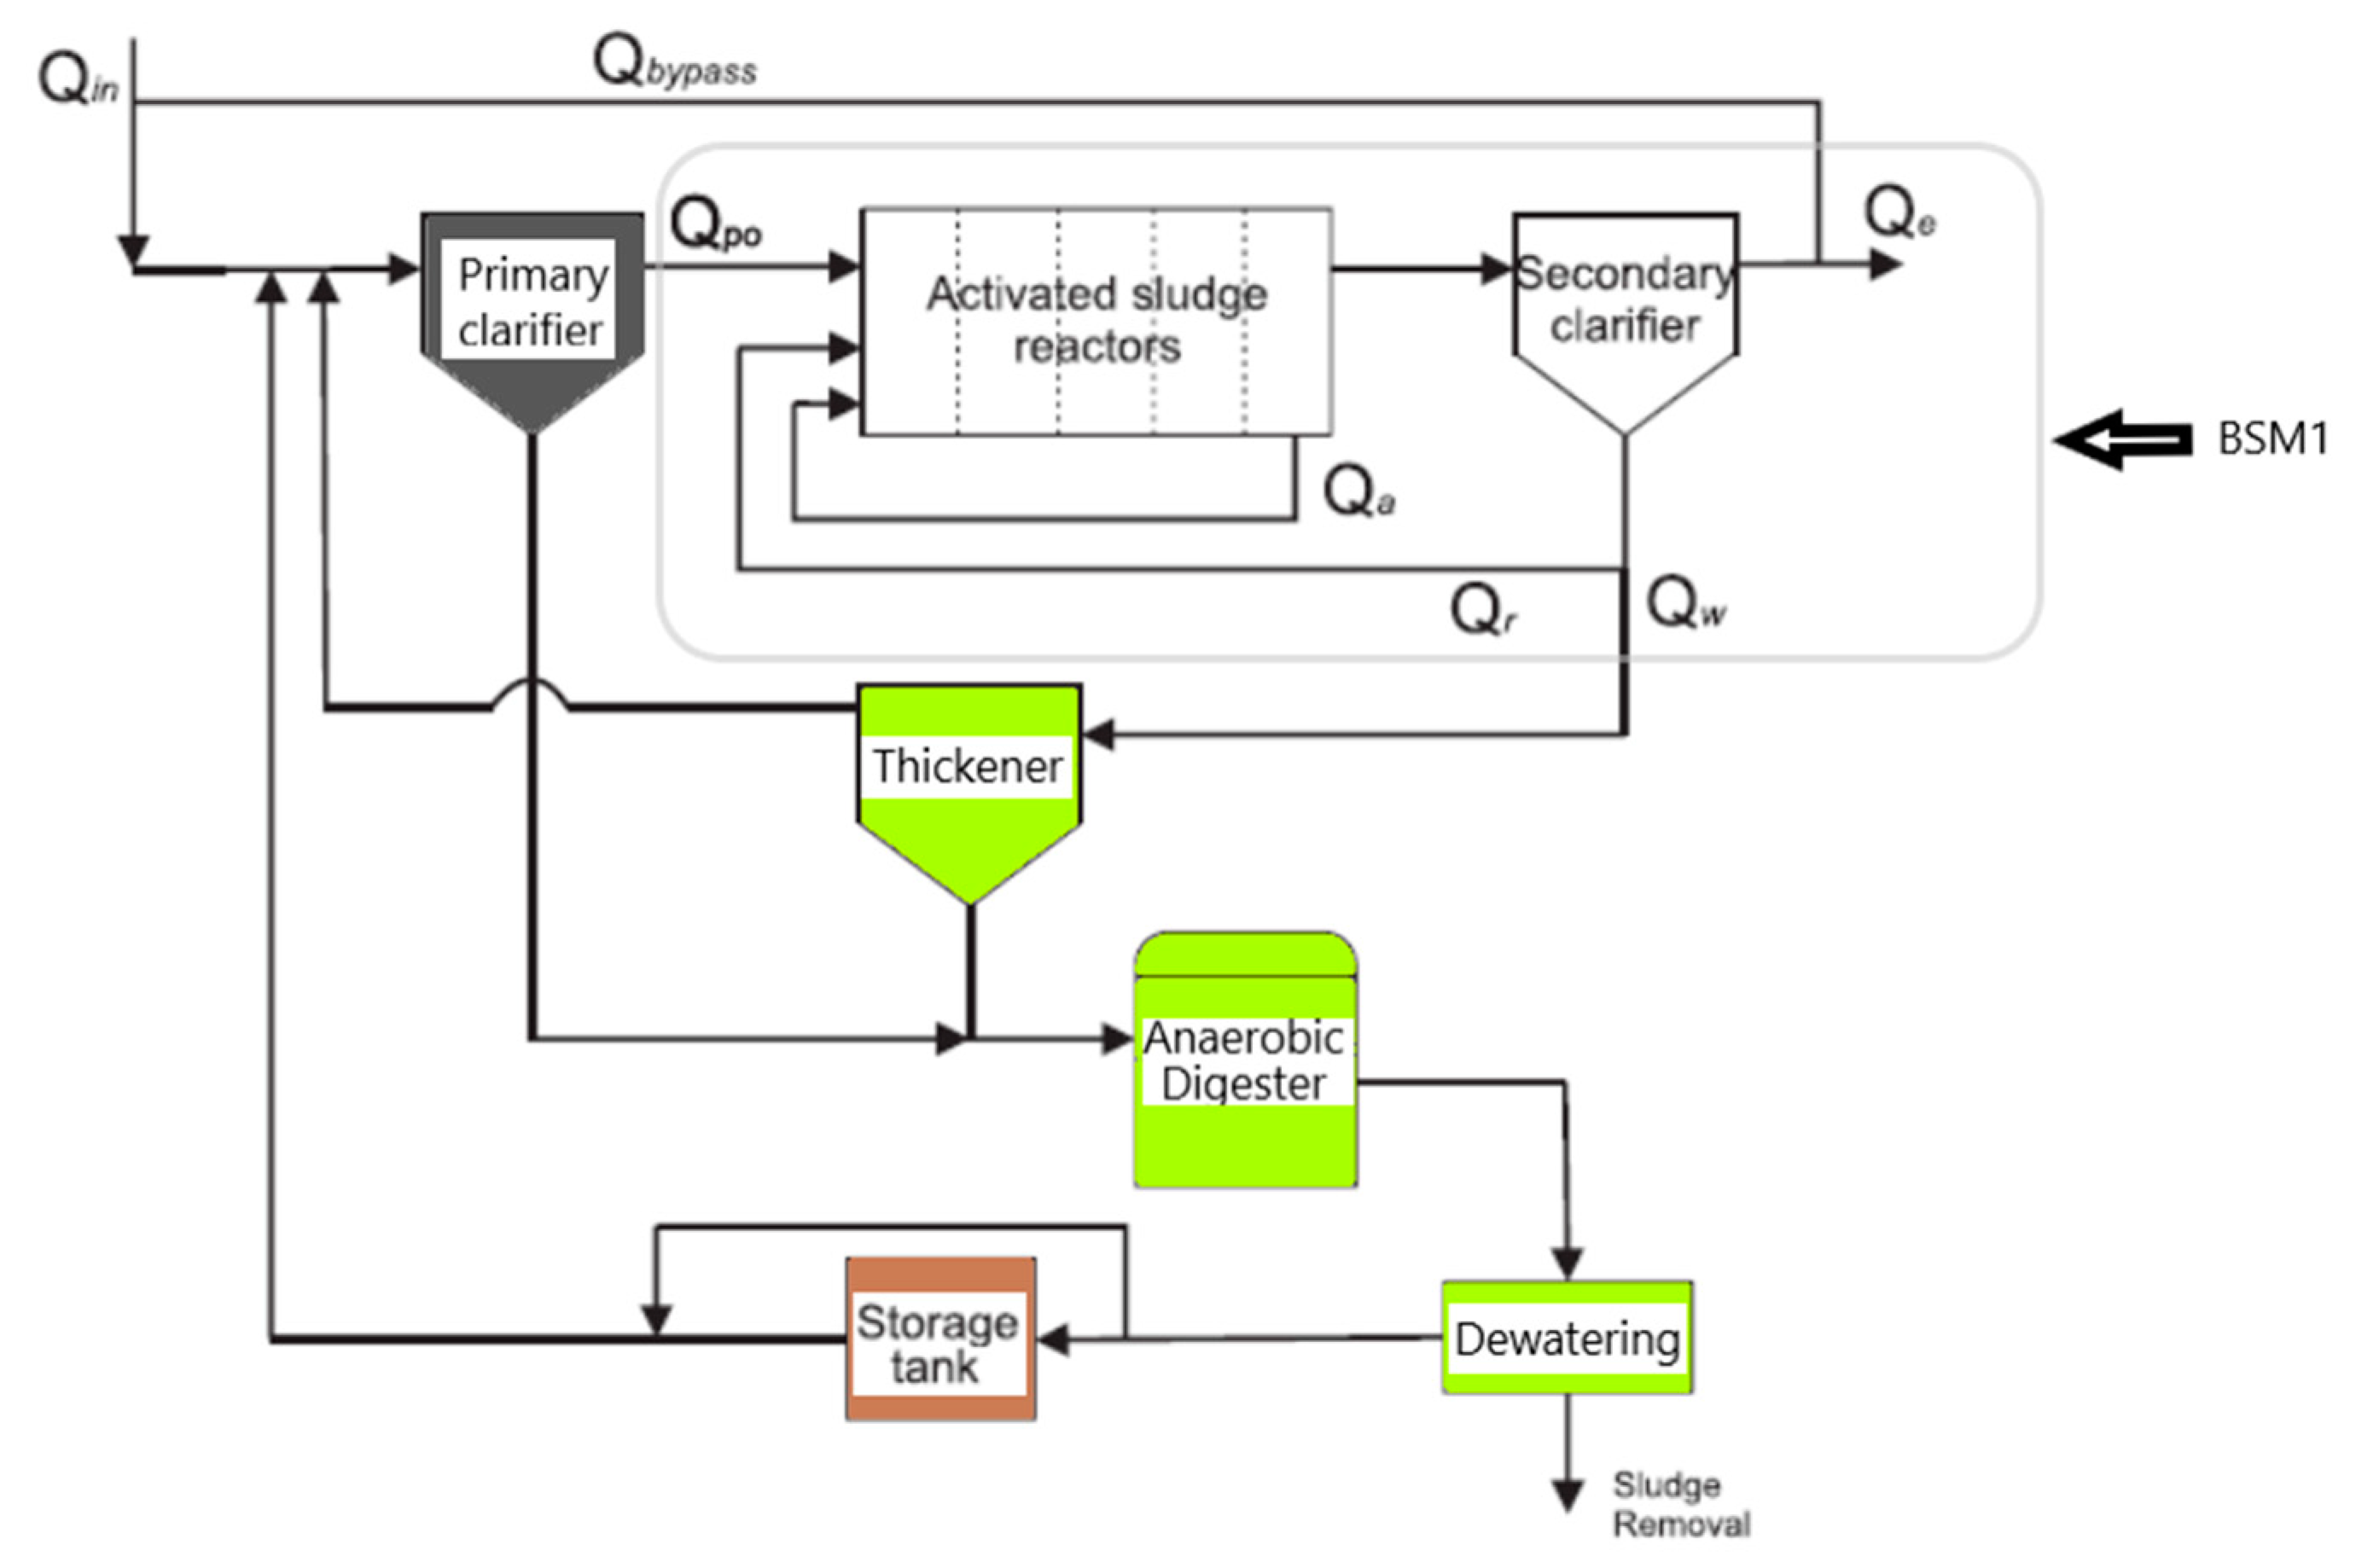
2.1. Description of the Wastewater Treatment Plant Represented by BSM2 Platform
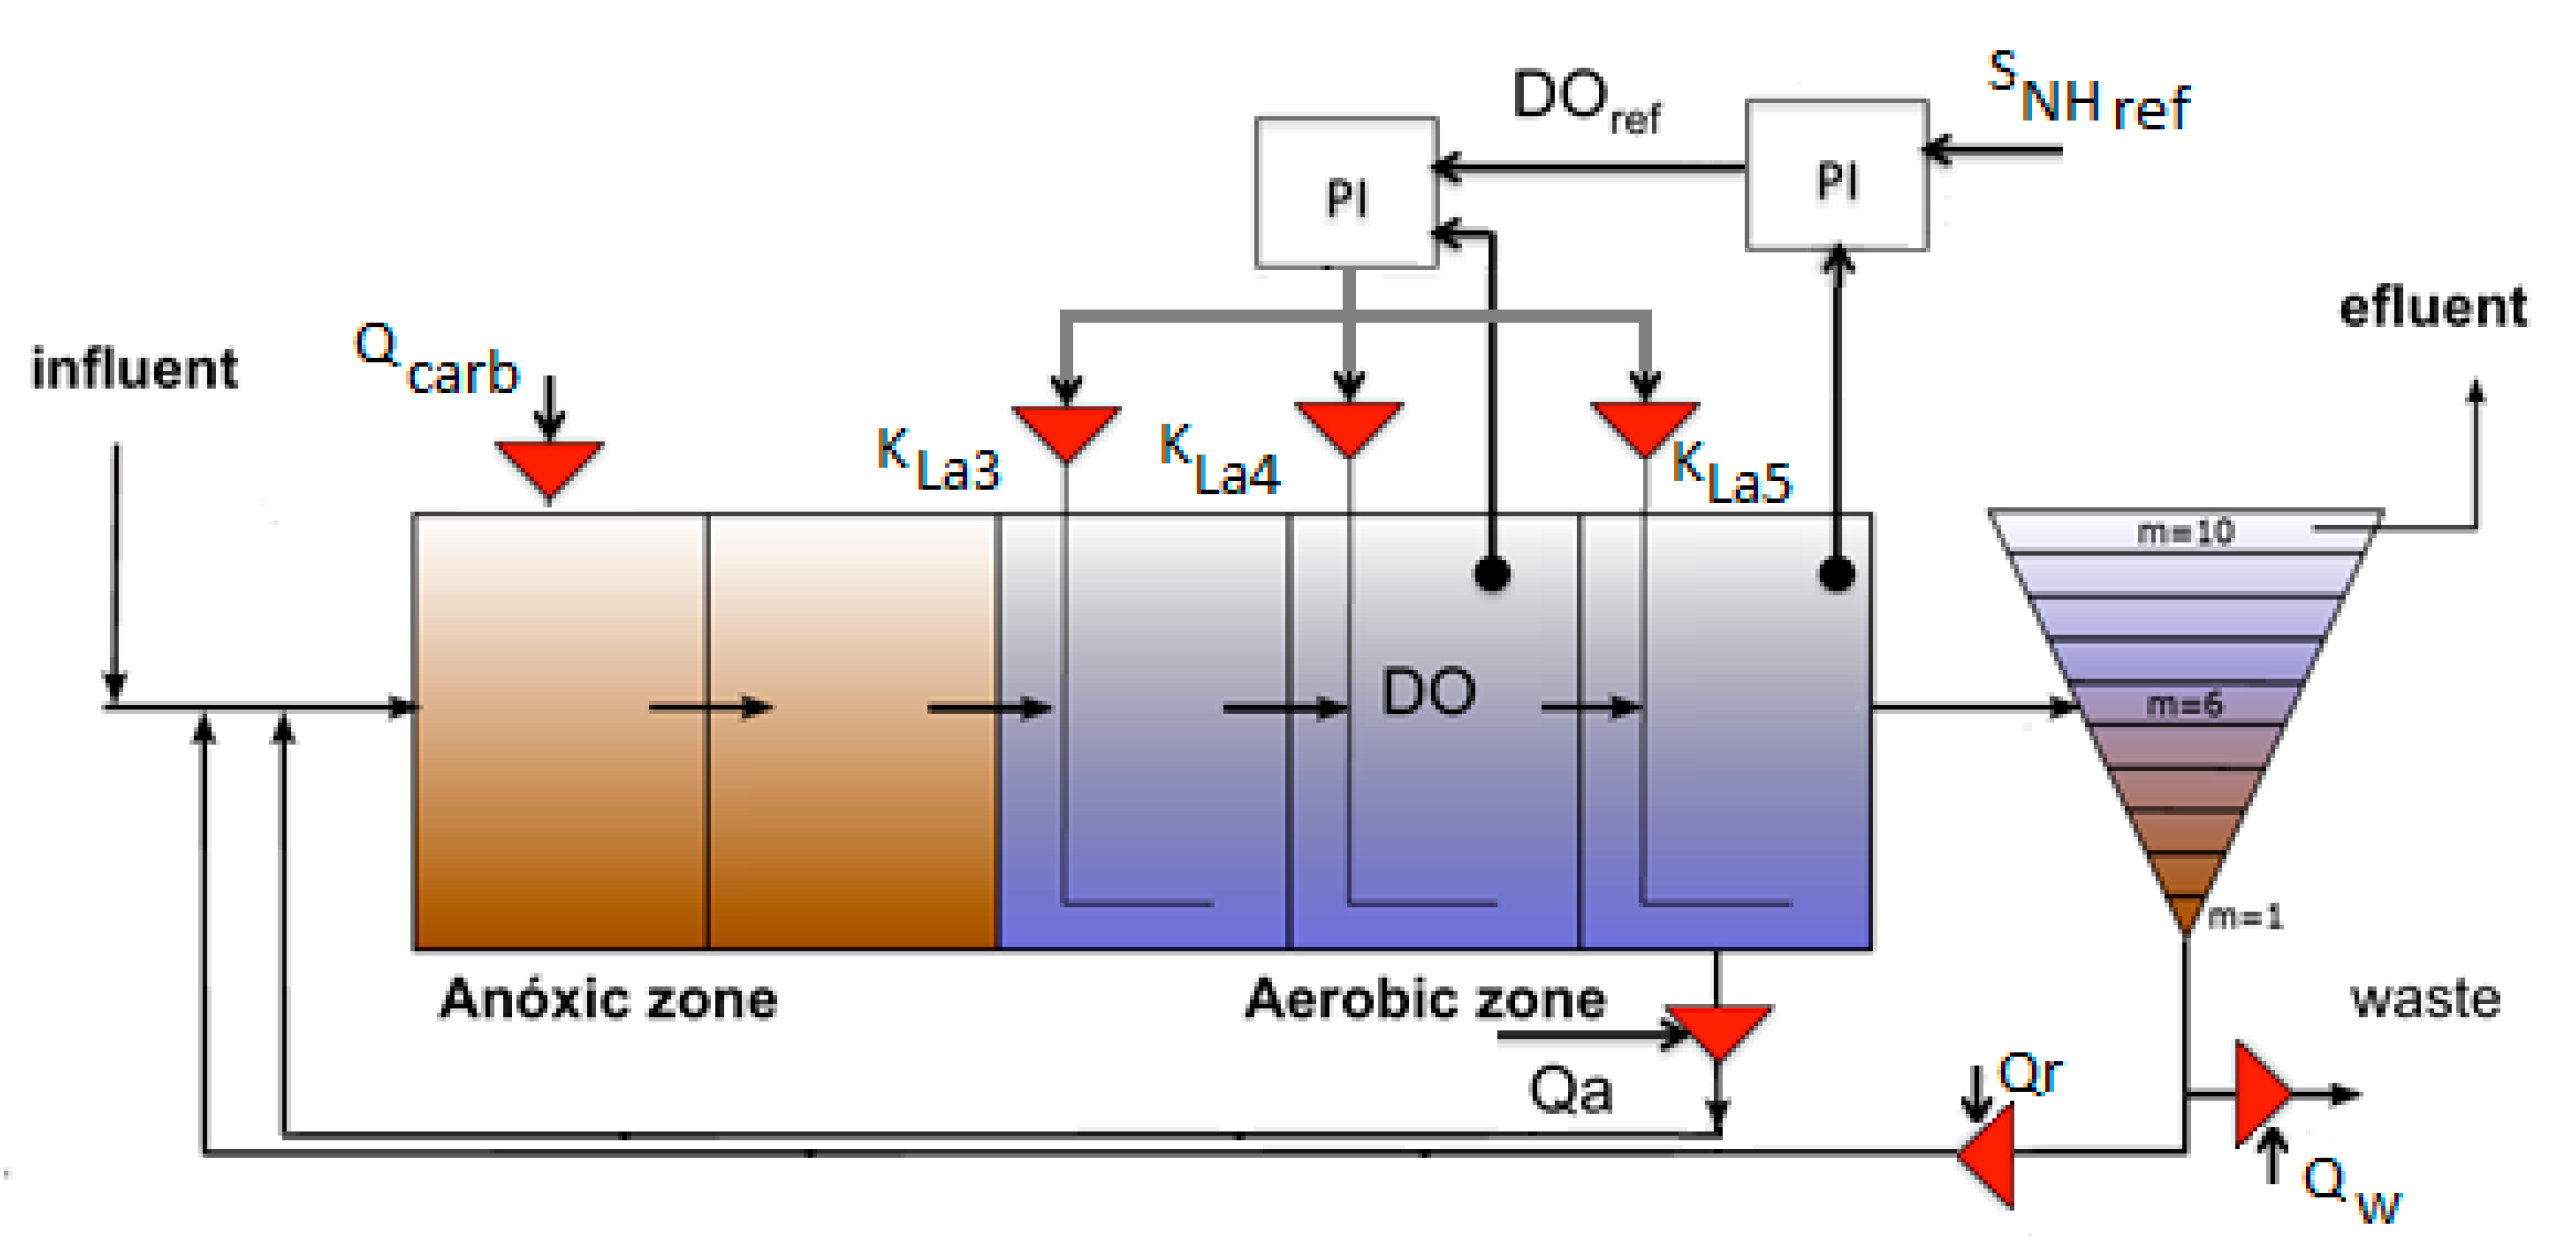
2.2. Plantwide Control Strategy
2.2.1. Selection of Control Actions to Improve Eco-Efficiency of WWTP
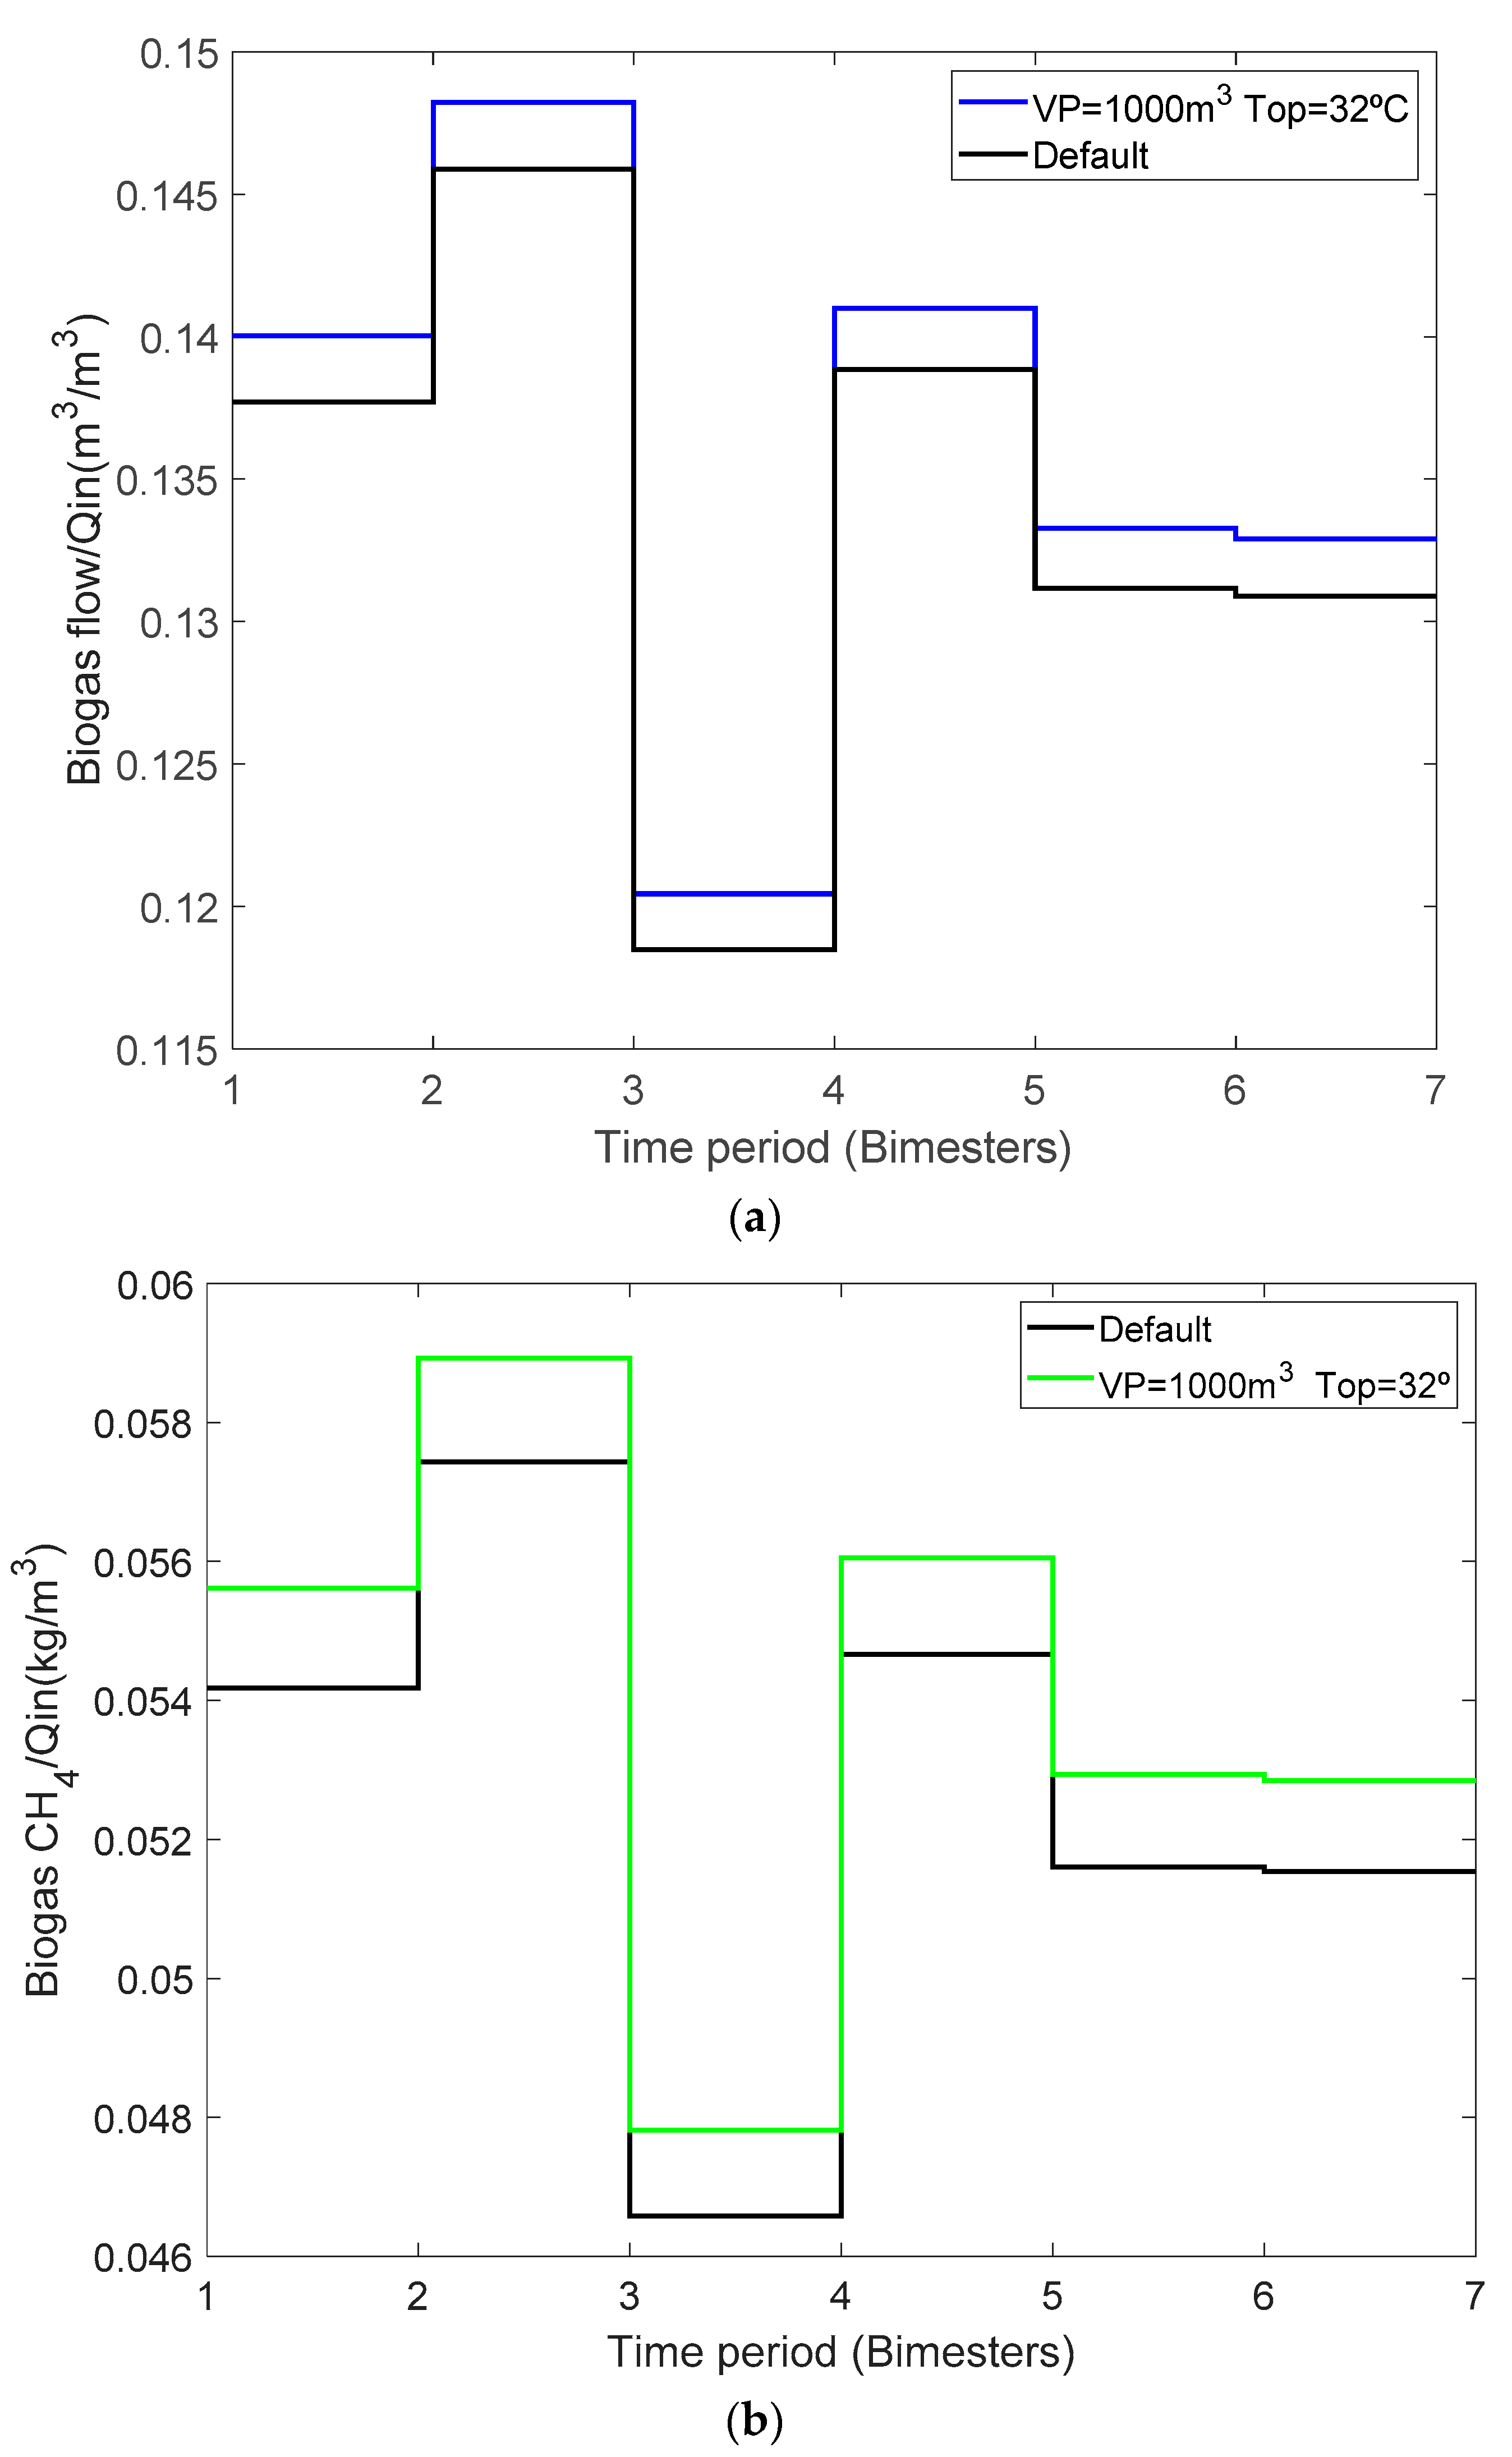
- Primary clarifier volume (VP-m3).
- Operation temperature of digester (Top-°C)
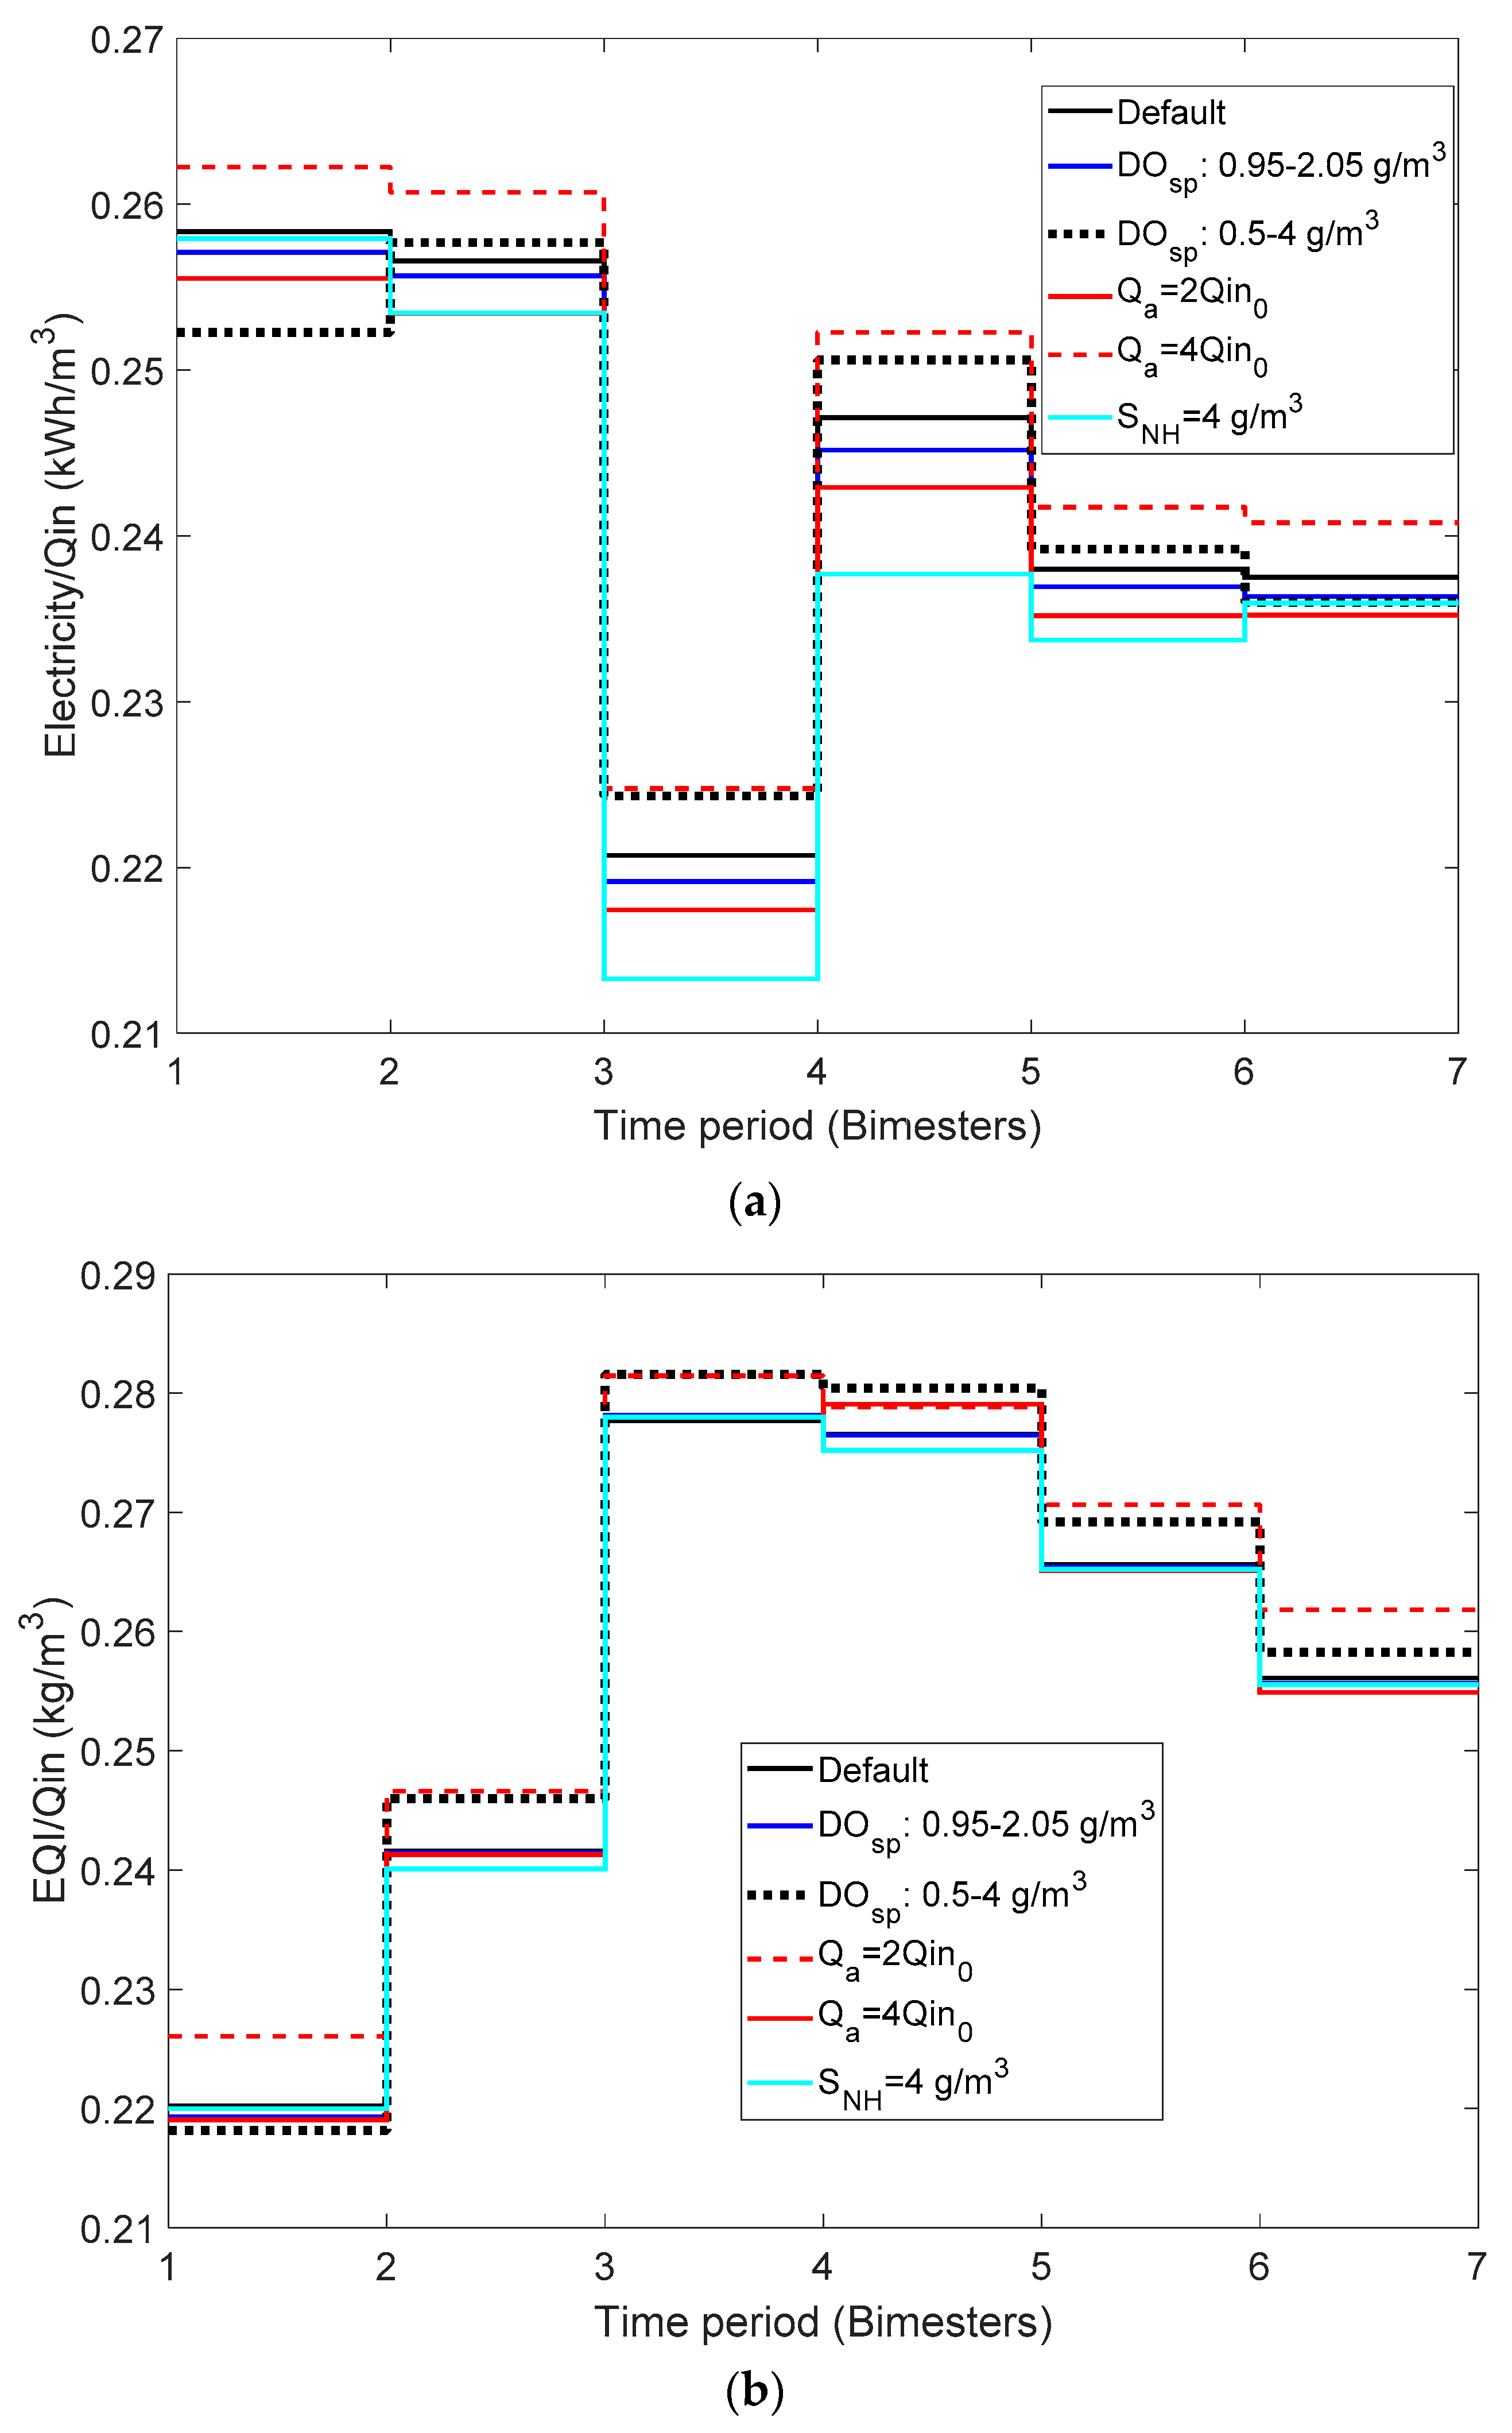
- Limits imposed on DO set-point in the primary loop of ammonium control (DOsp-g/m3)
- Internal recycle flow of activated sludge process (Qa-m3/d)
- Wastage flow of activated sludge process (Qw-m3/d)
- Ammonium set-point (SNHSP-g/m3)
2.3. Performance Indicators and Energy Recovery
2.3.1. Definition of Temporal Windows to Observe Seasonal Effects of Temperature and Selection of Performance Indicators
- Biogas flow (Qgas-m3/d)
- Heating energy (HE-kWh) (Equation (9))
- Net energy (Energy net-kWh/d) (Equation (13))
- Electricity consumption (Electricity, PE +AE + ME-kWh/d) (Equations (4)–(6))
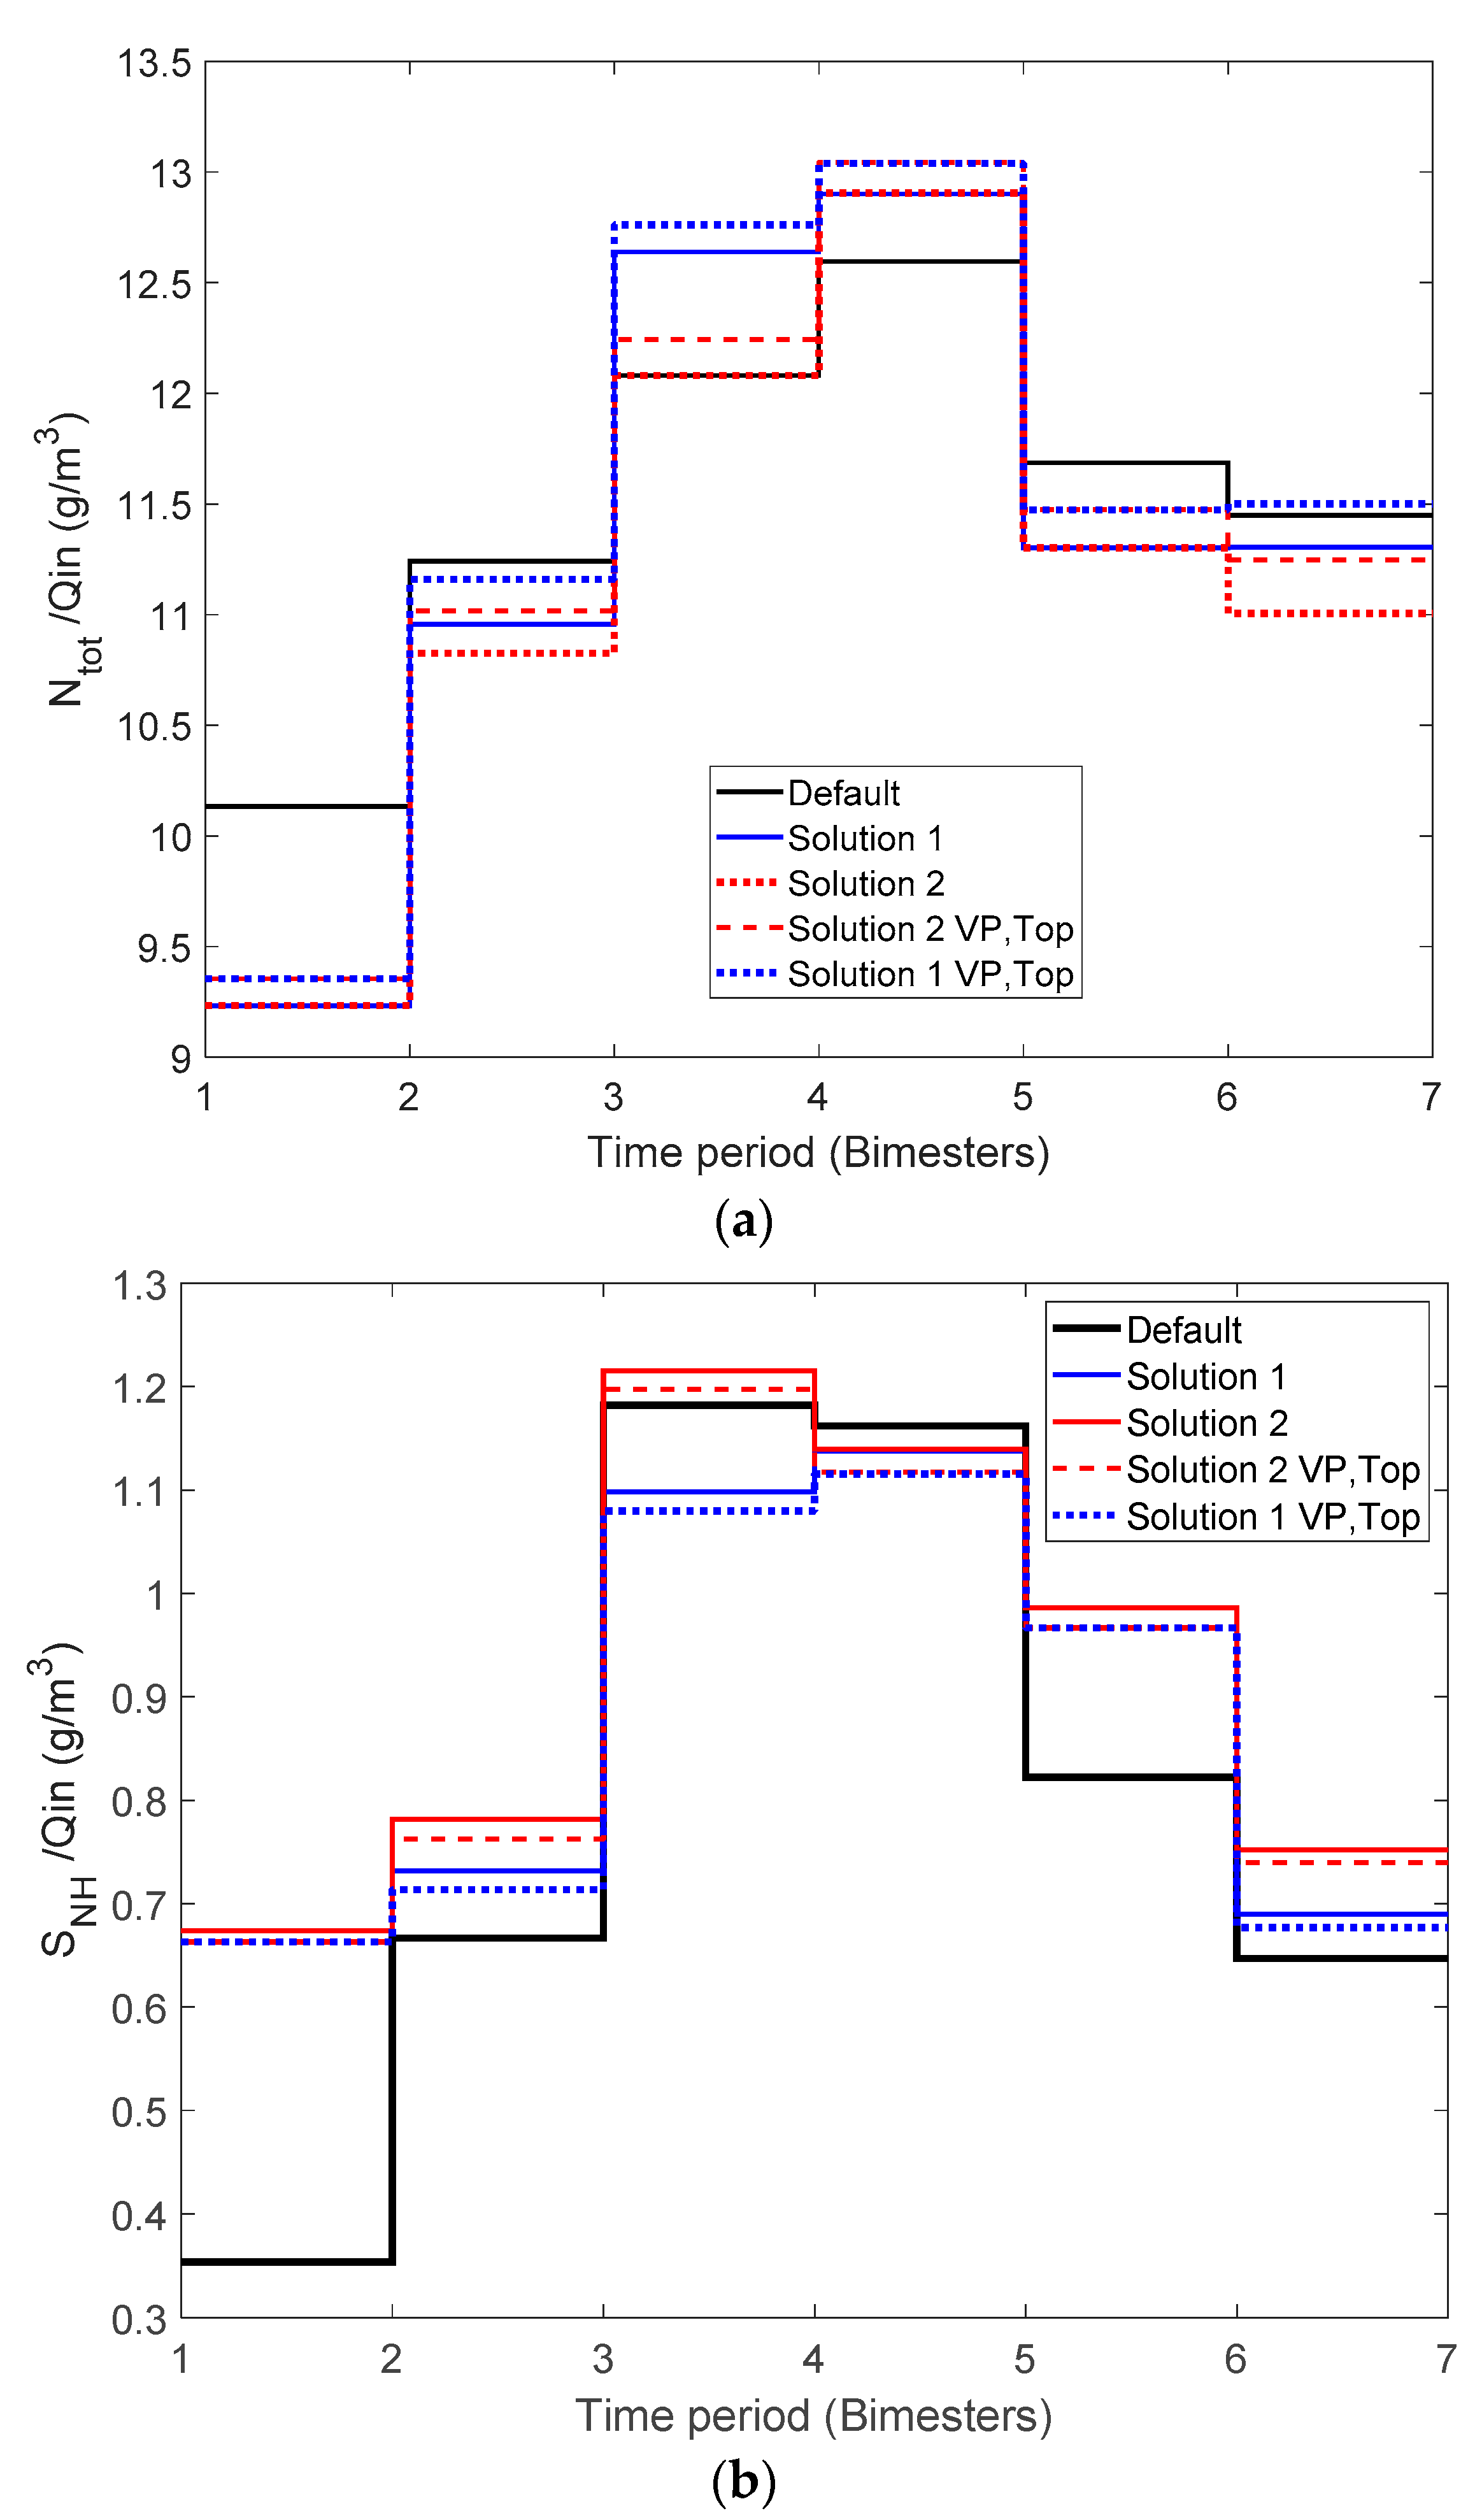
- Effluent quality indicators: effluent quality index (EQI-kg/d) (Equation (1)), total nitrogen (Ntot-g/d), ammonium concentration in the effluent (SNH-g/d)
- Sludge for disposal (Sludge-kg/d)
- Effluent quality index (EQI-kg/d)
- Overall Cost Index (OCI-Eur/d) (Equation (3))
- Net energy (Energy net-kWh/d) (Equation (13))
- Excess heating energy (HEExcess- kWh/d) (Equation (12))
- Electricity consumption (Electricity, PE + AE + ME-kWh/d) (Equations (4)–(6))
- Pumping energy (kWh/d) (Equation (4))
- Aeration energy (AE kWh/d) (Equation (5))
- Heating energy (HE kWh/d) (Equation (9))
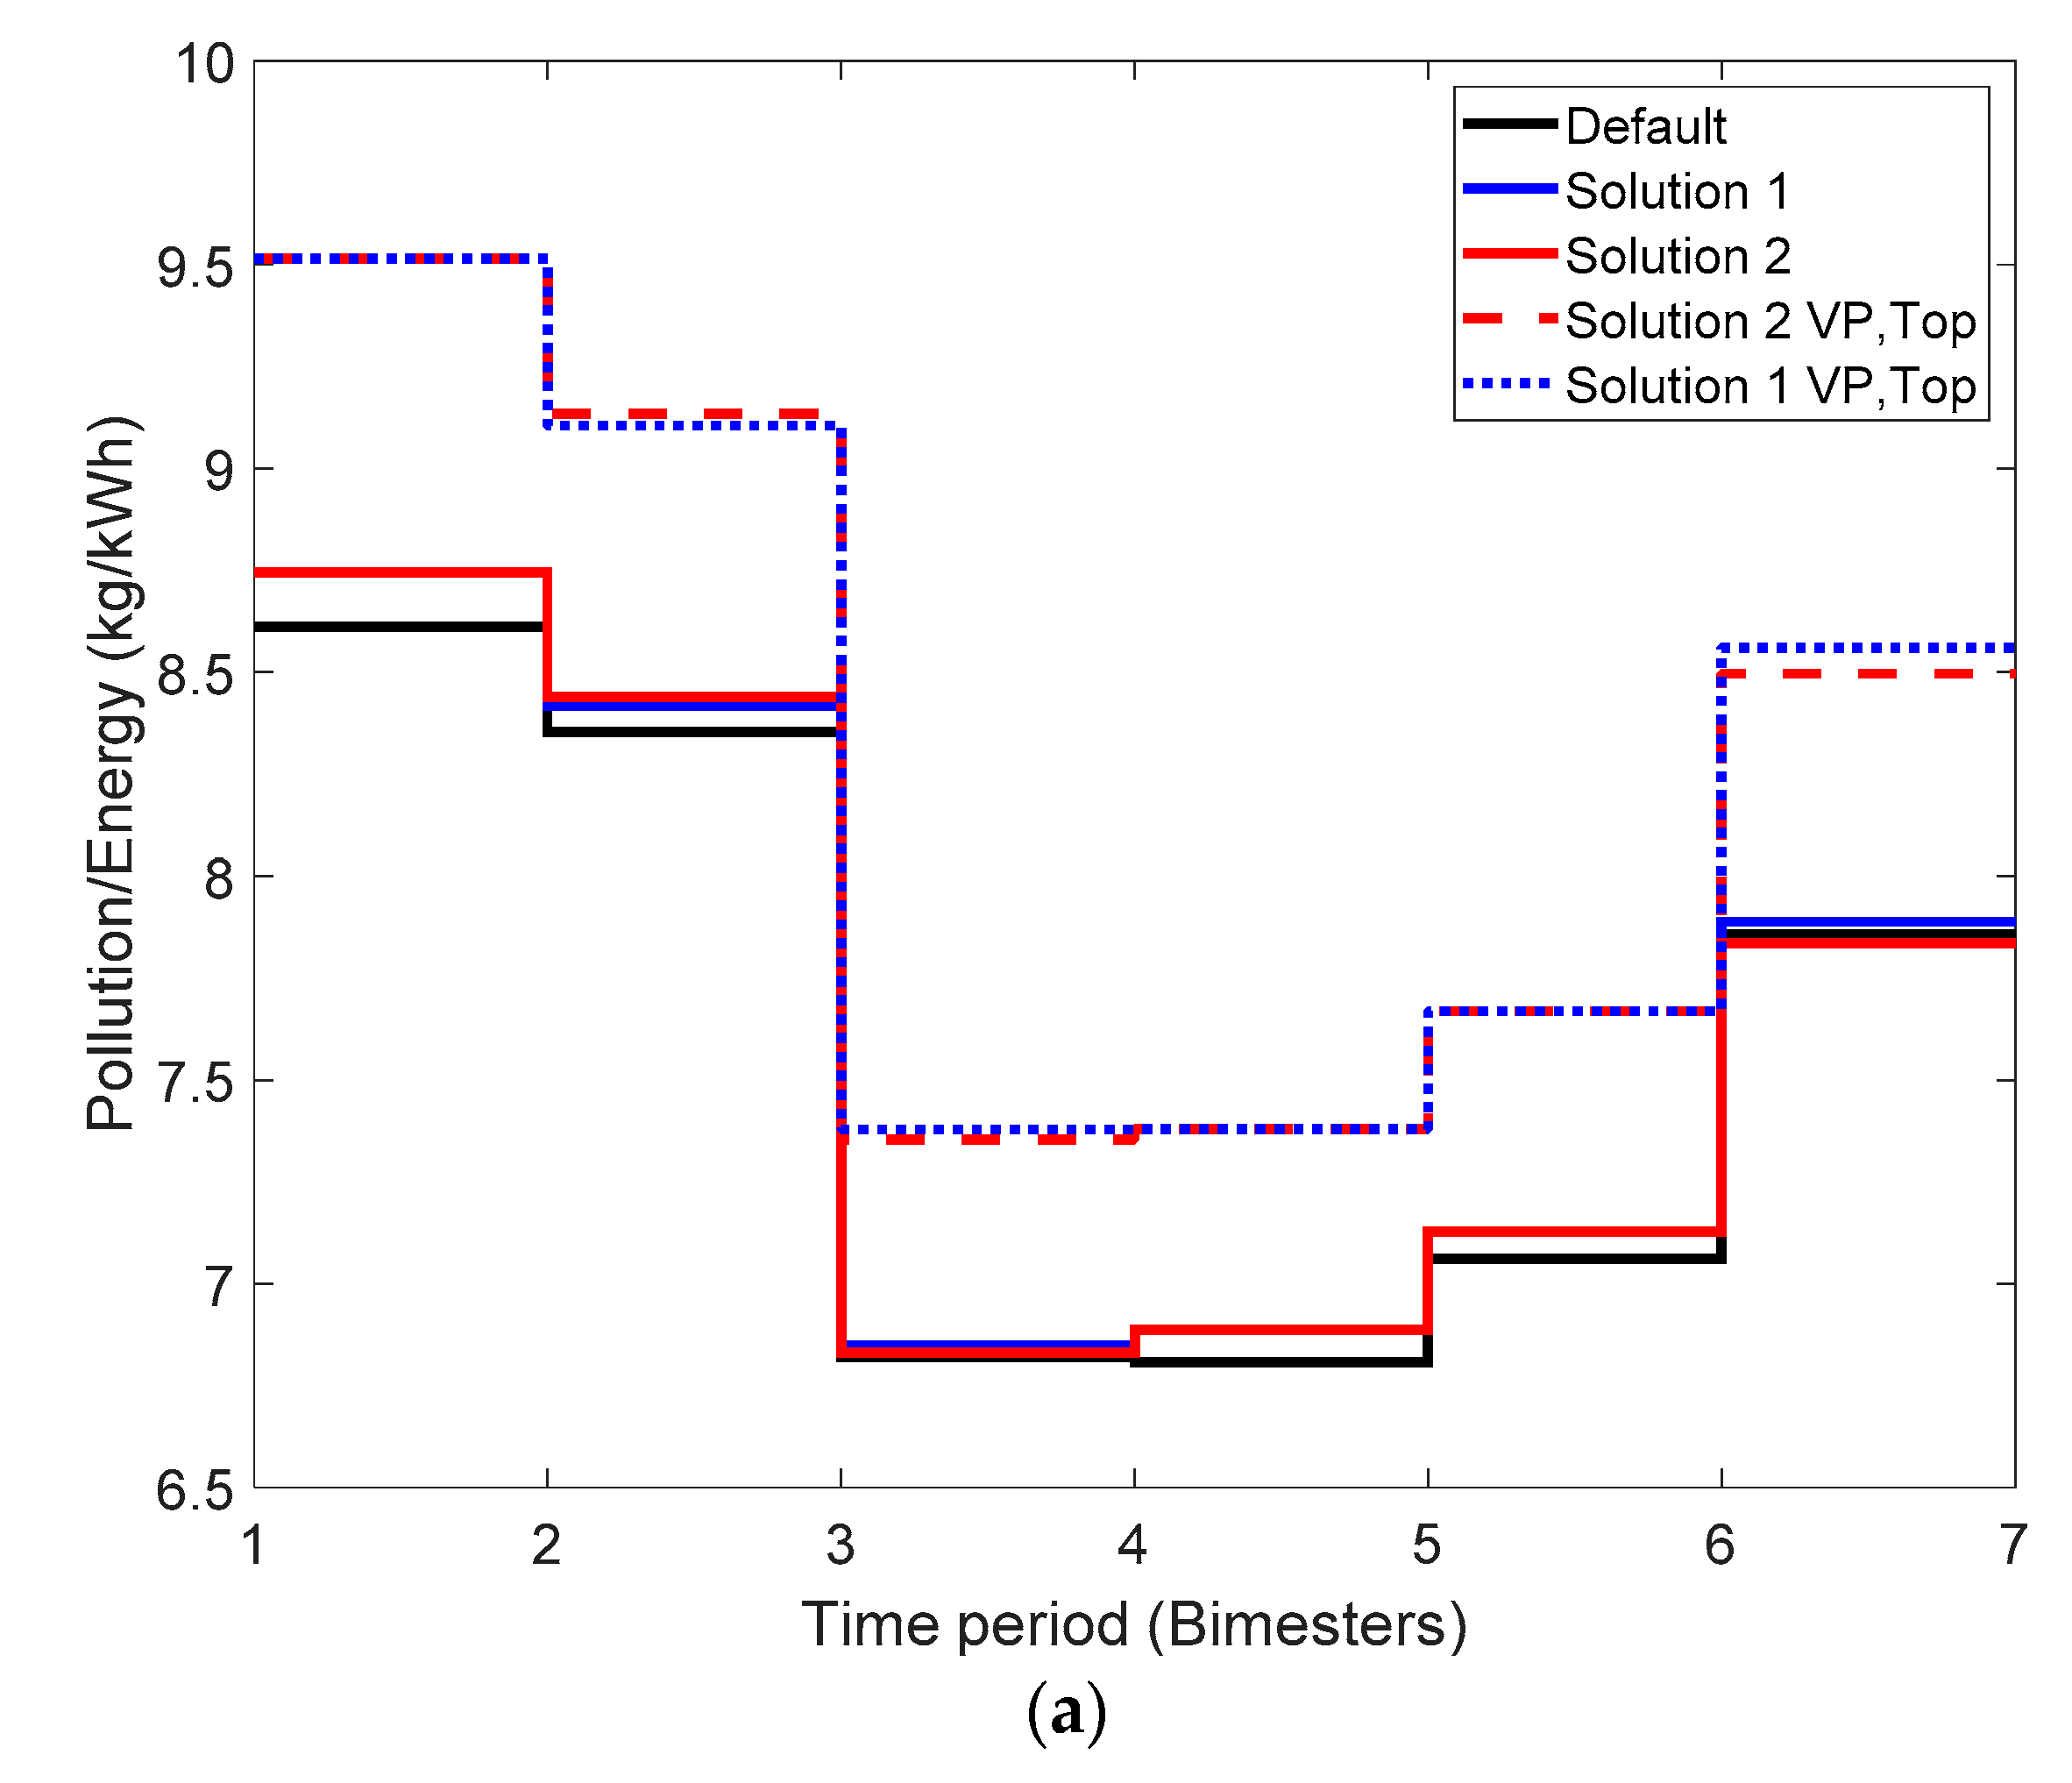
- Energy/Pollution removed (kg/kWh) (Inverse of Equation (14))
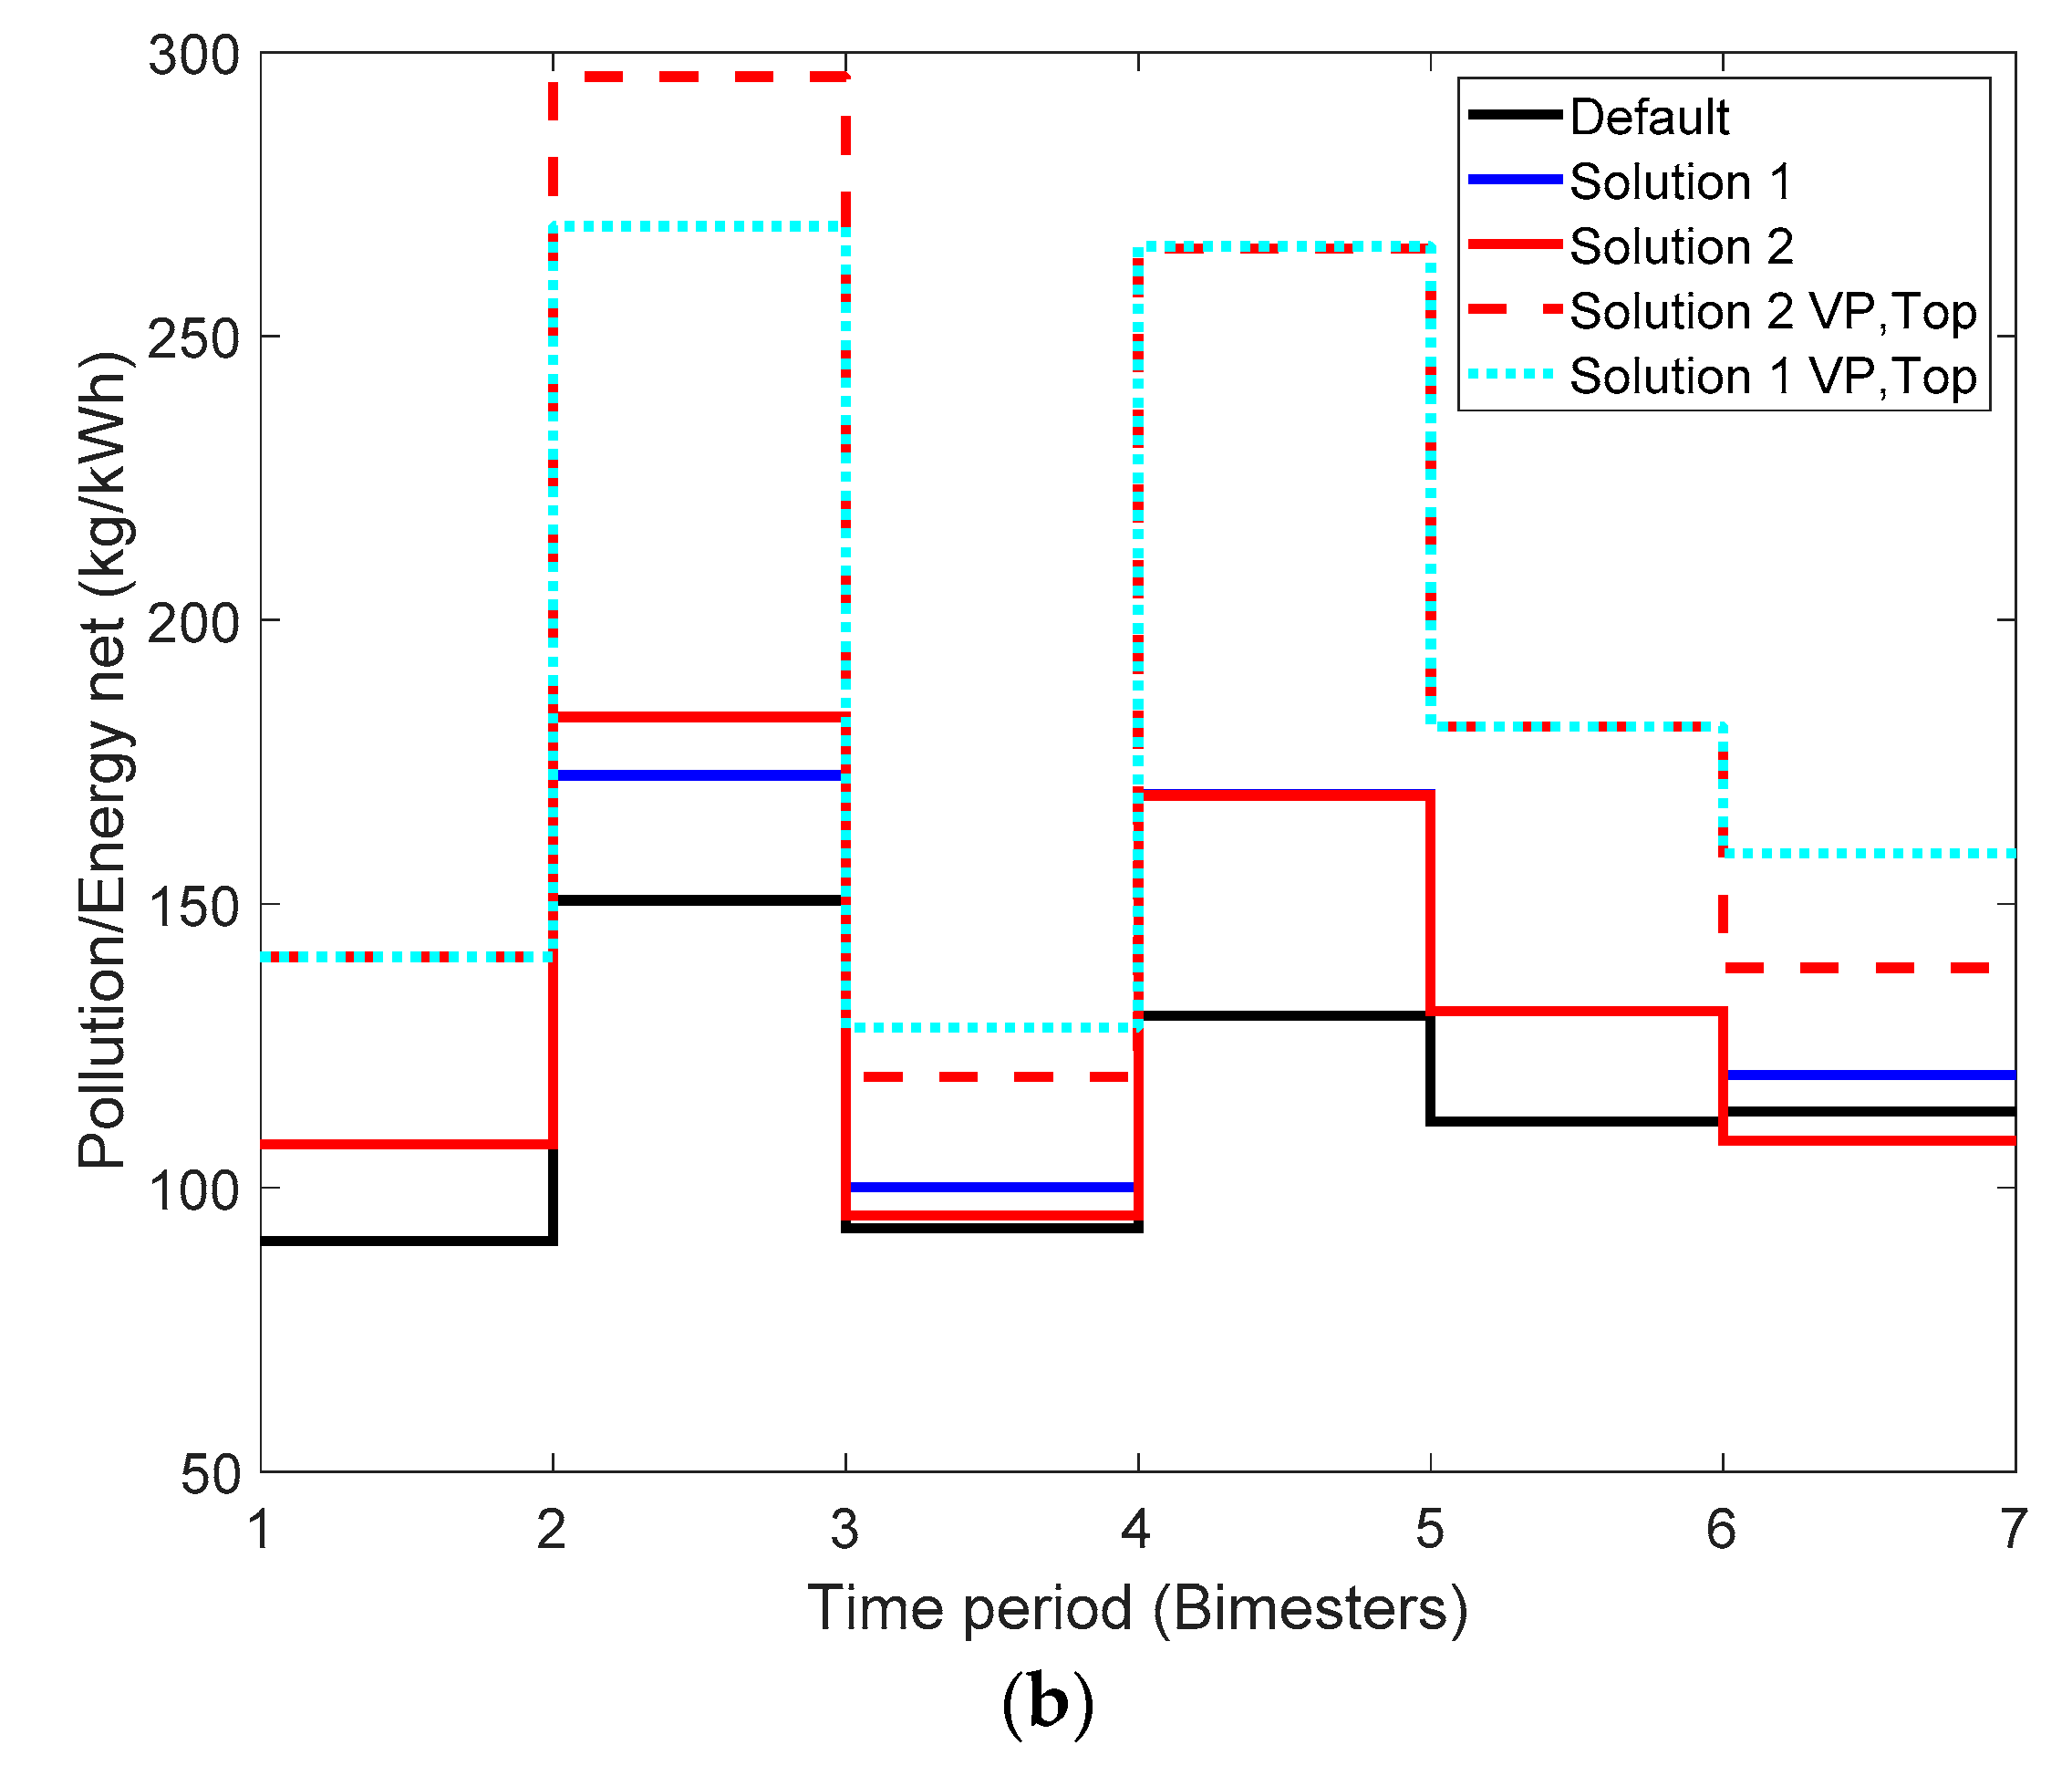
- Energy net/Pollution removed (kg/kWh) (Inverse of Equation (15))
- Violations of the permit limits of total Nitrogen (Ntot-g/d), ammonium concentration (SNH-g/d) and COD in the effluent
2.3.2. Energy Issues Associated with CHP Implementation
3. Results and Discussion
3.1. Assesment of the Effect of Individual Control Actions on WWTP Eco-Efficiency
3.1.1. Impact on Annual Average Performance Indicators
3.1.2. Impact on Bimestrial Average Performance Indicators
3.2. Plantwide Control Solutions to Improve WWTP Eco-Efficiency Framework
4. Conclusions
Author Contributions
Funding
Institutional Review Board Statement
Informed Consent Statement
Data Availability Statement
Acknowledgments
Conflicts of Interest
References
- World Business Council for Sustainable Development. Available online: https://www.wbcsd.org/ (accessed on 18 January 2021).
- Revollar, S.; Meneses, M.; Vilanova, R.; Vega, P.; Francisco, M. Quantifying the Benefit of a Dynamic Performance Assessment of WWTP. Processes 2020, 8, 206. [Google Scholar] [CrossRef]
- Torregrossa, D.; Castellet-Viciano, L.; Hernández-Sancho, F. A data analysis approach to evaluate the impact of the capacity utilization on the energy consumption of wastewater treatment plants. Sustain. Cities Soc. 2019, 45, 307–313. [Google Scholar] [CrossRef]
- Lorenzo Toja, Y.; Vázquez-Rowe, I.; Amores, M.; Termes-Rife, M.; Marín-Navarro, D.; Moreira, M.; Gumersindo, F. Benchmarking wastewater treatment plants under an eco-efficiency perspective. Sci. Total Environ. 2016, 566–567. [Google Scholar] [CrossRef] [PubMed]
- European Environment Agency 2020. Available online: https://www.eea.europa.eu/themes/water/european-waters/water-use-and-environmental-pressures/uwwtd/urban-waste-water-treatment (accessed on 18 January 2021).
- Neczaj, E.; Grosser, A. Circular Economy in Wastewater Treatment Plant–Challenges and Barriers. Proceedings 2018, 2, 614. [Google Scholar] [CrossRef]
- Balkema, A.J.; Preisig, H.A.; Otterpohl, R.; Lambert, F. Indicators for the sustainability assessment of wastewater treatment systems. Urban Water 2002, 4, 153–161. [Google Scholar] [CrossRef]
- Davidson, C.I.; Matthews, H.S.; Hendrickson, C.T.; Bridges, M.W.; Allenby, B.R.; Crittenden, J.C.; Chen, Y.; Williams, E.; Allen, D.T.; Murphy, C.F.; et al. Viewpoint: Adding sustainability to the engineer’s toolbox: A challenge for engineering educators. Environ. Sci. Technol. 2007, 41, 4847–4849. [Google Scholar] [CrossRef] [PubMed][Green Version]
- Revollar, S.; Vilanova, R.; Vega, P.; Francisco, M.; Meneses, M. Wastewater Treatment Plant Operation: Simple Control Schemes with a Holistic Perspective. Sustainability 2020, 12, 768. [Google Scholar] [CrossRef]
- Alex, J.; Benedetti, L.; Copp, J.; Gernaey, K.; Jeppsson, U.; Nopens, I.; Pons, M.; Rosen, C.; Steyer, J.; Vanrolleghem, P.A. Benchmark Simulation Model No. 2 (BSM2); Technical Report No 3; IWA Taskgroup on Benchmarking of Control Strategies for WWTPs: London, UK, 2018. [Google Scholar]
- Ellen Macarthur Foundation 2020. Available online: https://www.ellenmacarthurfoundation.org/explore/systems-and-the-circular-economy (accessed on 15 December 2020).
- Gernaey, K.; Jeppsson, U.; Vanrolleghem, P.; Copp, J.; Steyer, J. Benchmarking of Control Strategies for Wastewater Treatment Plants; IWA Publishing: Colchester, UK, 2010. [Google Scholar]
- Rosén, C.; Jeppsson, U. Aspects on ADM1 Implementation within the BSM2 Framework; Cod.: LUTEDX/(TEIE-7224); Department of Industrial Electrical Engineering and Automation, Lund Institute of Technology, (TEIE): Lund, Sweden, 2006; pp. 1–35. [Google Scholar]
- Gernaey, K.V.; Rosén, C.; Jeppsson, U. BSM2: A Model for Dynamic Influent Data Generation; Cod.: LUTEDX/(TEIE-7231); Lund University: Lund, Sweden, 2005; pp. 1–73. [Google Scholar]
- Alex, J.; Benedetti, L.; Copp, J.; Gernaey, K.; Jeppsson, U.; Nopens, I.; Pons, M.; Rieger, L.; Rosen, C.; Steyer, J.; et al. Benchmark Simulation Model No. 1 (BSM1). IWA Taskgroup on Benchmarking of Control Strategies for WWTPs; Cod.: LUTEDX-TEIE 7229; Dpt. of Industrial Electrical Engineering and Automation, Lund University: Lund, Sweden, 2008; pp. 1–62. [Google Scholar]
- Kiselev, A.; Magaril, E.; Magaril, R.; Panepinto, D.; Ravina, M.; Zanetti, M.C. Towards Circular Economy: Evaluation of Sewage Sludge Biogas Solutions. Resources 2019, 8, 91. [Google Scholar] [CrossRef]
- Riley, D.M.; Tian, J.; Güngör-Demirci, G.; Phelan, P.; Villalobos, J.R.; Milcarek, R.J. Techno-Economic Assessment of CHP Systems in Wastewater Treatment Plants. Environments 2020, 7, 74. [Google Scholar] [CrossRef]
- Bordons, C.; Garcia-Torres, F.; Ridao, M.A. Model predictive control of interconnected microgrids and electric vehicles. Rev. Iberoam. Autom. Inform. Ind. 2020, 17, 239. [Google Scholar] [CrossRef]
- Jeppsson, U.; Pons, M.N.; Nopens, I.; Alex, J.; Copp, J.B.; Gernaey, K.V.; Rosen, C.; Steyer, J.P.; Vanrolleghem, P.A. Benchmark simulation model no 2: General protocol and exploratory case studies. Water Sci. Technol. 2007, 56, 67–78. [Google Scholar] [CrossRef] [PubMed]
- EPA 2011. Available online: https://www.epa.gov/sites/production/files/2015-07/documents/opportunities_for_combined_heat_and_power_at_wastewater_treatment_facilities_market_analysis_and_lessons_from_the_field.pdf (accessed on 15 December 2020).
- Rieger, L.; Jones, R.M.; Dold, P.; Bott, C. Ammonia-based feedforward and feedback aeration control in activated sludge processes. Water Environ. Res. 2014, 86, 63–73. [Google Scholar] [CrossRef] [PubMed]
- Molinos-Senante, M.; Gémar, G.; Gómez, T.; Caballero, R.; Sala-Garrido, R. Ecoefficiency assessment of wastewater treatment plants using a weighted Russell directional distance model. J. Clean. Prod. 2016, 137, 1066e1075. [Google Scholar] [CrossRef]


| Variable | Average | Maximum | Minimum | Bi-m. Av Max. | Bi-m. Av. Min. |
|---|---|---|---|---|---|
| T (°C) | 15 | 20.5 | 9.5 | 19.8 | 10.2 |
| Qin (m3/d) | 20,648 | 85,841 | 5146 | 23,200 | 18,000 |
| Ntot (g/m3) | 55.2 | 114.2 | 7.7 | 59.6 | 50 |
| COD influent (g/m3) | 592.2 | 1213.0 | 36.5 | 615 | 540 |
| Activated Sludge Process (Water Line) | ||
| Control Actions | Parameters | Default Conditions |
| Ammonium-based control scheme | Kp = −1, Ti = 1, Tt = 0.2 | Ammonium set-point: SNHSP = 1 g/m3 DO set-point range: 1.0–2.5 g/m3 |
| Open loop control of [2,9,10]: | ||
| Carbon dosage (Qcarb) | Qcarb = 2 m3/d | |
| Sludge age manipulating Qw | Warm season: Qw = 450 m3/d Cold season: Qw = 300 m3/d | |
| F:M ratio manipulating Qr | Qr = 20,648 m3/d | |
| Nitrates concentration in the anoxic zone manipulating Qa | Qa = 61,944 m3/d | |
| Primary clarifier (Water line) | ||
| Open-loop control of: Separation volume (VP) by manipulation of Qpo | VP = 900 m3 | |
| Anaerobic digester (Sludge line) | ||
| Regulation of Top using heating energy from biogas | Top = 35 °C | |
| Control Handle | Default Value | Variation | |
|---|---|---|---|
| Primary clarifier volume (VP-m3) | 900 m3 | 800 m3 | 1000 m3 |
| Operation temperature of digester (Top-°C) | 35 °C | 32 °C | 37 °C |
| DO set-point limits (DOsp-g/m3) | 1.0–2.5 g/m3 | 0.5–4.0 g/m3 | 0.95–2.05 g/m3 |
| Internal recycle flow-ASP (Qa-m3/d) | 61,944 m3/d | 2 Qin0 | 4 Qin0 |
| Wastage flow-ASP (Qw-m3/d) | Warm season: 450 m3/d Cold season: 300 m3/d | 300 m3/d full operation horizon | 450 m3/d full operation horizon |
| Ammonium set-point (SNHSP-g/m3) | 1.0 g/m3 | - | 4 g/m3 |
| Default | VP = 800 m3 | VP = 1000 m3 | Top = 32 °C | Top = 38 °C | |
|---|---|---|---|---|---|
| Qgas/Qin | 0.133 | 1.785 | −1.600 | 0 | 0 |
| HE (kWh/m3) | 0.204 | −0.351 | 0.315 | 14.91 | −14.91 |
| Energy net/Qin (Enet, Equation (13)) (kWh/m3) | 131.03 | −18.70 | 16.80 | 7.05 | −6.73 |
| Electricity/Qin (kWh/m3) | 0.242 | −0.764 | 0.677 | 0 | 0 |
| EQI/Qin (kg/m3) | 0.257 | 0.330 | −0.365 | 0 | 0 |
| Ntot (g/m3) | 11.56 | 1.664 | −1.612 | 0 | 0 |
| SNH (g/m3) | 0.817 | −1.902 | 1.774 | 0 | 0 |
| Sludge (kg/m3) | 131.03 | 0 | 0 | 0 | 0 |
| CH4/CO2 ratio | 0.69 | 0 | 0 | 0 | 0 |
| Default | DOsp: 0.95–2.05 g/m3 | DOsp: 0.5–4.0 g/m3 | Qa = 2 Qin0 | Qa = 4 Qin0 | Qw = 300 m3/d | Qw = 450 m3/d | SNHSP = 4.0 g/m3 | |
|---|---|---|---|---|---|---|---|---|
| Qgas/Qin | 0.133 | 0 | 0 | 0 | 0 | 2.33 | −2.76 | 0 |
| HE (kWh/m3) | 0.204 | 0 | 0 | 0 | 0 | 1.11 | −1.77 | 0 |
| Energy net/Qin (Enet, Equation (13)) (kWh/m3) | 0.03 | 4.50 | −1.18 | 10.30 | −13.30 | −26.10 | 15.3 | 14.91 |
| Electricity/Qin (kWh/m3) | 0.24 | 0.55 | −0.17 | 1.27 | −1.66 | −1.16 | −0.58 | 1.83 |
| EQI/Qin (kg/m3) | 0.26 | 0.08 | −1.05 | −1.79 | 0.032 | 1.63 | −5.91 | 0.23 |
| Ntot (g/m3) | 11.56 | 0.87 | 1.89 | −5.19 | 1.03 | 4.52 | −10.88 | 3.41 |
| SNH (g/m3) | 0.82 | −4.81 | −28.8 | 8.14 | −6.26 | 14.92 | −41.91 | −20.15 |
| Sludge (kg/m3) | 131.0 | 0 | 0.012 | 0 | 0 | 1.94 | −2.08 | 0 |
| CH4/CO2 ratio | 0.69 | 0 | 0 | 0 | 0 | 0 | 0 | 0 |
| Default | ||||||
|---|---|---|---|---|---|---|
| Bimester | 1 | 2 | 3 | 4 | 5 | 6 |
| Electricity/Qin (kWh/ m3) | 0.258 | 0.257 | 0.221 | 0.247 | 0.238 | 0.237 |
| EQI/Qin (kg/m3) | 0.220 | 0.242 | 0.278 | 0.277 | 0.266 | 0.256 |
| Ntot (g/ m3) | 10.132 | 11.242 | 12.080 | 12.595 | 11.686 | 11.449 |
| SNH (g/ m3) | 0.353 | 0.667 | 1.182 | 1.162 | 0.822 | 0.647 |
| DOsp: 0.95–2.05 g/m3 | ||||||
| Bimester | 1 | 2 | 3 | 4 | 5 | 6 |
| Electricity/Qin (kWh/ m3) | 0.482 | 0.349 | 0.715 | 0.789 | 0.444 | 0.485 |
| EQI/Qin (kg/m3) | 0.417 | 0.076 | −0.174 | 0.029 | 0.056 | 0.168 |
| Ntot (g/ m3) | 1.438 | 0.812 | 0.600 | 0.740 | 0.762 | 1.023 |
| SNH (g/ m3) | −6.996 | −5.241 | −5.037 | −3.607 | −4.372 | −5.469 |
| DOsp: 0.5–4.0 g/m3 | ||||||
| Bimester | 1 | 2 | 3 | 4 | 5 | 6 |
| Electricity/Qin (kWh/ m3) | 2.350 | −0.435 | −1.627 | −1.413 | −0.510 | 0.634 |
| EQI/Qin (kg/m3) | 0.957 | −1.782 | −1.408 | −1.402 | −1.357 | −0.847 |
| Ntot (g/m3) | 8.896 | 1.800 | −0.886 | −0.924 | 0.736 | 3.730 |
| SNH (g/m3) | −91.320 | −45.793 | −11.790 | −11.509 | −26.348 | −47.694 |
| Qa = 2 Qin0 | ||||||
| Bimester | 1 | 2 | 3 | 4 | 5 | 6 |
| Electricity/Qin (kWh/ m3) | 1.089 | 1.236 | 1.490 | 1.700 | 1.179 | 0.964 |
| EQI/Qin (kg/m3) | −2.634 | −2.046 | −1.364 | −0.833 | −1.893 | −2.238 |
| Ntot (g/m3) | −6.878 | −5.891 | −4.162 | −2.964 | −5.507 | −6.230 |
| SNH (g/m3) | 15.169 | 11.847 | 5.095 | 5.918 | 8.620 | 10.355 |
| Qa = 4 Qin0 | ||||||
| Bimester | 1 | 2 | 3 | 4 | 5 | 6 |
| Electricity/Qin (kWh/m3) | −1.510 | −1.618 | −1.835 | −2.084 | −1.574 | −1.390 |
| EQI/Qin (kg/m3) | 0.540 | 0.134 | −0.113 | −0.917 | 0.184 | 0.471 |
| Ntot (g/m3) | 2.188 | 1.485 | 0.524 | −1.210 | 1.377 | 2.088 |
| SNH (g/m3) | −13.071 | −9.288 | −3.714 | −3.972 | −6.613 | −8.501 |
| SNHSP = 4.0 g/m3 | ||||||
| Bimester | 1 | 2 | 3 | 4 | 5 | 6 |
| Electricity/Qin (kWh/m3) | 0.16 | 1.22 | 3.36 | 3.81 | 1.80 | 0.65 |
| EQI/Qin (kg/m3) | 0.12 | 0.64 | −1.20 | 0.49 | 0.14 | 0.22 |
| Ntot (g/m3) | 0.37 | 2.52 | 5.01 | 6.91 | 3.32 | 1.25 |
| SNH (g/m3) | −1.56 | −9.41 | −26.6 | −31.22 | −21.04 | −6.64 |
| Bimesters | Solution 1 | Solution 2 |
|---|---|---|
| 1st | DOsp: 0.5–4.0 g/m3, Qa: Default, SNHSP: Default | DOsp: 0.5–4.0 g/m3, Qa: Default, SNHSP: Default |
| 2nd | DOsp: Default, Qa: Default, SNHSP: 4.0 g/m3 | DOsp: 0.95–2.05 g/m3, Qa: Default, SNHSP: 4.0 g/m3 |
| 3rd | DOsp: Default, Qa: 2 Qin0, SNHSP: Default | DOsp: 0.95–2.05 g/m3, Qa: 2 Qin0, SNHSP: Default |
| 4th | DOsp: 0.95–2.05 g/m3, Qa: 2 Qin0, SNHSP: Default | DOsp: 0.95–2.05 g/m3, Qa: 2 Qin0, SNHSP: Default |
| 5th | DOsp: Default, Qa: Default, SNHSP: 4.0 g/m3 | DOsp: Default, Qa: Default, SNHSP: 4.0 g/m3 |
| 6th | DOsp: Default, Qa: Default, SNHSP: 4.0 g/m3 | DOsp: Default, Qa: 4 Qin0, SNHSP: 4.0 g/m3 |
| Default | Solution 1 | Solution 2 | Solution 1 VP, Top | Solution 2 VP, Top | |
|---|---|---|---|---|---|
| EQ (kg/d) | 5318.0 | 5326.6 | 5309.0 | 5339.2 | 5324.7 |
| OCI (BSM2) (Eur/ d) | 9016.2 | 8937.3 | 8953.4 | 8732.3 | 8748.9 |
| Energy net (Enet, Equation (13)) (kWh/d) | 619.5 | 541.4 | 557.7 | 393.8 | 410.6 |
| Excess Heating Energy (kWh/ d) | 2853.2 | 2853.5 | 2853.6 | 3678.2 | 3678.4 |
| Total Electricity consumption (kWh/ d) | 5008.1 | 4930.1 | 4946.5 | 4896.2 | 4913.2 |
| Aeration Energy (kWh/ d) | 3794.6 | 3743.9 | 3731.9 | 3710.0 | 3698.6 |
| Pumping Energy (kWh/ d) | 445.5 | 418.2 | 446.6 | 418.2 | 446.6 |
| Heating Energy (kWh/ d) | 4225.2 | 4225.2 | 4225.2 | 3583.8 | 3583.8 |
| Energy/Pollution removed (kWh/kg) | 0.133 | 0.132 | 0.132 | 0.122 | 0.122 |
| Energy net/Pollution removed (kWh/kg) | 0.009 | 0.008 | 0.008 | 0.006 | 0.006 |
| Ntot Violations (%) | 0.47 | 0.77 | 0.53 | 0.84 | 0.57 |
| Ntot Violations (occur) | 13.00 | 25.00 | 16.00 | 23.00 | 17.00 |
| Ntot Violations (days) | 1.72 | 2.81 | 1.93 | 3.06 | 2.08 |
| SNH Violations (%) | 1.69 | 1.97 | 2.10 | 1.76 | 1.92 |
| SNH Violations (occur) | 55.00 | 66.00 | 70.00 | 60.00 | 65.00 |
| SNH Violations (days) | 6.15 | 7.17 | 7.66 | 6.42 | 6.99 |
| COD Violations (%) | 0.06 | 0.06 | 0.06 | 0.06 | 0.06 |
Publisher’s Note: MDPI stays neutral with regard to jurisdictional claims in published maps and institutional affiliations. |
© 2021 by the authors. Licensee MDPI, Basel, Switzerland. This article is an open access article distributed under the terms and conditions of the Creative Commons Attribution (CC BY) license (http://creativecommons.org/licenses/by/4.0/).
Share and Cite
Revollar, S.; Meneses, M.; Vilanova, R.; Vega, P.; Francisco, M. Eco-Efficiency Assessment of Control Actions in Wastewater Treatment Plants. Water 2021, 13, 612. https://doi.org/10.3390/w13050612
Revollar S, Meneses M, Vilanova R, Vega P, Francisco M. Eco-Efficiency Assessment of Control Actions in Wastewater Treatment Plants. Water. 2021; 13(5):612. https://doi.org/10.3390/w13050612
Chicago/Turabian StyleRevollar, Silvana, Montse Meneses, Ramón Vilanova, Pastora Vega, and Mario Francisco. 2021. "Eco-Efficiency Assessment of Control Actions in Wastewater Treatment Plants" Water 13, no. 5: 612. https://doi.org/10.3390/w13050612
APA StyleRevollar, S., Meneses, M., Vilanova, R., Vega, P., & Francisco, M. (2021). Eco-Efficiency Assessment of Control Actions in Wastewater Treatment Plants. Water, 13(5), 612. https://doi.org/10.3390/w13050612


