
Eutrophication and Geochemistry Drive Pelagic Calcite Precipitation in Lakes


1
Department of Evolutionary Biology, Ecology and Environmental Sciences, Institut de Recerca de la Biodiversitat (IRBio), University of Barcelona, 08028 Barcelona, Spain
2
Institute of Agricultural and Environmental Sciences, Centre for Limnology, Estonian University of Life Sciences, 51006 Tartu, Estonia
3
Catalan Institute for Water Research, ICRA, 17003 Girona, Spain
4
Resources and Ecosystems, University of Girona, 17004 Girona, Spain
*
Authors to whom correspondence should be addressed.
Water 2021, 13(5), 597; https://doi.org/10.3390/w13050597
Submission received: 18 January 2021
/
Revised: 15 February 2021
/
Accepted: 19 February 2021
/
Published: 25 February 2021
(This article belongs to the Special Issue The Impact of Environmental Stressors on Carbon Dynamics in the Aquatic System)
Abstract
:Pelagic calcification shapes the carbon budget of lakes and the sensitivity of dissolved inorganic carbon (DIC) responses to lake metabolism. This process, being tightly linked to primary production, needs to be understood within the context of summer eutrophication which is increasing due to human stressors and global change. Most lake carbon budget models do not account for calcification because the conditions necessary for its occurrence are not well constrained. This study aims at identifying ratios between calcification and primary production and the drivers that control these ratios in freshwater. Using in situ incubations in several European freshwater lakes, we identify a strong relationship between calcite saturation and the ratio between calcification and net ecosystem production (NEP) (p-value < 0.001, R2 = 0.95). NEP-induced calcification is a short-term process that is potentiated by the increase in calcite saturation occurring at longer time scales, usually reaching the highest levels in summer. The resulting summer calcification event has effects on the DIC equilibria, causing deviations from the metabolic 1:1 stoichiometry between DIC and dissolved oxygen (DO). The strong dependency of the ratio between NEP and calcification on calcite saturation can be used to develop a suitable parameterization to account for calcification in lake carbon budgets.
1. Introduction
Considering their comparatively small global surface area, lakes and reservoirs play a disproportionate role in the continental carbon (C) cycle due to their large contributions of carbon dioxide (CO2) and methane emissions to the atmosphere and burial of organic carbon (OC) in their sediments [1,2,3]. Numerous observations from lakes with low water alkalinity and high dissolved organic carbon (DOC) concentrations have stressed the prevalence of heterotrophy and its paramount effect on lake CO2 fluxes [4,5,6]. However, increasing evidence also stresses the importance of inorganic processes in driving C fluxes in lakes of higher alkalinity (i.e., >1 meq/L), comprising 57% of the world’s lakes area [7,8]. In such systems, pelagic calcite precipitation acts as an important alkalinity sink and CO2 source [9]. Identifying the drivers of this process is necessary to be able to estimate its contribution to carbon fluxes.
High rates of calcite precipitation are often found during the summer season when calcite saturation peaks due to enhanced primary production that raises the pH [9,10,11,12]. The abundance of nucleation sites provided by autotrophic picoplankton, particularly picocyanobacteria, further facilitates calcite precipitation in the pelagic zones of lakes [13,14,15], which in some cases reach such intensities where lakes take on a milky appearance caused by the calcite crystals that can be seen from satellite imagery [16]. Calcification is therefore expected to be directly related to primary production, and hence to the trophic state of a lake. In recent decades, eutrophication has become a major issue as the concentrations of dissolved phosphorus and nitrogen in water bodies have increased due to human activities such as extensive agriculture or pollutant discharges from point sources such as sewage water treatment plants [17]. The increasing nutrient supply increases the phytoplankton abundance [18] and can lead to cyanobacteria blooms [19]. Such stressors are likely to promote calcification events in lakes by increasing the pH through increased primary production and by increasing the amount of nucleation sites through picocyanobacteria [13,14,15]. Within this context of increasing eutrophication, quantifying and predicting the way primary production promotes calcification are necessary for estimating carbon budgets in lakes and reservoirs under present and future scenarios. This study is a first attempt at identifying a quantifiable relationship between primary production and calcite precipitation in freshwaters.
Calcification can have a significant effect on the C budget of a lake, simultaneously acting as a C sink to the sediments [10] and increasing the water CO2 partial pressure (pCO2) due to the CO2 release caused by the reaction of calcium carbonate formation [20,21]. However, calcification is not accounted for in C budgets or in lake models for two reasons. Firstly, contrary to marine systems, pelagic calcification is assumed to play a minor role in carbon fluxes of freshwater systems, likely because most studies that link CO2 supersaturation to net heterotrophy are conducted in lakes that have relatively low alkalinity and high dissolved organic carbon (DOC) values [8]. However, calcite precipitation has been presented as a potentially important component of global carbon budgets for saline lakes [22] and recent findings suggest the same for freshwaters [23]. Secondly, there is a need to understand the mechanisms of calcification and the drivers that control it, so that calcification could be parameterized and included in lake models. Currently, the lack of a proper parameterization accounting for CO2 derived from calcite precipitation results in discrepancies between theoretical models and empirical data [24]. This study aims at solving this issue by identifying key variables that control calcite precipitation and that could be used for the parameterization of calcite precipitation.
Attempts to parameterize lake calcification rates have related them to net ecosystem production (NEP) by observing ratios between the two, although calcite precipitation to NEP molar ratios (α) have rarely been studied in freshwater systems. The few studies that have measured this ratio in freshwater systems constrain it in the range between 0.2 and 1 [25,26,27]. This range is similar for marine planktonic assemblages [28] but lower than the ratio of 1.3 found in marine benthic ecosystems [29]. While the 1:1 ratio is often found in calcifying macrophytes, this ratio can increase at pH levels above 9 due to CO32− competing with HCO3− for protonation [26]. The α has been assumed to be alkalinity-dependent [7,30], yet the nature of this dependency is not fully understood nor has it been precisely quantified. The purpose of this study is to identify and quantify the effects of lake NEP on calcification rates under different environmental conditions, by observing variations in α along gradients of calcite saturation and alkalinity. A mechanistic understanding of the occurrence of calcification is necessary for including this process in carbon budgets and for parameterizing calcification effects on CO2 in lake models under different eutrophication scenarios.
2. Materials and Methods
2.1. Study Sites
The study was conducted in 4 European freshwater lakes covering a wide range of water alkalinity (from 0.5 to 4 meq/L; Table A1). The lake with the lowest alkalinity (0.5 meq/L), Valguta Mustjärv, was included in this study to observe the absence of calcification expected from such low-alkalinity lakes. Three lakes in Estonia were sampled during summer 2019 and one reservoir in Spain was sampled during summer 2018. All four water bodies differ substantially in their water retention time as well as in their catchment characteristics (Table 1), especially in regard to land use. However, all of the studied lakes were highly productive, according to nutrient (nitrogen and phosphorus) concentrations and chlorophyll-a values (Table A1). Each of these lakes has been extensively studied and described in detail elsewhere [31,32,33,34].
2.2. Experimental Setup
Five experimental campaigns using in situ incubations were conducted in Sau Reservoir (Spain) from May to August 2018. The following year, the same experiments were performed twice (first in June, then in July 2019) in the three Estonian lakes; Valguta Mustjärv, Erastvere and Võrtsjärv. The sampling combined experimental determination of lake calcification and NEP from the incubations, with high-frequency monitoring (HFM) of lake water characteristics during extended time periods. These two combined approaches were used so that calcification, assessed through experimental samplings, could be understood within the context of seasonal variations in parameters that can affect the process of calcification, especially dissolved oxygen (DO) and temperature as indicators of primary production. The experiment consisted of in situ incubations of surface lake water for 5–6 h, from where the initial and final values of temperature (T), pH, electrical conductivity (EC, µS cm−1), dissolved oxygen (DO, mg L−1), dissolved oxygen saturation (DOsat, %), calcium concentration ([Ca2+] mg L−1) and total alkalinity (TA, meq L−1) were measured. Surface water was collected in a large (>9 L) plastic container from the pelagic zone at the deepest area of each lake. The initial T, pH, EC and DO were determined in triplicate using a handheld sensor calibrated in situ immediately before the experiment (for campaigns in Estonia during June 2019: WTW 2FD47D Multi 3430 Multiparameter Meter with Sentix 940-3 for pH, Tetracon 925 for EC and FDO 925 for DO; for campaigns in Estonia in July: same as in June, except that for DO, we used a Dissolved Oxygen Meter MARVET JUNIOR; for campaigns in Spain: YSI ProODO Handheld for the DO and WTW 3320 for EC and pH). Triplicate water samples for the determination of initial TA (120 mL, stored at 4 °C in Nalgene bottles) and [Ca2+] (10 mL filtered at 0.45 µm, acidified in situ with 100 µL of 60 % HNO3 and stored at 4 °C in PP tubes) were taken for laboratory measurements.
The incubations were performed in 5 transparent Winkler-type glass bottles of 250 mL at 30 cm depth in the littoral zone of each lake to maintain the light conditions of the upper mixed layer. The incubation bottles were carefully filled with water from the container with a pipe to avoid air mixing using a 250 µm mesh fixed between the container and the pipe for filtering zooplankton and detritus. The absence of any small air bubbles inside the bottles was carefully checked before starting the incubations. After the incubation period, the final T, pH, EC and DO were determined immediately after opening each bottle, minimizing turbulence. Triplicate samples were taken from each bottle for later laboratory analysis to determine the final [Ca2+] and TA, following the same procedures as for the initial conditions. All alkalinity samples were stored in a fridge and were measured using H2SO4 0.02 N titration the following day. An automatic titrator (Metrohm 655 Dosimat (in Spain) and SI Analytics TitroLine® 6000 (in Estonia)) was used to determine TA in a large sample volume (60 mL) and slow injection settings. The titrators were configured to increase the precision of the alkalinity determinations to 20 µeq L−1 (determined by replicated titrations of NaCO3 solutions). Samples for [Ca2+] were analyzed using inductively coupled plasma mass spectrometry (ICP-MS). All ICP-MS analyses were performed in a Perkin Elmer Optima 8300 at the Scientific and Technological Centre (CCiT) of the University of Barcelona.
2.3. Open Water Dynamics
Surface water sampling and HFM were used simultaneously in all lakes. However, in Sau Reservoir, surface water sampling was performed 9 times at a time interval of 2–3 weeks from May until the end of September 2018, while only 2 surface water samplings were performed in each Estonian lake. The higher number of surface water samplings in Sau Reservoir allowed us to simultaneously observe, at a finer scale, the trends in [Ca2+], TA and calcite saturation measured from water samples, and the trends in T and DO, from HFM, for the entire summer season.
Surface water samples were taken from the deepest point of the reservoir and analyzed following the same procedures as for the incubations. In Sau, the HFM station [35] was located at the deepest point of the reservoir. DO and T measurements were automatically taken every 5 min using a multiparametric sonde (Yellow Springs Instruments 600XLM V2). The sensors were calibrated before deployment and were placed at a depth of 0.3 m at the deepest area of the reservoir. Sensors were regularly cleaned, and the oxygen sensor was equipped with an automated wiper. No drifts in the measured values were noticed between sampling campaigns, and the data were verified by comparison with the values provided by surface water monitoring using the handheld sensors.
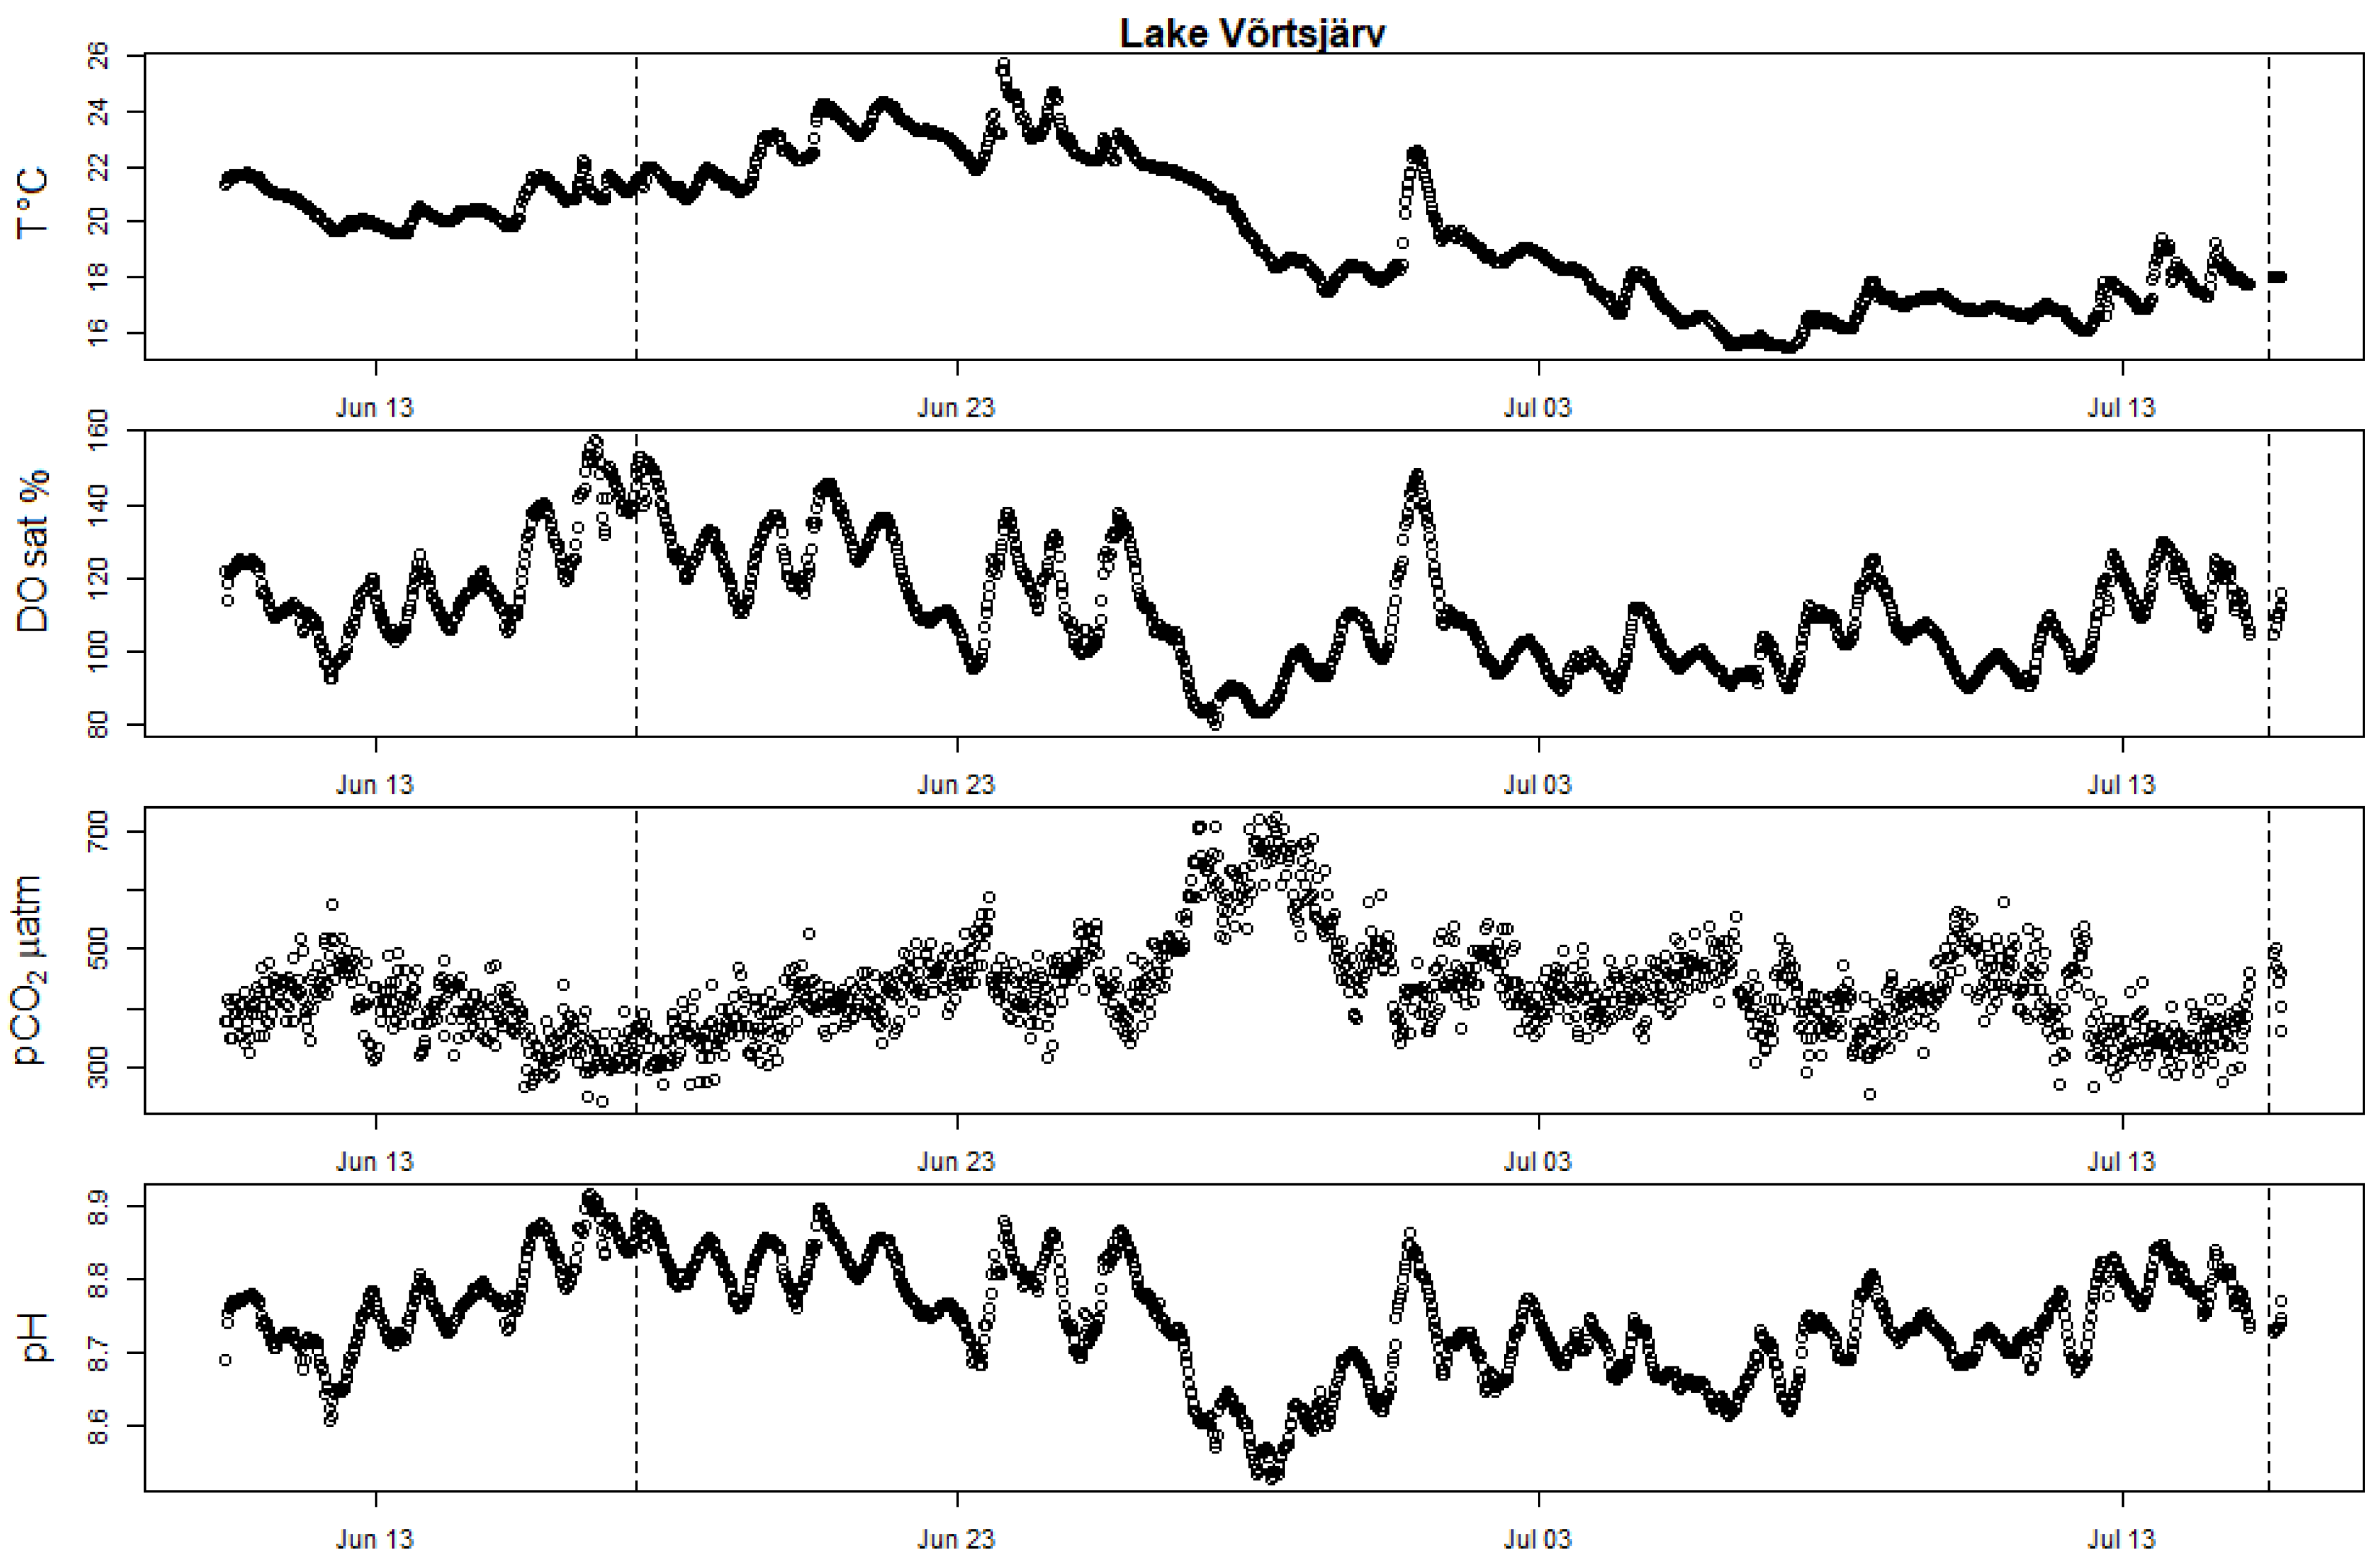
All studied Estonian lakes were equipped with a high-frequency monitoring platform or small lake buoy (OMC-7012 data-buoy) for the whole experimental period. Continuous monitoring of DO and T was performed with Ponsel OPTOD sensors, and CO2 concentrations were monitored with AMT Analysenmesstechnik GmbH sensors. In all lakes, sensors were placed between 0.3 and 0.5 m depth, close to the surface. In Lake Võrtsjärv, additional pH data were collected with a multiparametric sonde (Yellow Springs Instruments 6600 V2–4) at one meter depth. In Erastvere, the installed lake buoy stopped recording the measurements from the end of June until the beginning of July, due to technical issues. The time series for the measured parameters in the Estonian lakes are presented in the Appendix A (Figure A2, Figure A3 and Figure A4). Measured water temperature and air pressure data were used to calculate the real CO2 partial pressure (pCO2) and dissolved CO2 concentration from the signals captured by the sensors, according to the manufacturer manuals [31].
2.4. Measurements of Hydrochemical Parameters
All lakes were sampled for chlorophyll-a (µg L−1), total phosphorus (TP, mg L−1), total nitrogen (TN, mg L−1) and dissolved organic carbon (DOC, mg L−1) concentrations (Table A1). For chlorophyll-a analysis, water samples were concentrated on Whatman GF/F glass microfiber filters, extracted with 90% acetone and measured spectrophotometrically. Chlorophyll-a concentrations were calculated using equations of Jeffrey and Humphrey [36]. TP concentrations were determined using the molybdenum blue spectrophotometric method [37] after oxidation to phosphates (PO43−) with potassium persulfate (K2S2O8). TN concentrations were determined with the ultraviolet spectrophotometric screening method [38] after oxidation to nitrates (NO3−) with K2S2O8. For DOC analysis, water samples were filtered through Whatman GF/F glass microfiber filters. DOC concentrations were determined using a Shimadzu TOC-VCPH analyzer, and this method conforms to the European standard [39].
2.5. Data Analysis
The dissolved inorganic carbon (DIC, mM) and carbonate ([CO32−], mM) concentrations were determined using T, pH, EC and TA to solve the carbonate equilibrium as implemented in the CO2sys application [40], using the constants for freshwater in Millero (1979) [41].
The calcite saturation index (SI) was calculated as the logarithm of the saturation state of calcite (Ω) at the in situ temperature and conductivity:
where Kcal is the apparent solubility product for calcite at the observed salinity and temperature [42].
SI = log (Ω)
Ω = ([Ca2+][CO32−])/Kcal,
The rates of change of DIC, DO and TA in the incubation bottles (dDIC/dt, dDO/dt, dTA/dt, respectively) were calculated by dividing the change between final and initial conditions by the time period of incubation in each bottle. Changes in TA (dTA/dt) were used as a proxy for calcification, following the chemical equation of calcite precipitation whereby 2 equivalents of alkalinity are lost per mole of calcite that precipitates. Therefore, negative changes in alkalinity were divided by −2 to obtain the corresponding calcification rates. The precision of Ca2+ analyses (~0.3 ppm) was not high enough to use Ca2+ concentrations directly as an indicator of calcification, which is why we used the changes in TA as a proxy instead.
The 5 incubation bottles were treated as replicates. Therefore, the values for each variable were expressed as the mean and standard deviation (s.d.) of the 5 replicates. For each campaign, extreme outliers within the 5 replicates were removed from the dataset (5 outliers for alkalinity and 4 outliers for DO). NEP in the bottles was measured from dDO/dt.
3. Results
All lakes had a positive calcite SI, so calcite precipitation was theoretically possible, except for Valguta Mustjärv, a brown-water bog lake with low alkalinity and pH (Figure 1a). As for the other lakes, calcification, detected as a decrease in alkalinity during incubations, was found in all campaigns except for Lake Erastvere on 18 June 2019 and Sau Reservoir on 16 May 2018 (Figure 1b). Hereinafter, the analyzed dataset will be restricted to the seven campaigns with detectable calcification, i.e., those which showed a positive calcite SI as well as a decrease in TA.
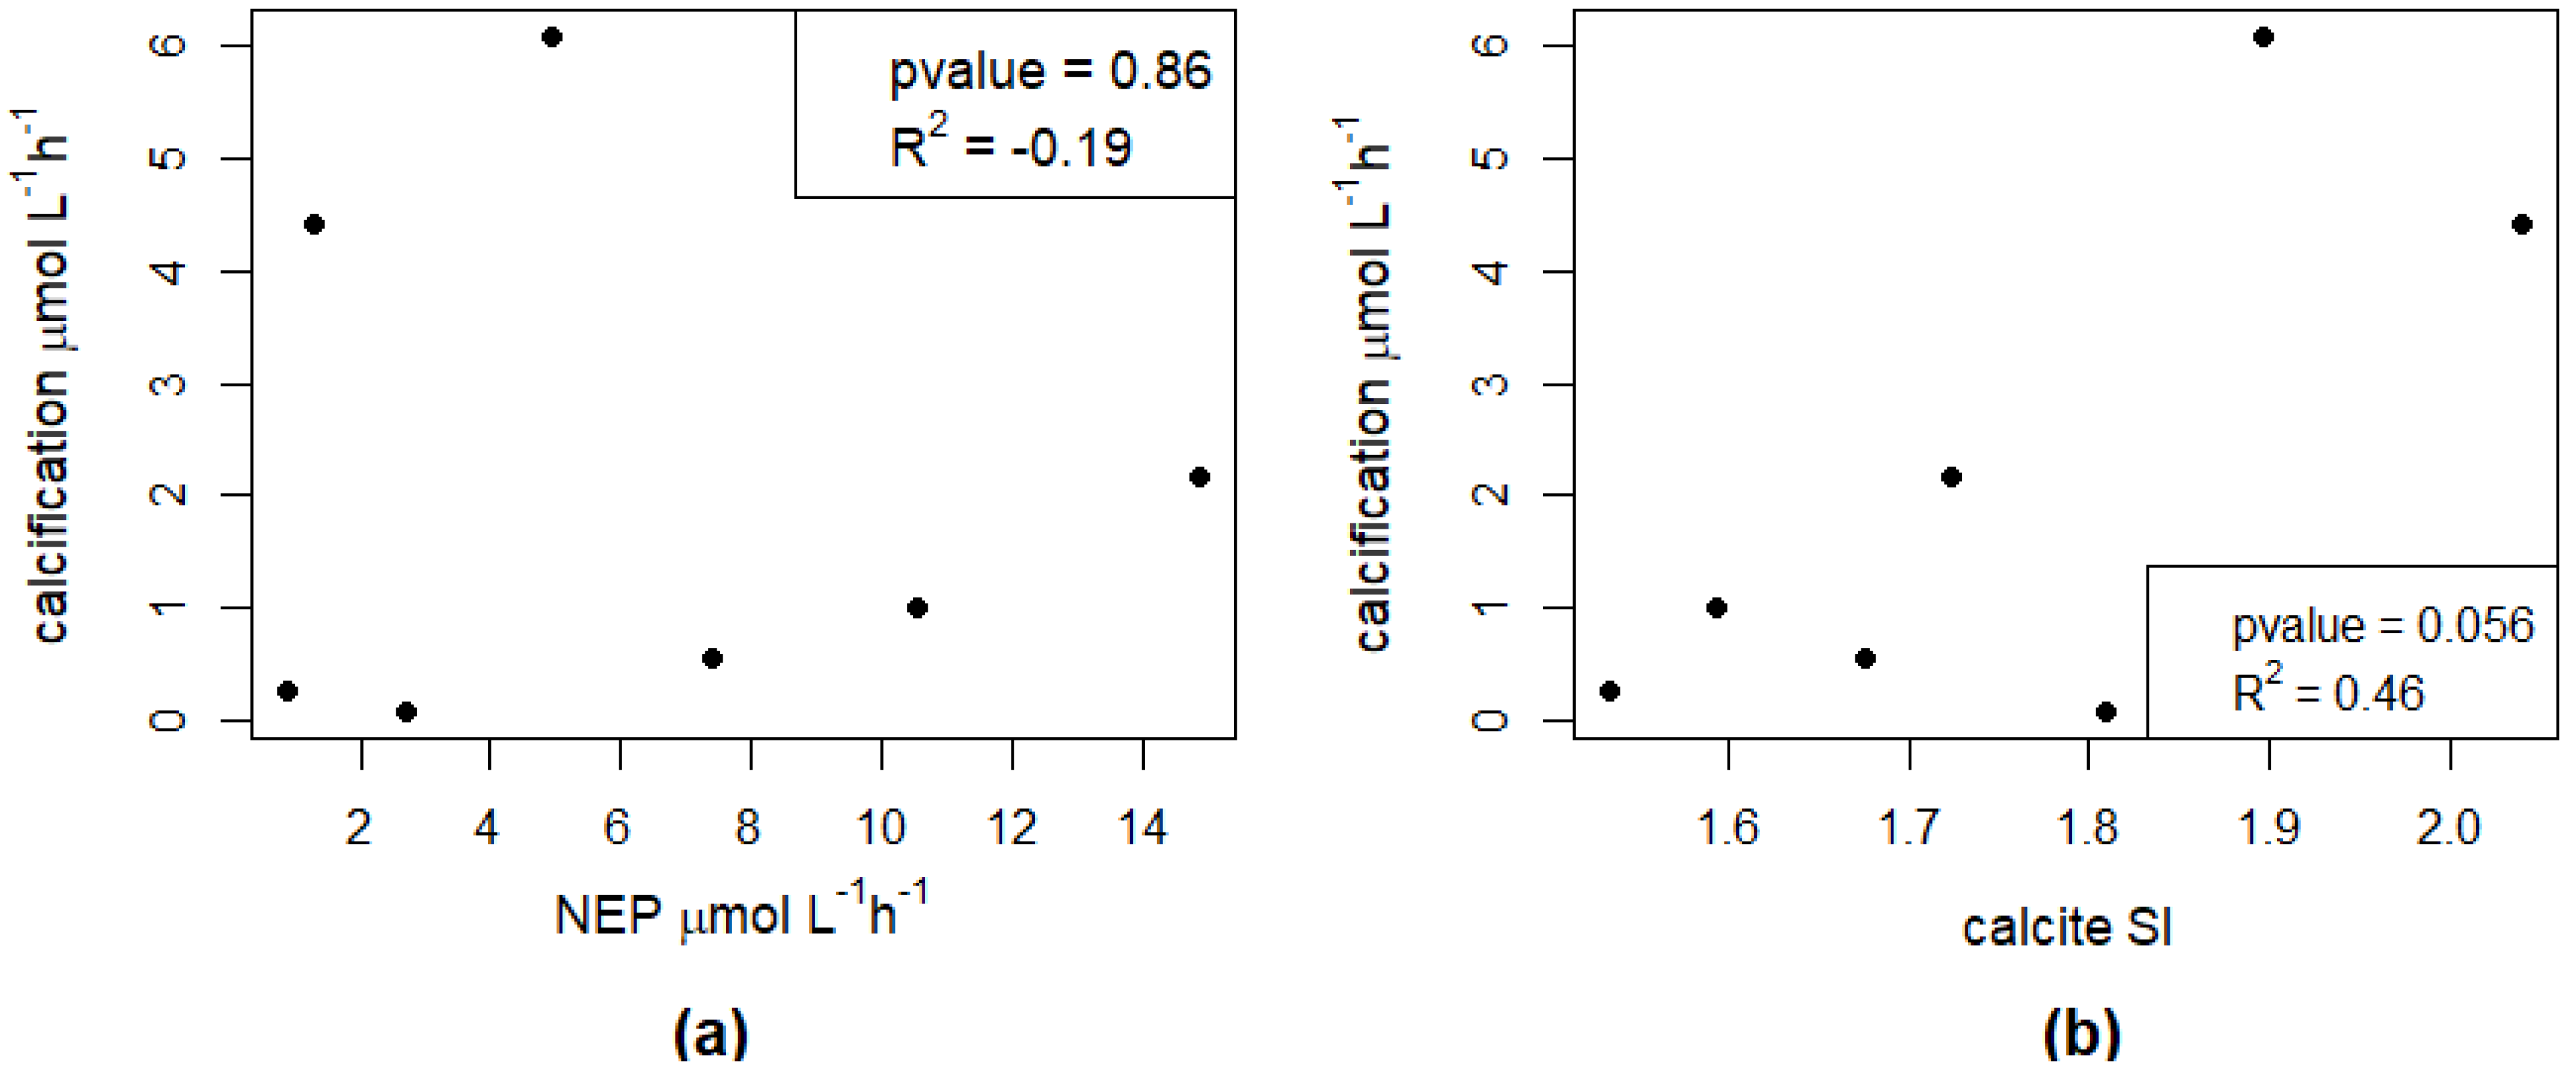
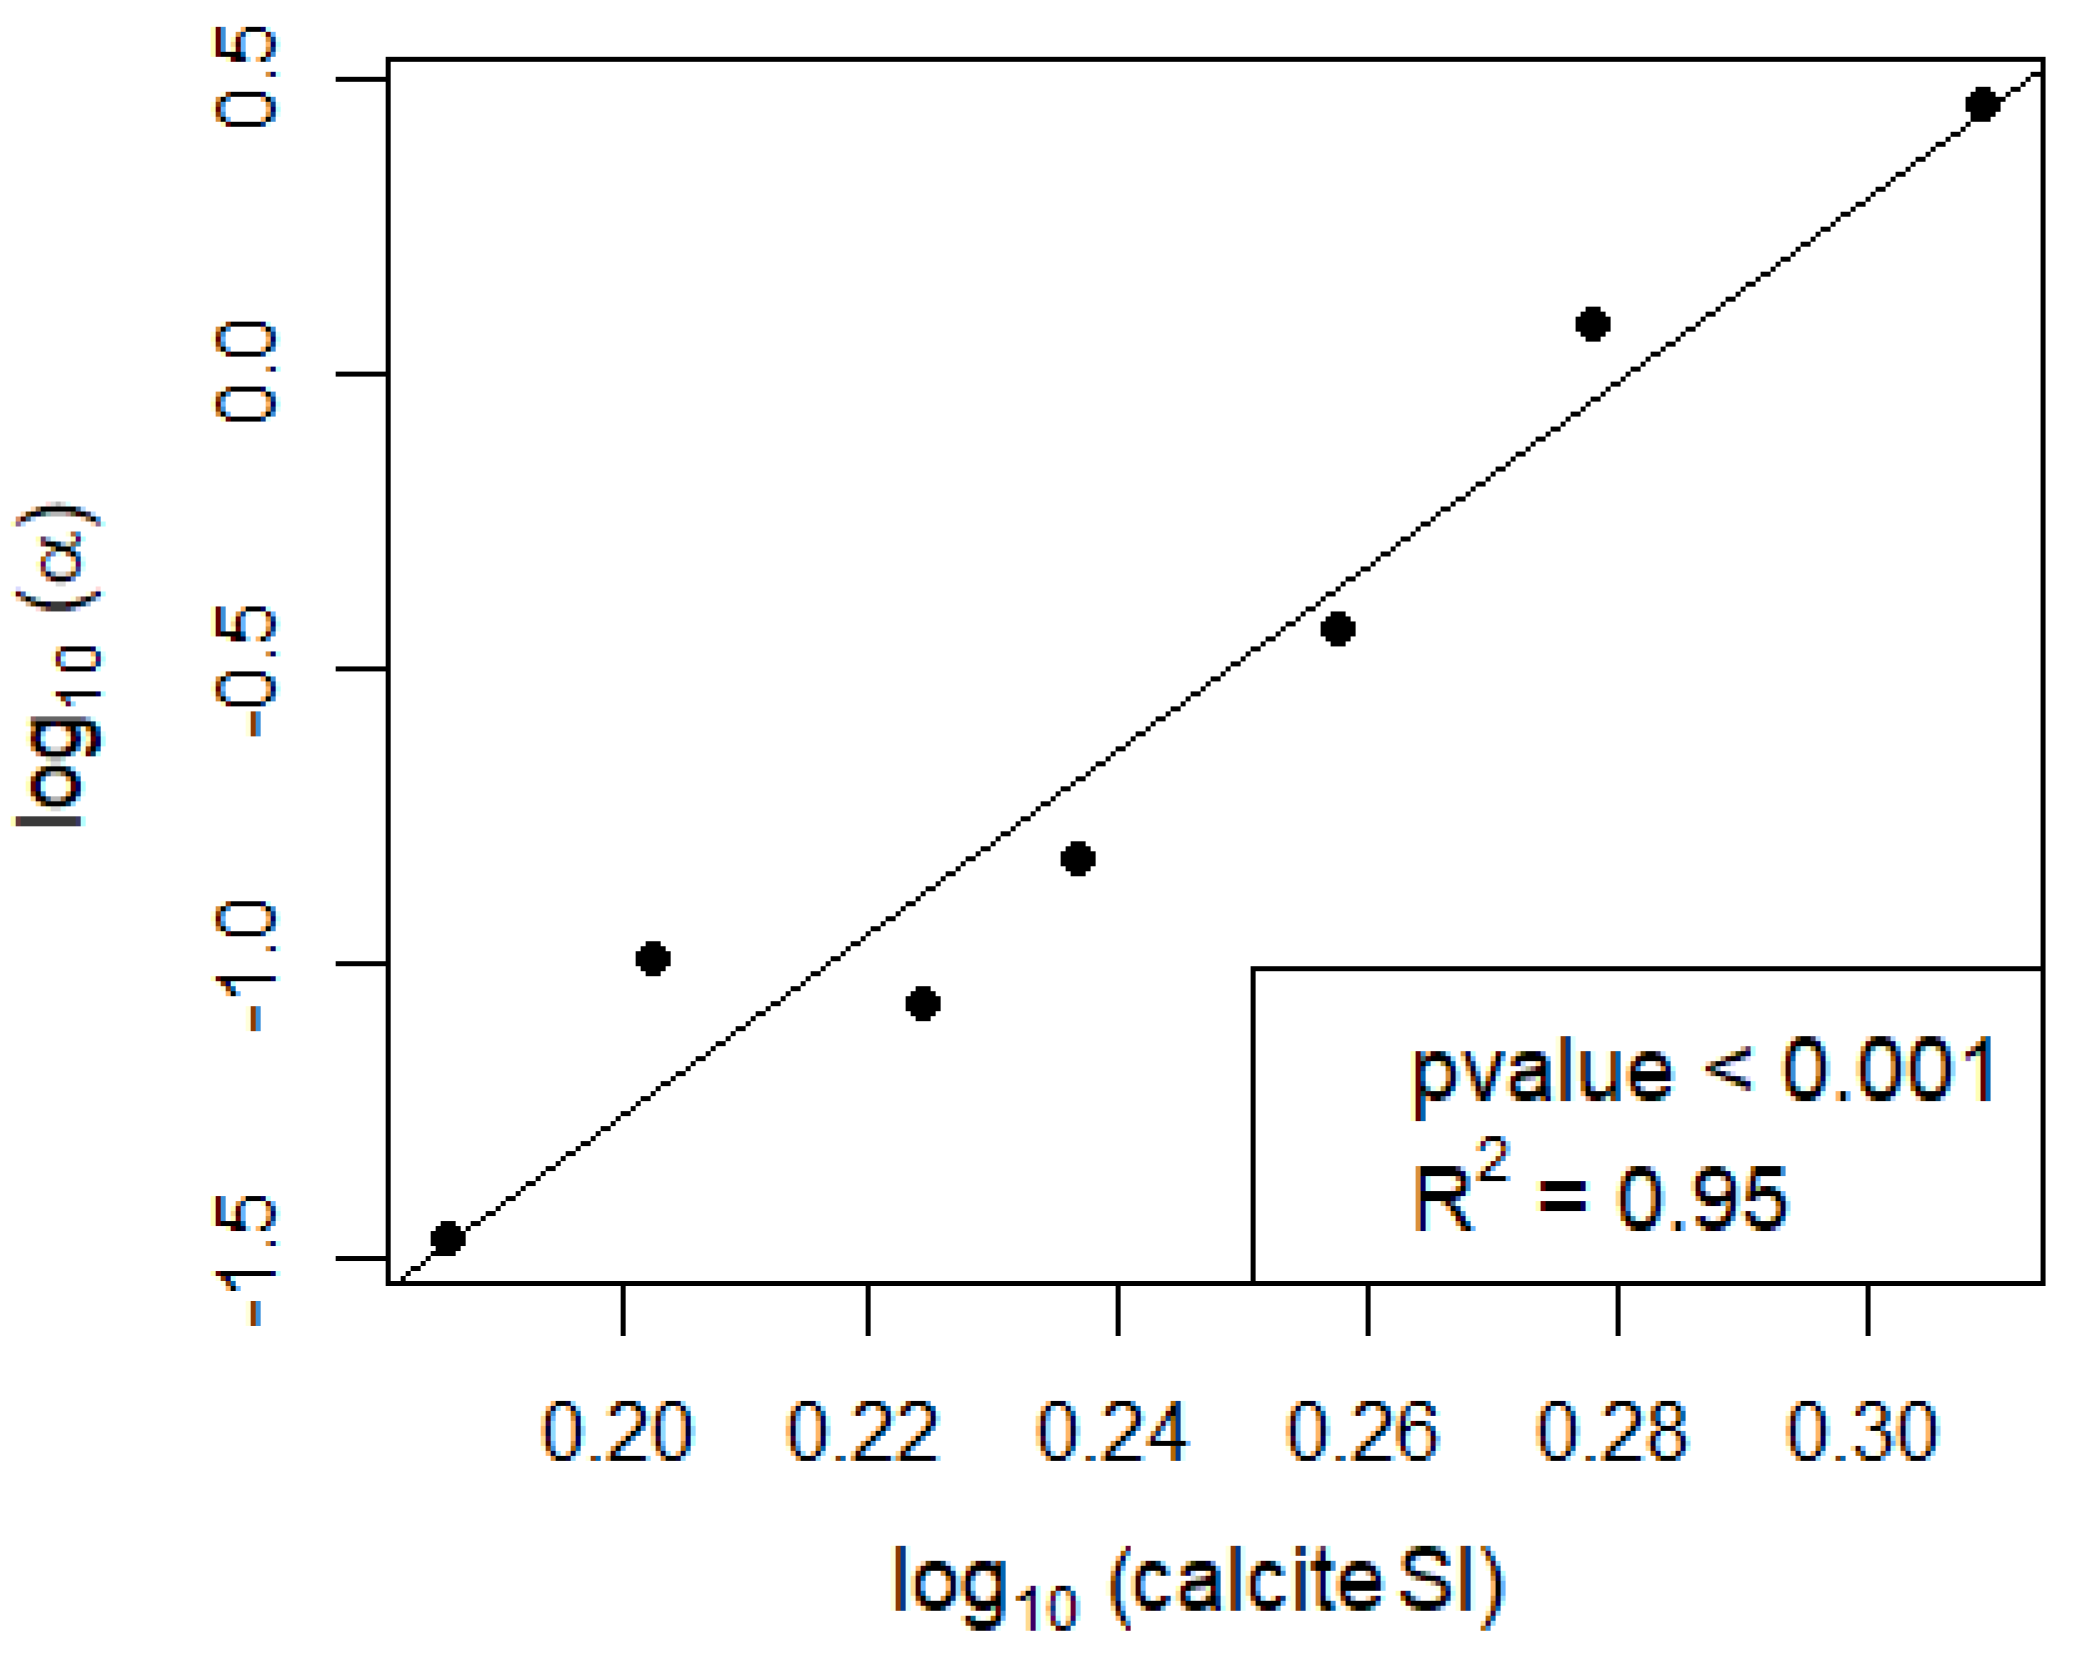
In the seven campaigns that showed calcification, no significant direct effect of NEP on calcification was found (Figure 2a and Figure A1a), nor was there a strong direct relationship between calcite saturation and calcification (Figure 2b). However, the ratio between calcification and NEP showed a strong power relationship with the calcite SI (Figure 3 and Figure A1c).
The calcification/NEP ratio (α) had a strong effect on the response of DIC to metabolic changes in oxygen, as shown by the relationship between α and the ratio between dDIC/dt and dDO/dt (dDIC/dDO, Figure 4). At α close to 0, DIC changes followed the metabolic signal with a dDIC/dDO ratio close to the expected value of −1 when metabolism dominates the DIC variability. At larger α (i.e., in conditions of higher calcification than expected by metabolism), the DIC change is greatly amplified, with a dDIC/dDO ratio up to ~−8.
Surface water samples in Sau Reservoir revealed a decrease in calcium concentrations, likely caused by calcification, during the second half of the month of June and the first half of the month of July 2018 (Figure 5). During this period, the calcite saturation was at its highest value. The HFM measurements and surface samples for DO revealed a sudden increase in DO during the second half of June and then a second wave of increase during the first half of July, coinciding with the period of calcium decrease (Figure 5). This increase in DO resulted from peaks in primary production caused by the increase in temperature during this period (Figure 5), and this was also confirmed by increasing chlorophyll-a values (Table A1). From the number of calcium samples, it is unclear whether calcium decreased continuously during this period or followed the two peaks in DO (Figure 5). After this calcification period, no significant decrease in calcium concentrations was found despite the water being highly saturated in oxygen.
4. Discussion
Alkalinity and NEP have been described as the two main parameters controlling calcification [9,13,30,43], yet they have mostly been studied independently. NEP increases pH, shifting the DIC equilibrium to saturation of carbonates, offering an ideal environment for calcite formation around nucleation points in the form of picocyanobacteria [13]. Alkalinity implies availability of DIC and Ca2+, enabling higher rates of calcification, with a threshold of 1 meq L−1, below which calcification is unlikely to occur [7,9,44].
Our results suggest that the effect of NEP on calcification is to be understood within the larger context of a lake’s physicochemical properties, especially in relation to its equilibrium with calcite. At short-term scales, NEP alone is not sufficient to explain the observed calcification (Figure 2a). However, it is the ratio between calcification and NEP (α) which is predictable from the calcite SI (Figure 3). Similarly, the relationship between calcite saturation alone and calcification is not significant (Figure 2b) and is much weaker than when considering its effect on α (Figure 3). Therefore, the short-term effect of NEP on calcification can be comprehended within the context of calcite saturation which depends on processes that act at a longer time scale. In the incubation bottles, we observe the changes in NEP at an hourly scale, and the short-term effect of primary production within the bottles is therefore evident. However, the calcite saturation in these bottles corresponds to a legacy of biogeochemical processes that occur in the lakes at a larger temporal scale than the time frame of the incubations. Changes in calcite saturation in lakes are reported to be gradual and follow a seasonal pattern with higher saturation from spring to fall with the peak during summer, coinciding with the rise in temperature and primary production [12].
The higher calcite saturation during summer, together with the summer peak in NEP, is likely the main cause for the seasonal variation in calcification. In Sau Reservoir, calcification seems to have occurred during the peak of primary production and during the higher calcite saturation found in June–July that came along with rising temperatures (Figure 5). During this period, the calcium concentration decreased, likely as a result of calcification (Figure 5). The potentiating role of calcite saturation in the effect of NEP on calcification can result in intense calcification events extending usually from a few days to a few weeks, which are sometimes visible in the form of whitening events which have a big impact on the carbon budget of a lake [16]. Our results suggest that such events are triggered by peaks of production and that the intensity of such events is likely caused by a gradual departure from the calcite equilibrium until it reaches a state that strongly potentiates the calcification-inducing factor of NEP. Within the context of global change, these results suggest that calcification is likely to be further promoted by anthropogenic stressors that affect the trophic state of a lake. The increase in dissolved phosphorus and nitrogen in water bodies, caused by human activities such as agriculture or urban activities including industry or sewage water treatment plants [17], is causing an increase in eutrophication and in the proliferation of cyanobacterial blooms [19]. Such conditions can trigger intense calcification, especially in systems that are highly saturated in calcite. In turn, such events can improve the trophic state of eutrophic lakes due to co-precipitation with phosphates, acting as a self-remediation mechanism [45]. Furthermore, eutrophication can cause dramatic changes in the phytoplankton community due to shifts in the trophic state [46]. Hence, the resulting change in planktonic size spectra may affect the availability of nucleation sites that trigger calcification [13,14,15]. This is an added complexity which is beyond the scope of this study. Disentangling the effect of nucleation, metabolism and calcite saturation should be addressed in further research. Besides increasing eutrophication, global change may promote calcification through its effect on water alkalinity. An increase in the export of alkalinity due to global change has been observed in large Russian Arctic rivers, as well as in North America’s largest river, the Mississippi [47,48]. A rise in water alkalinity would increase the calcite SI, which is directly dependent on alkalinity, among other variables. This would potentiate the calcification-inducing effect of NEP, allowing for higher rates of calcite precipitation. In this view, global change could possibly enhance calcite precipitation events, both in frequency and intensity, due to the increase in eutrophication and water alkalinity. However, more research is needed to confirm this hypothesis.
Most campaigns showed potential calcification, except both campaigns at Valguta Mustjärv, Lake Erastvere on 18 June 2019 and Sau Reservoir on 16 May 2018 (Figure 1). Valguta Mustjärv is a humic (DOC 41 mg L−1), brown-water bog lake with low alkalinity (Appendix A Table A1) and low pH (6.8) and was therefore undersaturated in calcite. The main reason for including this lake in this study was to observe the absence of calcification expected from such low-alkalinity lakes. The HFM time series of DO saturation for this lake shows a peak of production shortly before the first incubation campaign (Appendix A Figure A2). However, despite this peak of production, calcification did not occur because of the undersaturation in calcite. Lake Erastvere on 18 June 2019 had the lowest calcite SI among the campaigns with positive calcite saturation (Figure 1a), combined with relatively low values in chlorophyll-a and NEP (Appendix A Table A1 and Figure A1a), which is likely the reason for the absence of calcification. Looking at the HFM time series of DO and T, it appears that the timing of the two campaigns did not coincide with the peaks of production in this lake (Appendix A Figure A3), which could be another explanation for the lack of calcification during this campaign. As for the medium-alkalinity Sau Reservoir on 16 May 2018, the relatively low calcite SI (Figure 1a and Figure 5) and NEP (Appendix A Figure A1a) could be potential reasons for the absence of measurable calcification. The HFM time series of DO indicate that this reservoir was the least productive during this campaign because the timing (Spring) was too early to capture the strong summer rise in production that started in the month of June (Figure 5). In this reservoir, two campaigns show the lowest rates of calcification (11 June 2018 and 22 August 2018, Figure 1b). In the first case (11 June 2018), the campaign occurred during the initial stage of the summer rise in production and therefore DO saturation was still relatively low compared to the following period (Figure 5). The second case (22 August 2018) corresponds to a period where calcite SI strongly decreased, likely because of the calcification that occurred previously (Figure 5). As for the two campaigns (12 July 2018 and 25 July 2018) that were held between these two cases during the month of July, the clear occurrence of calcification is justified by the high values in DO and in calcite SI during this period. This further supports the explanation that calcification depends simultaneously on two parameters, namely, NEP and calcite saturation. The two highest rates of calcification were both observed in Võrtsjärv, which had the highest calcite SI among all the campaigns (Figure 1). The lake was saturated in DO during both campaigns, suggesting high production (Appendix A Figure A4). Here, again, the high rates of calcification are explained by the high values of NEP and calcite SI observed in this lake.
The α ratio has been described as a function of alkalinity [27,30]. Our results suggest that it is rather a function of the calcite SI. While calcite saturation is dependent on alkalinity, it is also dependent on other variables such as T, EC and pH and is therefore a better predictor for calcification than alkalinity alone. In marine studies, α has been reported at a value of 1.67 in coral reefs [49,50]. Calcite saturation in the pelagic ocean is much more constant than in lakes, with an average value of 1.5 for the Central Pacific Ocean water column [51]. In contrast, lakes exhibit large variations in calcite SI and can have much higher values. In Lake Constance, variations in calcite SI between 1 and 9 have been reported [52]. Our results suggest that at the higher calcite SI commonly found in lakes, α can reach much more extreme values than the ones reported in marine studies, and therefore pelagic calcification rates in lakes can largely exceed those found in the ocean. The α ratio in lakes has only rarely been reported and appears to range between 0 and 1 [27]. However, its power relationship with calcite saturation results in ratios of up to nearly 3:1 for Lake Võrtsjärv on 15 July 2019 (Figure 4). Therefore, the effect of NEP on calcification is strongly potentiated at higher calcite saturation.
This potentially strong effect of NEP on calcification has important implications for DIC dynamics of lakes and the way we relate calcification to metabolic processes. Besides acting as a C sink in the sediments [23], calcification releases CO2, thereby promoting CO2 supersaturation and CO2 emissions to the atmosphere [53,54]. Due to its association with NEP, calcification is reported to be a cause of the deviations from the 1:1 metabolic stoichiometry between DO and DIC that is often reported in lakes [30,55,56,57]. It is not uncommon to find lakes that are simultaneously emitting CO2 while being in an autotrophic state [8,20,30]. Our results suggest that these deviations are correlated to α (Figure 4), and we show that this is not only relevant in hardwater lakes as commonly assumed, but also in lakes of alkalinity above 1 meq L−1, as suggested by Marcé et al. (2015) [7]. When α is close to 0, DIC dynamics follows the classical 1:1 metabolic stoichiometry with DO. At higher α, the overall stoichiometry changes, with larger differences in DIC per mole of oxygen produced. This is clearly visible in Lake Võrtsjärv on 15 July 2019, where the DIC/DO ratio reaches nearly −8 (Figure 3). Such deviations caused by calcification are not accounted for in lake models, potentially causing discrepancies between theoretical models and empirical data and biasing our understanding of lake ecosystems through modeling [24,58]. Understanding and quantifying the interplay between calcification, NEP and calcite saturation may provide a more realistic parameterization of lake carbon budget models under different eutrophication scenarios.
5. Conclusions
Calcification is driven simultaneously by the long-term effects of calcite saturation and the short-term effects of NEP, whereby calcite saturation strongly potentiates the NEP-induced calcification effect. This would explain the seasonal and episodic nature of pelagic calcification in lakes, whereby calcification occurs when the level of calcite saturation is high enough to trigger this process usually during the summer season, allowing high rates of calcite precipitation to be induced by NEP. Considering human stressors that increase lake eutrophication, calcification is likely to be intensified with the increase in summer production rates. Our results also suggest that the strong effect found between calcite saturation and α provides a mechanistic relationship that could be used to parameterize this process in lake models. This way, the calcite SI is an indicator of the NEP-induced calcification effect and the resulting deviations from the metabolic 1:1 stoichiometry between DO and DIC.
Author Contributions
Conceptualization, B.O. and R.M.; methodology, B.O., R.M., A.L., H.K. and M.S.; validation, B.O. and A.L.; formal analysis, H.K., B.O., A.L. and M.S.; resources, B.O., and A.L.; writing—original draft preparation, H.K.; writing—review and editing, H.K., B.O., A.L., R.M. and M.S.; supervision, B.O. and A.L.; funding acquisition, B.O. All authors have read and agreed to the published version of the manuscript.
Funding
This study was funded by MANTEL ITN (Management of climatic extreme events in lakes and reservoirs for the protection of ecosystem services) through the European Union’s Horizon 2020 research and innovation program under the Marie Skłodowska-Curie grant agreement No 722518, by the Estonian Research Council grants (PSG32 and PUTJD954) and by the project C-HYDROCHANGE (CGL2017-86788-C3-3-P and CGL2017-86788-C3-2-P) funded by the Spanish Ministry of Science, Innovation and Universities.
Institutional Review Board Statement
Not applicable.
Informed Consent Statement
Not applicable.
Data Availability Statement
Data available on request.
Conflicts of Interest
The authors declare no conflict of interest.
Appendix A

Table A1.
Ancillary data of the studied lakes.
| Lake | Date | Alkalinity (meq/L) | Chlorophyll-a (µg/L) | TP (µg/L) | TN (mg/L) | DOC (mg/L) | DIC (µmol/L) | Ca2+ (µmol/L) |
|---|---|---|---|---|---|---|---|---|
| Valguta Mustjärv (EE) | 11 June 2019 | 0.52 | 14.0 | 641 | 2.0 | 42.1 | 696.6 | 234.7 |
| Valguta Mustjärv (EE) | 17 July 2019 | 0.67 | NA | 572 | 1.7 | 39.3 | 868.1 | 245.8 |
| Erastvere (EE) | 18 June 2019 | 1.48 | 10.5 | 43 | 0.9 | 12.6 | 1469.9 | 487.6 |
| Erastvere (EE) | 23 July 2019 | 1.79 | NA | 56 | 1.6 | 11.8 | 1568.4 | 491.3 |
| Võrtsjärv (EE) | 17 June 2019 | 3.23 | 26.1 | 23 | 1.1 | 12.0 | 3054.6 | 1066.3 |
| Võrtsjärv (EE) | 15 July 2019 | 4.08 | 22.3 | 36 | 1.4 | 12.4 | 3949.2 | 1091.9 |
| Sau Reservoir (ES) | 16 May 2018 | 2.57 | NA | NA | NA | 20.5 | 2540.1 | 1312.1 |
| Sau Reservoir (ES) | 11 June 2018 | 2.45 | 20.1 | 59 | 6.2 | NA | 2393.8 | 1260.3 |
| Sau Reservoir (ES) | 12 July 2018 | 1.52 | 4.9 | 36 | 4.3 | NA | 1412.1 | 711.1 |
| Sau Reservoir (ES) | 25 July 2018 | 1.19 | 28.6 | 73 | 3.7 | NA | 1047.3 | 602.8 |
| Sau Reservoir (ES) | 22 August 2018 | 1.19 | 32.0 | 39 | 3.0 | NA | 1099.6 | 607.7 |
Figure A1.
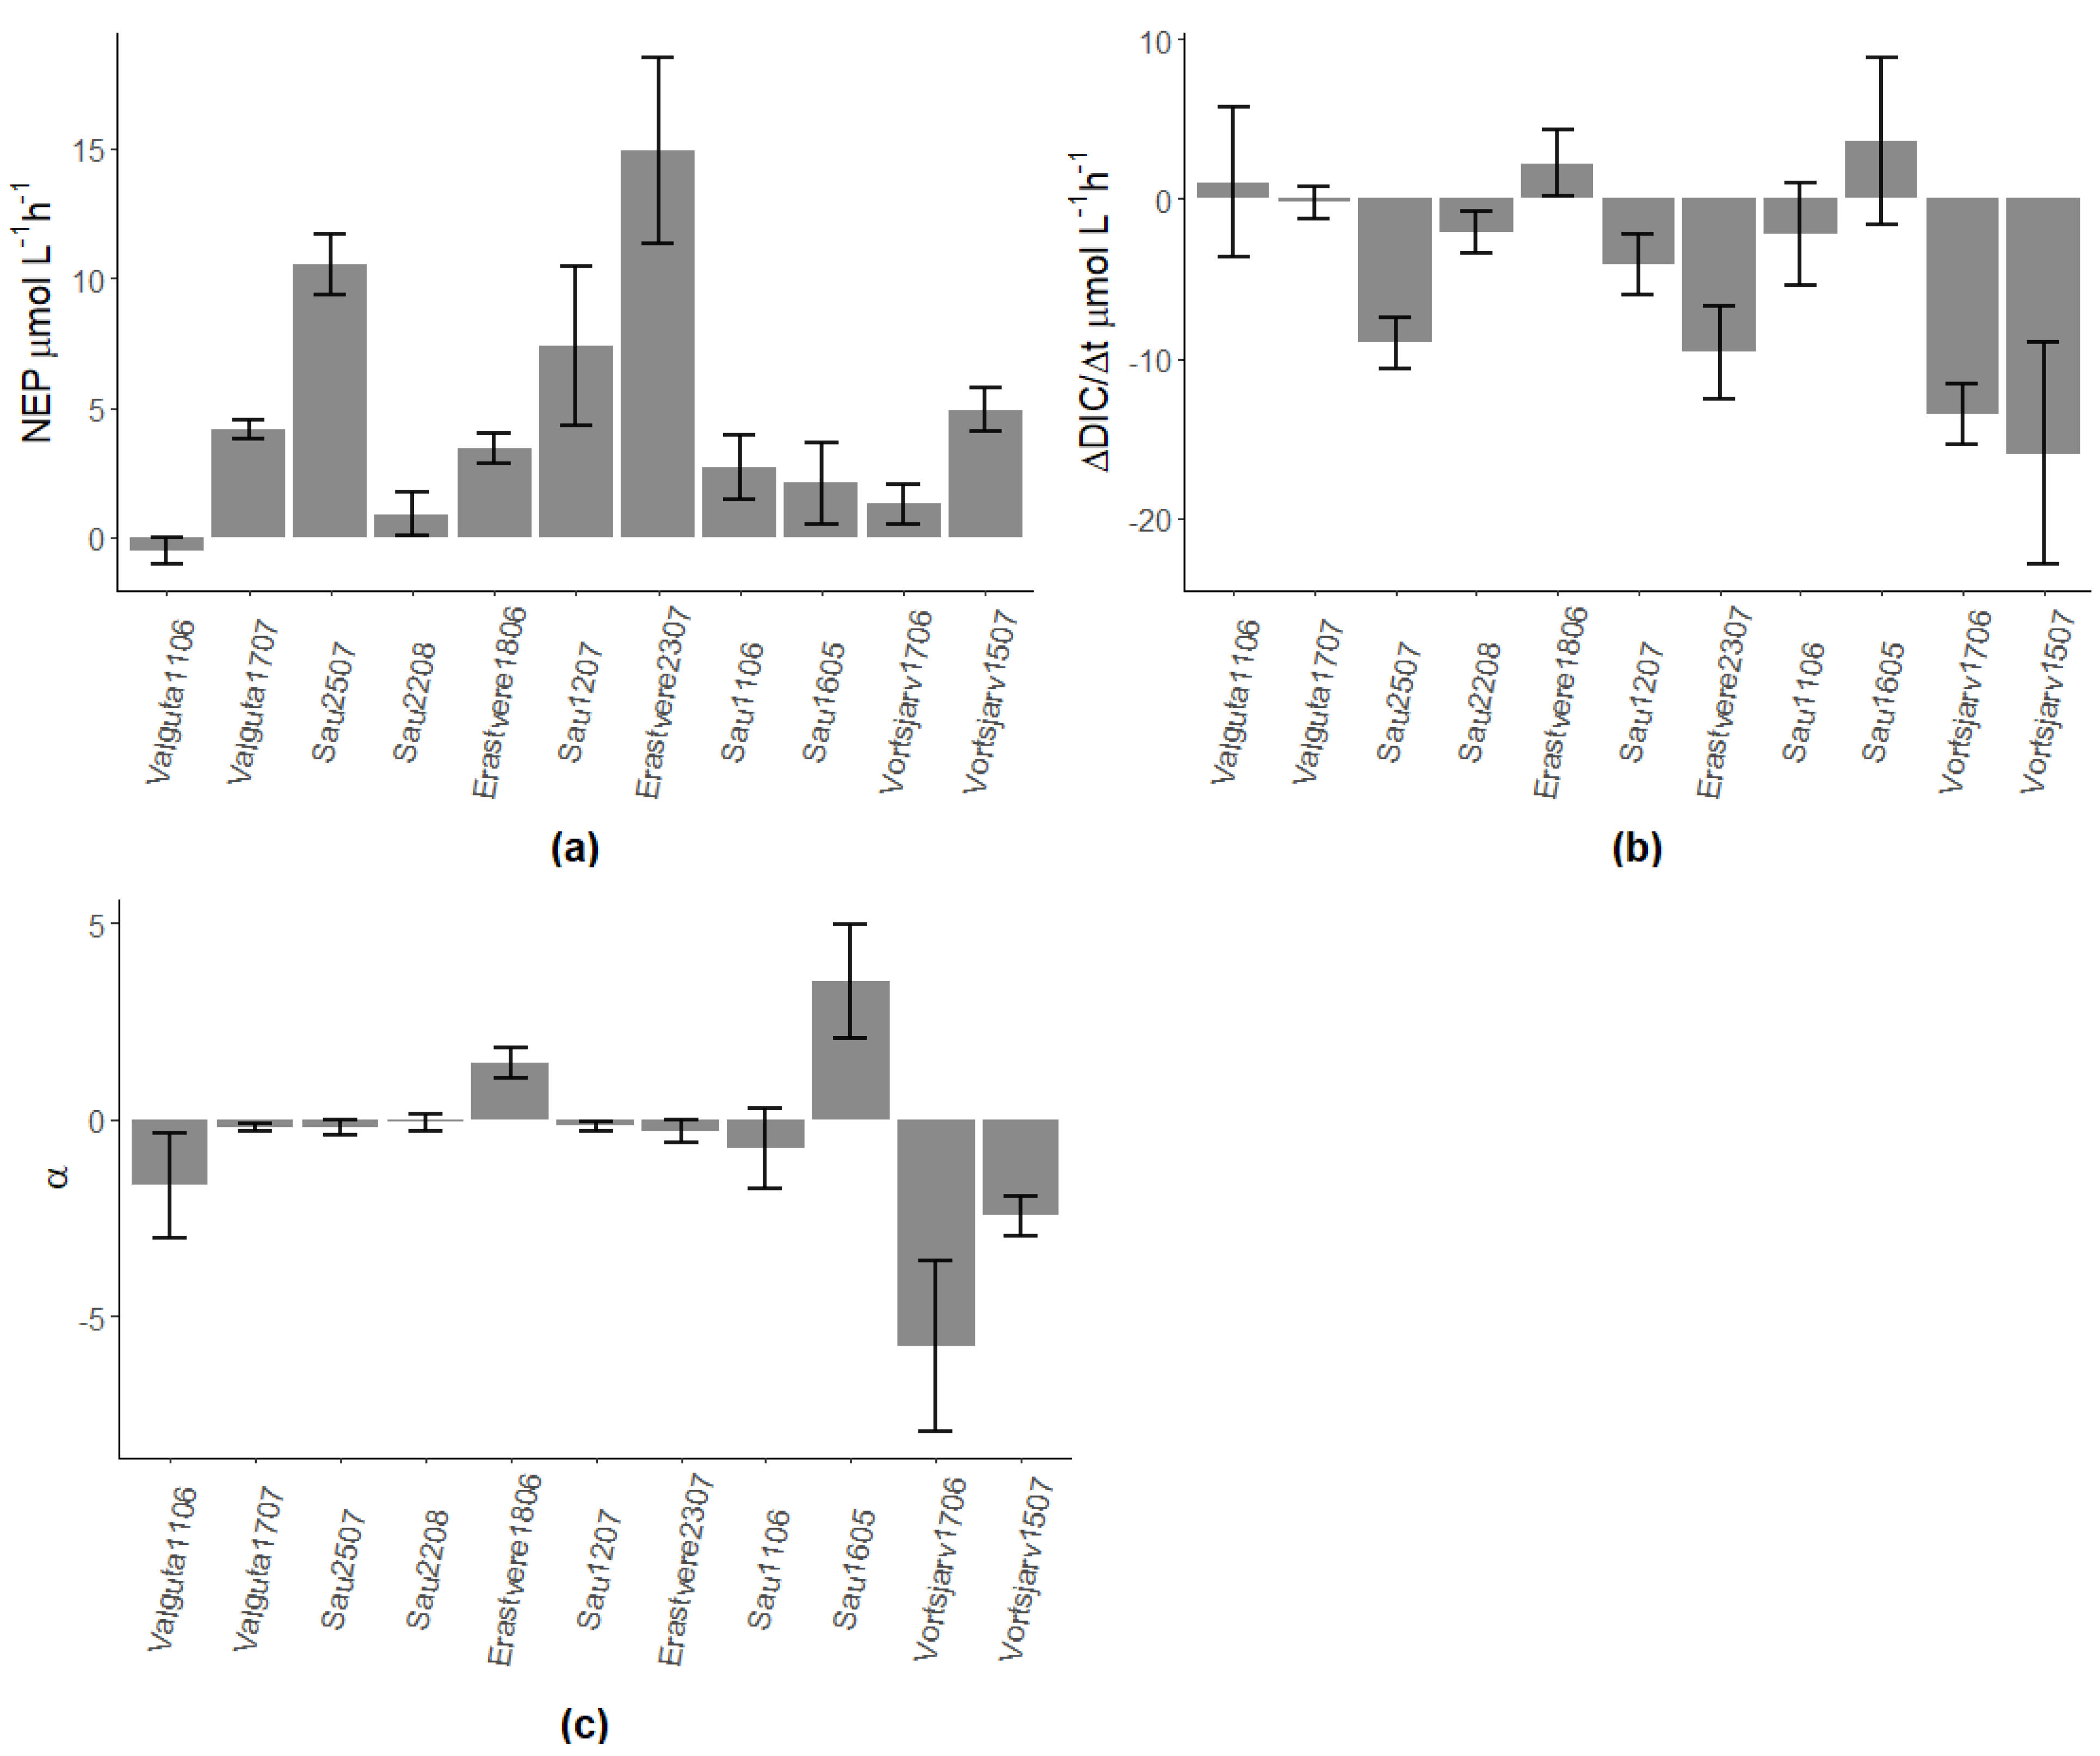
(a) NEP rates obtained from rates of change of oxygen (dDO/dt), (b) rates of change of DIC and (c) ratios between calcification and NEP (α). Numbers after the name of lakes represent the day and month of sampling; all lakes were sampled in 2019 except for Sau Reservoir in 2018.
Figure A1.
(a) NEP rates obtained from rates of change of oxygen (dDO/dt), (b) rates of change of DIC and (c) ratios between calcification and NEP (α). Numbers after the name of lakes represent the day and month of sampling; all lakes were sampled in 2019 except for Sau Reservoir in 2018.

Figure A2.
High-frequency measurements showing seasonal evolution of surface water T (in degrees Celsius), DOsat and pCO2 partial pressure in Valguta Mustjärv. The two vertical dotted bars mark the date of the two incubation campaigns held in this lake (11 June 2019 and 17 July 2019).
Figure A2.
High-frequency measurements showing seasonal evolution of surface water T (in degrees Celsius), DOsat and pCO2 partial pressure in Valguta Mustjärv. The two vertical dotted bars mark the date of the two incubation campaigns held in this lake (11 June 2019 and 17 July 2019).
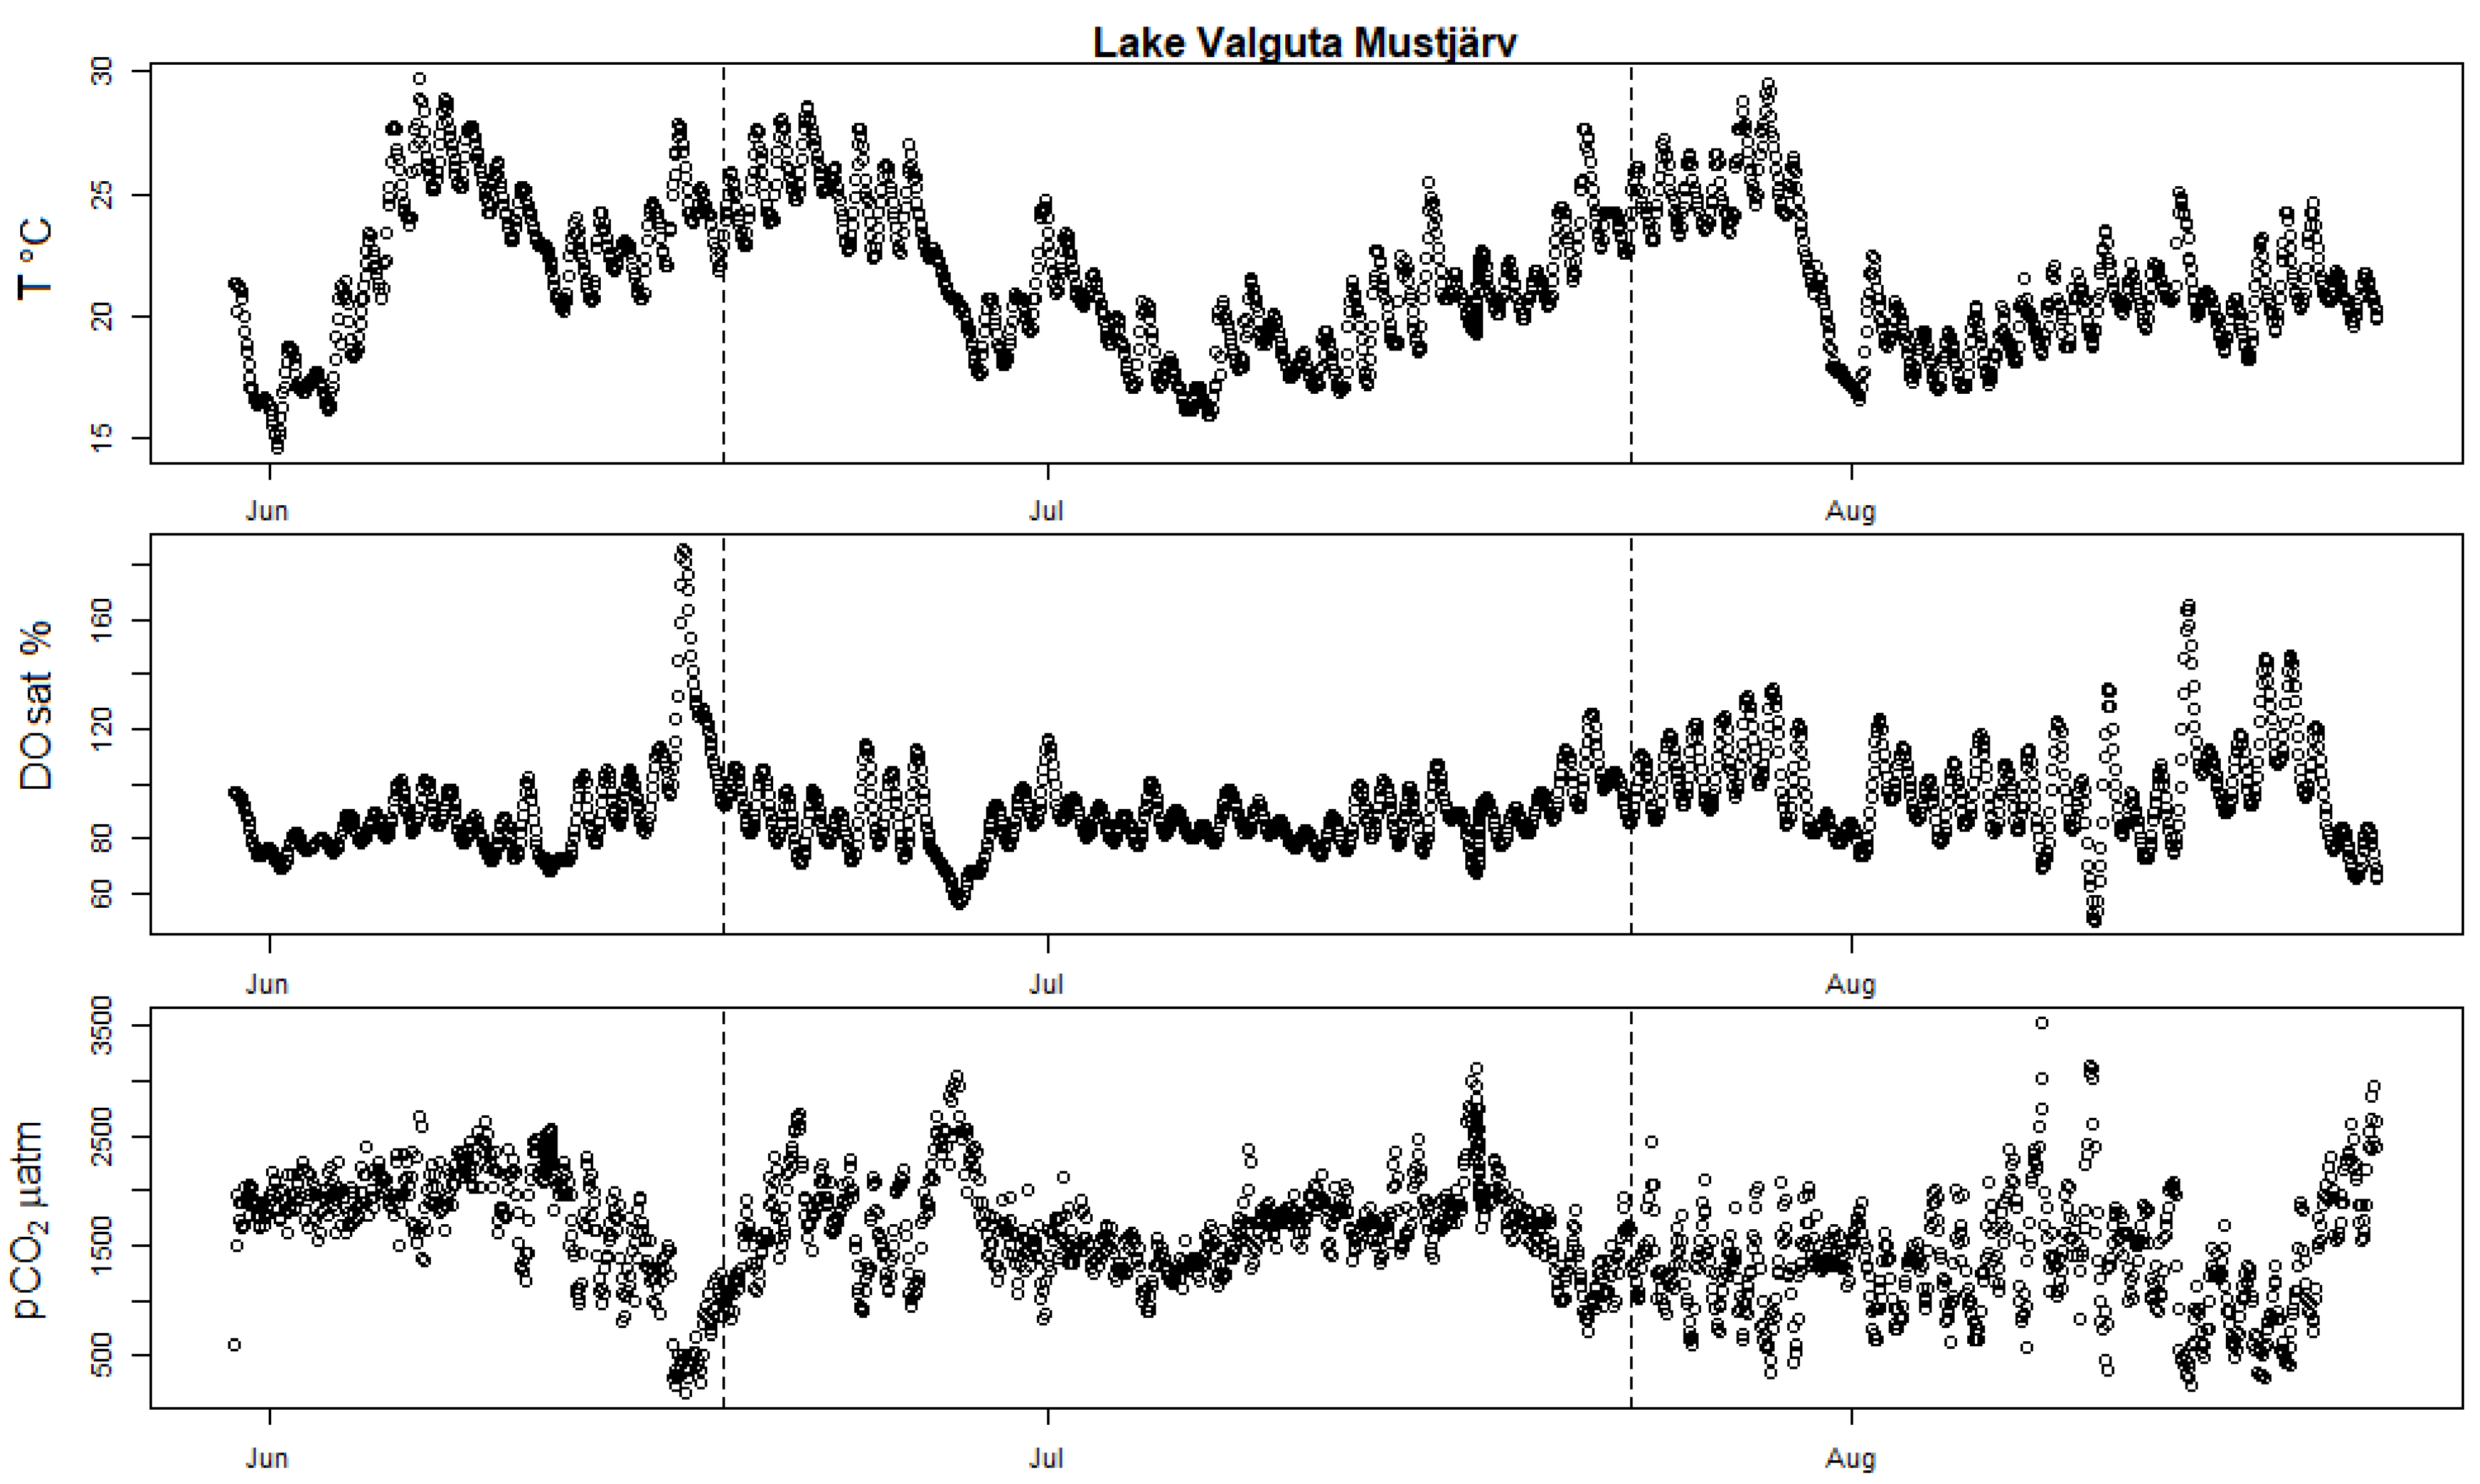
Figure A3.
High-frequency measurements showing seasonal evolution of surface water T (in degrees Celsius), DOsat and pCO2 partial pressure in Lake Erastvere. The two vertical dotted bars mark the date of the two incubation campaigns held in this lake (17 June 2019 and 15 July 2019).
Figure A3.
High-frequency measurements showing seasonal evolution of surface water T (in degrees Celsius), DOsat and pCO2 partial pressure in Lake Erastvere. The two vertical dotted bars mark the date of the two incubation campaigns held in this lake (17 June 2019 and 15 July 2019).
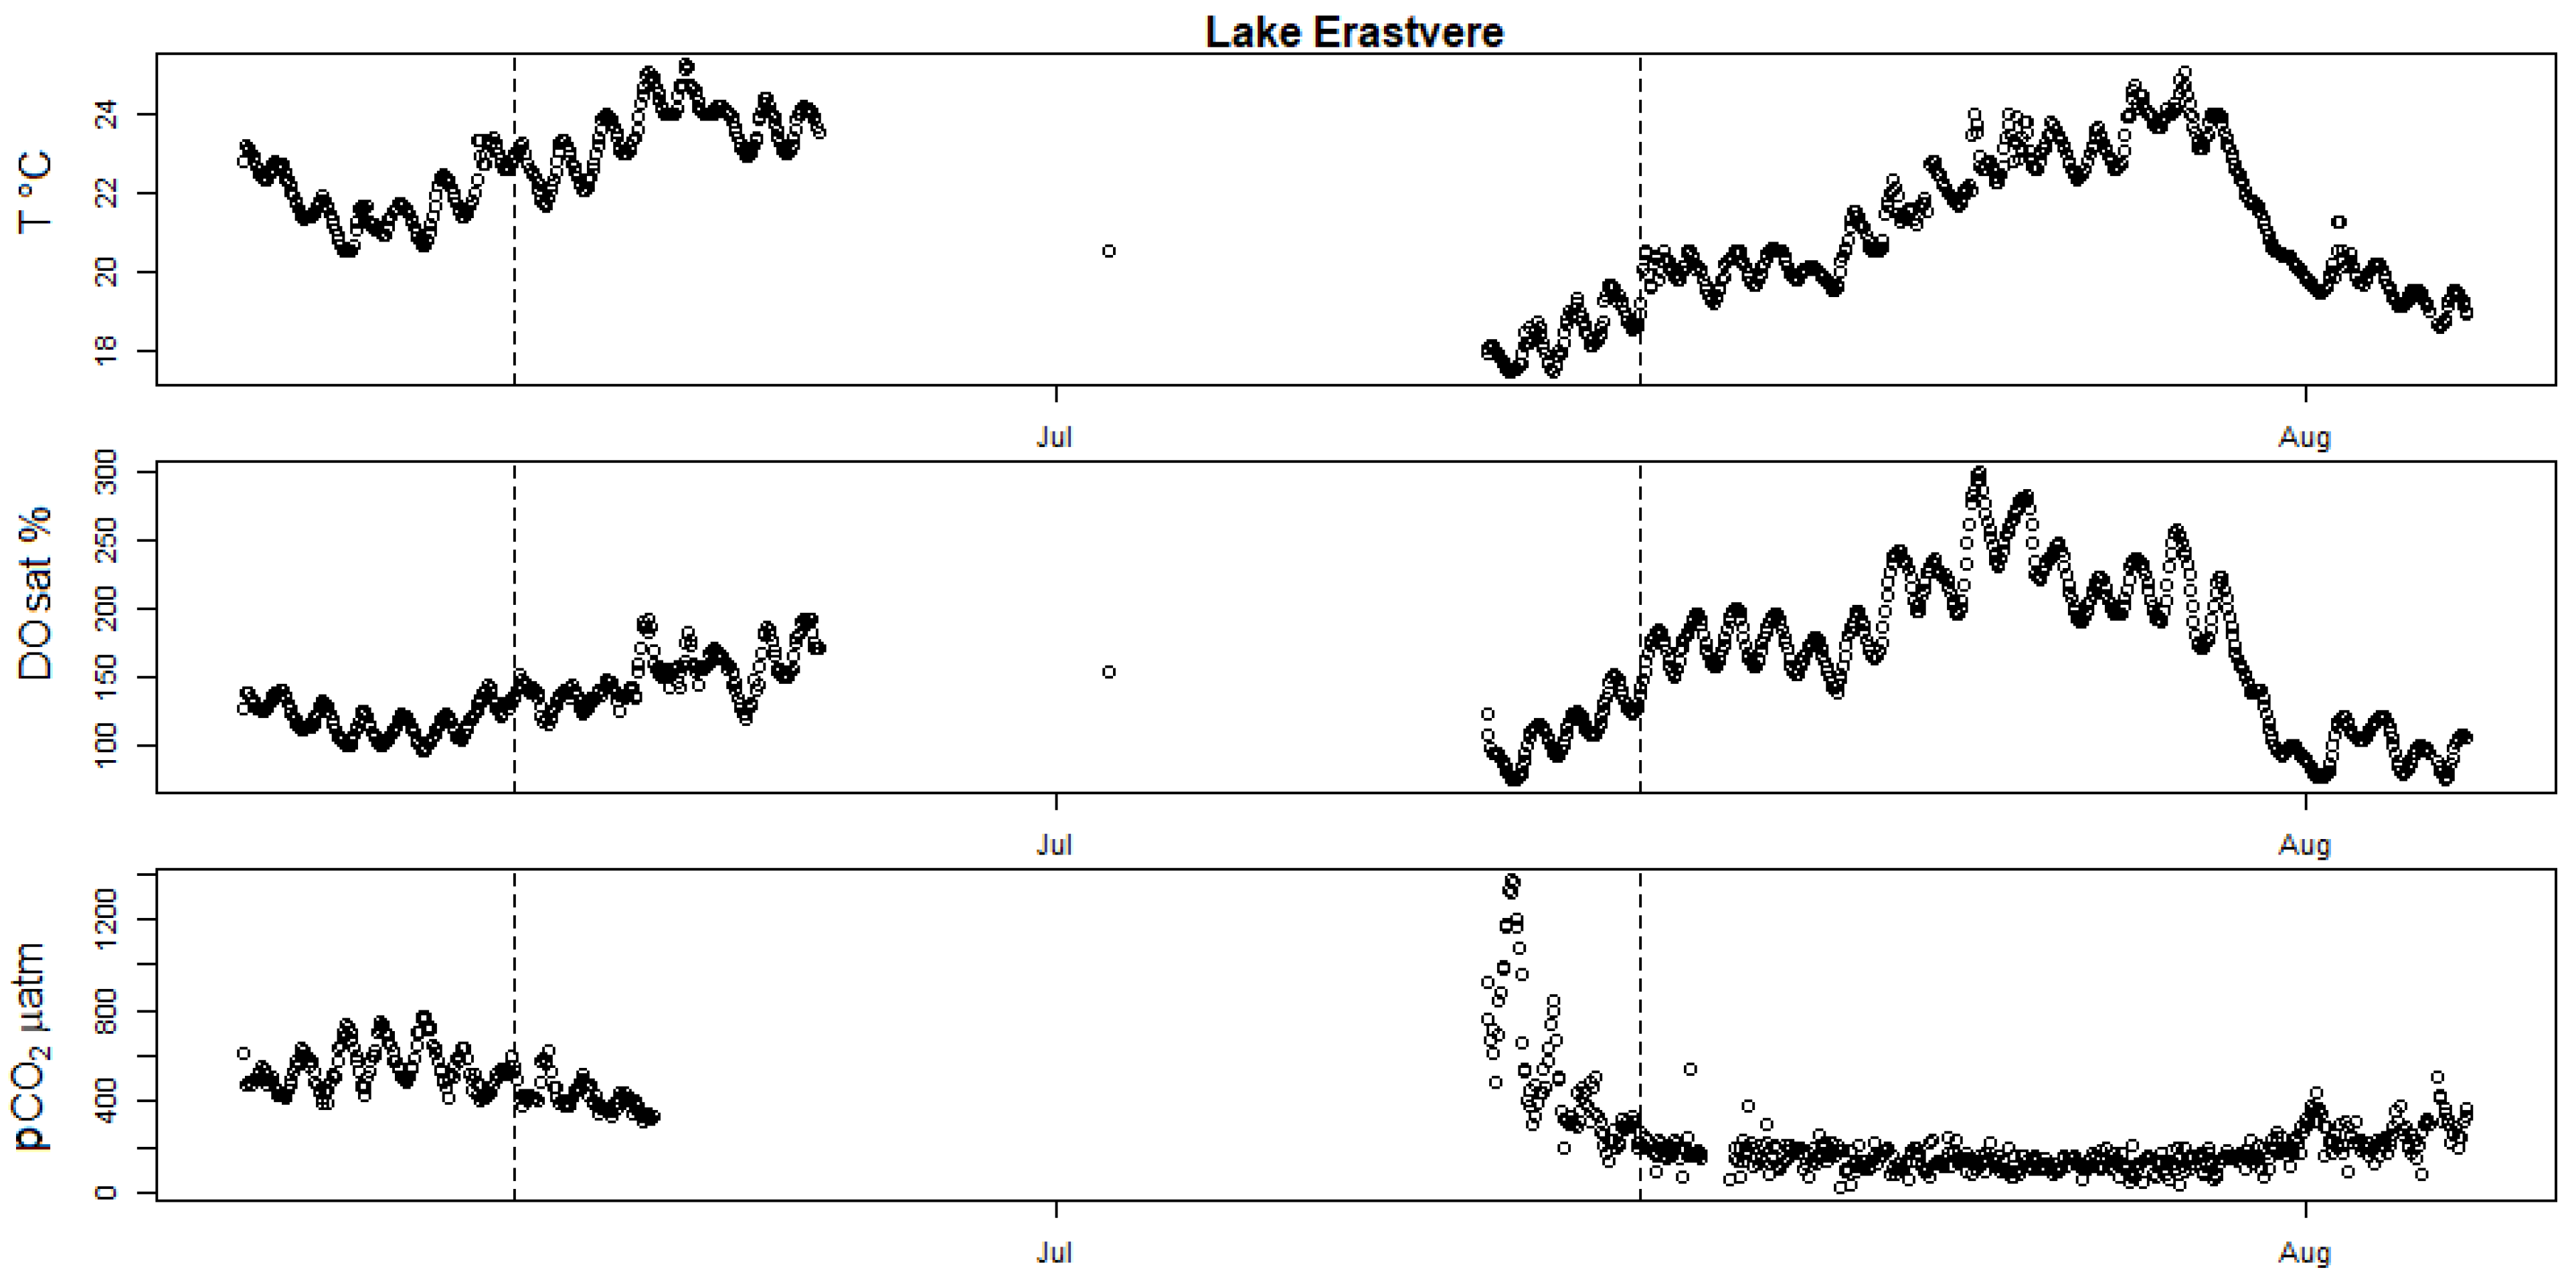
Figure A4.
High-frequency bouy measurements showing seasonal evolution of surface water T (in degrees Celsius), DOsat, pCO2 partial pressure and pH in Võrtsjärv. The two vertical dotted bars mark the date of the two incubation campaigns (17.6.2019 and 15 July 2019).
Figure A4.
High-frequency bouy measurements showing seasonal evolution of surface water T (in degrees Celsius), DOsat, pCO2 partial pressure and pH in Võrtsjärv. The two vertical dotted bars mark the date of the two incubation campaigns (17.6.2019 and 15 July 2019).
References
- Cole, J.J.; Prairie, Y.T.; Caraco, N.F.; McDowell, W.H.; Tranvik, L.J.; Striegl, R.G.; Duarte, C.M.; Kortelainen, P.; Downing, J.A.; Middelburg, J.J.; et al. Plumbing the global carbon cycle: Integrating inland waters into the terrestrial carbon budget. Ecosystems 2007, 10, 171–184. [Google Scholar] [CrossRef] [Green Version]
- Raymond, P.A.; Hartmann, J.; Lauerwald, R.; Sobek, S.; McDonald, C.; Hoover, M.; Butman, D.; Striegl, R.; Mayorga, E.; Humborg, C.; et al. Global carbon dioxide emissions from inland waters. Nature 2013, 503, 355–359. [Google Scholar] [CrossRef] [Green Version]
- Mendonça, R.; Müller, R.A.; Clow, D.; Verpoorter, C.; Raymond, P.; Tranvik, L.J.; Sobek, S. Organic carbon burial in global lakes and reservoirs. Nat. Commun. 2017, 8, 1–6. [Google Scholar] [CrossRef] [PubMed] [Green Version]
- Duarte, C.M.; Prairie, Y.T. Prevalence of heterotrophy and atmospheric CO2 emissions from aquatic ecosystems. Ecosystems 2005, 8, 862–870. [Google Scholar] [CrossRef]
- Del Giorgio, P.A.; Cole, J.J.; Caraco, N.F.; Peters, R.H. Linking planktonic biomass and metabolism to net gas fluxes in northern temperate lakes. Ecology 1999, 80, 1422–1431. [Google Scholar] [CrossRef]
- Larsen, S.; Andersen, T.; Hessen, D.O. The pCO2 in boreal lakes: Organic carbon as a universal predictor? Glob. Biogeochem. Cycles 2011, 25. [Google Scholar] [CrossRef]
- Marcé, R.; Obrador, B.; Morguí, J.-A.; Riera, J.L.; López, P.; Joan, A. Carbonate weathering as a driver of CO2 supersaturation in lakes. Nat. Geosci. 2015, 8, 107–111. [Google Scholar] [CrossRef]
- McDonald, C.P.; Stets, E.G.; Striegl, R.G.; Butman, D. Inorganic carbon loading as a primary driver of dissolved carbon dioxide concentrations in the lakes and reservoirs of the contiguous United States. Glob. Biogeochem. Cycles 2013, 27, 285–295. [Google Scholar] [CrossRef]
- Müller, B.; Meyer, J.S.; Gächter, R. Alkalinity regulation in calcium carbonate-buffered lakes. Limnol. Oceanogr. 2016, 61, 341–352. [Google Scholar] [CrossRef] [Green Version]
- Nõges, P.; Cremona, F.; Laas, A.; Martma, T.; Rõõm, E.I.; Toming, K.; Viik, M.; Vilbaste, S.; Nõges, T. Role of a productive lake in carbon sequestration within a calcareous catchment. Sci. Total Environ. 2016, 550, 225–230. [Google Scholar] [CrossRef]
- Fuchs, A.; Selmeczy, G.B.; Kasprzak, P.; Padisák, J.; Casper, P. Coincidence of sedimentation peaks with diatom blooms, wind, and calcite precipitation measured in high resolution by a multi-trap. Hydrobiologia 2016, 763, 329–344. [Google Scholar] [CrossRef]
- Trapote, M.C.; Vegas-Vilarrúbia, T.; López, P.; Puche, E.; Gomà, J.; Buchaca, T.; Cañellas-Boltà, N.; Safont, E.; Corella, J.P.; Rull, V. Modern sedimentary analogues and integrated monitoring to understand varve formation in the Mediterranean Lake Montcortès (Central Pyrenees, Spain). Palaeogeogr. Palaeoclimatol. Palaeoecol. 2018, 496, 292–304. [Google Scholar] [CrossRef] [Green Version]
- Obst, M.; Wehrli, B.; Dittrich, M. CaCO3 nucleation by cyanobacteria: Laboratory evidence for a passive, surface-induced mechanism. Geobiology 2009, 7, 324–347. [Google Scholar] [CrossRef] [PubMed]
- Dittrich, M.; Obst, M. Are picoplankton responsible for calcite precipitation in lakes? Ambio 2004, 33, 559–564. [Google Scholar] [CrossRef] [PubMed]
- Dittrich, M.; Kurz, P.; Wehrli, B. The Role of Autotrophic Picocyanobacteria in Calcite Precipitation in an Oligotrophic Lake. Geomicrobiol. J. 2004, 21, 45–53. [Google Scholar] [CrossRef]
- Strong, A.E.; Eadie, B.J. Satellite observations of calcium carbonate precipitation in the Great Lakes. Limnol. Ocean. 1978, 23, 877–887. [Google Scholar] [CrossRef]
- Carpenter, S.R.; Caraco, N.F.; Correll, D.L.; Howarth, R.W.; Sharpley, A.N.; Smith, V.H. Nonpoint pollution of surface waters with phosphorus and nitrogen. Ecol. Appl. 1998, 8, 559–568. [Google Scholar] [CrossRef]
- Smith, V.H. Eutrophication of freshwater and coastal marine ecosystems: A global problem. Environ. Sci. Pollut. Res. Int. 2003, 10, 126–139. [Google Scholar] [CrossRef]
- Conley, D.J.; Paerl, H.W.; Howarth, R.W.; Boesch, D.F.; Seitzinger, S.P.; Havens, K.E.; Lancelot, C.; Likens, G.E. ECOLOGY: Controlling Eutrophication: Nitrogen and Phosphorus. Sci. Am. Assoc. Adv. Sci. 2009, 323, 1014–1015. [Google Scholar] [CrossRef]
- Stets, E.G.; Striegl, R.G.; Aiken, G.R.; Rosenberry, D.O.; Winter, T.C. Hydrologic support of carbon dioxide flux revealed by whole-lake carbon budgets. J. Geophys. Res. 2009, 114, 1–14. [Google Scholar] [CrossRef]
- Perga, M.-E.; Maberly, S.C.; Jenny, J.-P.; Alric, B.; Pignol, C.; Naffrechoux, E. A century of human-driven changes in the carbon dioxide concentration of lakes. Glob. Biogeochem. Cycles 2016, 30, 93–104. [Google Scholar] [CrossRef] [Green Version]
- Duarte, C.M.; Prairie, Y.T.; Montes, C.; Cole, J.J.; Striegl, R.; Melack, J.; Downing, J.A. CO2 emissions from saline lakes: A global estimate of a surprisingly large flux. J. Geophys. Res. 2008, 113. [Google Scholar] [CrossRef] [Green Version]
- Khan, H.; Marcé, R.; Laas, A.; Obrador, B. The relevance of pelagic calcification in the global carbon budget of lakes and reservoirs. Limnetica. in press.
- Lu, W.; Wang, S.; Yeager, K.M.; Liu, F.; Huang, Q.; Yang, Y.; Xiang, P.; Lü, Y.; Liu, C. Importance of considered organic vs. inorganic source of carbon to lakes for calculating net effect on landscape C budgets. J. Geophys. Res. Biogeosci. 2018, 123, 1302–1317. [Google Scholar] [CrossRef]
- Megard, R.O. Planktonic photosynthesis and the environment of carbonate deposition in lakes. SIL Commun. 1953–1996 1968, 17, 94. [Google Scholar] [CrossRef]
- McConnaughey, T. Calcification in Chara corallina: CO2 hydroxylation generates protons for bicarbonate assimilation. Limnol. Oceanogr. 1991, 36, 619–628. [Google Scholar] [CrossRef]
- McConnaughey, T.A.; Whelan, J.F. Calcification generates protons for nutrient and bicarbonate uptake. Earth Sci. Rev. 1997, 42, 95–117. [Google Scholar] [CrossRef]
- Riebesell, U.; Zondervan, I.; Rost, B.; Tortell, P.D.; Zeebe, R.E.; Morel, F.M.M. Reduced calcification of marine plankton in response to increased atmospheric CO2. Nature 2000, 407, 364–367. [Google Scholar] [CrossRef] [Green Version]
- Gattuso, J.-P.; Allemand, D.; Frankignoulle, M. Photosynthesis and Calcification at cellular, organismal and community levels in coral reefs: A review on interactions and control by carbonate chemistry. Integr. Comp. Biol. 1999, 39, 160–183. [Google Scholar] [CrossRef] [Green Version]
- Khan, H.; Laas, A.; Marcé, R.; Obrador, B. Major effects of alkalinity on the relationship between metabolism and dissolved inorganic carbon dynamics in lakes. Ecosystems 2020, 23, 1566–1580. [Google Scholar] [CrossRef] [Green Version]
- Laas, A.; Cremona, F.; Meinson, P.; Rõõm, E.-I.; Nõges, T.; Nõges, P. Summer depth distribution profiles of dissolved CO2 and O2 in shallow temperate lakes reveal trophic state and lake type specific differences. Sci. Total Environ. 2016, 566–567, 63–75. [Google Scholar] [CrossRef] [PubMed]
- Cremona, F.; Laas, A.; Arvola, L.; Pierson, D.; Nõges, P.; Nõges, T. Numerical exploration of the planktonic to benthic primary production ratios in lakes of the Baltic Sea catchment. Ecosystems 2016, 19, 1386–1400. [Google Scholar] [CrossRef]
- Rõõm, E.I.; Nõges, P.; Feldmann, T.; Tuvikene, L.; Kisand, A.; Teearu, H.; Nõges, T. Years are not brothers: Two-year comparison of greenhouse gas fluxes in large shallow Lake Võrtsjärv, Estonia. J. Hydrol. 2014, 519, 1594–1606. [Google Scholar] [CrossRef]
- Marcé, R.; Moreno-Ostos, E.; Armengol, J. The role of river inputs on the hypolimnetic chemistry of a productive reservoir: Implications for management of anoxia and total phosphorus internal loading. Lake Reserv. Manag. 2008, 24, 87–98. [Google Scholar] [CrossRef] [Green Version]
- Marcé, R.; George, G.; Buscarinu, P.; Deidda, M.; Dunalska, J.; De Eyto, E.; Flaim, G.; Grossart, H.P.; Istvanovics, V.; Lenhardt, M.; et al. Automatic High Frequency Monitoring for Improved Lake and Reservoir Management. Environ. Sci. Technol. 2016, 50, 10780–10794. [Google Scholar] [CrossRef]
- Jeffrey, S.W.; Humphrey, G.F. New spectrophotometric equations for determining chlorophylls a, b, c1 and c2 in higher plants, algae and natural phytoplankton. Biochem. Physiol. Pflanz. 1975, 167, 191–194. [Google Scholar] [CrossRef]
- Hansen, H.P.; Koroleff, F. Determination of nutrients. In Methods of Seawater Analysis; John Wiley & Sons, Ltd.: Hoboken, NJ, USA, 1999; pp. 159–228. ISBN 9783527613984. [Google Scholar]
- APHA; AWWA; WEF. Standard Methods for the Examination of Water and Wastewater, 20th ed.; APHA: Washington, DC, USA; AWWA: Denver, CO, USA; WEF: Alexandria, VA, USA, 1999. [Google Scholar]
- CEN European Commitee for Standardization EN 1484 Water analysis—Guidelines for the determination of total organic carbon (TOC) and dissolved organic carbon (DOC) Analyse. CEN Eur. Commitee Stand. 1997, 2007, 11.
- Lewis, E.; Wallace, D.; Allison, L.J. Program developed for CO2 system calculations. Carbon Dioxide Inf. Anal. Cent. 1998, 1–21. [Google Scholar] [CrossRef]
- Millero, F.J. The thermodynamics of the carbonate system in seawater. Geochim. Cosmochim. Acta 1979, 43, 1651–1661. [Google Scholar] [CrossRef]
- Mucci, A. The solubility of calcite and aragonite in seawater at various salinities, temperatures, and one atmosphere total pressure. Am. J. Sci. 1983, 283. [Google Scholar] [CrossRef]
- Hamilton, S.K.; Bruesewitz, D.A.; Horst, G.P.; Weed, D.B.; Sarnelle, O. Biogenic calcite–phosphorus precipitation as a negative feedback to lake eutrophication. Can. J. Fish. Aquat. Sci. 2009, 66, 343–350. [Google Scholar] [CrossRef]
- Khan, H. Calcite precipitation and pCO2 model. 2020. [Google Scholar] [CrossRef]
- Walsh, J.R.; Corman, J.R.; Munoz, S.E. Coupled long-term limnological data and sedimentary records reveal new control on water quality in a eutrophic lake. Limnol. Oceanogr. 2019, 64, 34–48. [Google Scholar] [CrossRef] [Green Version]
- Hsieh, C.H.; Ishikawa, K.; Sakai, Y.; Ishikawa, T.; Ichise, S.; Yamamoto, Y.; Kuo, T.C.; Park, H.D.; Yamamura, N.; Kumagai, M. Phytoplankton community reorganization driven by eutrophication and warming in Lake Biwa. Aquat. Sci. 2010, 72, 467–483. [Google Scholar] [CrossRef]
- Drake, T.W.; Tank, S.E.; Zhulidov, A.V.; Holmes, R.M.; Gurtovaya, T.; Spencer, R.G.M. Increasing Alkalinity Export from Large Russian Arctic Rivers. Environ. Sci. Technol. 2018, 52, 8302–8308. [Google Scholar] [CrossRef] [PubMed]
- Raymond, P.A.; Cole, J.J. Increase in the export of alkalinity from North America’s largest river. Science 2003, 301, 88–91. [Google Scholar] [CrossRef] [Green Version]
- Gattuso, J.-P.; Frankignoulle, M.; Smith, S. V Measurement of community metabolism and significance in the coral reef CO2 source-sink debate. Proc. Natl. Acad. Sci. USA 1999, 96, 13017–13022. [Google Scholar] [CrossRef] [Green Version]
- Suzuki, A. Combined effects of photosynthesis and calcification on the partial pressure of carbon dioxide in seawater. J. Oceanogr. 1998, 54, 1–7. [Google Scholar] [CrossRef] [Green Version]
- Lerman, A.; Mackenzie, F.T. Carbonate minerals and the CO2-carbonic acid system. In Encyclopedia of Geochemistry; Encyclopedia of Earth Sciences Series; Springer: Cham, Switzerland, 2018. [Google Scholar]
- Stabel, H.-H. Calcite precipitation in Lake Constance: Chemical equilibrium, sedimentation, and nucleation by algae. Limnol. Oceanogr. 1986, 31, 1081–1093. [Google Scholar] [CrossRef] [Green Version]
- Ridgwell, A.; Zeebe, R.E. The role of the global carbonate cycle in the regulation and evolution of the Earth system. Earth Planet. Sci. Lett. 2005, 234, 299–315. [Google Scholar] [CrossRef]
- Kalokora, O.J.; Buriyo, A.S.; Asplund, M.E.; Gullström, M.; Mtolera, M.S.P.; Björk, M. An experimental assessment of algal calcification as a potential source of atmospheric CO2. PLoS ONE 2020, 15, E0231971. [Google Scholar] [CrossRef] [PubMed]
- Obrador, B.; Pretus, J.L. Carbon and oxygen metabolism in a densely vegetated lagoon: Implications of spatial heterogeneity. Limnetica 2013, 32, 321–336. [Google Scholar]
- Vachon, D.; Sadro, S.; Bogard, M.J.; Lapierre, J.; Baulch, H.M.; Rusak, J.A.; Denfeld, B.A.; Laas, A.; Klaus, M.; Karlsson, J.; et al. Paired O2–CO2 measurements provide emergent insights into aquatic ecosystem function. Limnol. Oceanogr. Lett. 2020, 5, 287–294. [Google Scholar] [CrossRef] [Green Version]
- Andersen, R.M.; Kragh, T.; Martinsen, T.; Kristensen, E.; Sand-Jensen, K. The carbon pump supports high primary production in a shallow lake. Aquat. Sci. 2019, 81. [Google Scholar] [CrossRef]
- Finlay, K.; Vogt, R.J.; Simpson, G.L.; Leavitt, P.R. Seasonality of pCO2 in a hard-water lake of the northern Great Plains: The legacy effects of climate and limnological conditions over 36 years. Limnol. Oceanogr. 2019, 64, S118–S129. [Google Scholar] [CrossRef] [Green Version]
Figure 1.
(a) Calcite saturation index (SI) in the 11 experimental campaigns. (b) Mean (±sd) rate of change of alkalinity. Numbers after the name of lakes represent the day and month of sampling; all lakes were sampled in 2019 except for Sau Reservoir in 2018.
Figure 1.
(a) Calcite saturation index (SI) in the 11 experimental campaigns. (b) Mean (±sd) rate of change of alkalinity. Numbers after the name of lakes represent the day and month of sampling; all lakes were sampled in 2019 except for Sau Reservoir in 2018.
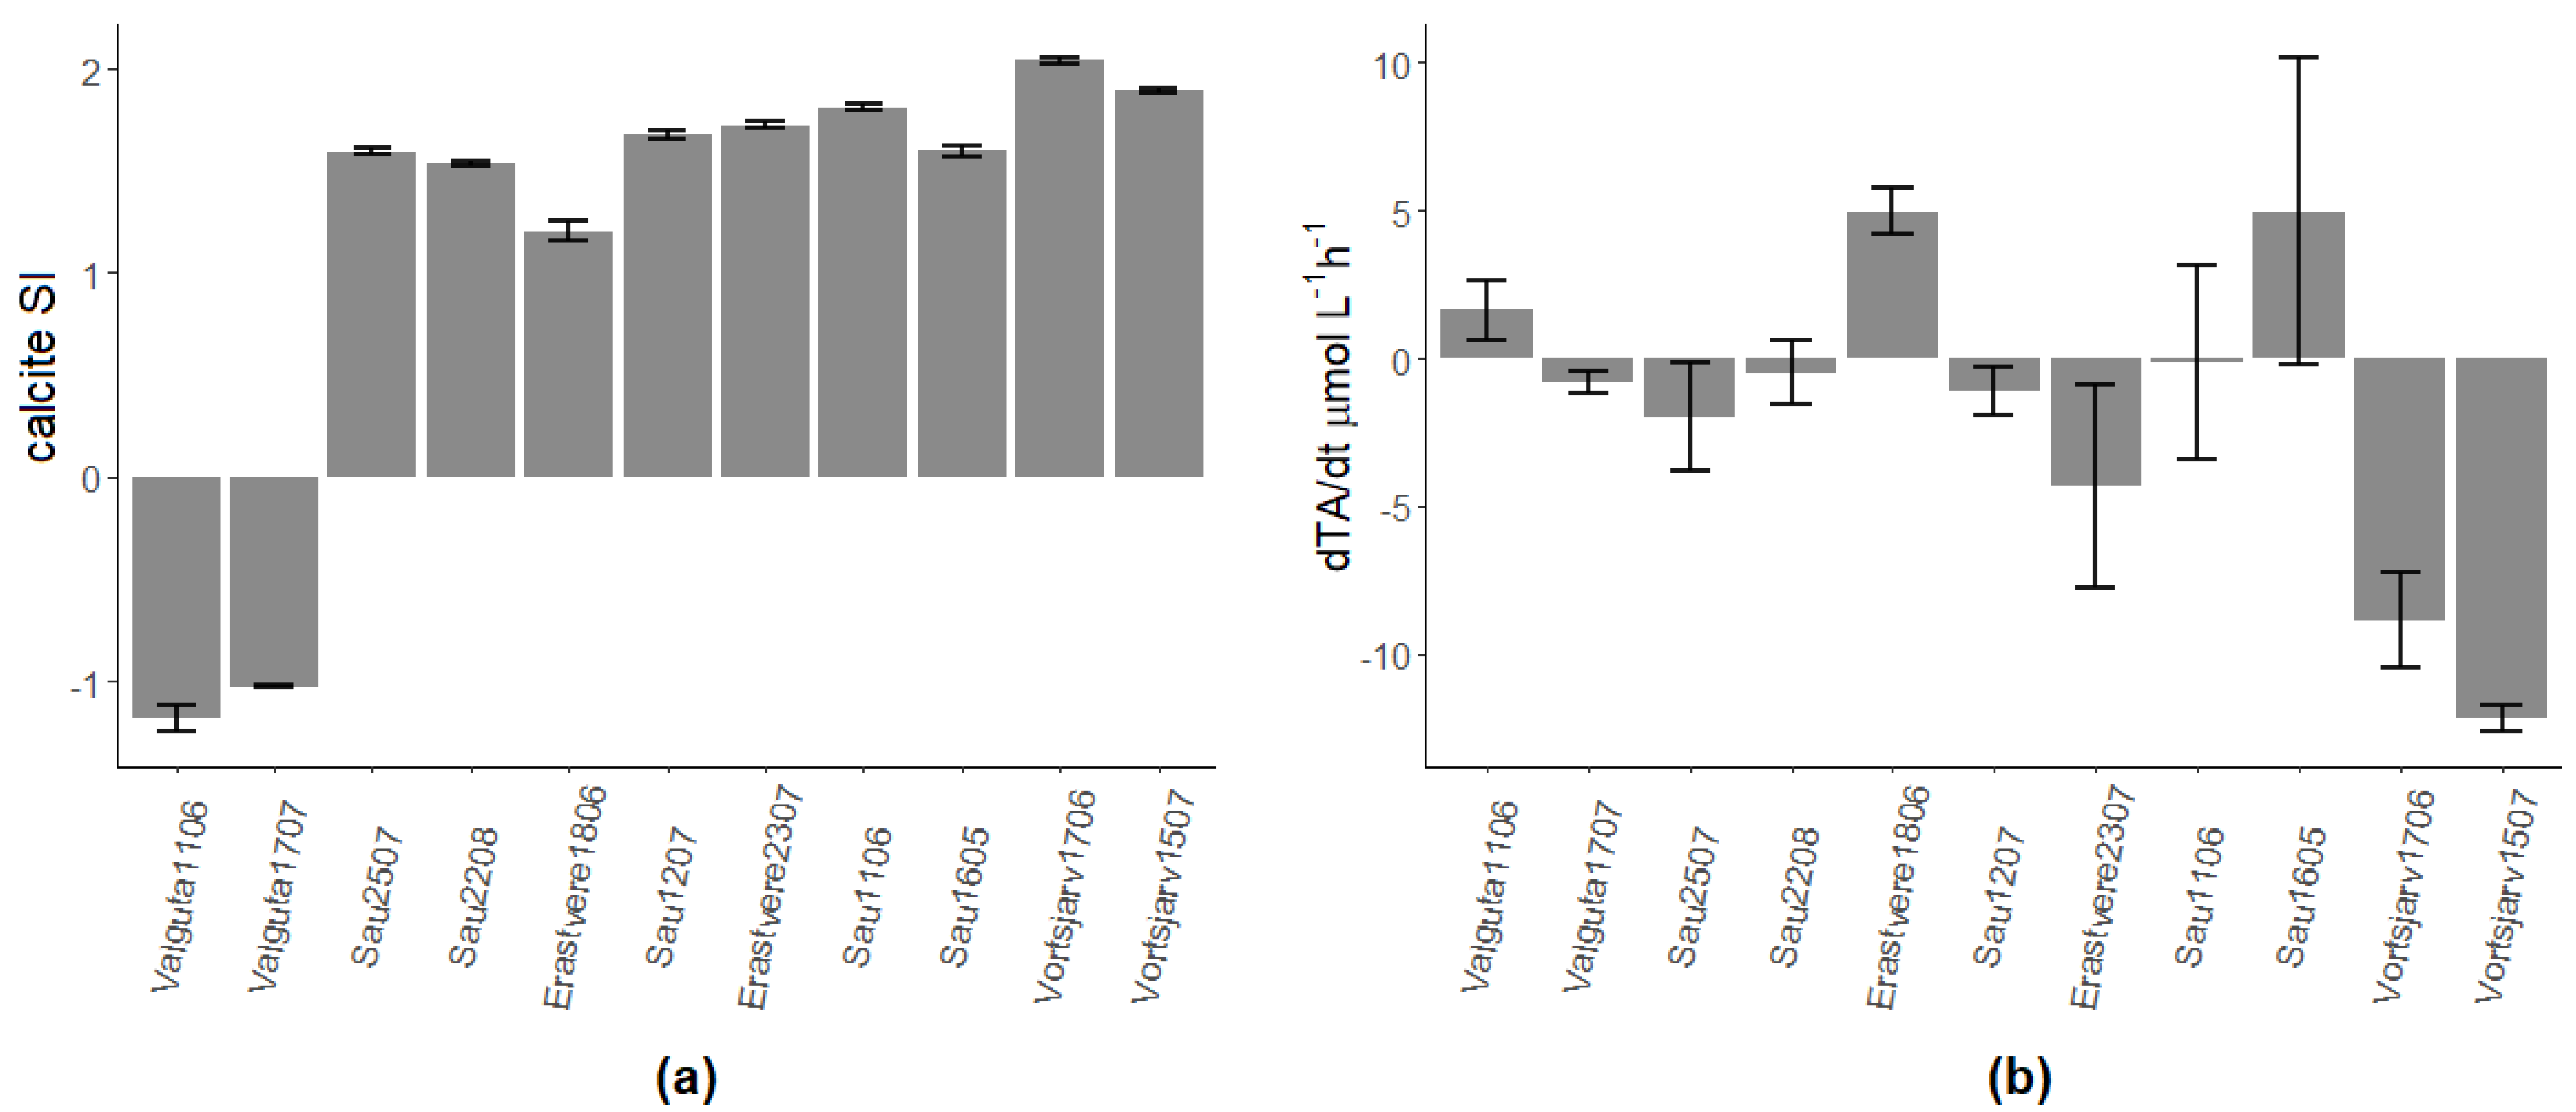
Figure 2.
(a) Relationship between net ecosystem production (NEP) and calcification rates. (b) Relationship between calcite SI and calcification rates.
Figure 2.
(a) Relationship between net ecosystem production (NEP) and calcification rates. (b) Relationship between calcite SI and calcification rates.

Figure 3.
Relationship between the calcification to NEP ratio (α) and the calcite SI (note the log–log scale).
Figure 3.
Relationship between the calcification to NEP ratio (α) and the calcite SI (note the log–log scale).

Figure 4.
Relationship between the calcification/NEP ratio (α) and the response of dissolved inorganic carbon (DIC) to metabolism.
Figure 4.
Relationship between the calcification/NEP ratio (α) and the response of dissolved inorganic carbon (DIC) to metabolism.
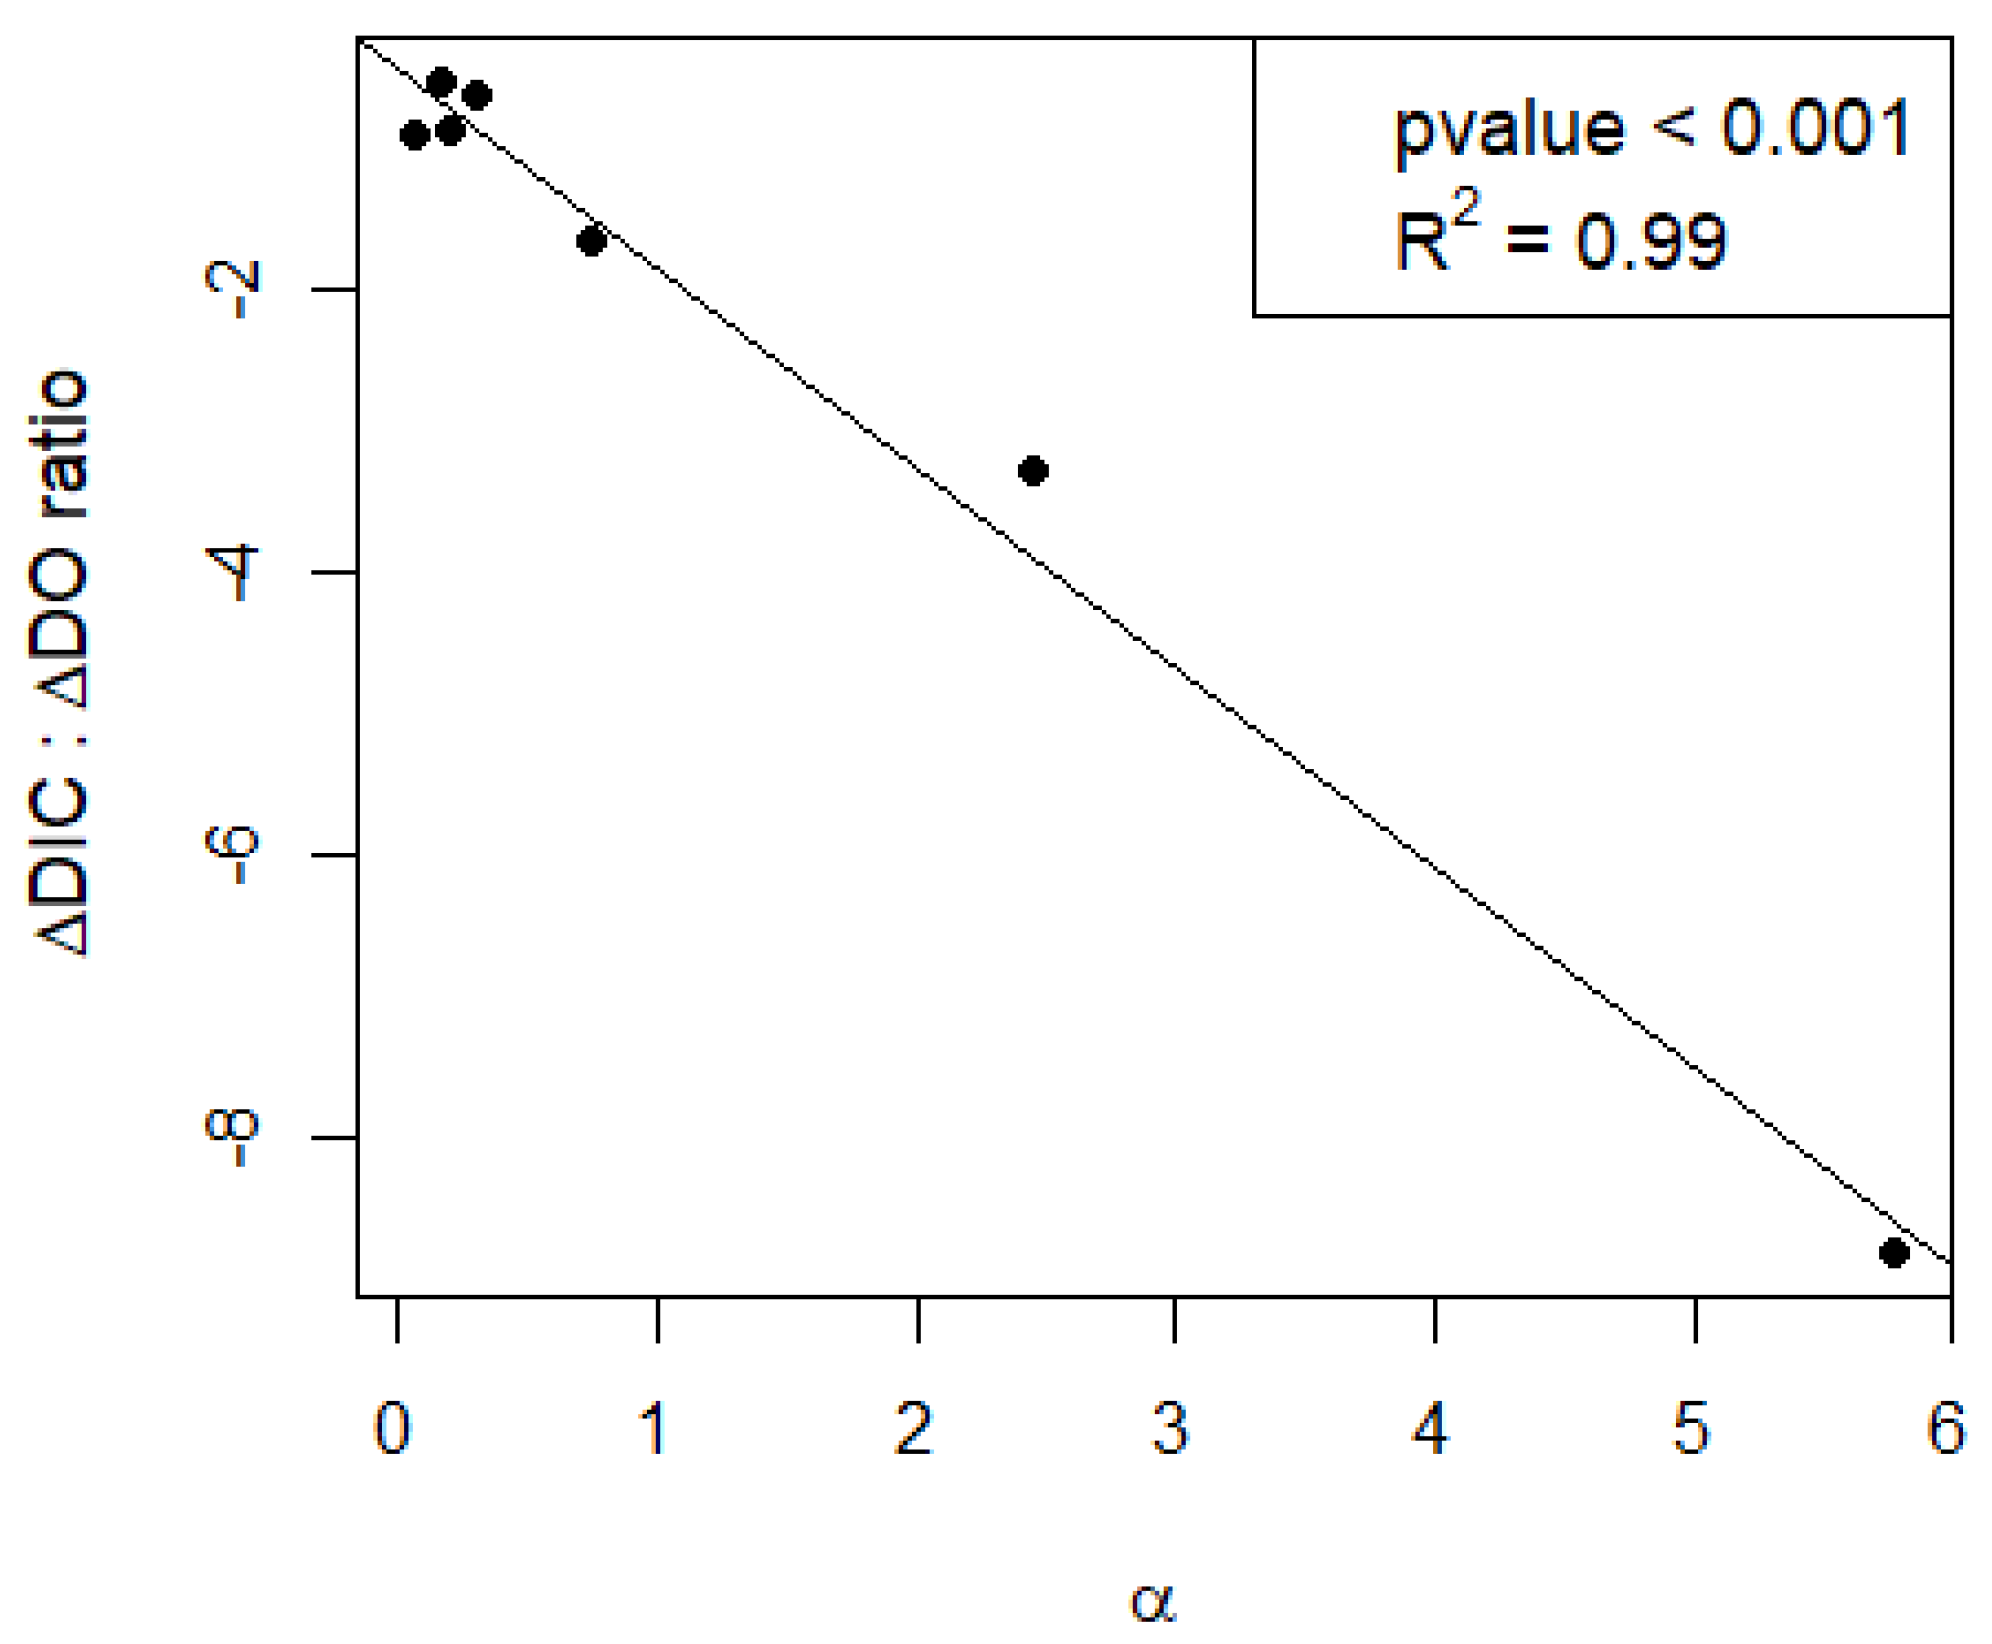
Figure 5.
Seasonal evolution of surface water variables in Sau Reservoir. The high-frequency measurements of temperature (T) (in degrees Celsius) and dissolved oxygen saturation (DOsat) (dark points) are shown together with the spot surface water measurements (red points) of T, DOsat, calcite SI and [Ca2+] at the time of the campaigns.
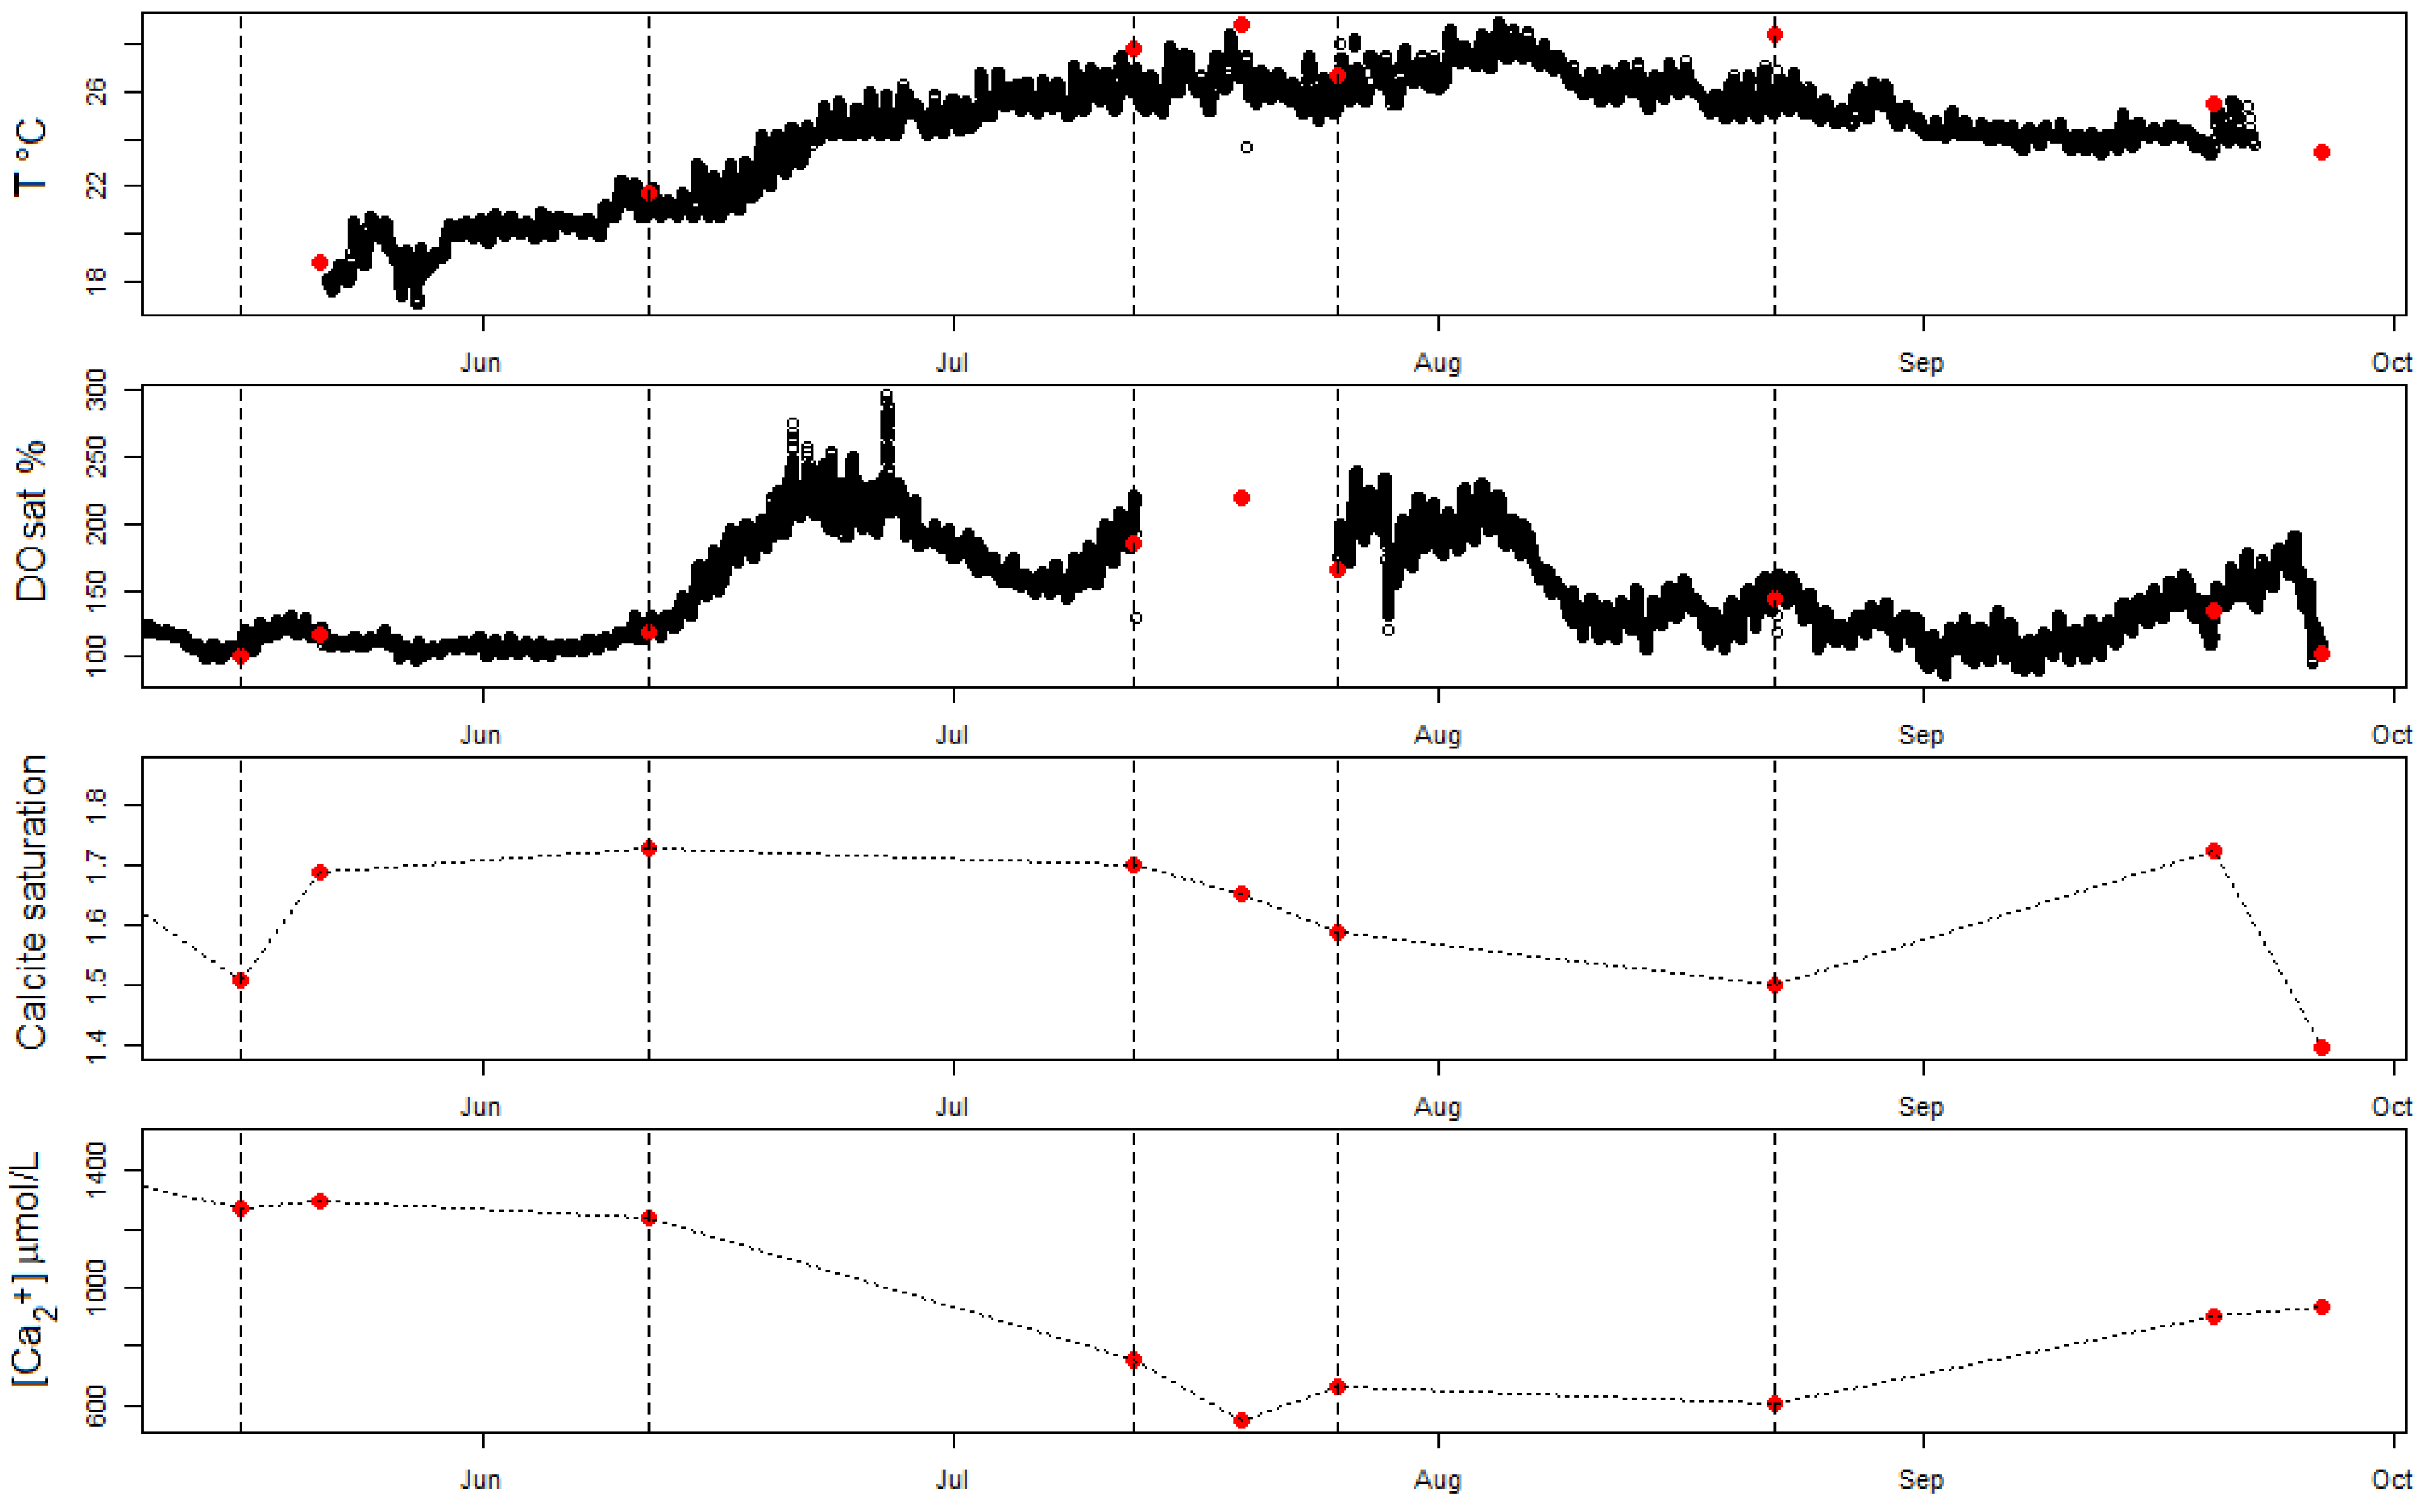
Table 1.
Characteristics of the studied lakes. Values represent long-term averages.
| Lake | Trophic State | Mixing Regime | Area (Ha) | Mean Depth (m) | Maximum Depth (m) | Kd (m) | Watershed Size (km2) | Water Residence Time (y) |
|---|---|---|---|---|---|---|---|---|
| Valguta Mustjärv (EE) | hypertrophic | polymictic | 20.4 | <1 | 1 | 10.3 | 1.34 | source lake |
| Erastvere (EE) | hypertrophic | dimictic | 16.3 | 3.5 | 9.7 | 2.9 | 5.2 | 0.5 |
| Võrtsjärv (EE) | eutrophic | polymictic | 27000 | 2.8 | 6 | 2.7 | 3116 | 1 |
| Sau Reservoir (ES) | eutrophic | monomictic | 600 | 25.2 | 65 | 0.9 | 1522 | 0.3 |
Publisher’s Note: MDPI stays neutral with regard to jurisdictional claims in published maps and institutional affiliations. |
© 2021 by the authors. Licensee MDPI, Basel, Switzerland. This article is an open access article distributed under the terms and conditions of the Creative Commons Attribution (CC BY) license (http://creativecommons.org/licenses/by/4.0/).
Share and Cite
MDPI and ACS Style
Khan, H.; Laas, A.; Marcé, R.; Sepp, M.; Obrador, B. Eutrophication and Geochemistry Drive Pelagic Calcite Precipitation in Lakes. Water 2021, 13, 597. https://doi.org/10.3390/w13050597
AMA Style
Khan H, Laas A, Marcé R, Sepp M, Obrador B. Eutrophication and Geochemistry Drive Pelagic Calcite Precipitation in Lakes. Water. 2021; 13(5):597. https://doi.org/10.3390/w13050597
Chicago/Turabian StyleKhan, Hares, Alo Laas, Rafael Marcé, Margot Sepp, and Biel Obrador. 2021. "Eutrophication and Geochemistry Drive Pelagic Calcite Precipitation in Lakes" Water 13, no. 5: 597. https://doi.org/10.3390/w13050597
Note that from the first issue of 2016, this journal uses article numbers instead of page numbers. See further details here.