
Bridge Pier Scour under Ice Cover


Abstract
1. Introduction
- Examine the differences in scour for floating versus fixed ice covers;
- Investigate the effect of different levels of ice cover submergence (flow pressurization) on scour;
- Evaluate the influence of both smooth and rough ice covers on scour.
2. Materials and Methods
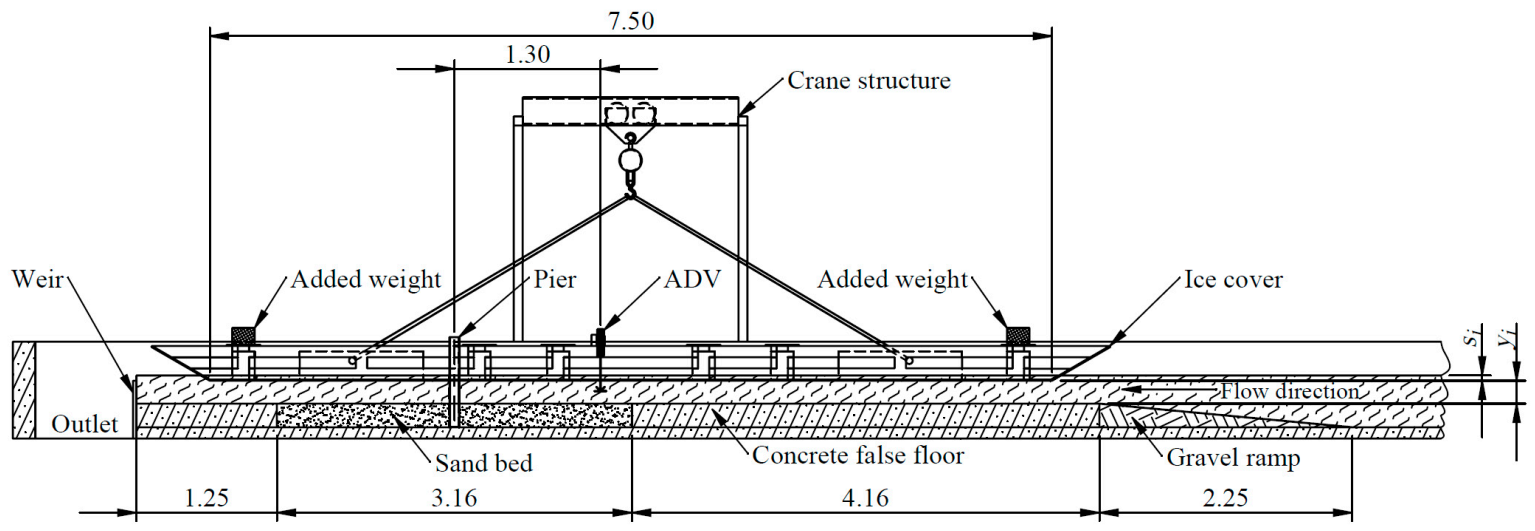
2.1. Flume
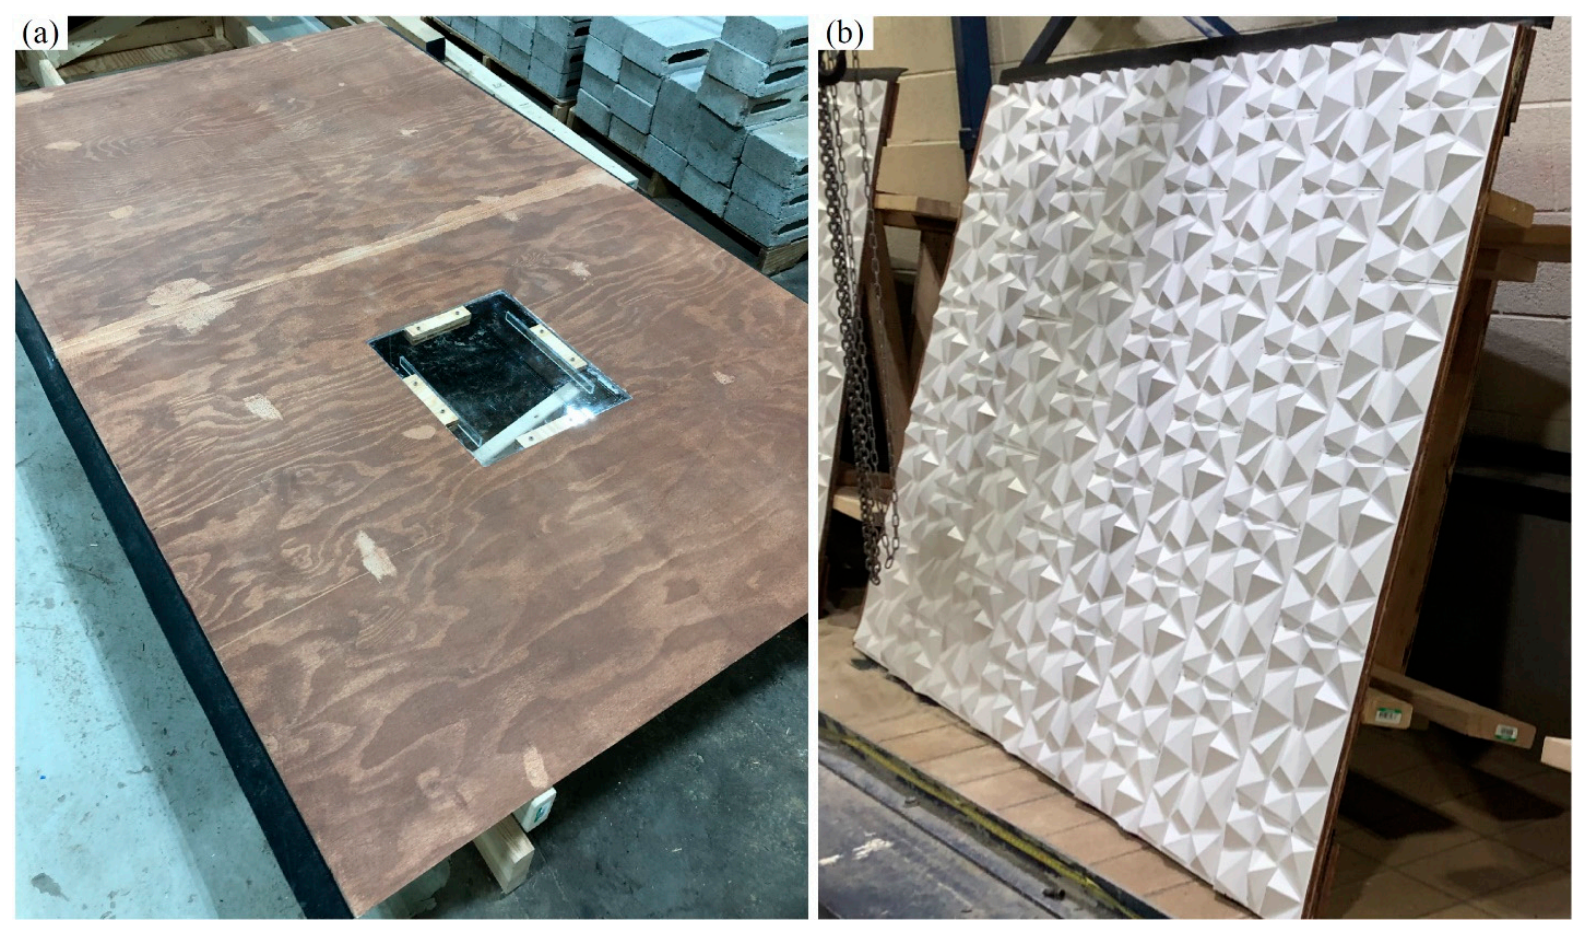
2.2. Ice Cover Construction
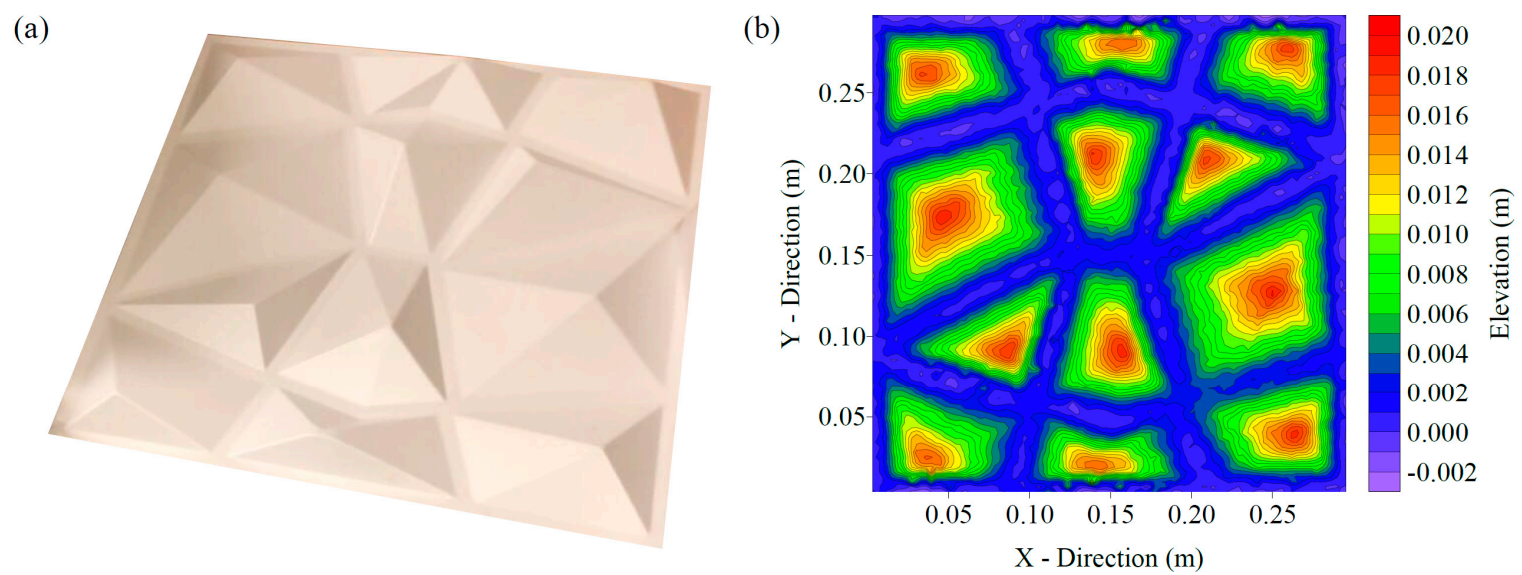
2.3. Ice Cover Roughness
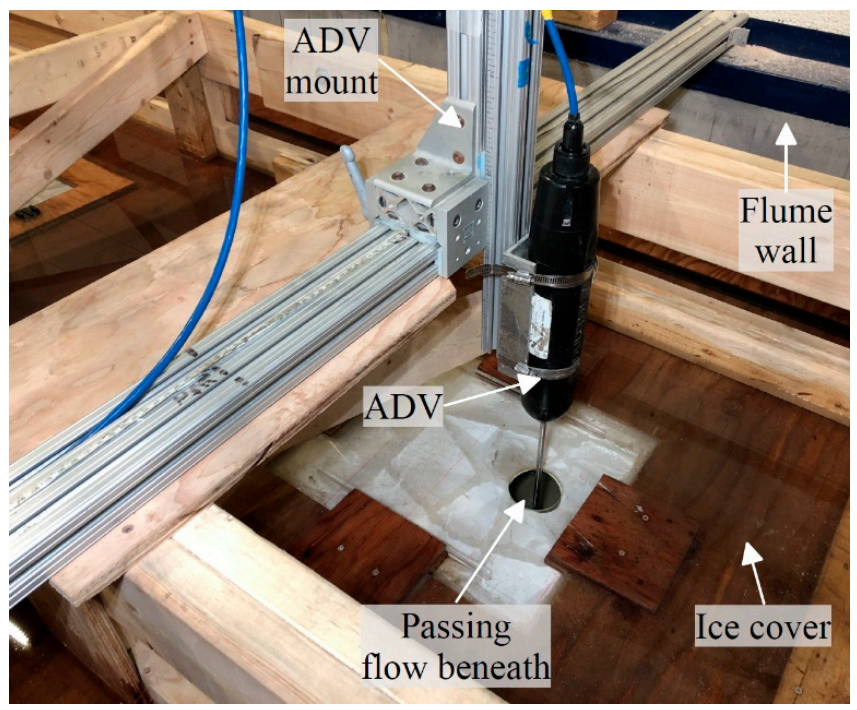
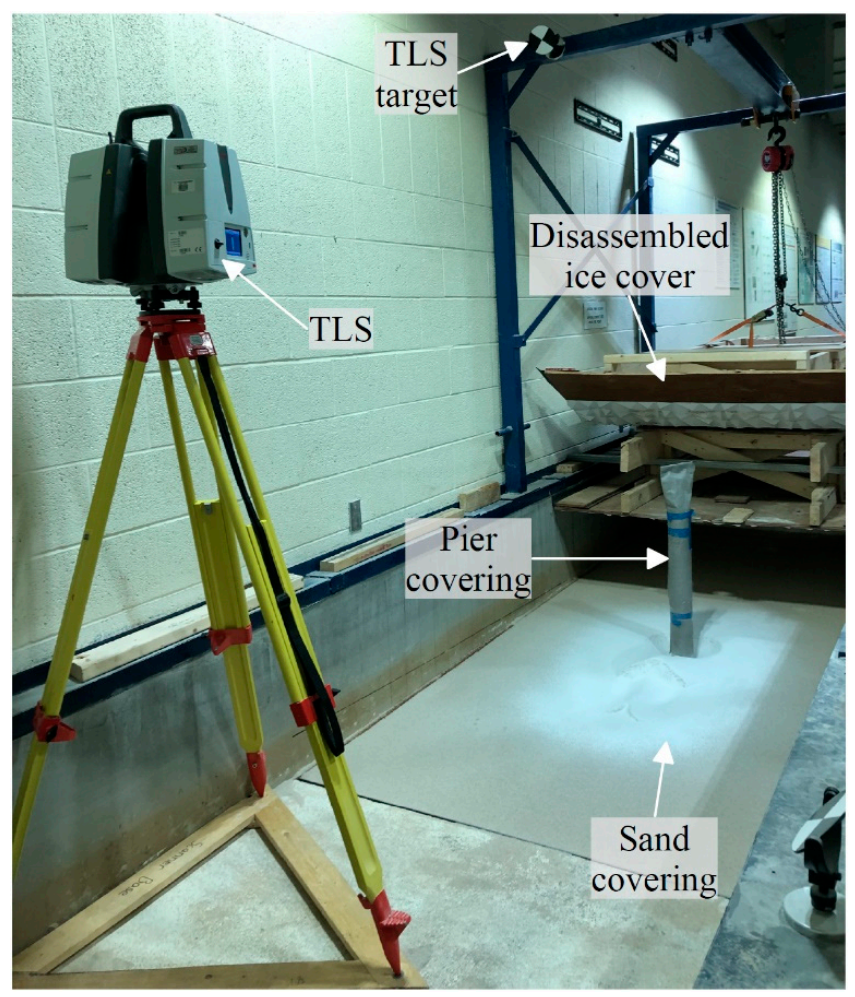
2.4. Instrumentation
2.5. Protocol
3. Results
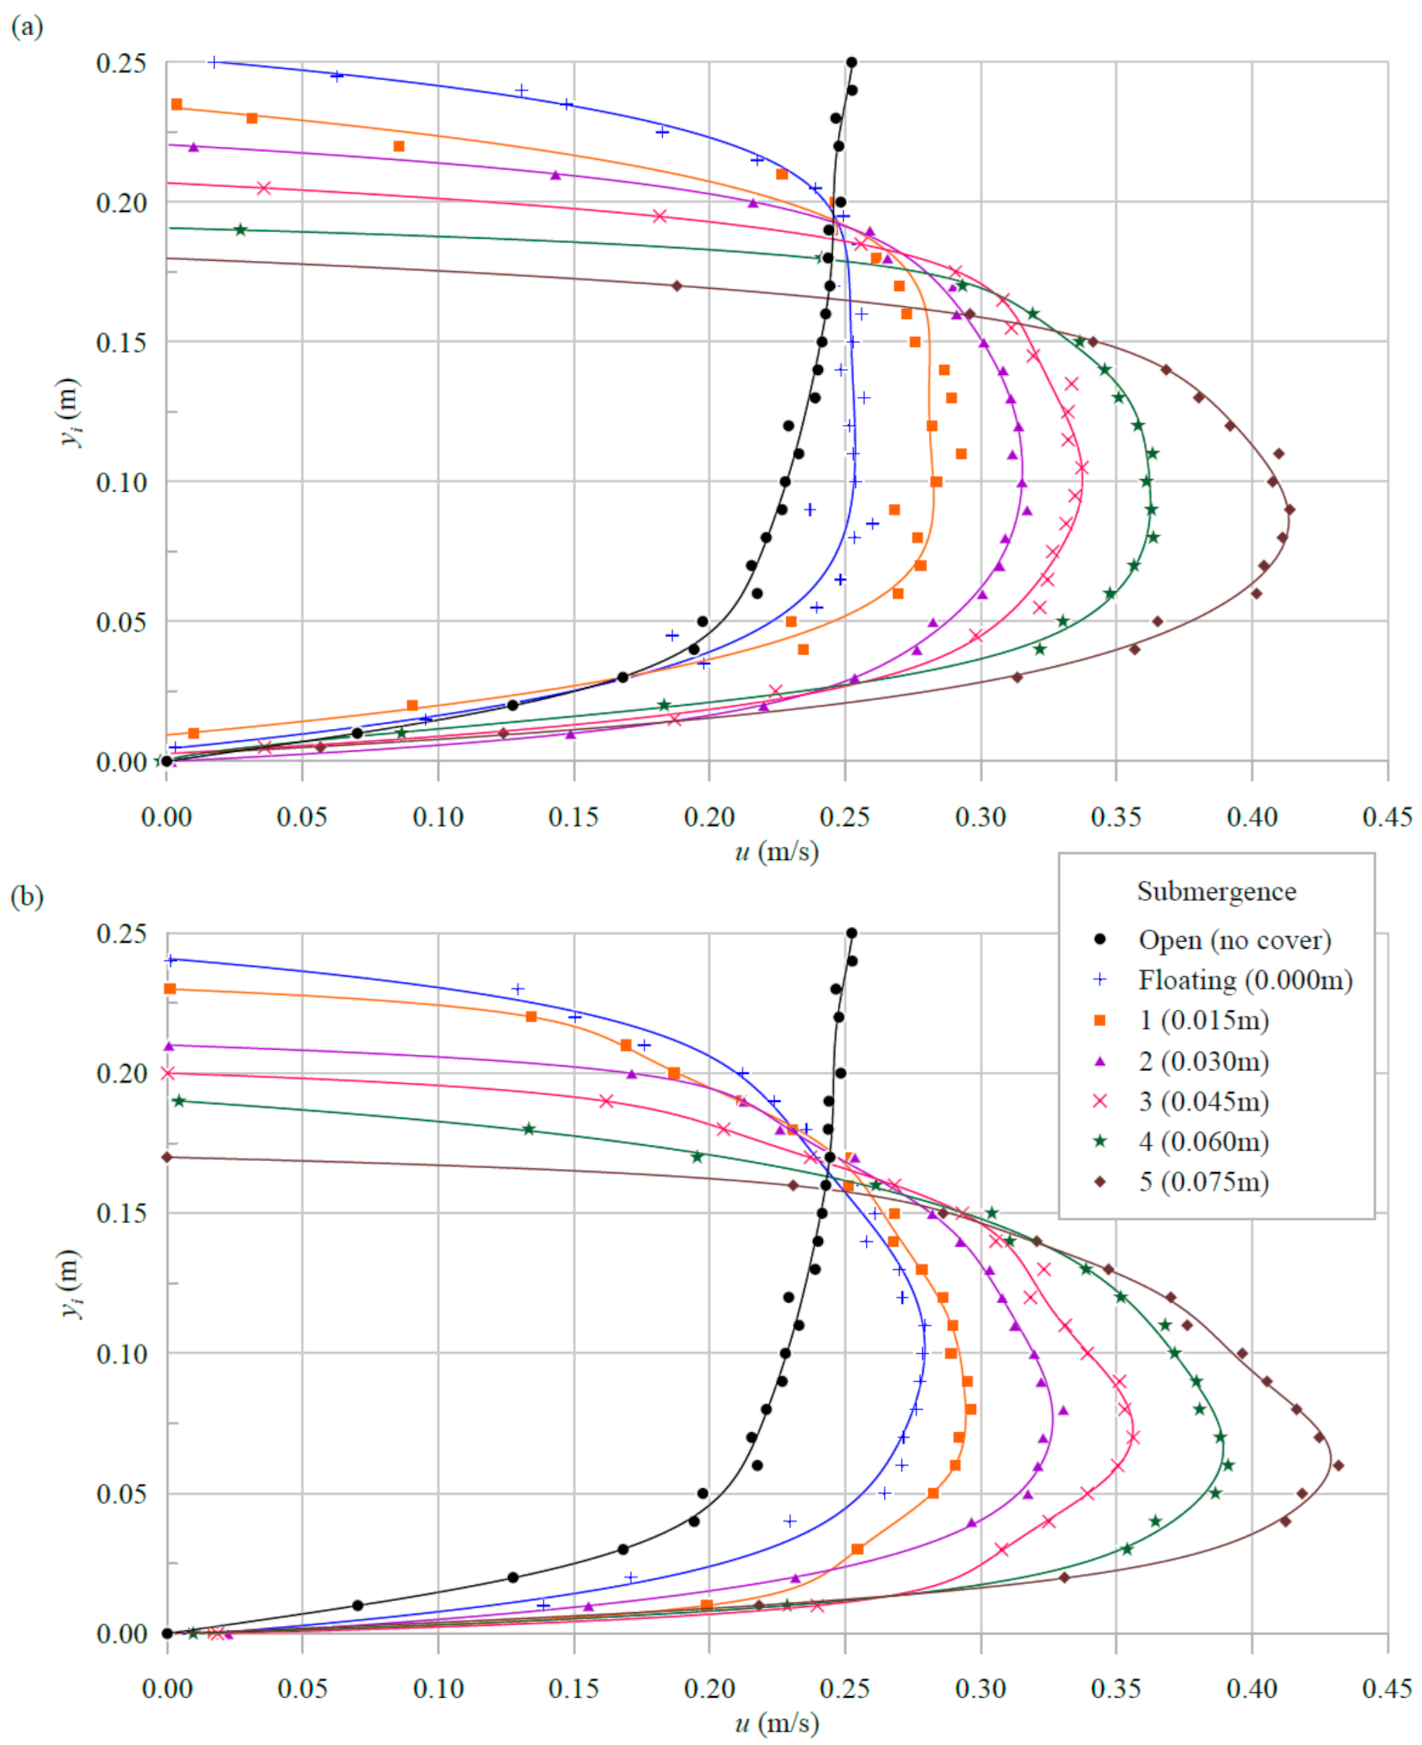
3.1. Velocity Data
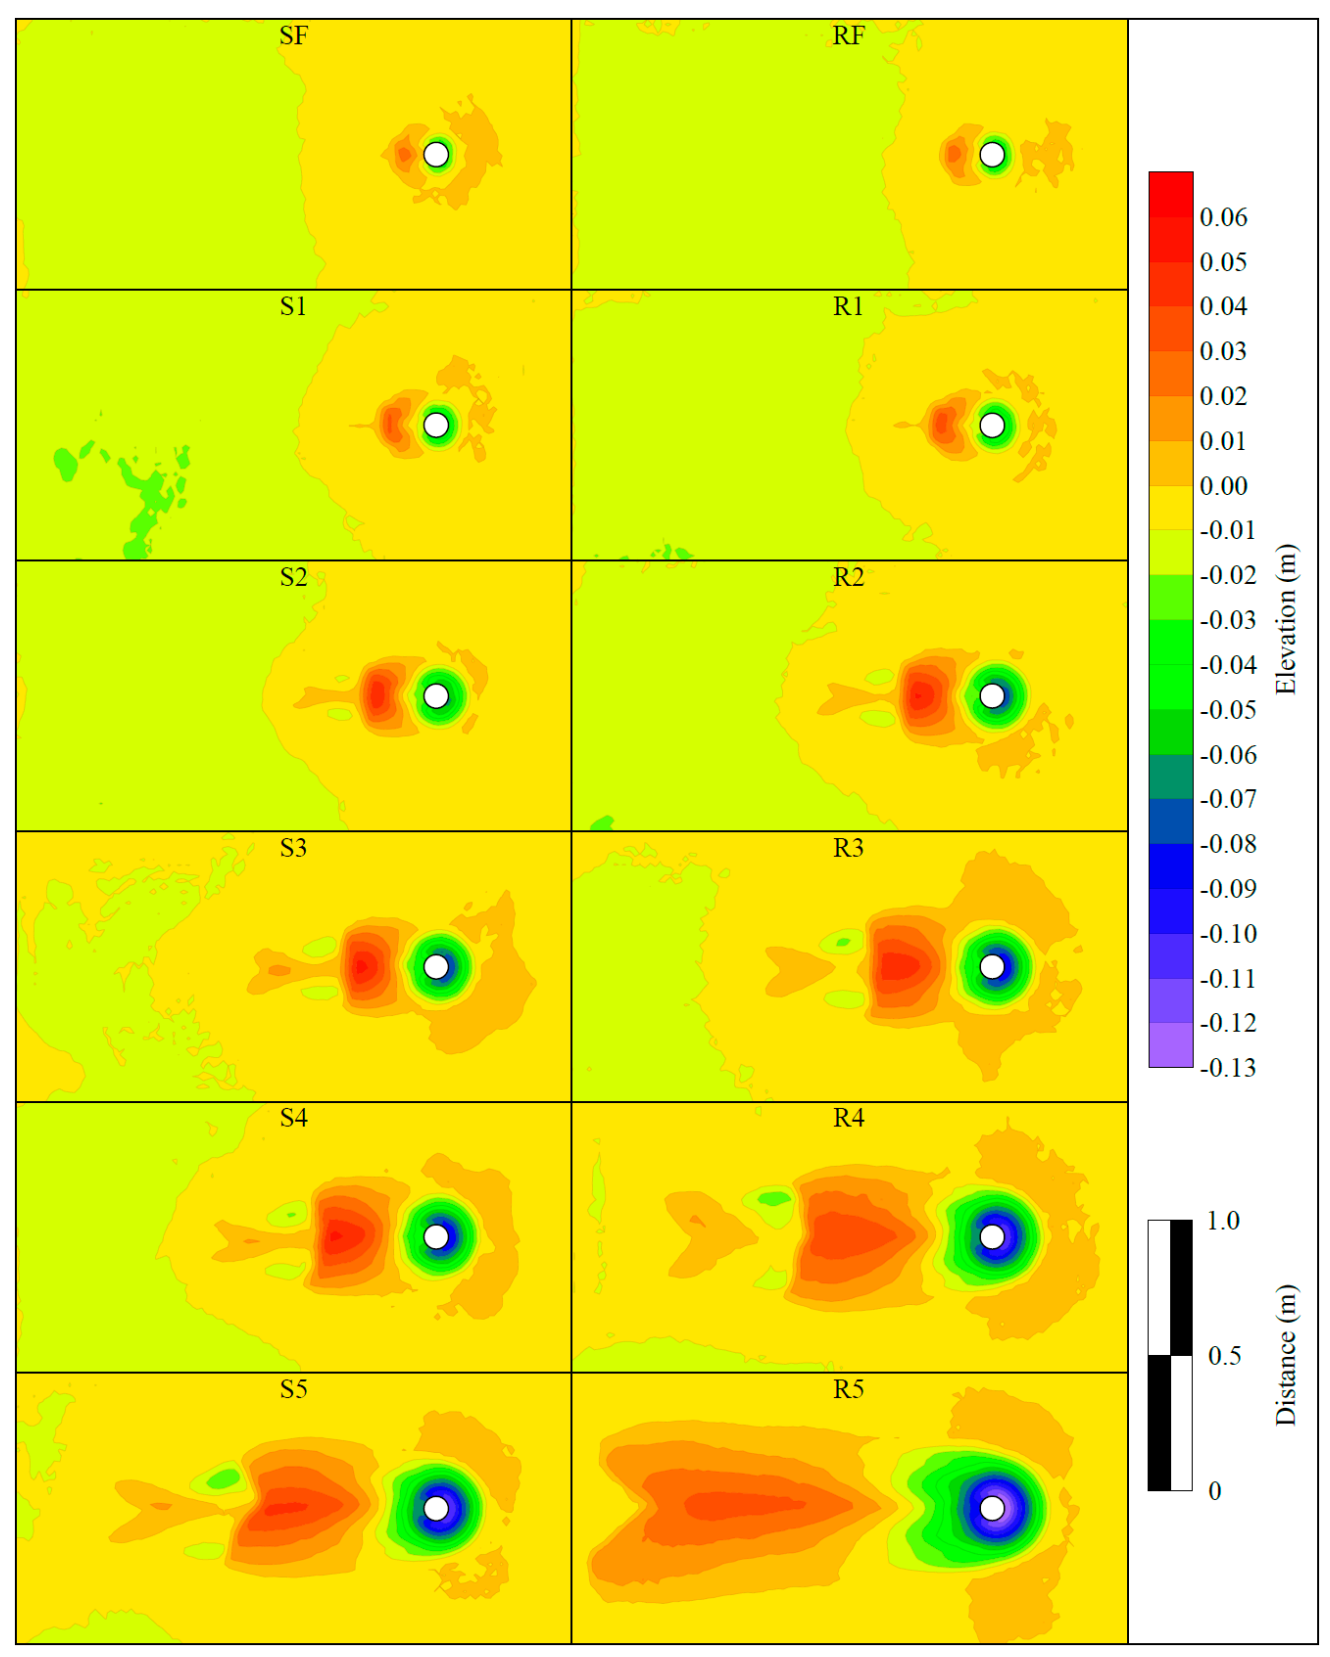
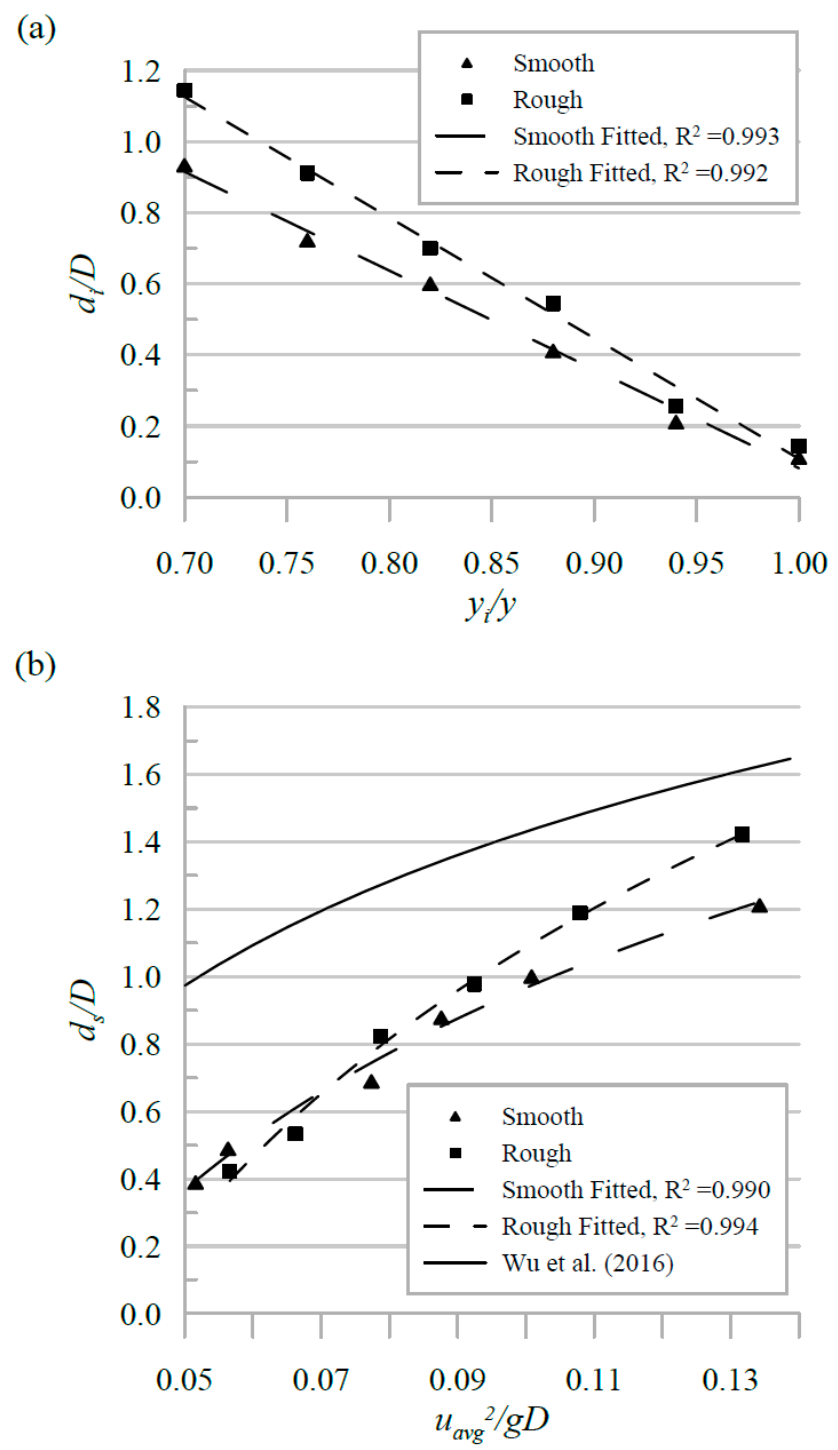
3.2. Scour Data
4. Discussion
5. Conclusions
Author Contributions
Funding
Institutional Review Board Statement
Informed Consent Statement
Data Availability Statement
Conflicts of Interest
References
- Chiew, Y.-M. Scour Protection at Bridge Piers. J. Hydraul. Eng. 1992, 118, 1260–1269. [Google Scholar] [CrossRef]
- Arneson, L.A.; Zevenbergen, L.W.; Lagasse, P.F.; Clopper, P.E. Evaluating Scour at Bridges, 5th ed.; U.S. Department of Transportation: Washington, DC, USA, 2012.
- Lagasse, P.F.; Clopper, P.E.; Zevenbergen, L.W.; Girard, L.G. Countermeasures to Protect Bridge Piers from Scour; Natl. Coop. Highw. Res. Progr. (NCHRP Rep. 593); Transportation Research Board: Washington, DC, USA, 2007. [Google Scholar]
- Dargahi, B. Controlling Mechanism of Local Scouring. J. Hydraul. Eng. 1990, 116, 1197–1214. [Google Scholar] [CrossRef]
- Ettema, R.; Constantinescu, G.; Melville, B.W. Flow-Field Complexity and Design Estimation of Pier-Scour Depth: Sixty Years Since Laursen and Toch. J. Hydraul. Eng. 2017, 143, 03117006. [Google Scholar] [CrossRef]
- Raudkivi, A.J. Functional Trends of Scour at Bridge Piers. J. Hydraul. Eng. 1986, 112, 1–13. [Google Scholar] [CrossRef]
- Stevens, M.A.; Gasser, M.M.; Saad, M.B.A.M. Wake Vortex Scour at Bridge Piers. J. Hydraul. Eng. 1991, 117, 891–904. [Google Scholar] [CrossRef]
- Dey, S.; Raikar, R.V.; Roy, A. Scour at Submerged Cylindrical Obstacles under Steady Flow. J. Hydraul. Eng. 2008, 134, 105–109. [Google Scholar] [CrossRef]
- Tafarojnoruz, A.; Lauria, A. Large Eddy Simulation of the Turbulent Flow Field around a Submerged Pile within a Scour Hole under Current Condition. Coast. Eng. J. 2020, 62, 489–503. [Google Scholar] [CrossRef]
- Zare, S.G.A.; Moore, S.A.; Rennie, C.D.; Seidou, O.; Ahmari, H.; Malenchak, J. Estimation of Composite Hydraulic Resistance in Ice-Covered Alluvial Streams. Water Resour. Res. 2016, 1306–1327. [Google Scholar] [CrossRef]
- Beltaos, S. River Ice Jams: Theory, Case Studies, and Applications. J. Hydraul. Eng. 1983, 109, 1338–1359. [Google Scholar] [CrossRef]
- Zabilansky, L.J.; Hains, D.B.; Remus, J.I. Increased Bed Erosion Due to Ice. In Proceedings of the 13th International Conference on Cold Regions Engineering, Orono, ME, USA, 23–26 July 2006; pp. 1–12. [Google Scholar] [CrossRef]
- Wu, P.; Balachandar, R.; Sui, J. Local Scour around Bridge Piers under Ice-Covered Conditions. J. Hydraul. Eng. 2016, 142, 04015038. [Google Scholar] [CrossRef]
- Beltaos, S. Hydraulic Roughness of Breakup Ice Jams. J. Hydraul. Eng. 2001, 127, 650–656. [Google Scholar] [CrossRef]
- Li, S.S. Estimates of the Manning’s Coefficient for Ice-Covered Rivers. Proc. Inst. Civ. Eng. Water Manag. 2012, 165, 495–505. [Google Scholar] [CrossRef]
- Wuebben, J.L. A Preliminary Study of Scour under an Ice Jam. In Proceedings of the 5th Workshop on Hydraulics of River Ice/Ice Jams, Winnipeg, MB, Canada, 21–24 June 1988; pp. 177–192. [Google Scholar]
- Zare, S.G.A.; Moore, S.A.; Rennie, C.D.; Seidou, O.; Ahmari, H.; Malenchak, J. Boundary Shear Stress in an Ice-Covered River during Breakup. J. Hydraul. Eng. 2016, 142, 04015065. [Google Scholar] [CrossRef]
- Ambtman, K.E.D.; Hicks, F.E. Field Estimates of Discharge Associated with Ice Jam Formation and Release Events. Can. Water Resour. J. 2012, 37, 47–56. [Google Scholar] [CrossRef]
- Zabilansky, L.J. Ice Cover Effects on Bed Scour: Case Studies. In Proceedings of the 11th International Conference on Cold Regions Engineering, Anchorage, AK, USA, 20–22 May 2002; pp. 795–803. [Google Scholar] [CrossRef]
- Ambtman, K.E.D.; Hicks, F.E.; Steffler, P.M. Experimental Investigation of the Pressure Distribution beneath a Floating Ice Block. J. Hydraul. Eng. 2011, 137, 399–411. [Google Scholar] [CrossRef]
- Ettema, R.; Constantinescu, G.; Melville, B.W. Evaluation of Bridge Scour Research: Pier Scour Processes and Predictions; Natl. Coop. Highw. Res. Progr. (NCHRP Proj. 24-27(01)); Transportation Research Board: Washington, DC, USA, 2011. [Google Scholar] [CrossRef]
- Ackermann, N.L.; Shen, H.T.; Olsson, P. Local Scour around Circular Piers under Ice Covers. In Ice in the Environment: Proceedings of the 16th IAHR International Symposium on Ice, Dunedin, New Zealand, 2–6 December 2002; Department of Physics, University of Otago: Dunedin, New Zealand, 2002; pp. 149–155. [Google Scholar]
- Hains, D.B.; Zabilansky, L.J. Laboratory Test of Scour under Ice: Data and Preliminary Results; ERDC/CRREL TR-04-9; US Army Corps Eng. Res. Dev. Center, Cold Reg. Res. Eng. Lab.: Hanover, NH, USA, 2004. [Google Scholar]
- Valela, C.; Nistor, I.; Rennie, C.D.; Lara, J.L.; Maza, M. Hybrid Modelling for Design of a Novel Bridge Pier Collar for Reducing Scour. J. Hydraul. Eng. 2020. [Google Scholar] [CrossRef]
- Sirianni, D.A.B.; Valela, C.; Rennie, C.D.; Nistor, I.; Almansour, H. Effects of Developing Ice Covers on Local Bridge Pier Scour. J. Hydraul. Res. 2020. [Google Scholar]
- Jamieson, E.C.; Post, G.; Rennie, C.D. Spatial Variability of Three-Dimensional Reynolds Stresses in a Developing Channel Bend. Earth Surf. Process. Landf. 2010, 35, 1029–1043. [Google Scholar] [CrossRef]
- Ettema, R.; Kirkil, G.; Muste, M. Similitude of Large-Scale Turbulence in Experiments on Local Scour at Cylinders. J. Hydraul. Eng. 2006, 132, 33–40. [Google Scholar] [CrossRef]


| Test | si (m) | yi (m) | Ice Cover Roughness | Water Temperature (°C) | Reynolds Number | Stream Froude Number | Pier Froude Number |
|---|---|---|---|---|---|---|---|
| Open | - | - | - | 20 | 41,237 | 0.163 | 0.055 |
| SF | 0.000 (Floating) | 0.250 | Smooth | 20 | 91,187 | 0.104 | 0.052 |
| S1 | 0.015 | 0.235 | Smooth | 20 | 90,329 | 0.112 | 0.056 |
| S2 | 0.030 | 0.220 | Smooth | 20 | 99,949 | 0.135 | 0.077 |
| S3 | 0.045 | 0.205 | Smooth | 20 | 99,960 | 0.148 | 0.088 |
| S4 | 0.060 | 0.190 | Smooth | 20 | 100,299 | 0.164 | 0.101 |
| S5 | 0.075 | 0.175 | Smooth | 20 | 107,527 | 0.196 | 0.134 |
| RF | 0.000 (Floating) | 0.250 | Rough | 20 | 95,501 | 0.109 | 0.057 |
| R1 | 0.015 | 0.235 | Rough | 20 | 97,901 | 0.121 | 0.066 |
| R2 | 0.030 | 0.220 | Rough | 20 | 100,791 | 0.136 | 0.079 |
| R3 | 0.045 | 0.205 | Rough | 20 | 102,657 | 0.152 | 0.092 |
| R4 | 0.060 | 0.190 | Rough | 20 | 103,761 | 0.170 | 0.108 |
| R5 | 0.075 | 0.175 | Rough | 20 | 106,497 | 0.195 | 0.132 |
| Test | ds (m) | Increase in ds (%) |
|---|---|---|
| Open | 0.025 | - |
| SF | 0.035 | 40 |
| S1 | 0.044 | 76 |
| S2 | 0.062 | 148 |
| S3 | 0.079 | 216 |
| S4 | 0.090 | 260 |
| S5 | 0.109 | 336 |
| RF | 0.038 | 52 |
| R1 | 0.048 | 92 |
| R2 | 0.074 | 196 |
| R3 | 0.088 | 252 |
| R4 | 0.107 | 328 |
| R5 | 0.128 | 412 |
Publisher’s Note: MDPI stays neutral with regard to jurisdictional claims in published maps and institutional affiliations. |
© 2021 by the authors. Licensee MDPI, Basel, Switzerland. This article is an open access article distributed under the terms and conditions of the Creative Commons Attribution (CC BY) license (http://creativecommons.org/licenses/by/4.0/).
Share and Cite
Valela, C.; Sirianni, D.A.B.; Nistor, I.; Rennie, C.D.; Almansour, H. Bridge Pier Scour under Ice Cover. Water 2021, 13, 536. https://doi.org/10.3390/w13040536
Valela C, Sirianni DAB, Nistor I, Rennie CD, Almansour H. Bridge Pier Scour under Ice Cover. Water. 2021; 13(4):536. https://doi.org/10.3390/w13040536
Chicago/Turabian StyleValela, Christopher, Dario A. B. Sirianni, Ioan Nistor, Colin D. Rennie, and Husham Almansour. 2021. "Bridge Pier Scour under Ice Cover" Water 13, no. 4: 536. https://doi.org/10.3390/w13040536
APA StyleValela, C., Sirianni, D. A. B., Nistor, I., Rennie, C. D., & Almansour, H. (2021). Bridge Pier Scour under Ice Cover. Water, 13(4), 536. https://doi.org/10.3390/w13040536