
Impact of Controlled Drainage and Subirrigation on Water Quality in the Red River Valley


Abstract
:1. Introduction
2. Materials and Methods
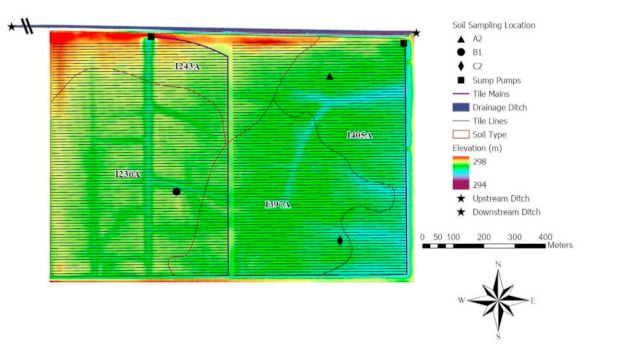
2.1. Experimental Site
2.2. Instrumentation
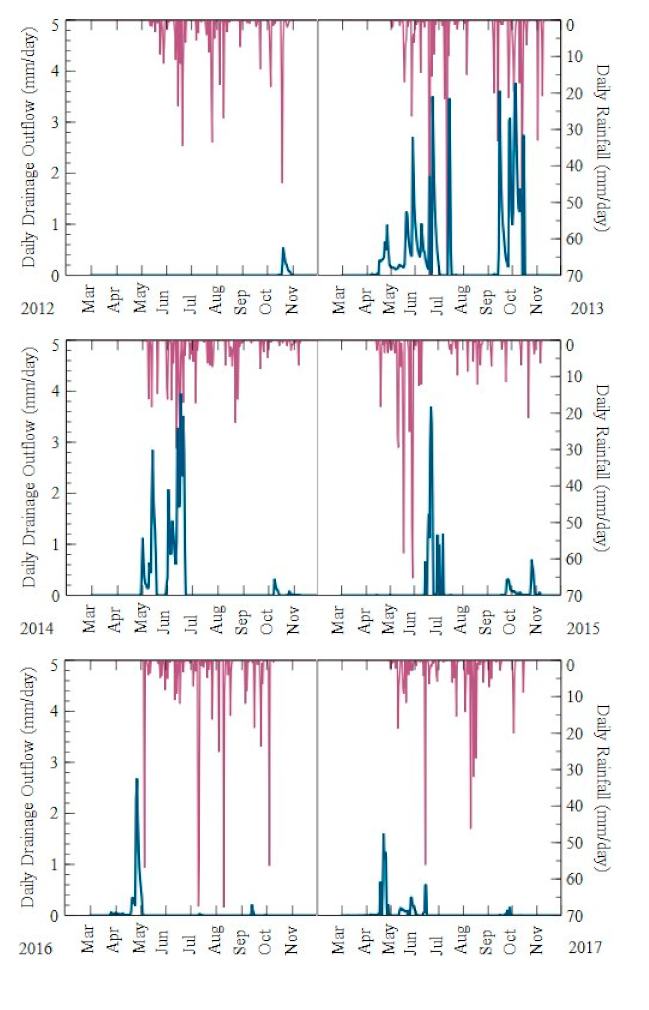
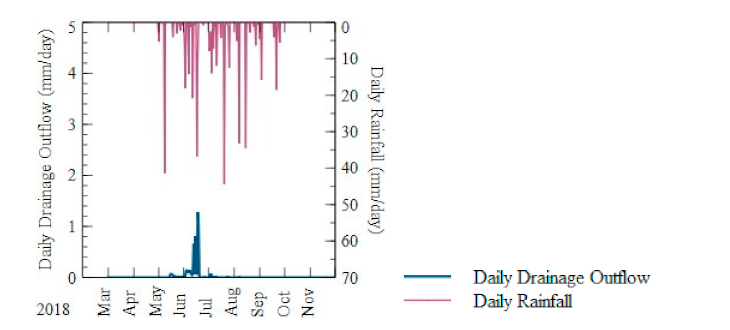
2.3. Precipitation
2.4. Water Sampling
2.5. Water Sample Chemical Analysis
2.6. Soil Sampling
2.7. Flow and Nutrient Load Calculations
2.8. Statistical Analysis
3. Results and Discussion
3.1. Precipitation and Drainage Outflow
3.2. Chemical Concentrations
3.3. Comparison between the Surface and Subsurface Water Samples
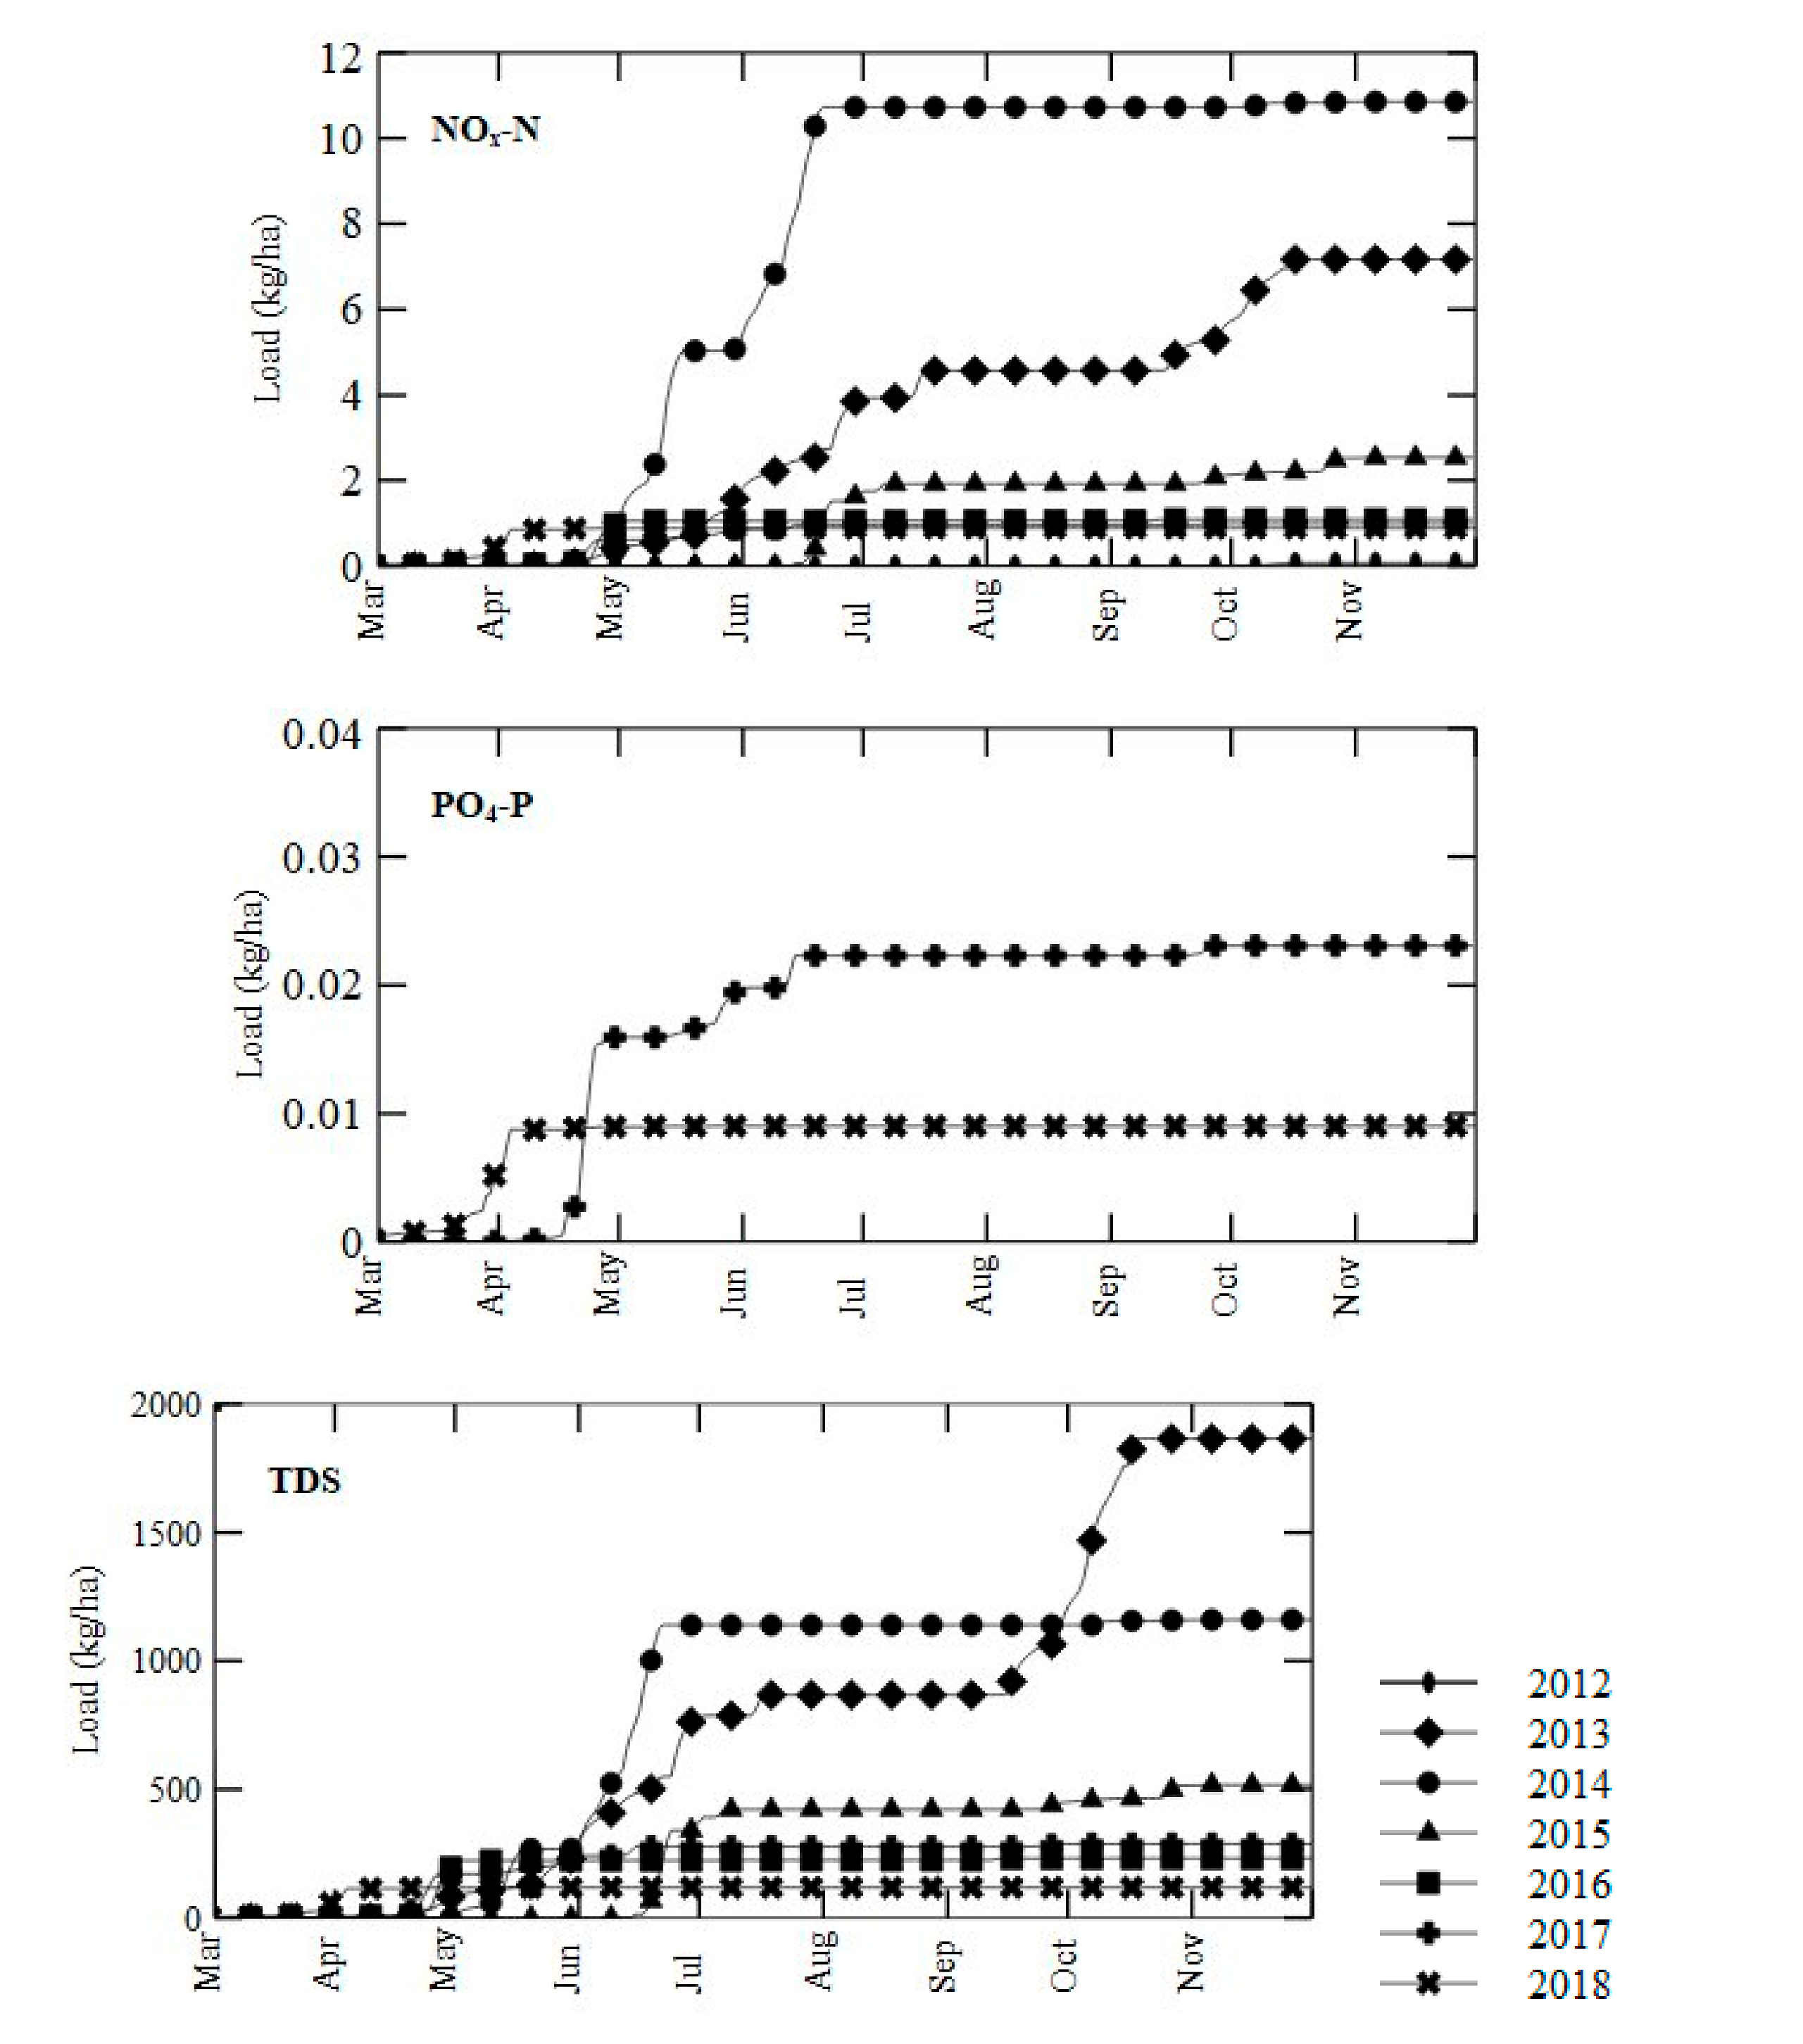
3.4. Chemical Loads
3.5. Soil Quality
4. Conclusions
Author Contributions
Funding
Institutional Review Board Statement
Informed Consent Statement
Acknowledgments
Conflicts of Interest
References
- Jaynes, D.B.; Colvin, T.S.; Karlen, D.L.; Cambardella, C.A.; Meek, D.W. Nitrate loss in subsurface drainage as affected by nitrogen fertilizer rate. J. Environ. Qual. 2001, 30, 1305–1314. [Google Scholar]
- Gentry, L.E.; David, M.B.; Royer, T.V.; Mitchell, C.A.; Starks, K.M. Phosphorus transport pathways to streams in tile-drained agricultural watersheds. J. Environ. Qual. 2007, 36, 408–415. [Google Scholar]
- Finocchiaro, R.G. Agricultural Subsurface Drainage Tile Locations by Permits in North Dakota [Data Set]; U.S. Geological Survey: Jamestown, ND, USA,, 2014.
- Kandel, H.J.; Brodshaug, J.A.; Steele, D.D.; Ransom, J.K.; DeSutter, T.M.; Sands, G.R. Subsurface drainage effects on soil penetration resistance and water table depth on a clay soil in the Red River of the North Valley, USA. Agric. Eng. Int. CIGR J. 2013, 15, 1–10. [Google Scholar]
- ASABE Standards. S526.4: Soil and Water Terminology; ASABE: St. Joseph, MI, USA, 2015. [Google Scholar]
- ASAE Standards. EP479.1: Operation of Controlled Drainage Systems in Humid Regions; ASABE: St. Joseph, MI, USA, 2013. [Google Scholar]
- Madramootoo, C.A.; Dodds, G.T.; Papadopoulos, A. Agronomic and environmental benefits of water-table management. J. Irrig. Drain. Eng. 1993, 119, 1052–1065. [Google Scholar]
- Niaghi, A.R.; Jia, X.; Steele, D.D.; Scherer, T.F. Drainage water management effects on energy flux partitioning, evapotranspiration, and crop coefficients of corn. Agric. Water Manag. 2019, 225, 105760. [Google Scholar]
- Wesström, I.; Messing, I.; Linner, H.; Lindström, J. Controlled drainage—Effects on drain outflow and water quality. Agric. Water Manag. 2001, 47, 85–100. [Google Scholar]
- Drury, C.F.; Tan, C.S.; Gaynor, J.D.; Oloya, T.O.; Welacky, T.W. Influence of controlled drainage-subirrigation on surface and tile drainage nitrate loss. J. Environ. Qual. 1996, 25, 317–324. [Google Scholar]
- Feser, S.E.; Strock, J.S.; Sands, G.R.; Birr, A.S. Controlled drainage to improve edge of-field water quality in southwest Minnesota, USA. In Proceedings of the Drainage IX: Ninth International Drainage Symposium, Quebec City, QC, Canada, 13–16 June 2010. [Google Scholar]
- Choudhary, O.P.; Ghuman, B.S.; Josan, A.S.; Bajwa, M.S. Effect of alternating irrigation with sodic and non-sodic waters on soil properties and sunflower yield. Agric. Water Manag. 2006, 85, 151–156. [Google Scholar]
- Jalali, M.; Ranjbar, F. Effects of sodic water on soil sodicity and nutrient leaching in poultry and sheep manure amended soils. Geoderma. Reg. 2009, 153, 194–204. [Google Scholar]
- Bauder, J.W. Rainfall Induced Dispersion and Hydraulic Conductivity Reduction under Low SAR × EC Combinations in Smectite-Dominated Soils of Eastern Montana. Report to Montana Department of Environmental Quality (DEQ Contract# 207066). 2009; 62p. Available online: http://deq.mt.gov/Portals/112/Energy/CoalbedMethane/Documents/MuggliFinalReportwithoutline.pdf (accessed on 18 October 2010).
- Ayers, R.S.; Westcot, D.W. Water Quality for Agriculture. FAO Irrigation and Drainage Paper Vol 29 Rev. 1; Food and Agriculture Organization of the United Nations: Rome, Italy, 1994. [Google Scholar]
- Jia, X.; DeSutter, T.M.; Lin, Z.; Schuh, W.M.; Steele, D.D. Subsurface drainage and subirrigation effects on water quality in southeast North Dakota. Trans. ASABE 2012, 55, 1757–1769. [Google Scholar]
- Rijal, I.; Jia, X.; Zhang, X.; Steele, D.D.; Scherer, T.F.; Akyuz, A. Effects of subsurface drainage on evapotranspiration for corn and soybean crops in southeastern North Dakota. J. Irrig. Drain. Eng. 2012, 138, 1060–1067. [Google Scholar]
- NRCS. Web Soil Survey. 2020. Available online: http://websoilsurvey.nrcs.usda.gov/app/WebSoilSurvey.aspx/ (accessed on 22 December 2020).
- IUSS Working Group WRB. World Reference Base for Soil Resources 2014, Update 2015 International Soil Classification System for Naming Soils and Creating Legends for Soil Maps; World Soil Resources Reports No. 106; FAO: Roma, Italy, 2015; 192p. [Google Scholar]
- NDAWN. North Dakota Agriculture Weather Network. Available online: https://ndawn.ndsu.nodak.edu/ (accessed on 21 December 2020).
- Jia, X.; Scherer, T.F. Reducing cost of water quality monitoring in tile drainage outflow using electrical conductivity as a surrogate. In Using 21st Century Technology to Better Manage Irrigation Water Supplies, Proceedings of the Seventh International Conference on Irrigation and Drainage, Phoenix, AZ USA, 16–19 April 2013; Wallin, B.T., Anderson, S.S., Wallin, B.T., Anderson, S.S., Eds.; U.S. Committee on Irrigation and Drainage: Denver, CO, USA, 2013; pp. 213–225. [Google Scholar]
- NDDEQ. Standard Operating Procedures for the Collection and Preservation of Stream and River Grab Samples for Chemical and Biological Analysis. Section 7.08. Revision 2; 2011. Available online: https://deq.nd.gov/publications/WQ/3_WM/SOPs/7.08_StreamOrRiverGrabSampleSOP.pdf (accessed on 22 December 2020).
- Pang, X. Impact of Subsurface Drainage on Water Availability in the Red River Basin. Master’s Thesis, Department of Agricultural and Biosystems Engineering North Dakota State University, Fargo, ND, USA, 2011. [Google Scholar]
- Jia, X.; Scherer, T.F.; Steele, D.D.; DeSutter, T.M. Subirrigation system performance and evaluation in the Red River Valley of the North. Appl. Eng. Agric. 2017, 33, 811–818. [Google Scholar]
- Quarnstrom, J.; (NDDEQ, Bismarck, ND, USA). Personal communication, 2020.
- Mathews, S.; (NDSU Soil Testing Lab, Fargo, ND, USA). Personal communication, 2020.
- DeSutter, T.; Franzen, D.; He, Y.; Wick, A.; Lee, J.; Deutsch, B.; Clay, D. Relating sodium percentage to sodium adsorption ratio and its utility in the northern Great Plains. Soil Sci. Soc. Am. J. 2015, 79, 1261–1264. [Google Scholar]
- Scherer, T.F.; Jia, X. A simple method to measure the flow rate and volume from tile drainage pump stations. Appl. Eng. Agric. 2010, 26, 79–83. [Google Scholar]
- Helmers, M.; Christianson, R.; Brenneman, G.; Lockett, D.; Pederson, C. Water table, drainage, and yield response to drainage water management in southeast Iowa. J. Soil Water Conserv. 2012, 67, 495–501. [Google Scholar]
- Carstensen, M.V.; Børgesen, C.D.; Ovesen, N.B.; Poulsen, J.R.; Hvid, S.K.; Kronvang, B. Controlled drainage as a targeted mitigation measure for nitrogen and phosphorus. J. Environ. Qual. 2019, 48, 677–685. [Google Scholar]
- Vidon, P.; Cuadra, P.E. Phosphorus dynamics in tile-drain flow during storms in the US Midwest. Agric. Water Manag. 2011, 98, 532–540. [Google Scholar]
- Skaggs, R.W.; Fausey, N.R.; Evans, R.O. Drainage water management. J. Soil Water Conserv. 2012, 67, 167A–172A. [Google Scholar]
- Wesström, I.; Messing, I. Effects of controlled drainage on N and P losses and N dynamics in a loamy sand with spring crops. Agric. Water Manag. 2007, 87, 229–240. [Google Scholar]
- North Dakota Century Code. Chapter 33.1-16-02.1 Standards of Quality for Waters of the State. Available online: https://www.legis.nd.gov/information/acdata/pdf/33.1-16-02.1.pdf (accessed on 21 December 2020).
- Keller, L.P.; McCarthy, G.J.; Richardson, J.L. Mineralogy and stability of soil evaporites in North Dakota. Soil Sci. Soc. Am. J. 1986, 50, 1069–1071. [Google Scholar]
- USEPA. Drinking Water Advisory: Consumer Acceptability Advice and Health Effects Analysis on Sulfate. EPA-822-R-03-007; Environmental Protection Agency: Washington, DC, USA, 2003.
- Turner, R.E.; Rabalais, N.N. Linking landscape and water quality in the Mississippi River Basin for 200 years. Bioscience 2003, 53, 563. [Google Scholar]
- Sibanda, T.; Chigor, V.N.; Koba, S.; Obi, C.L.; Okoh, A.I. Characterisation of the physicochemical qualities of a typical rural-based river: Ecological and public health implications. Int. J. Environ. Sci. Technol. 2014, 11, 1771–1780. [Google Scholar]
- Bjorneberg, D.L.; Kanwar, R.S.; Melvin, S.W. Seasonal changes in flow and nitrate-N loss from subsurface drains. Trans. ASAE 1996, 39, 961–967. [Google Scholar]
- Cordeiro, M.R.; Ranjan, R.S.; Ferguson, I.J.; Cicek, N. Nitrate, phosphorus, and salt export through subsurface drainage from corn fields in the Canadian Prairies. Trans. ASABE 2014, 57, 43–50. [Google Scholar]
- Sumner, M. Sodic soils—New perspectives. Soil Res. 1993, 31, 683. [Google Scholar]
- Rengasamy, P. Soil processes affecting crop production in salt-affected soils. Funct. Plant Biol. 2010, 37, 613–620. [Google Scholar]
- Franzen, D.W.; Nanna, T.; Norvell, W.A. A survey of soil attributes in North Dakota by landscape position. Agron. J. 2006, 98, 1015–1022. [Google Scholar]
- Magdoff, F.R.; Bartlett, R.J. Soil pH buffering revisited. Soil Sci. Soc. Am. J. 1985, 49, 145–148. [Google Scholar]
- Richards, L.A. Diagnosis and Improvement of Saline and Alkali Soils; Agriculture Handbook; USDA: Washington, DC, USA, 1954; Volume 60.

| Year | Total Precipitation (mm) | Snow Water Equivalent (mm) | Rainfall (mm) | Subirrigation (mm) | Drainage Outflow (mm) |
|---|---|---|---|---|---|
| 2012 | 483 | 65 | 418 | 234 | 2 |
| 2013 | 747 | 199 | 548 | 173 | 107 |
| 2014 | 479 | 94 | 385 | 140 | 56 |
| 2015 | 574 | 66 | 508 | 186 | 25 |
| 2016 | 614 | 57 | 557 | 154 | 13 |
| 2017 | 526 | 117 | 409 | 87 | 12 |
| 2018 | 543 | 121 | 421 | 0 | 6 |
| Parameter | FD-Spring (ab) n = 33 | CD-Spring (a) n = 4 | SI (b) n = 22 | CD-Fall (ab) n = 17 | FD-Fall (ab) n = 18 | Standard Values |
|---|---|---|---|---|---|---|
| Percent sodium (%) | 21.6 ± 4.9 | 22.6 ± 1.0 | 63.6 ± 1.3 | 47.0 ± 18.1 | 25.8 ± 3.9 | 50 |
| SAR | 2.4 ± 0.6 | 2.6 ± 0.2 | 5.0 ± 0.2 | 3.8 ± 1.1 | 2.7 ± 0.3 | - |
| TDS (mg/L) | 2190 ± 844 | 2310 ± 110 | 668 ± 6 | 1130 ± 670 | 1980 ± 400 | - |
| EC (dS/m) | 3.5 ± 1.4 | 3.7 ± 1.7 | 1.1 ± 0.0 | 1.8 ± 1.1 | 3.2 ± 0.6 | - |
| Sodium (mg/L) | 251 ± 119 | 273 ± 27 | 164 ± 7 | 182 ± 36 | 244 ± 40 | - |
| Potassium (mg/L) | 10.0 ± 5.6 | 7.8 ± 1.6 | 3.2 ± 0.4 | 4.4 ± 2.0 | 5.7 ± 1.5 | - |
| Calcium (mg/L) | 363 ± 120 | 383 ± 22 | 43 ± 2 | 151 ± 152 | 331 ± 59 | - |
| Magnesium (mg/L) | 274 ± 195 | 259 ± 20 | 23 ± 2 | 84 ± 97 | 184 ± 83 | - |
| Chloride (mg/L) | 59 ± 52 | 38 ± 3 | 38 ± 1 | 38 ± 4 | 39 ± 5 | 250 |
| Sulfate (mg/L) | 1971 ± 1077 | 2048 ± 154 | 162 ± 14 | 678 ± 783 | 1643 ± 531 | 250 |
| NOx-N (mg/L) | 17.7 ± 19.3 | 8.5 ± 1.2 | 0.2 ± 0.5 | 2.9 ± 2.9 | 8.2 ± 3.7 | 10 |
| PO4-P (mg/L) | 0.12 ± 0.11 | 0.22 ± 0.04 | 0.58 ± 0.11 | 0.34 ± 0.14 | 0.20 ± 0.04 | 0.1 |
| Parameter | FD-Spring (ab) n = 29 | CD-Spring (a) n = 4 | SI (a) n = 20 | CD-Fall (ab) n = 12 | FD-Fall (a) n = 24 |
|---|---|---|---|---|---|
| Percent sodium (%) | 20.6 ± 3.9 | 23.9 ± 3.7 | 23.0 ± 4.3 | 20.4 ± 4.3 | 22.2 ± 4.1 |
| SAR | 2.0 ± 0.8 | 2.6 ± 1.3 | 2.5 ± 1.1 | 2.0 ± 1.0 | 2.4 ± 1.1 |
| TDS (mg/L) | 1596 ± 618 | 1950 ± 866 | 1964 ± 896 | 1612 ± 797 | 1990 ± 880 |
| EC (dS/m) | 2.6 ± 1.0 | 3.1 ± 1.4 | 3.2 ± 1.4 | 2.6 ± 1.3 | 3.2 ± 1.4 |
| Sodium (mg/L) | 180 ± 111 | 260 ± 199 | 248 ± 160 | 181 ± 136 | 247 ± 174 |
| Potassium (mg/L) | 8.5 ± 1.1 | 10 ± 1 | 10 ± 3 | 10 ± 3 | 10 ± 3 |
| Calcium (mg/L) | 176 ± 43 | 193 ± 38 | 189 ± 55 | 172 ± 63 | 185 ± 52 |
| Magnesium (mg/L) | 227 ± 118 | 282 ± 187 | 281 ± 155 | 226 ± 135 | 307 ± 183 |
| Chloride (mg/L) | 32.6 ± 9.1 | 28.6 ± 4.0 | 31.8 ± 9.0 | 22.6 ± 5.9 | 27.2 ± 11.2 |
| Sulfate (mg/L) | 1362 ± 696 | 1793 ± 1087 | 1856 ± 1091 | 1413 ± 917 | 1878 ± 1055 |
| NOx-N (mg/L) | 3.80 ± 3.85 | 2.44 ± 3.22 | 2.03 ± 2.85 | 2.54 ± 3.95 | 1.36 ± 1.93 |
| PO4-P (mg/L) | 0.088 ± 0.152 | 0.055 ± 0.021 | 0.13 ± 0.07 | 0.12 ± 0.05 | 0.079 ± 0.032 |
| Parameter | FD-Spring (ab) n = 27 | CD-Spring (a) n = 4 | SI (a) n = 19 | CD-Fall (ab) n = 14 | FD-Fall (a) n = 23 |
|---|---|---|---|---|---|
| Percent sodium (%) | 20.4 ± 3.3 | 22.4 ± 3.8 | 21.5 ± 4.2 | 20.3 ± 4.2 | 24.3 ± 3.3 |
| SAR | 2.1 ± 0.8 | 2.4 ± 1.2 | 2.4 ± 1.0 | 2.0 ± 0.8 | 2.7 ± 0.8 |
| TDS (mg/L) | 1730 ± 645 | 1953 ± 820 | 2087 ± 929 | 1754 ± 748 | 2066 ± 765 |
| EC (dS/m) | 2.8 ± 1.0 | 3.1 ± 1.3 | 3.4 ± 1.5 | 2.8 ± 1.2 | 3.3 ± 1.2 |
| Sodium (mg/L) | 195 ± 113 | 244 ± 183 | 249 ± 152 | 193 ± 114 | 263 ± 136 |
| Potassium (mg/L) | 8.5 ± 1.4 | 11 ± 2 | 11 ± 3 | 9.9 ± 3.4 | 8.4 ± 2.5 |
| Calcium (mg/L) | 197 ± 51 | 210 ± 50 | 229 ± 93 | 204 ± 78 | 239 ± 57 |
| Magnesium (mg/L) | 253 ± 132 | 282 ± 179 | 306 ± 168 | 244 ± 126 | 276 ± 176 |
| Chloride (mg/L) | 31.3 ± 9.6 | 31.1 ± 4.9 | 34.6 ± 11.1 | 26.8 ± 11.1 | 32.9 ± 6.4 |
| Sulfate (mg/L) | 1531 ± 753 | 1830 ± 1055 | 2014 ± 1129 | 1561 ± 855 | 1881 ± 919 |
| NOx-N (mg/L) | 5.11 ± 4.27 | 0.507 ± 0.748 | 0.908 ± 2.093 | 1.87 ± 2.67 | 2.85 ± 1.89 |
| PO4-P (mg/L) | 0.082 ± 0.053 | 0.035 ± 0.007 | 0.095 ± 0.078 | 0.12 ± 0.09 | 0.12 ± 0.07 |
| Distance above Tile (cm) | pH | EC (dS/m) | SAR | ||||||
|---|---|---|---|---|---|---|---|---|---|
| 2014 | 2015 | 2017 | 2014 | 2015 | 2017 | 2014 | 2015 | 2017 | |
| 0 (n = 3) | 8.23 ± 0.06 | 8.13 ± 0.06 | 8.07 ± 0.12 | 0.97 ± 0.12 | 0.81 ± 0.10 | 0.97 ± 0.12 | 1.04 ± 1.04 | 3.67 ± 2.48 | 3.54 ± 0.87 |
| 20 (n = 9) | 8.36 ± 0.22 | 8.19 ± 0.18 | 8.08 ± 0.14 | 1.04 ± 0.63 | 0.77 ± 0.13 | 0.88 ± 0.22 | 1.10 ± 0.98 | 3.96 ± 1.98 | 3.58 ± 1.10 |
| 41 (n = 9) | 8.28 ± 0.22 | 8.12 ± 0.23 | 7.99 ± 0.20 | 1.15 ± 0.71 | 0.83 ± 0.19 | 0.88 ± 0.22 | 1.54 ± 0.32 | 3.26 ± 1.83 | 4.04 ± 2.52 |
| 81 (n = 9) | 8.16 ± 0.23 | 7.82 ± 0.21 | 7.87 ± 0.27 | 1.40 ± 0.71 | 1.10 ± 0.39 | 1.08 ± 0.57 | 1.59 ± 2.42 | 1.62 ± 0.82 | 1.95 ± 0.94 |
Publisher’s Note: MDPI stays neutral with regard to jurisdictional claims in published maps and institutional affiliations. |
© 2021 by the authors. Licensee MDPI, Basel, Switzerland. This article is an open access article distributed under the terms and conditions of the Creative Commons Attribution (CC BY) license (http://creativecommons.org/licenses/by/4.0/).
Share and Cite
Almen, K.; Jia, X.; DeSutter, T.; Scherer, T.; Lin, M. Impact of Controlled Drainage and Subirrigation on Water Quality in the Red River Valley. Water 2021, 13, 308. https://doi.org/10.3390/w13030308
Almen K, Jia X, DeSutter T, Scherer T, Lin M. Impact of Controlled Drainage and Subirrigation on Water Quality in the Red River Valley. Water. 2021; 13(3):308. https://doi.org/10.3390/w13030308
Chicago/Turabian StyleAlmen, Kristen, Xinhua Jia, Thomas DeSutter, Thomas Scherer, and Minglian Lin. 2021. "Impact of Controlled Drainage and Subirrigation on Water Quality in the Red River Valley" Water 13, no. 3: 308. https://doi.org/10.3390/w13030308
APA StyleAlmen, K., Jia, X., DeSutter, T., Scherer, T., & Lin, M. (2021). Impact of Controlled Drainage and Subirrigation on Water Quality in the Red River Valley. Water, 13(3), 308. https://doi.org/10.3390/w13030308