Article

Importance of Infiltration Rates for Fate and Transport of Benzene in High-Tiered Risk-Based Assessment Considering Korean Site-Specific Factors at Contaminated Sites

1
Department of Hydro Science and Engineering Research, Korea Institute of Civil Engineering and Building Technology, Goyang 10223, Korea
2
Department of Civil and Environmental Engineering, Hanbat National University, Daejeon 34158, Korea
3
Groundwater Research Center, Geologic Environment Division, Korea Institute of Geoscience and Mineral Resources (KIGAM), Daejeon 34132, Korea
4
Department of Mineral and Groundwater Resources, Korea University of Science and Technology, Daejeon 34113, Korea
*
Authors to whom correspondence should be addressed.
Water 2021, 13(24), 3646; https://doi.org/10.3390/w13243646
Submission received: 8 October 2021 / Revised: 13 December 2021 / Accepted: 15 December 2021 / Published: 18 December 2021
(This article belongs to the Special Issue Remediation of NAPL-Contaminated Groundwater Aquifers)

Abstract

:
Widely used conservative approaches for risk-based assessments of the subsurface transport processes have been calculated using simple analytical equations or general default values. Higher-tier risk assessment of contaminated sites requires the numerical models or additional site-specific values for input parameters. Previous studies have focused on the development of sophisticated models fit into risk-based frameworks. Our study mainly aims to explore the applicability of site-specific parameters and to modify the risk-based fate and transport model according to the types of the site-specific parameters. To apply the modified fate and transport equation and the site-specific default infiltration range, this study assessed the source depletion, leachate concentrations, and exposure concentration of benzene, which is a representative organic contaminant. The numerical models consist of two continuous processes, the fate and transport of contaminants from (1) the soil to the groundwater table in the vadose zone and subsequently (2) from the groundwater table to exposure wells in the saturated zone. Spatially varied Korean domestic recharge data were successfully incorporated into site-specific infiltration parameters in the models. The numerical simulation results were expressed as transient time series of concentrations over time. Results presented the narrow range of predicted concentrations at the groundwater table when site-specific infiltration was applied, and the dilution–attenuation factors for the unsaturated zone (DAFunsat) were derived based on the prediction. When a contaminant travels to the longest path length of 10 m with a source depth of 1 m in the vadoze zone, the simulated DAFunsat ranged from 3 to 4. The highest DAFunsat simulation results are close to 1 when contaminants travel to a source depth of 5 m and the shortest path length of 1 m. In the saturated aquifer below the contaminated sites, the variation in exposure concentration with time at monitoring wells is detected differently depending on the depth of the saturated zone.

1. Introduction

The Soil Screening Guidance for risk-based soil screening levels (SSLs) of the United States Environmental Protection Agency (USEPA) provides a framework for screening contaminated soils [1]. For instance, the EPA selected a default dilution and attenuation factor (DAF), which is defined as the ratio of the source zone concentration to the receptor point concentration, of 20 for U.S. alluvial aquifers based on the EPACMTP model [2]. The standard DAF value of 20 can be used to assess risk at contaminated sites when site-specific pathways through the subsurface cannot be identified. Risk-based corrective action (RBCA) has been developed as specific guidelines by the American Society for Testing and Materials (ASTM) for the remediation of contaminated sites within a systematic framework for risk assessment [3]. The RBCA selection guidance states that fate and transport modeling can be used in the RBCA processes to predict and quantify migrations of chemicals (or constituents) in the environment. The guidelines recommend a tiered approach toward establishing cleanup and management measures based on site-specific characteristics [3].
Based on RBCA selection guidance for tiered approaches, the fate and transport processes consist of advection, dispersion, degradation, and partitioning between solid and fluid as a result of sorption/solubility/chemical reactions, biodegradation, and phase separation of immiscible liquids [3]. In general, numerical models are limited to Tier 3 analyses, which is the highest tier among tiered approaches. Lower-tier models consider steady-state infiltration without biodegradation processes. The conservative approach to calculating the exposure concentration assumes that dissolved contaminants move from the soil to the groundwater-saturated zone without dilution or reduction during transport [2]. Higher-tier analysis may require the use of more sophisticated analytical models to describe the fate and transport or the use of rather simplified models with additional site-specific values for input parameters [3]. These data include the characteristics and monitoring data of each contaminated site, conservative forecasts of potential pollution levels, and pollutant movement after treatment and reasonable maximum exposure scenarios.
To evaluate the behaviors of contaminants in such an environment, contaminant transport has been experimentally investigated [4,5], and sophisticated analytical or numerical studies were conducted using vadose zone modeling software such as Pearl [6], Hydrus [6], and VLEACH [7]. In addition, precise analytical solutions, such as those proposed by the Korea Environmental Institute (KEI), use the two-dimensional subsurface flow, fate, and transport of microbes and chemicals (2DFATMIC) model based on Lagrangian–Eulerian adaptive zooming and peak capturing algorithm for numerical simulation [8]. Jang and Aral [9] simulated density-driven flow to describe the vertical flow of trichloroethylene (TCE), which is a representative contaminant of dense non-aqueous phase liquids (DNAPLs). Site-specific parameters including geological and hydrological factors can be considered to affect fate and transport from soil to groundwater. Several site-specific factors can be used for the estimation of risk [10], such as the heterogeneity of the soil structure [11], interference of perched water with vertical flow [12], non-equilibrium transport and preferential flow [13], the existence of a non-aqueous phase liquid (NAPL) source [14,15,16,17,18], water table fluctuation (WTF) [19,20,21], and capillary fringe [22,23].
The numerical modeling of pathways for contaminants in the subsurface in risk assessment frameworks has been attempted in recent studies [24,25,26,27]. An appropriate mathematical model must be selected to simulate the transport, dilution, and reduction of pollutants in the subsurface environment. Complex evaluation processes were conceptualized, and representative (conservative) input parameter values were selected to describe the site characteristics [24,26,27]. Ryu [25] analyzed the behaviors of contaminants such as benzene, toluene, ethylbenzene, and xylenes (BTEX) as well as total petroleum hydrocarbons (TPHs) in the unsaturated zone and modified the behaviors in the conceptualized saturated aquifer implemented by numerical simulation. Based on the dilution reduction model presented by the ASTM, Verginelli and Baciocchi [24] simulated the depletion of BTEX in the unsaturated zone and the effect of dilution reduction on the migration path. They verified their model by comparing the concentrations of pollutants at the actual site and considering source depletion, adsorption, and biodegradation. Recently, Mazzieri et al. [27] tested steady-state and transient models to estimate the change in exposure concentration and to established a tier-2-based analysis. Among these different tools, the ASTM-type evaluation of the pathways in the unsaturated zone has recently been adopted in other studies [24,27,28]. For example, Stoppiello [28] evaluated the fate and transport of five organic contaminants in the unsaturated zone in various soil conditions using several analytical solutions.
One of the general assumptions in the lower-tiered approach is infinite sources without losses over a period. This assumption may be oversimplified or too conservative for easily volatile and degradable chemicals, such as benzene and naphthalene [25,29]. During field studies, it is also important to characterize the source zone [20,30]. Feenstra et al. [31] described a method for calculating the pore water concentration of soil using residual NAPL. Garg et al. [32] showed that the reduction of contaminants via biodegradation differs depending on the composition of hydrocarbons. Mackay et al. [33] showed that the depletion of sources based on decomposition in the unsaturated zone is relatively higher than that decomposition caused by transport from the groundwater at oil leak sites.
Default values are used for the chemical and physical properties of contaminants and some properties of hydrogeological factors [2]. Site-specific input variables consider hydraulic conductivity values reflecting soil characteristics, the soil pH, various biological mechanisms, and seasonal changes from the unsaturated zone to the groundwater. In Korea, the groundwater flow model in the unsaturated zone is actively used to understand groundwater level fluctuations and predict the amount of groundwater recharge [34].
Infiltration rate is a parameter that affects the fate and transport of contaminants in the unsaturated zone [24,25,35]. Verginelli and Baciocchi [24] considered infiltration factors when simulating source depletion, and the leaching concentration eventually approaches zero. Ryu [25] analytically conducted a sensitivity test by varying the infiltration rate from 10−6 to 1 m. As a result, the concentration of benzene at the water table of the unsaturated zone was diluted and attenuated by 104 to 10. Chang et al. [35] considered the range of infiltration from 0.05 to 1 m/year.
The determination process of the groundwater exposure concentration and the following input default values illustrated in the Korean soil risk assessment guidelines [36] is mostly based on the Soil Screening Guidance for risk-based SSLs of the USEPA [1] based on RBCA’s Tier 1 approaches [3]. The specific objectives of this study are to apply Korean site-specific parameters to a risk-based framework. Based on previous studies that have attempted to quantify the exposure concentration of the subsurface pathway in the risk assessment framework [24,25,27,37], we explore high-tiered approaches of determination of the benzene pathway in the subsurface at the contaminated sites by applying site-specific parameters, especially infiltration data. The method considers (1) sophisticated temporal evaluation in the numerical model and (2) site-specific input parameters using the Korean domestic hydrological database. In the numerical simulations, two site-specific factors in the governing equation were considered: (1) a leaching process considering source depletion in the vadose zone at the contaminated sites and (2) the temporally varying infiltration rate.

2. Method

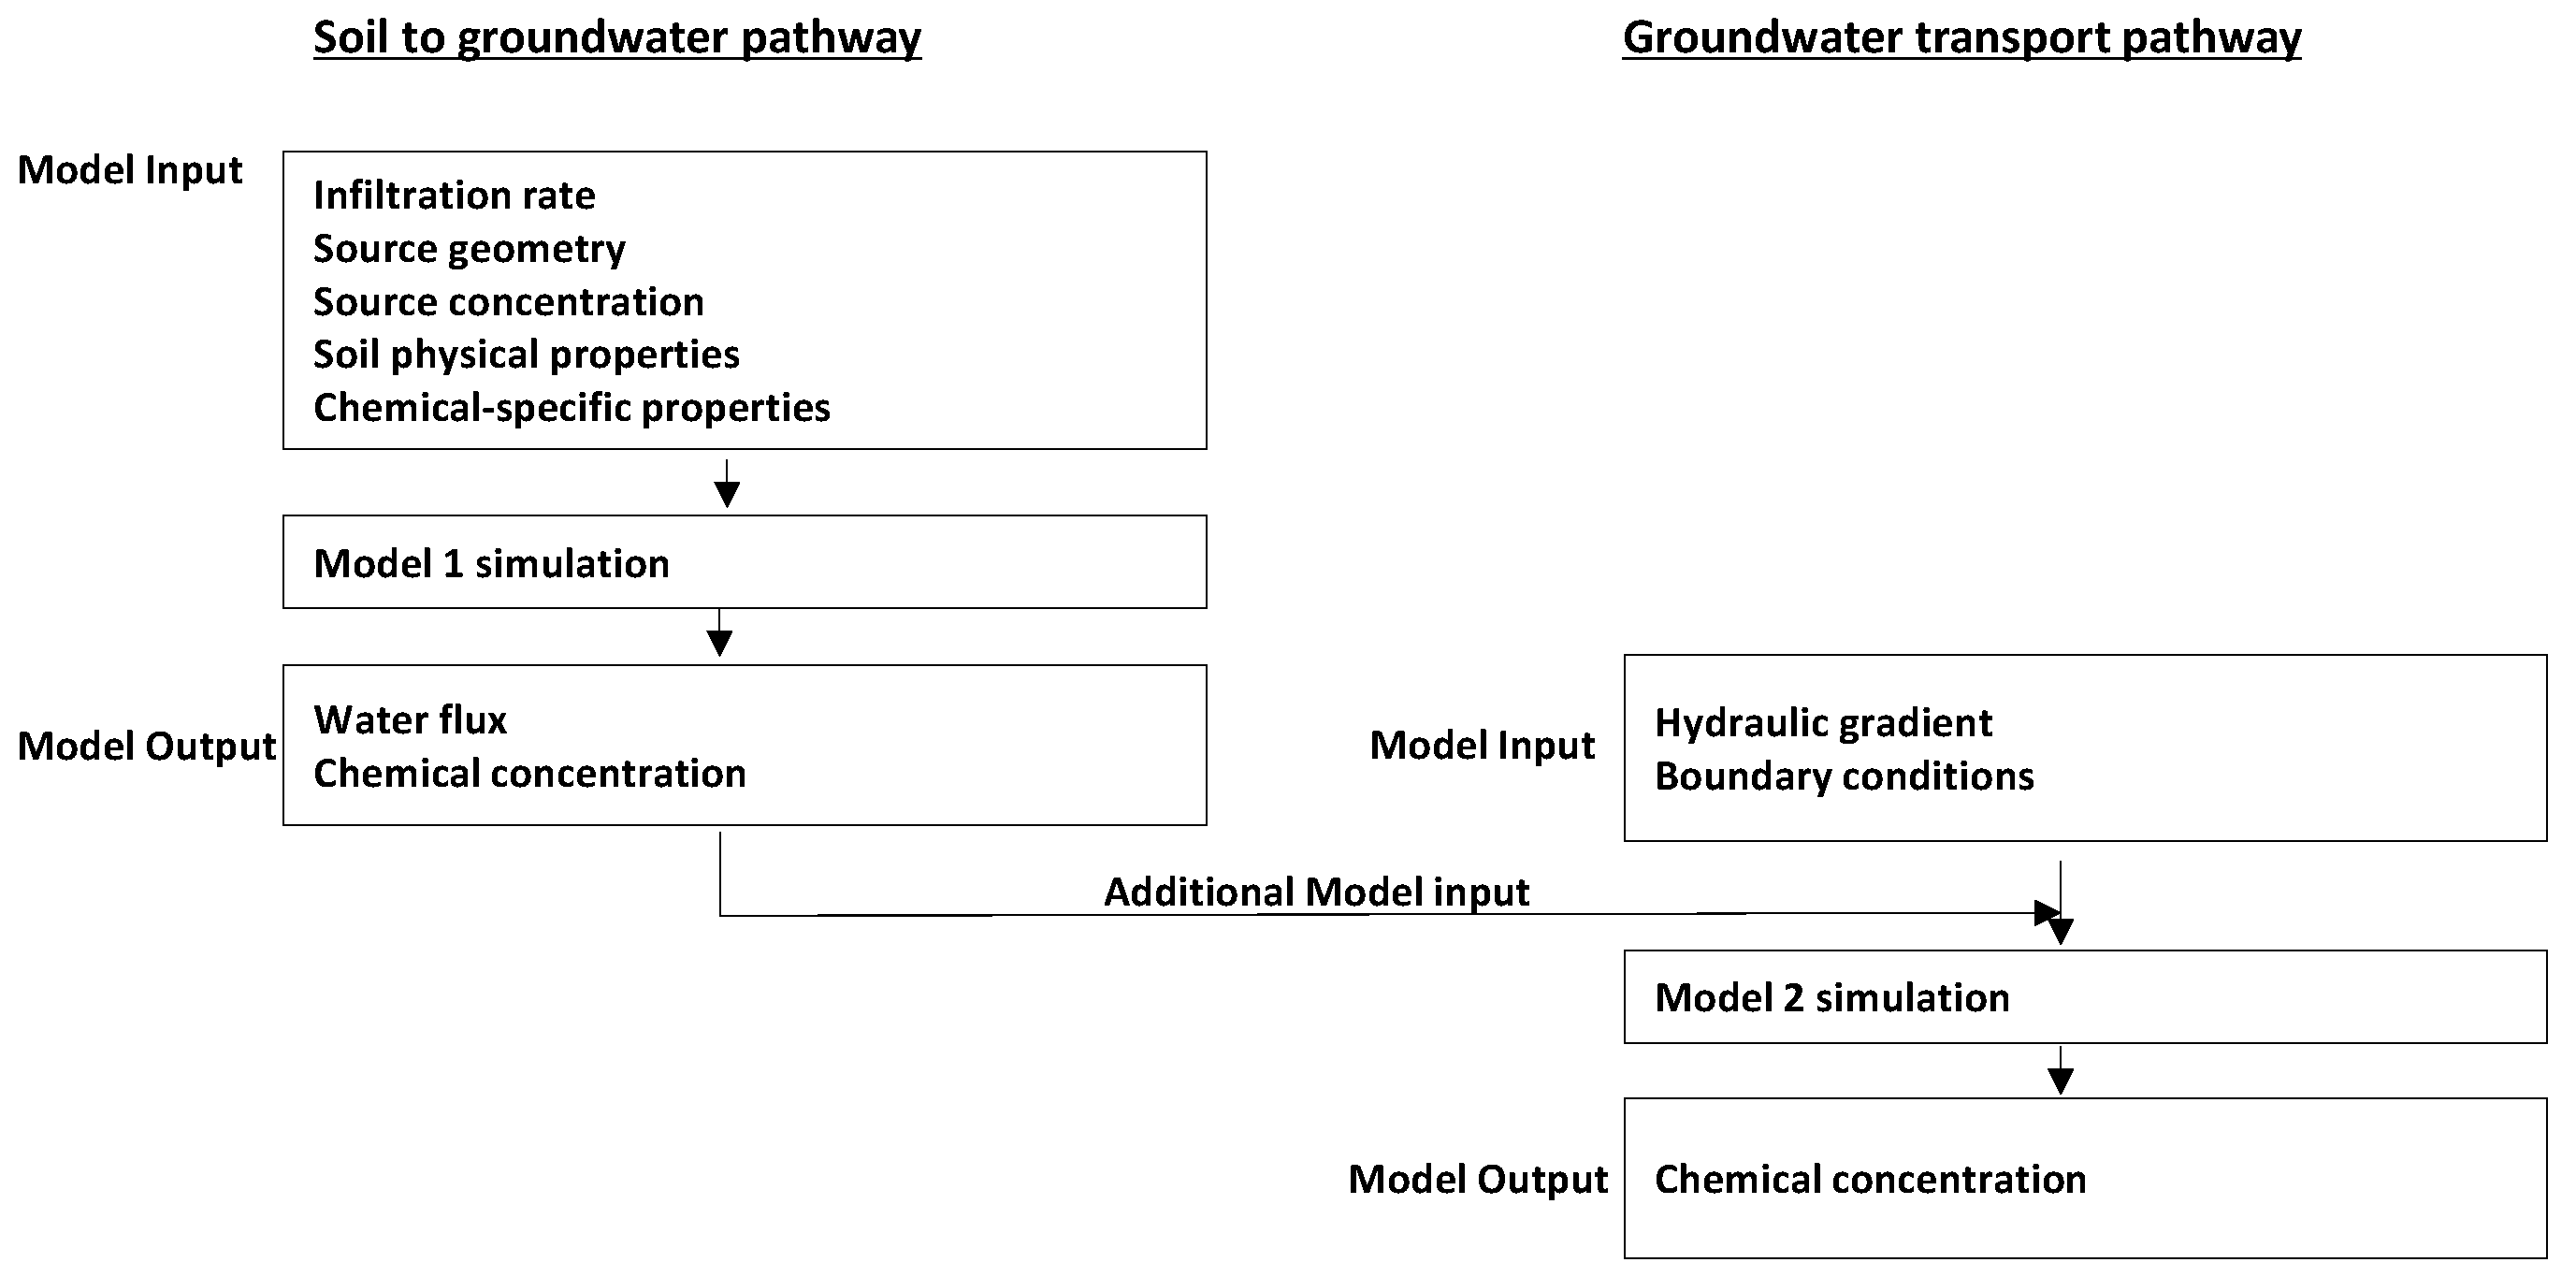
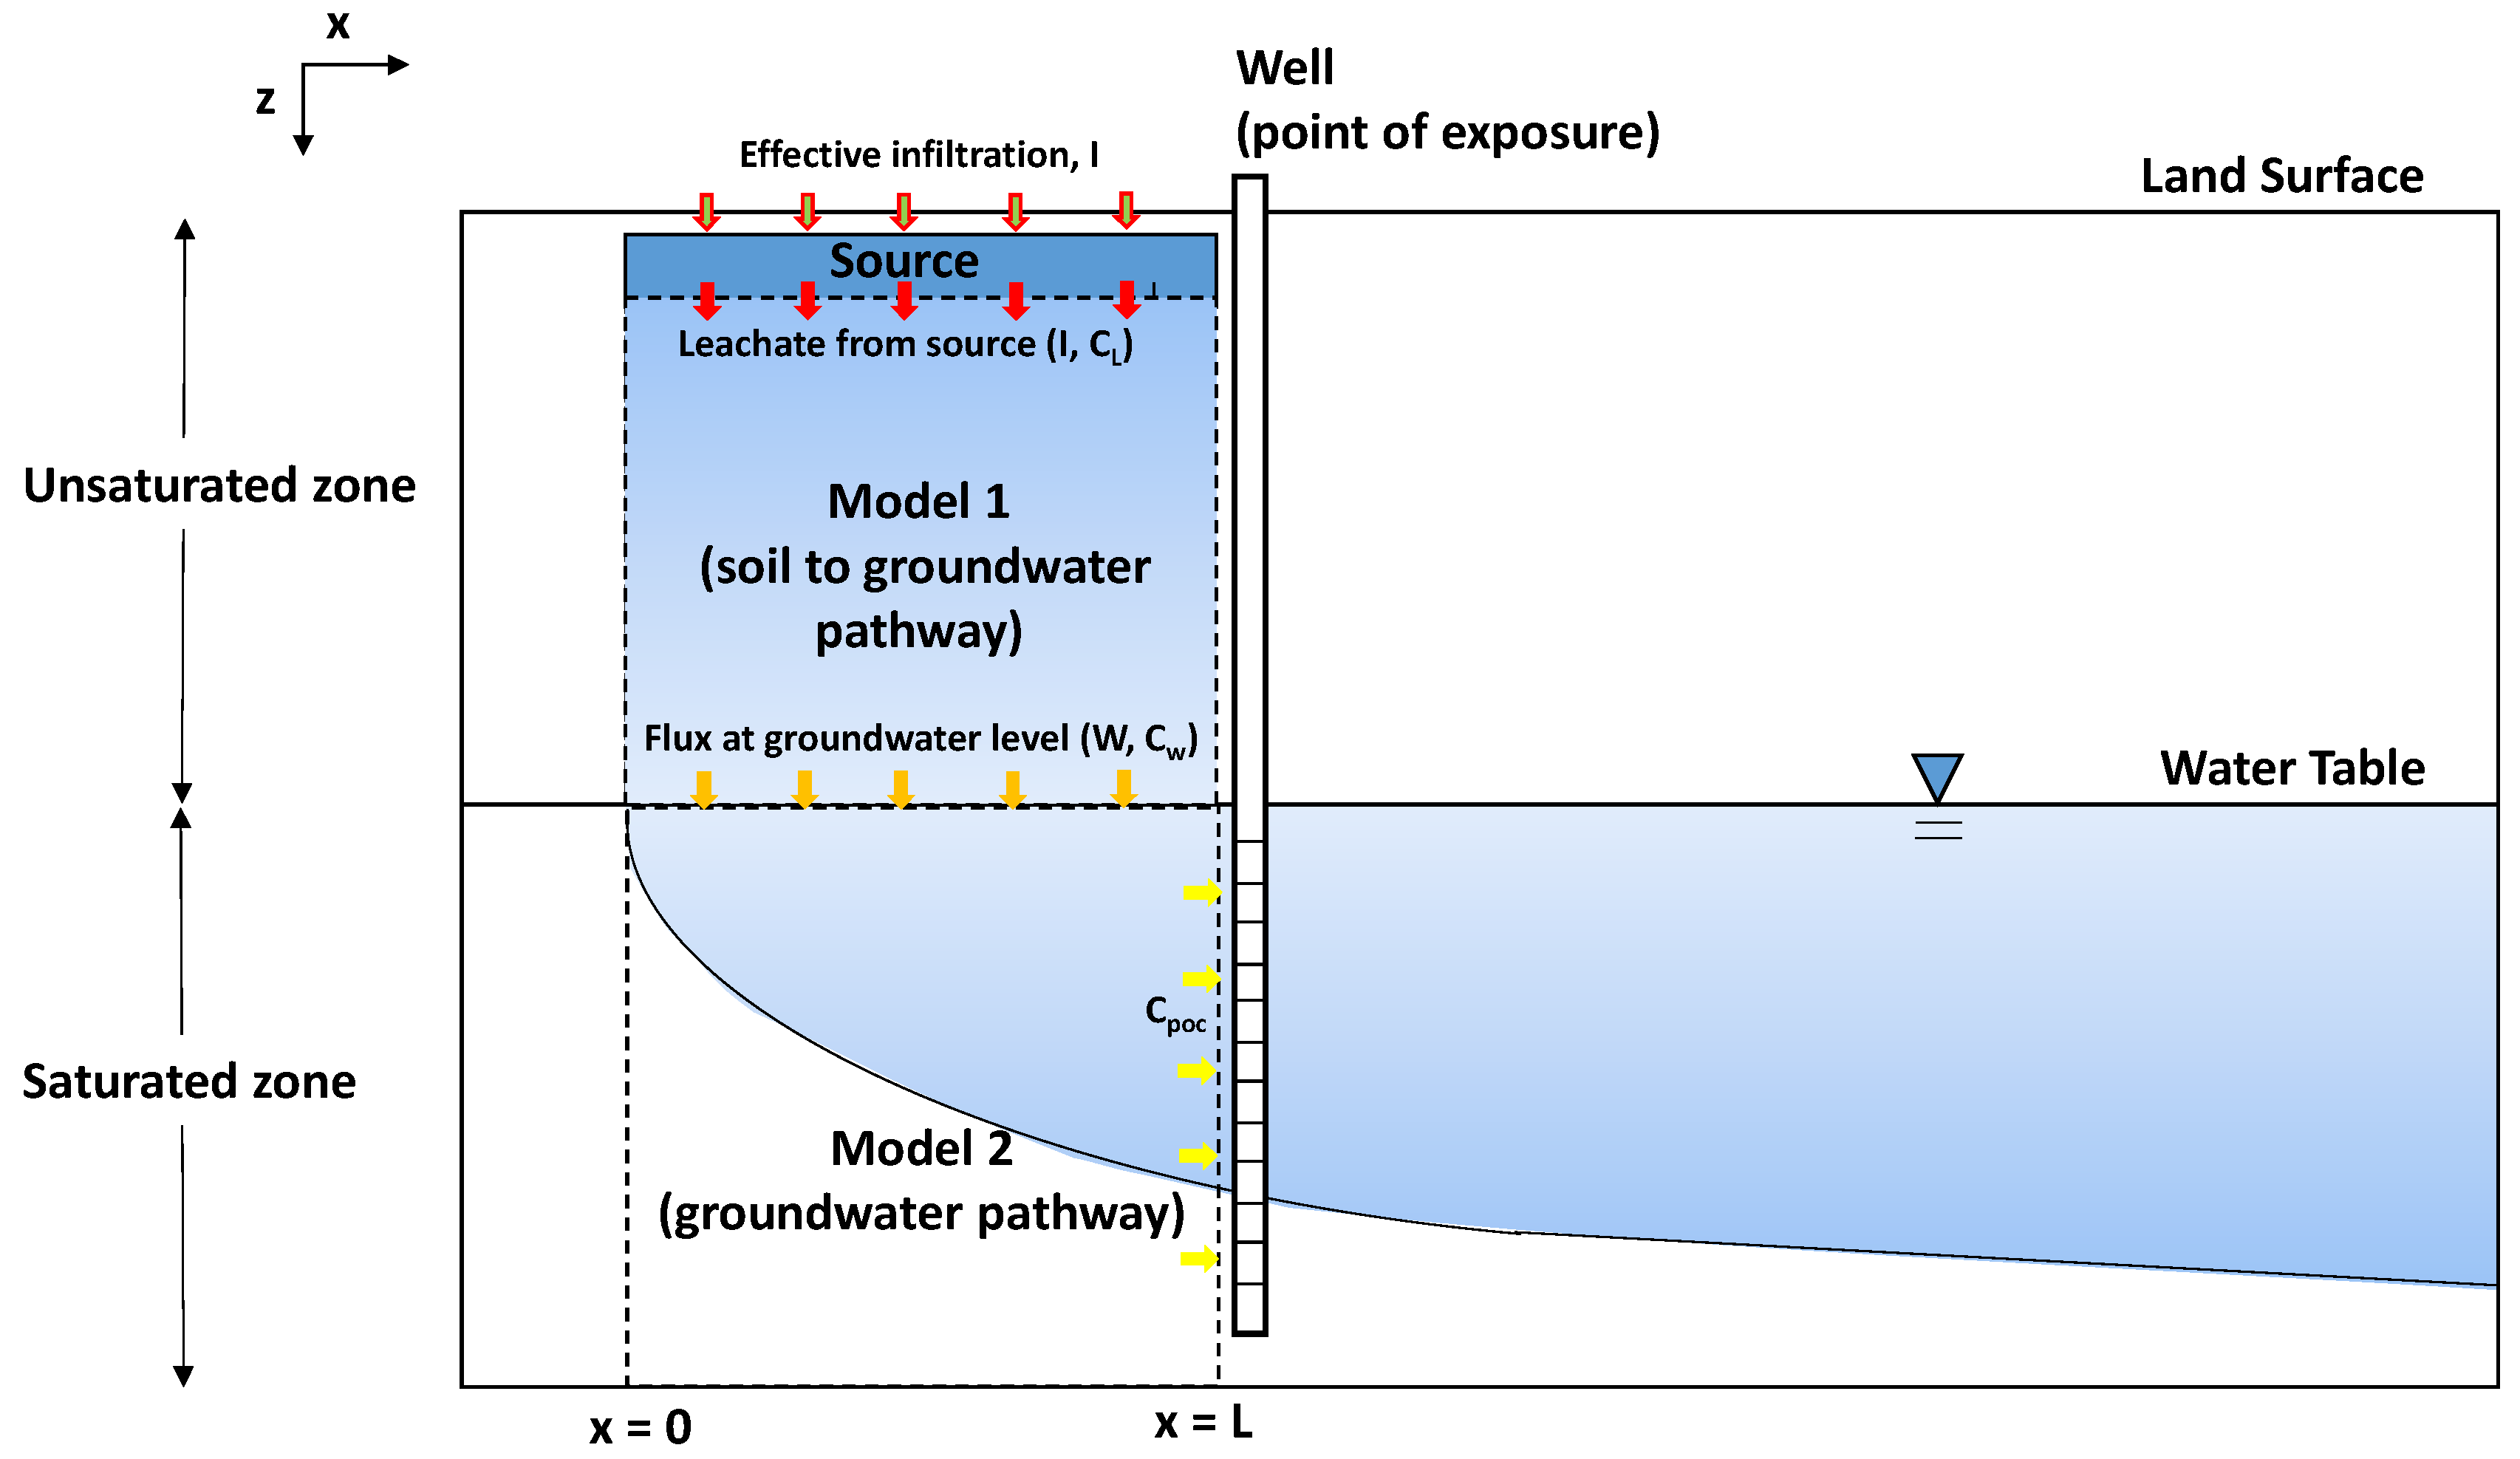
2.1. Conceptualized Numerical Model to Simulate Pathways in the Unsaturated and Saturated Zone

The key parameters for model input, simulation process, and expected output are summarized in Figure 1. The simulation was conducted using a simplified conceptual model with minimal input variables and various assumptions. Hydrogeological and chemical input variables are selected for the flow and transport equations. As presented in Figure 1, infiltration rate, source geometry (source depth and width), source mass and concentration, soil physical properties (porosity, volumetric water contents, volumetric air contents, fraction of organic carbon), and chemical properties (distribution coefficient, Henry’s law constant) are selected as the key parameters in the unsaturated zone. The model is simulated using a one-dimensional finite-difference model, and results are expressed in the concentration at water level in Darcy flux. As a next step, modeling of the saturated aquifer is performed. Since the saturated model is a two-dimensional crosscut, the width and depth of the model are required. The temporal concentration profile obtained from the unsaturated zone is used as an input for the recharge in the saturated model. Then, assuming there is a monitoring well is installed, the concentration at the exposure point can be observed. Biodegradation was not considered in this analysis.
Figure 2 displays the conceptual model for the unsaturated zone and the saturated aquifer. The conceptual model has been developed by previous studies [2,27]. We simulated the pathways of the dissolved concentration of benzene from the source to the groundwater table and then the groundwater table to the exposure point. The saturated aquifer below the contaminated site is often defined as a mixing zone because some conservative approaches assume a mixed process in this area. We did not consider further migration out of the mixing zone because geometry and complex boundary conditions in the flow system with additional site investigation should be considered. Mazzieri et al. [27] also evaluated the transport of contaminants from soil to the mixing zone to analyze the dilution of the contaminants.
Model 1 was applied for evaluating the unsaturated zone, and it assumes the occurrence of one-dimensional fate and transport processes. In the model, the z-direction was defined as the direction of gravity and the flow direction for a one-dimensional finite-difference model. The model assumed unit length for the x-direction and y-direction of the grids. The grid size of the z-direction was set to 0.1 m. The depth of the model was varied from 1 to 10 m for the estimation of the DAF of the unsaturated zone. When the case study was simulated, the length was then set to 1 m and 5 m, respectively.
In model 2, we simulated transport using a two-dimensional model for the saturated aquifer that does not consider the horizontal geometry of the contaminant source. The length of the contaminant source parallel to the groundwater was 50 m, and the depth of the aquifer was 10 m. Therefore, the model domain was set to 50 m horizontally and 10 m vertically. A grid of Δx = 5 m, Δy = 1 m, and Δz = 1 was built in 11 rows: 1 column and 10 layers. Using the unit width of the column, the model can describe the crosscut of the contaminated site shown in two-dimensional system. We assumed that groundwater flowing in two directions flows through the model area and is discharged to the right boundary, and the change in concentrations over time was monitored at the right boundary. The left and right boundary conditions were fixed as head values and are 10.5 m and 10 m, respectively. Recharge was set on the top of model 2 using the calculated concentration from model 1. The transient model was run for 80 years with 80 stress periods. The length of each stress period was set to 1 year. Migration out of the well (point of exposure) was not considered in this study.
(1)
Leaching from source
Analytical Equations (1)–(5) were used to calculate the concentration at the water table. Verginelli and Baciocchi [24] established an integrated method to determine the entire pathway of the contaminants from leaching to entering the groundwater as follows:
C L ( 0 ) = C t ( K d + θ w + θ a H ρ b ) ,
where C t is the soil exposure concentration (M/M), ρ b (M/L3) is the volume density of the soil, H′ is the dimensionless Henry’s constant, K d (L3/M) is the soil distribution coefficient, θ w is the soil moisture content, and θ a is the soil air content. If the calculated C L ( 0 ) value exceeds the saturation concentration, it is replaced with the saturation concentration C L ( 0 ) or the solubility value. The calculation for the soil distribution coefficient of organic contaminants is described below. The equation corresponding to the denominator of Equation (1) is called the soil–water partition coefficient, K S W . Assuming an environment without NAPL, the change in the concentration over time due to infiltration and biodegradation can be expressed by the following equation:
C L ( t ) = C L ( 0 ) e x p ( μ t )
μ = I ( R d s ρ b K S W ) + λ s o u r c e θ w ( ρ b K S W )
where d s is the thickness of the contaminant source [L], R is the retardation coefficient [L/M], and λ s o u r c e is the first-order biodegradation rate constant in the source [T−1]. The first term in Equation (3) reflects the source depletion due to leaching. The second term expresses the source depletion due to biodegradation, and μ is the source depletion coefficient expressed as the sum of the two values.
If C L ( 0 ) calculated by Equation (1) exceeds the saturation concentration and is replaced by the solubility value, Equation (2) can be rewritten as follows:
C L ( t ) = S   i f   t   t * = S   e x p ( μ ( t t * ) )     i f   t > t * ,
where S is the solubility of the contaminant (M/L3) and t* (T) is the point at which the soil discharge concentration decreases below the solubility due to the depletion of the source.
As Equations (3) and (4) reflect the average infiltration rate, we modified the equation to incorporate the temporal change in infiltration:
C L ( t ) = C L ( 0 ) e x p ( i n μ i Δ t )
where μ i is the decomposition constant calculated on the precipitation in the ith term among stress periods of number n. In this study, the ith stress period refers to the ith year in the simulation time.
(2)
Fate and transport in the unsaturated zone (Model 1)—Soil to groundwater pathway
Models related to solute movement and behavior were used to predict advection, dispersion, and diffusion adsorption and are expressed as a one-dimensional partial differential equation as shown in the following equation. The model assumes that the vertical flow is dominant in the unsaturated subsurface. The equation is mainly based on the transport–diffusion equation with linear sorption.
R C t = V z C z + z ( D z C z )
where R [dimensionless] is the retardation factor in the unsaturated zone, V z [LT−1] is the vertical flow velocity of groundwater in the unsaturated zone, C [ML−3] is the solute concentration, and D z [L2T−1] is the hydraulic dispersion of the flow direction. The velocity is calculated by dividing the infiltration rate by the porosity.
The boundary condition and the initial condition of the saturated model is shown below:
at t = 0, C = 0 at all nodes;
at z = 0, C = C L e x p ( μ t ) ;
at z = L, C z = 0 .
(3)
Fate and transport in the saturated aquifer (Model 2)—Groundwater transport pathway
The contaminant pathways in the saturated zones are calculated based on the assumption of groundwater saturation flow in a homogeneous medium. The governing equation for flow in the saturated zone can be expressed as a partial differential equation as follows.
S s h t = x ( K h x   ) + y ( K h y   ) + x ( K h z   ) + W
where h [L] is the groundwater head, K [LT−1] is the hydraulic conductivity, Ss [M−1LT2] is the specific storage coefficient, t [T] is the time, W [LT−1] is the flow rate per unit volume flowing into or out of the groundwater system, [T−1] is the source/sink, and x, y, and z are Cartesian coordinates in which x and y are horizontal and z is vertical. D is the dispersion coefficient [L2 T−1].
The left and boundary heads are fixed so that the head slope remains at 0.01. The concentration and flux discharged from model 1 were used as input to areal recharge.
The governing equation for transport in the saturated zone can be expressed as a partial differential equation as follows. The equation is based mainly on the transport-diffusion equation with linear sorption. Decay is considered only in a case study.
R C t = V x C x V y C y V z C z + x ( D x C x ) + y ( D y C y ) + z ( D z C z ) λ C
The boundary condition and the initial condition of the saturated model is shown below:
at t = 0, C = 0 at all nodes;
at x = 0, C = 0 ;
at x = L, C x = 0 .
The code used the hydrogeological default values presented in Table 1 as default input variable values, which are based on the Korean soil risk assessment guideline [34]. The distance between the bottom of the source and water table, L, varies from 1 to 10 m, and the thickness of the contaminant source, D, varies 1 to 5 m in this study. The first-order decay coefficient is set to zero. The guideline recommends a fraction of organic carbon content, foc of 0.002, representing sandy soil types. The Korean Guideline by the Ministry of Environment (MOE) [36] follows the guideline by EPA [2] for a dimensionless Henry constant and distribution of coefficient values. The infiltration rate was applied by calculating the range of the domestic areal-recharge rate that was nationally investigated.

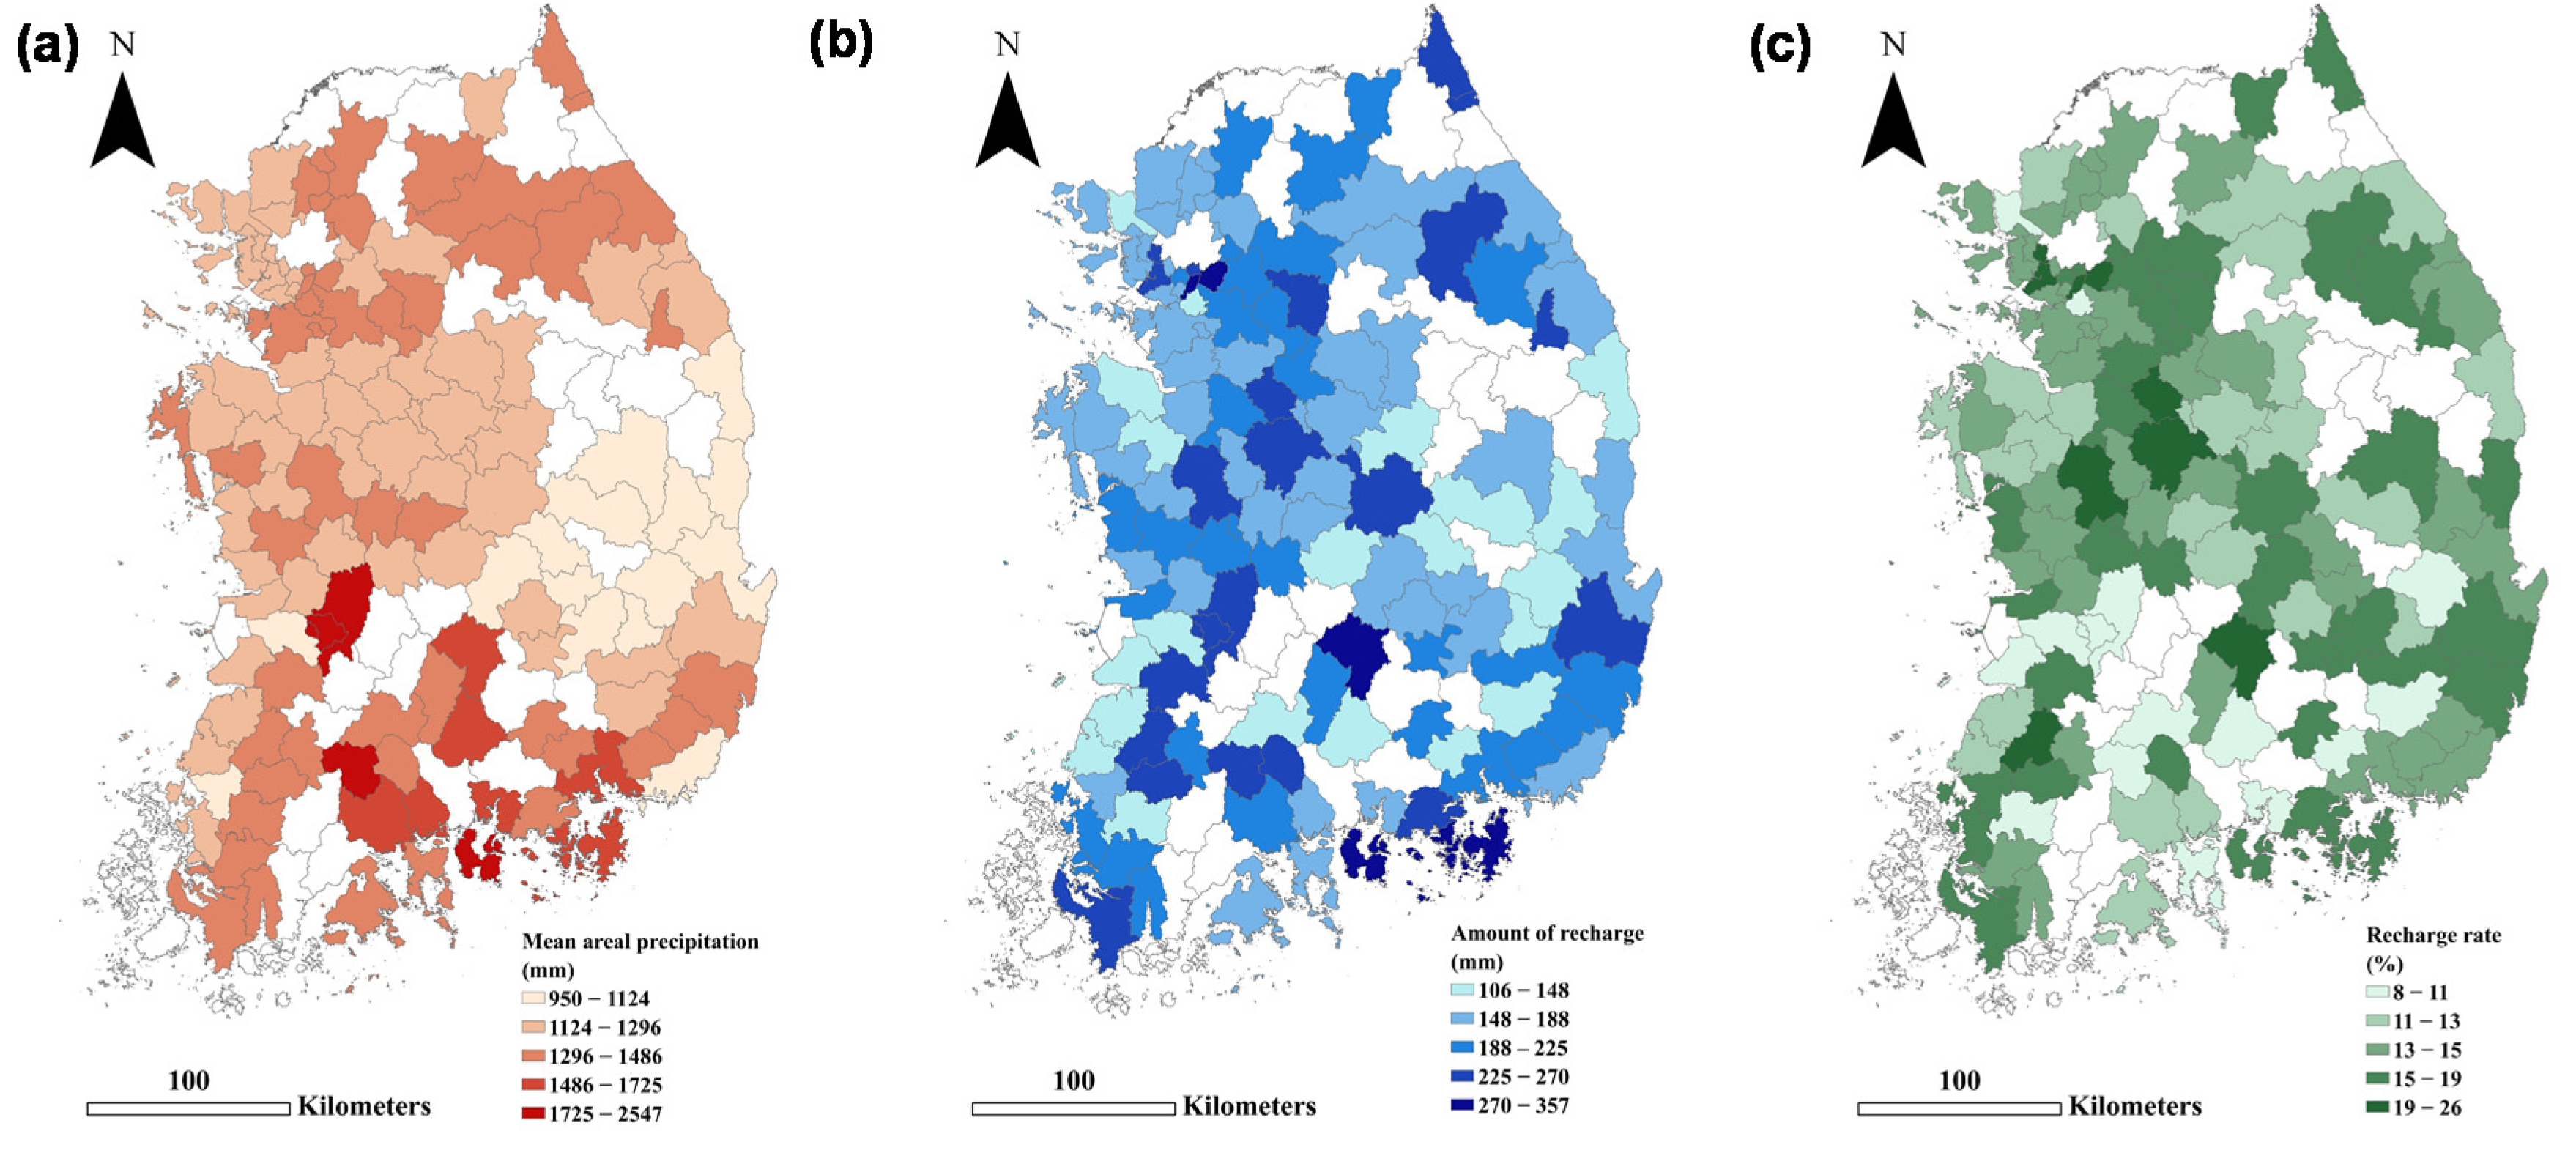
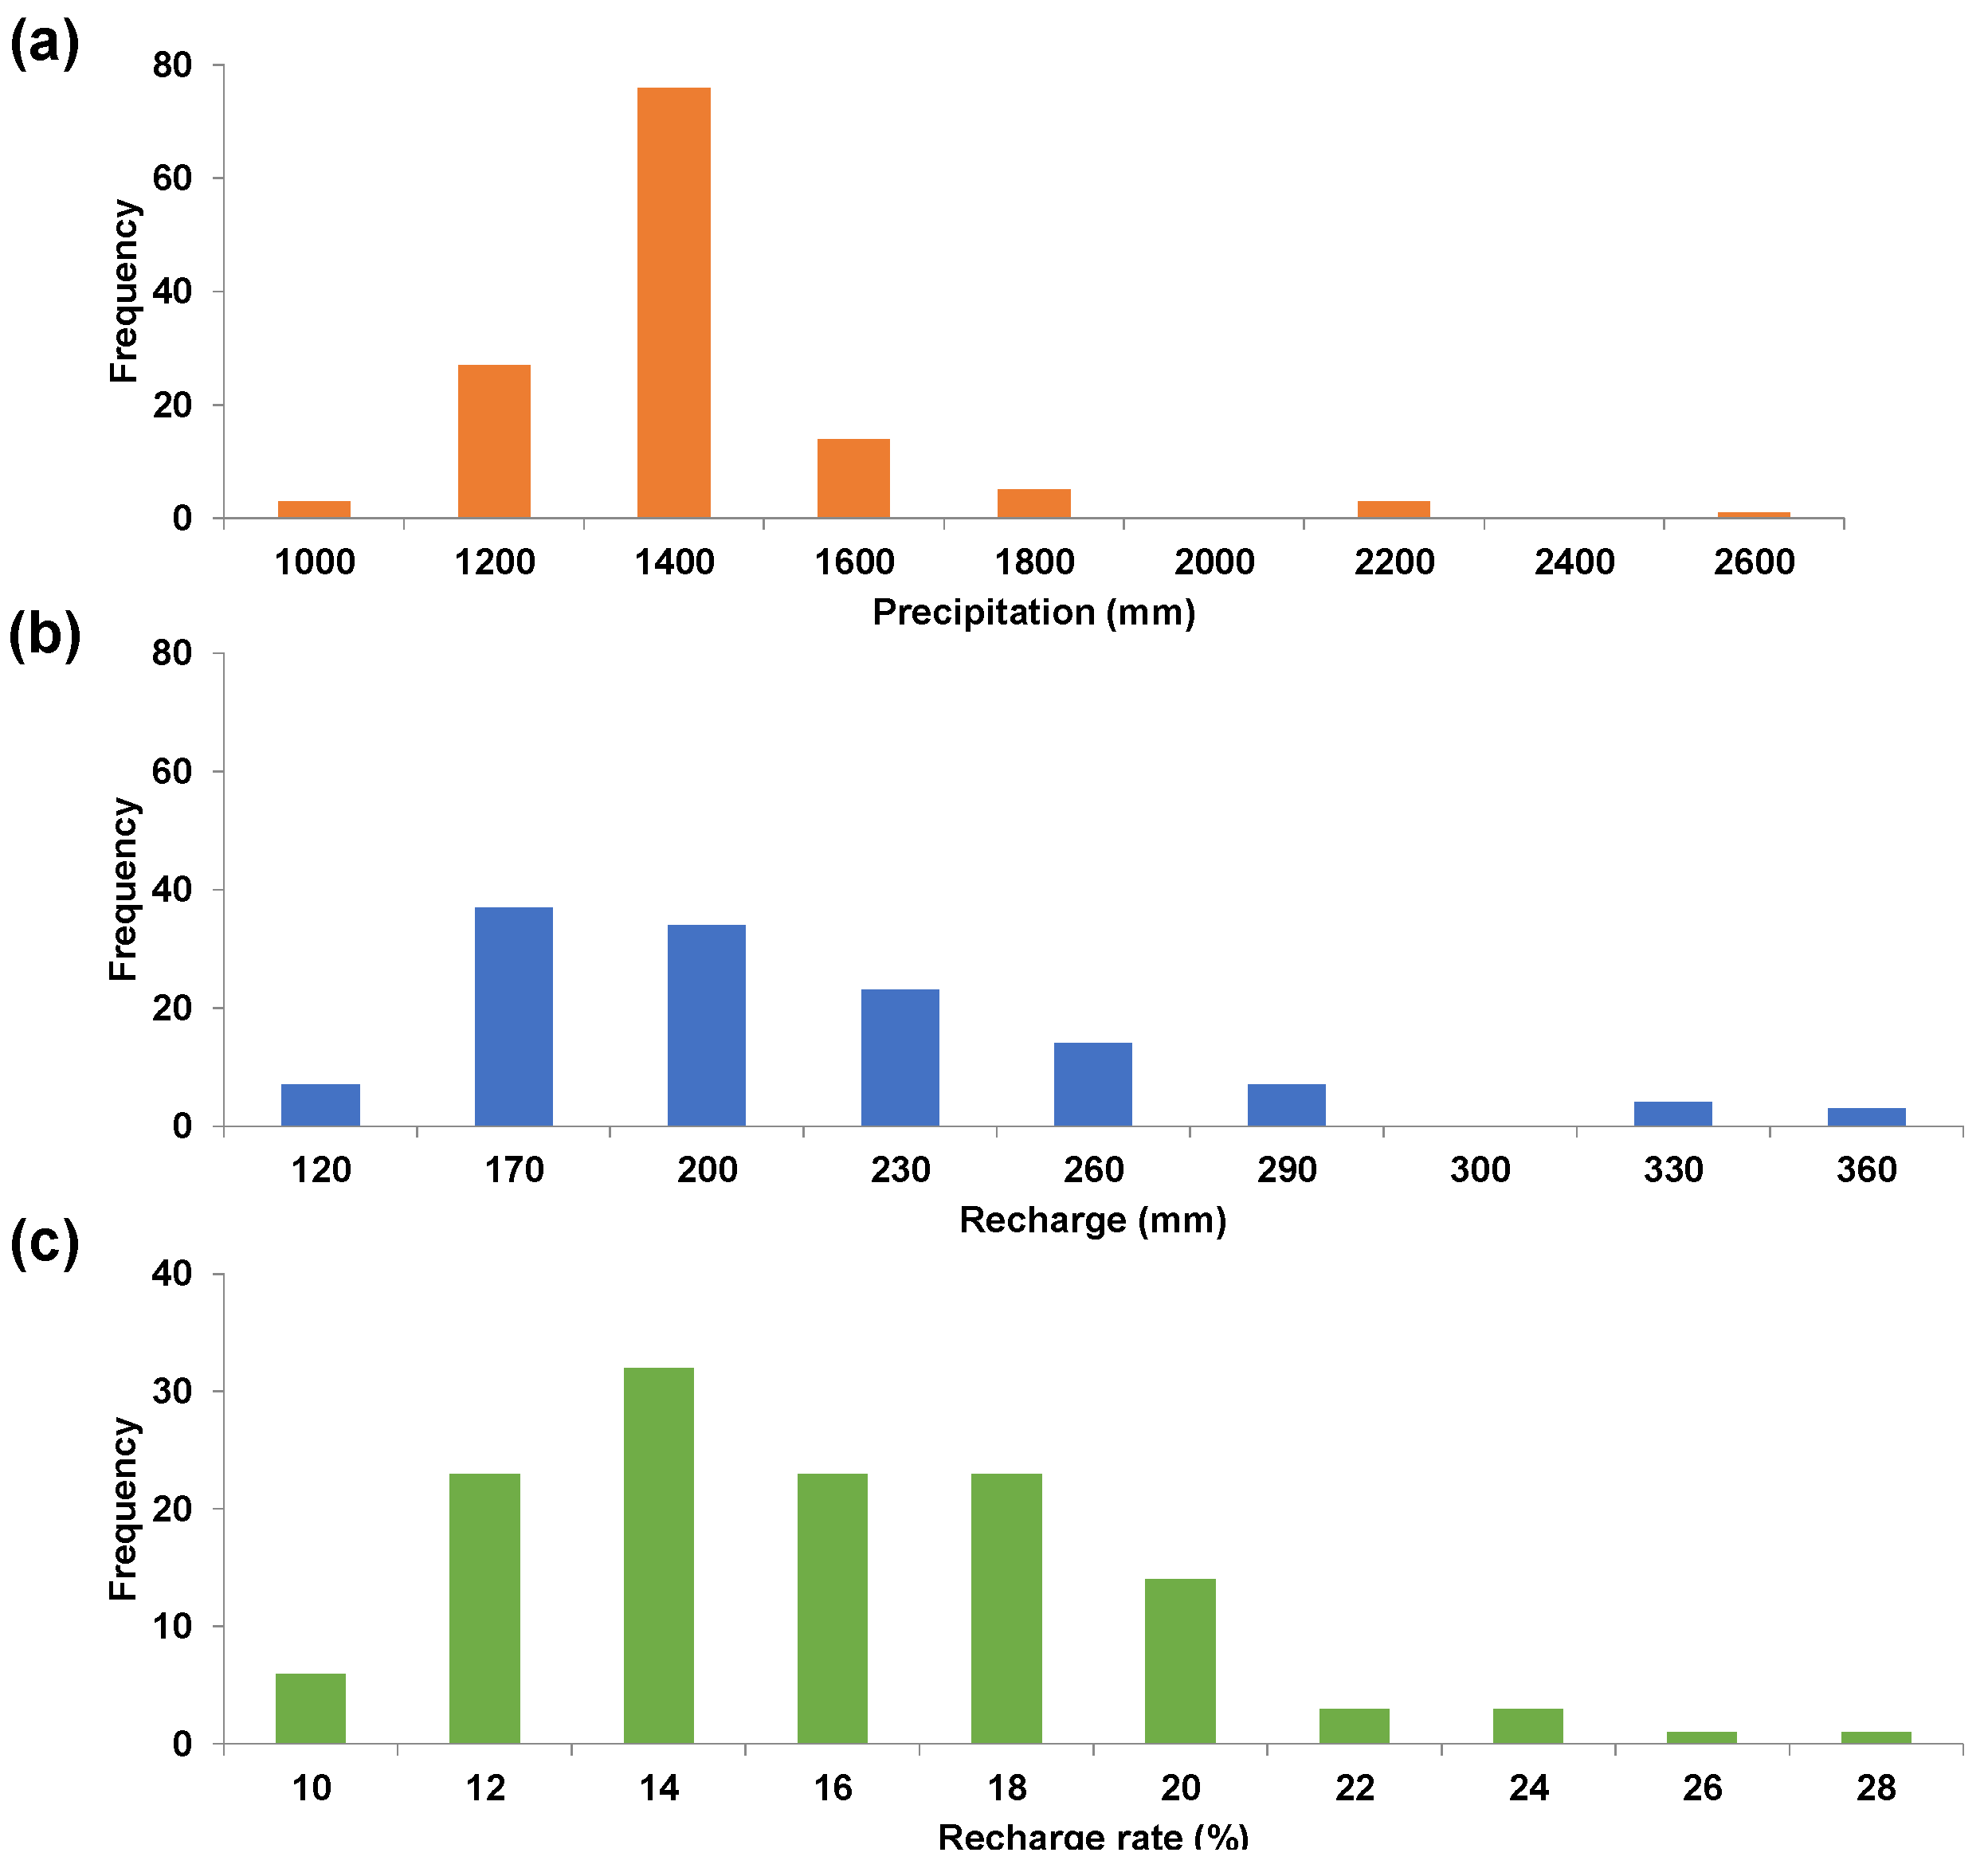
2.2. National Infiltration Data Acquisition for Model Input

To determine the range of effective infiltration rates that we can find in Korea, we used the recharge data from the Korean groundwater survey conducted by the Ministry of Land, Infrastructure, and Transport (MOLIT) and the MOE. This survey has been conducted for 100 areas since 1997 to investigate the aquifer characteristics and assess the water budget of groundwater resources by region. It also provides basic data on the groundwater flow direction, groundwater recharge rate, groundwater vulnerability map, and sustainable development [38]. In the processes related to the surveys, The Korea Water Resources Corporation, Korea Institute of Geoscience and Mineral Resources, Korea Institute of Construction Technology, Korea Groundwater, and the Geothermal Association calculated the recharge amount introduced into the groundwater to evaluate the potential groundwater development for each administrative district at the city and county levels. Multiple analysis methods, such as water budget analysis, Natural Resources Conservation Service (NRCS)-Curve Number (CN) [39], Water-Table Fluctuation (WTF) method [40], Hybrid WTF [34,41], and Soil and Water Assessment (SWAT) [42] were selected depending on the case.
Figure 3 shows the spatial distribution of precipitation, recharge, and recharge rate surveyed since 1997 on the Korean peninsula. The graph shows data from basic surveys of 100 cities and counties conducted since 1997 that were collected by the Integrated Ground Water Information Service [38]. In the survey, the region’s annual precipitation is described as the average value for the last 30 years from the investigation. The map shows that the spatial distribution of annual precipitation varies by region. The highest precipitation occurred on the southern coast, whereas the dry region had annual precipitation of 1100 mm or less and was formed around the middle-eastern area. The recharge values and recharge rate follow a pattern similar to the spatial distribution of precipitation by region. The white color represents the areas that have not been investigated yet.
Figure 4 shows the histogram for the range of recharge values. The annual recharge amount ranges from 96 to 384 mm, with a slightly right-skewed distribution. The values mostly fall between 132 and 276 mm, with an average value of 23 areas with 174 mm and a standard deviation of 55 mm.
Chang et al. [35] conducted sensitivity tests by varying the hypothetical infiltration value from 0.1 to 1 m/year. This study used a range of infiltration that reflected actual soil conditions in Korea. We explored the distribution of the concentration at water level, Cw, by varying the value within the range of 96–384 mm for the annual infiltration rate that was obtained from the statistical analysis shown in Figure 4, 1–10 m for the distance of the groundwater table from the source, and 1–5 m for the thickness of the contaminant source.

3. Results and Discussion

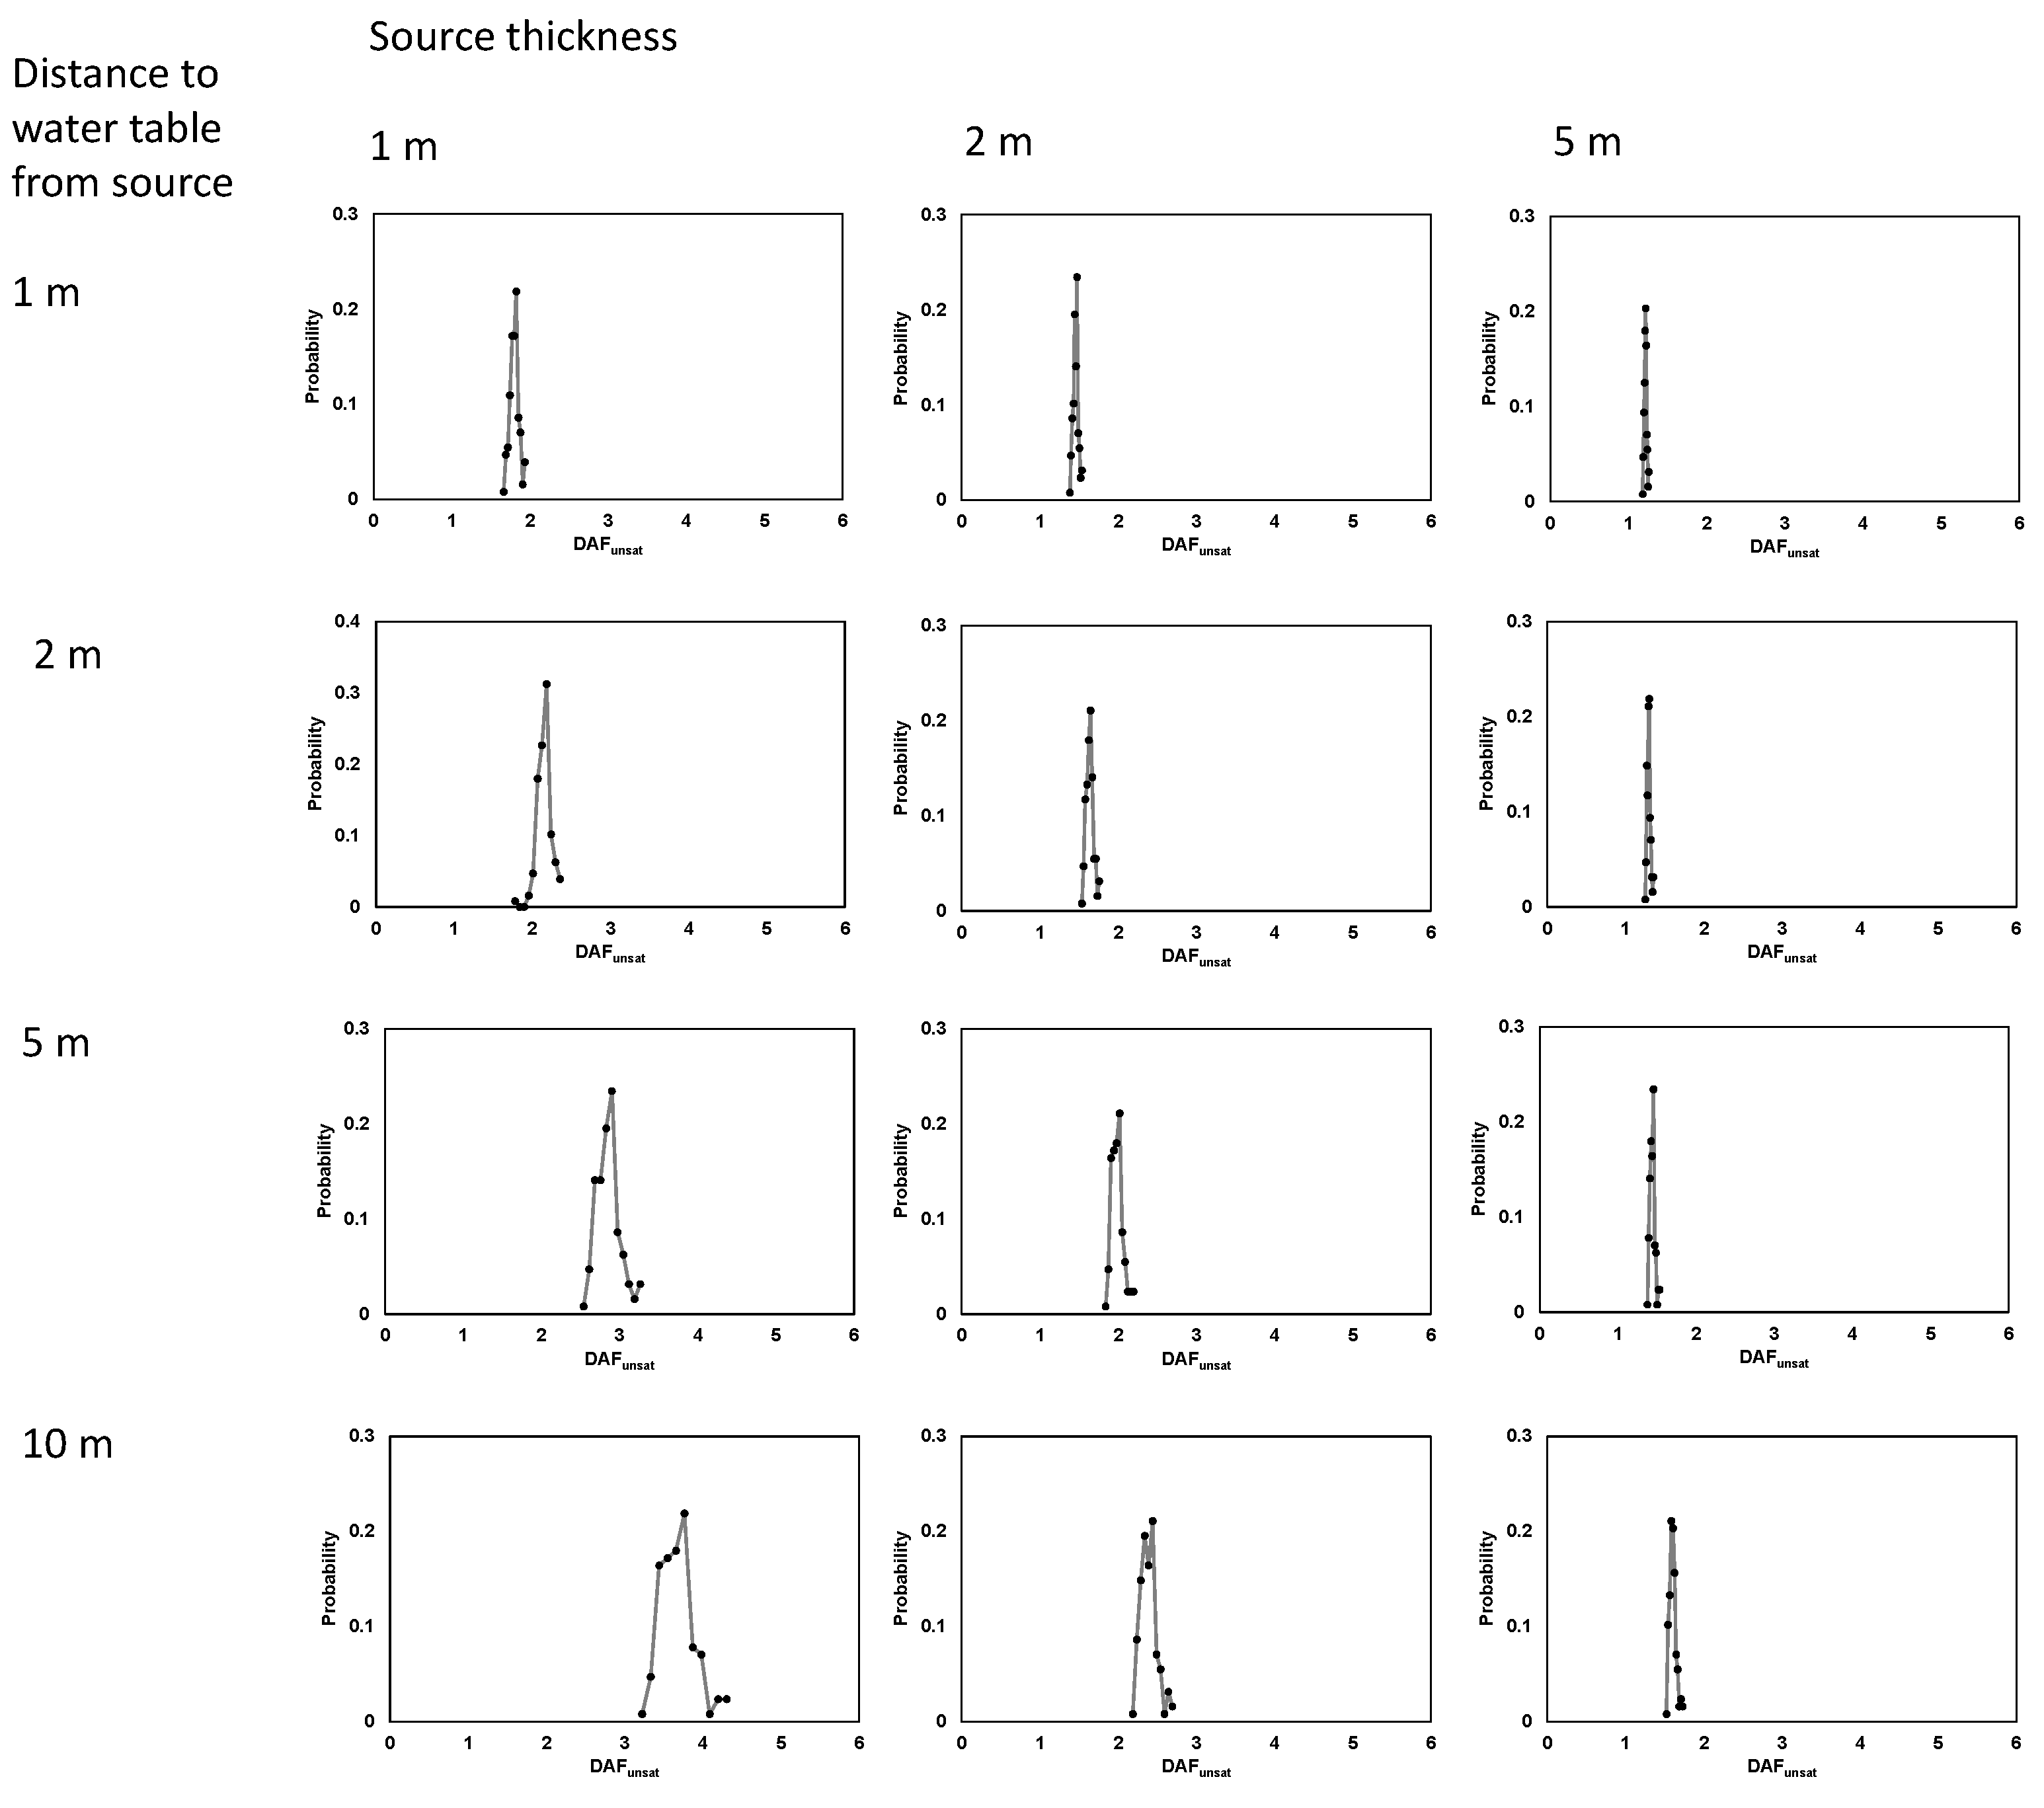
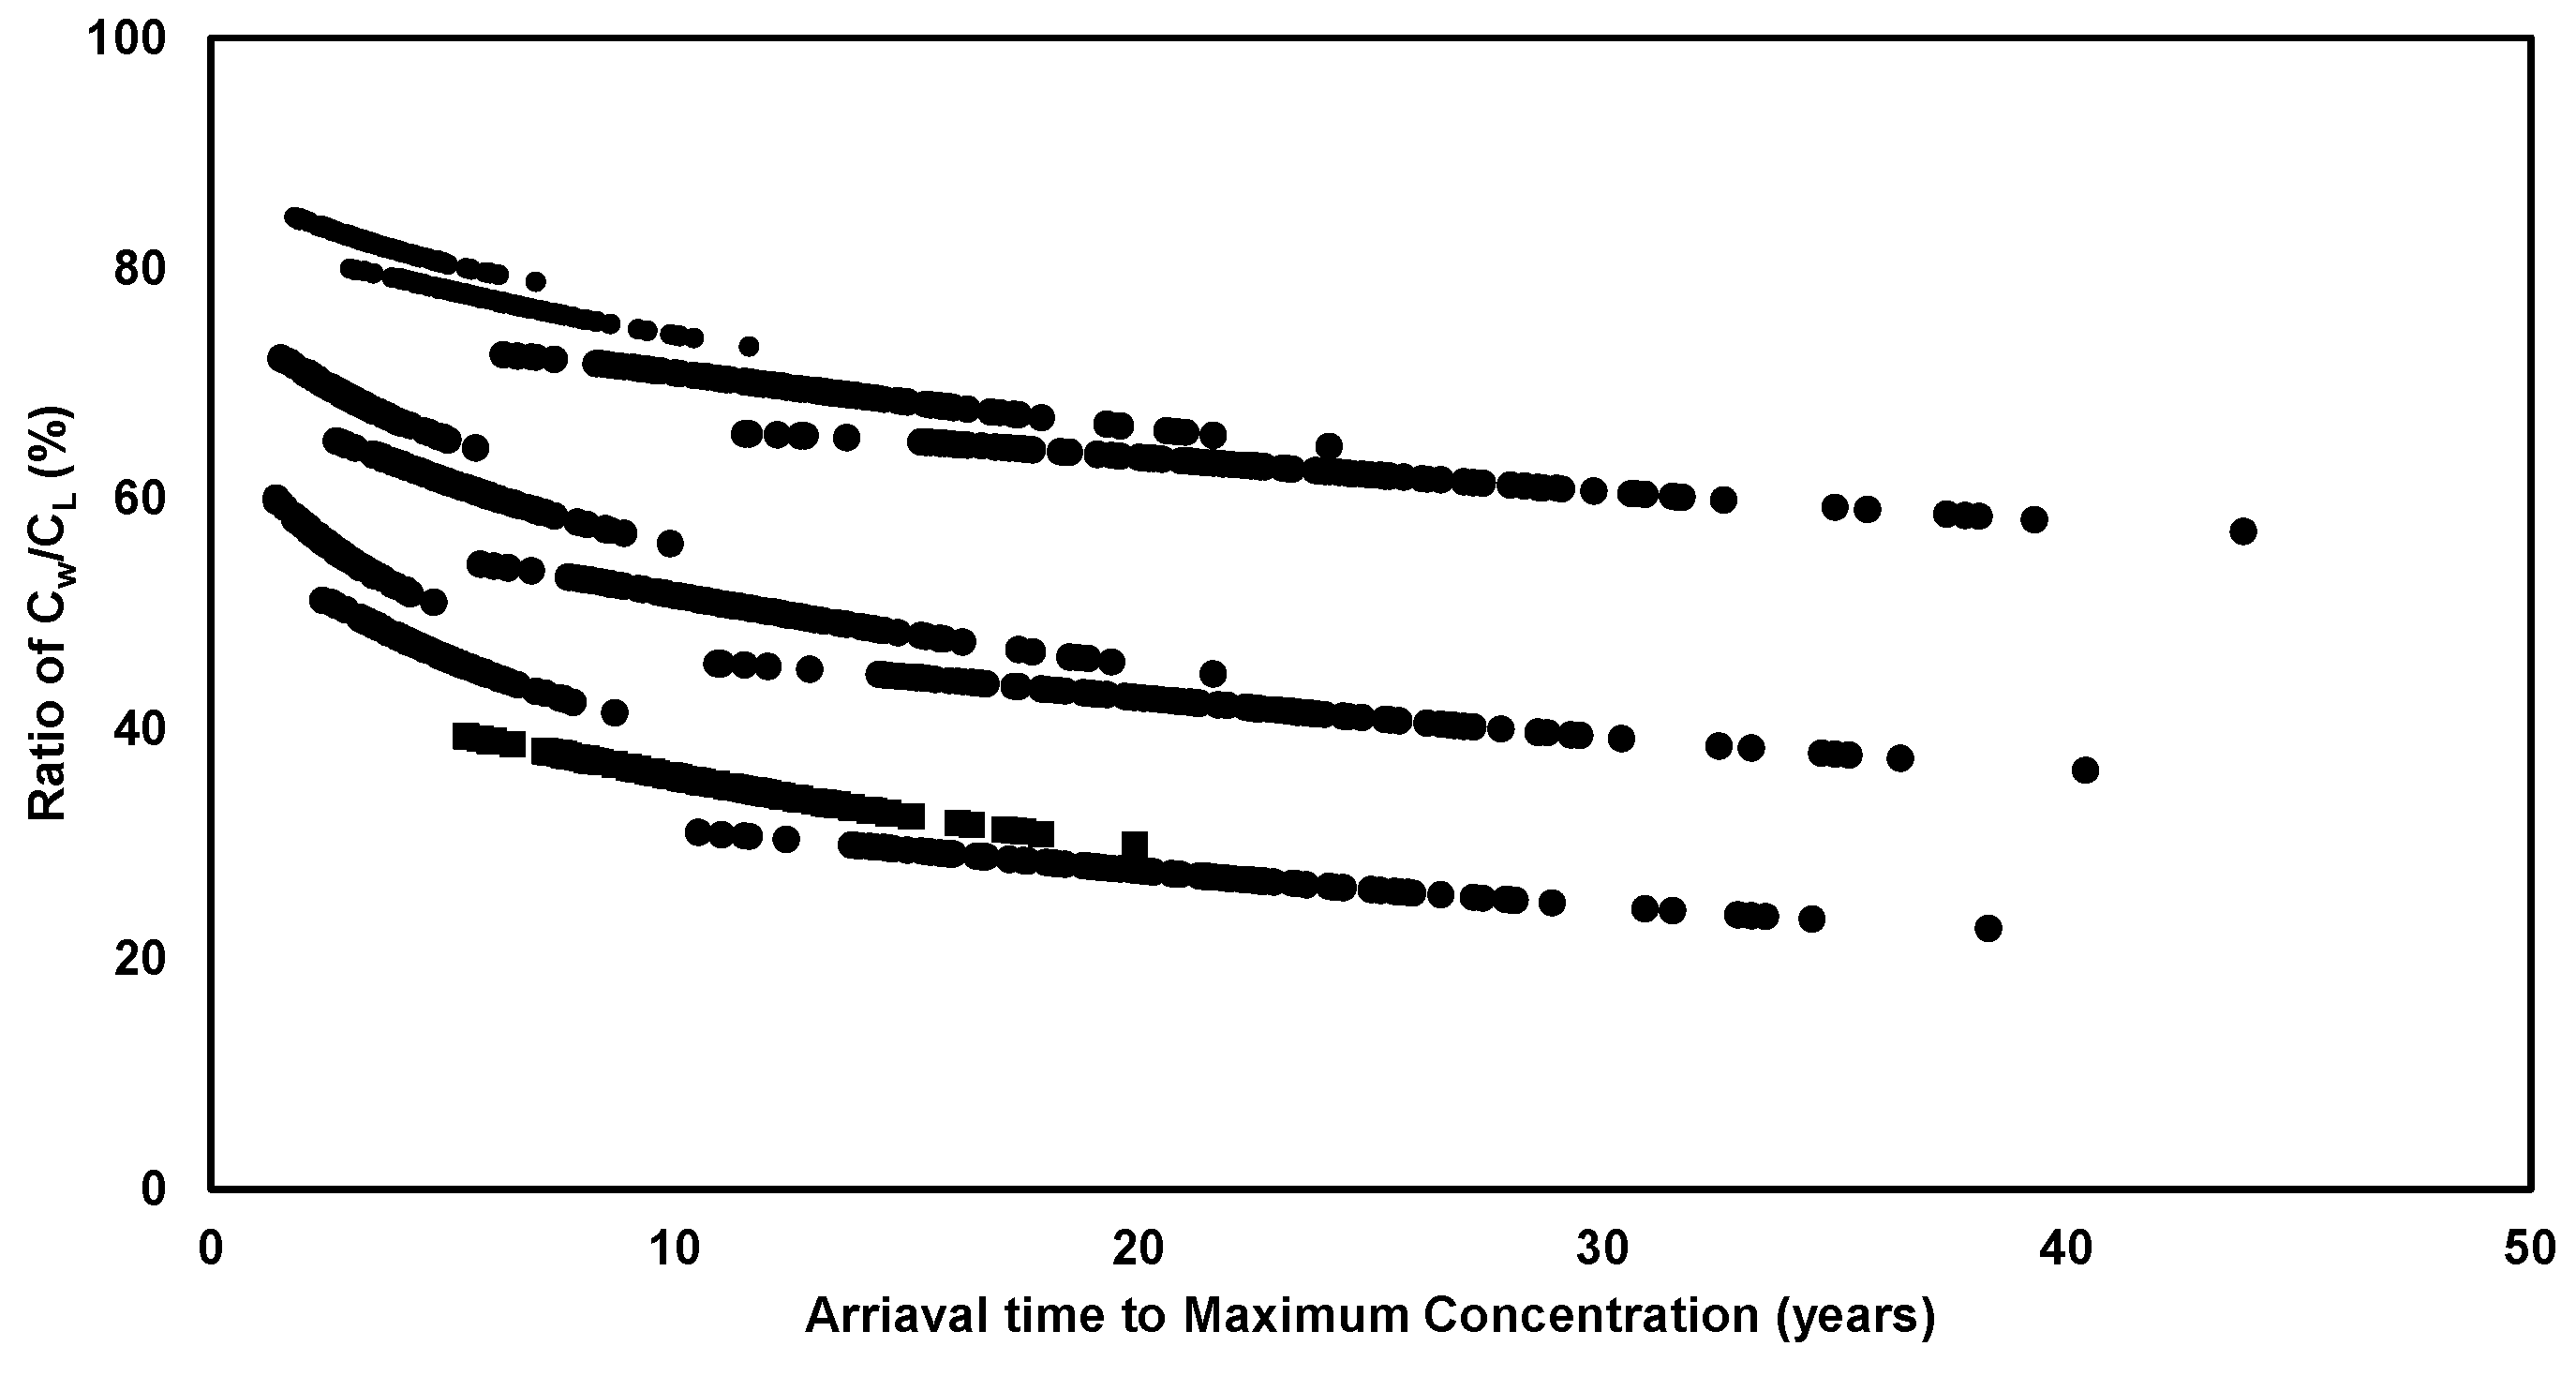
3.1. Estimation of the Probability Distribution of DAFunsat

Figure 5 shows maximum concentrations and their arrival times at the water table along the unsaturated path when finite-difference one-dimensional transport was simulated. The spread of data points is illustrated when we conducted multiple calculations by varying the value within the range of 96–384 mm for the annual infiltration rate, 1–10 m for traveling distance, and 1–5 m for the source thickness. The rest of the input parameters used the default values shown in Table 1. This CW/CL at y-axis was also designated as the leachate attenuation factor by Verginelli and Baciocchi [24]. The results show that the maximum concentration is inversely proportional to the arrival time, given the combination of all input variables.
To express the reduction in contaminant concentration, DAFunsat has been adopted as an indicator from the Ryu [25] defined as the ratio of the concentration of the source to the concentration at the water table. Since we deal with time-varying concentrations in this study, we redefined DAFunsat as the ratio of the initial source concentration to the highest concentration at the water level. Therefore, the y-axis of Figure 5 is equal to 1/DAFunsat.
Figure 6 shows that the estimated range of concentrations became relatively narrow and converged to a specific value, indicating that the prediction for the possible concentration at the water level may be indicated as a function of the thickness of the source and the distance to the water table from the source. All DAFunsat values for all cases were greater than 1, indicating that the leaching concentration from the source was diluted and attenuated.
The distribution graph at the top left of Figure 6 is the simulated result for the case of the distance of the water table from the source of 1 m with a source thickness of 1 m. The DAF ranged between 1.6 and 2, meaning that the water level concentration is diluted and attenuated 1.6 to 2 times compared to the soil exposure concentration. Each plot pattern shows a gradual decrease in concentration as the contaminant travel distance increases to 2, 5, and 10 m. In addition, they show a gradual increase in concentration as the source depth increases to 2 and 5 m. When a contaminant travels to the longest path length of 10 m with a source depth of 1 m, the simulated DAFunsat ranged from 3 to 4. The highest DAFunsat simulation results are close to 1 when contaminants travel to a source depth of 5 m and the shortest path length of 1 m.

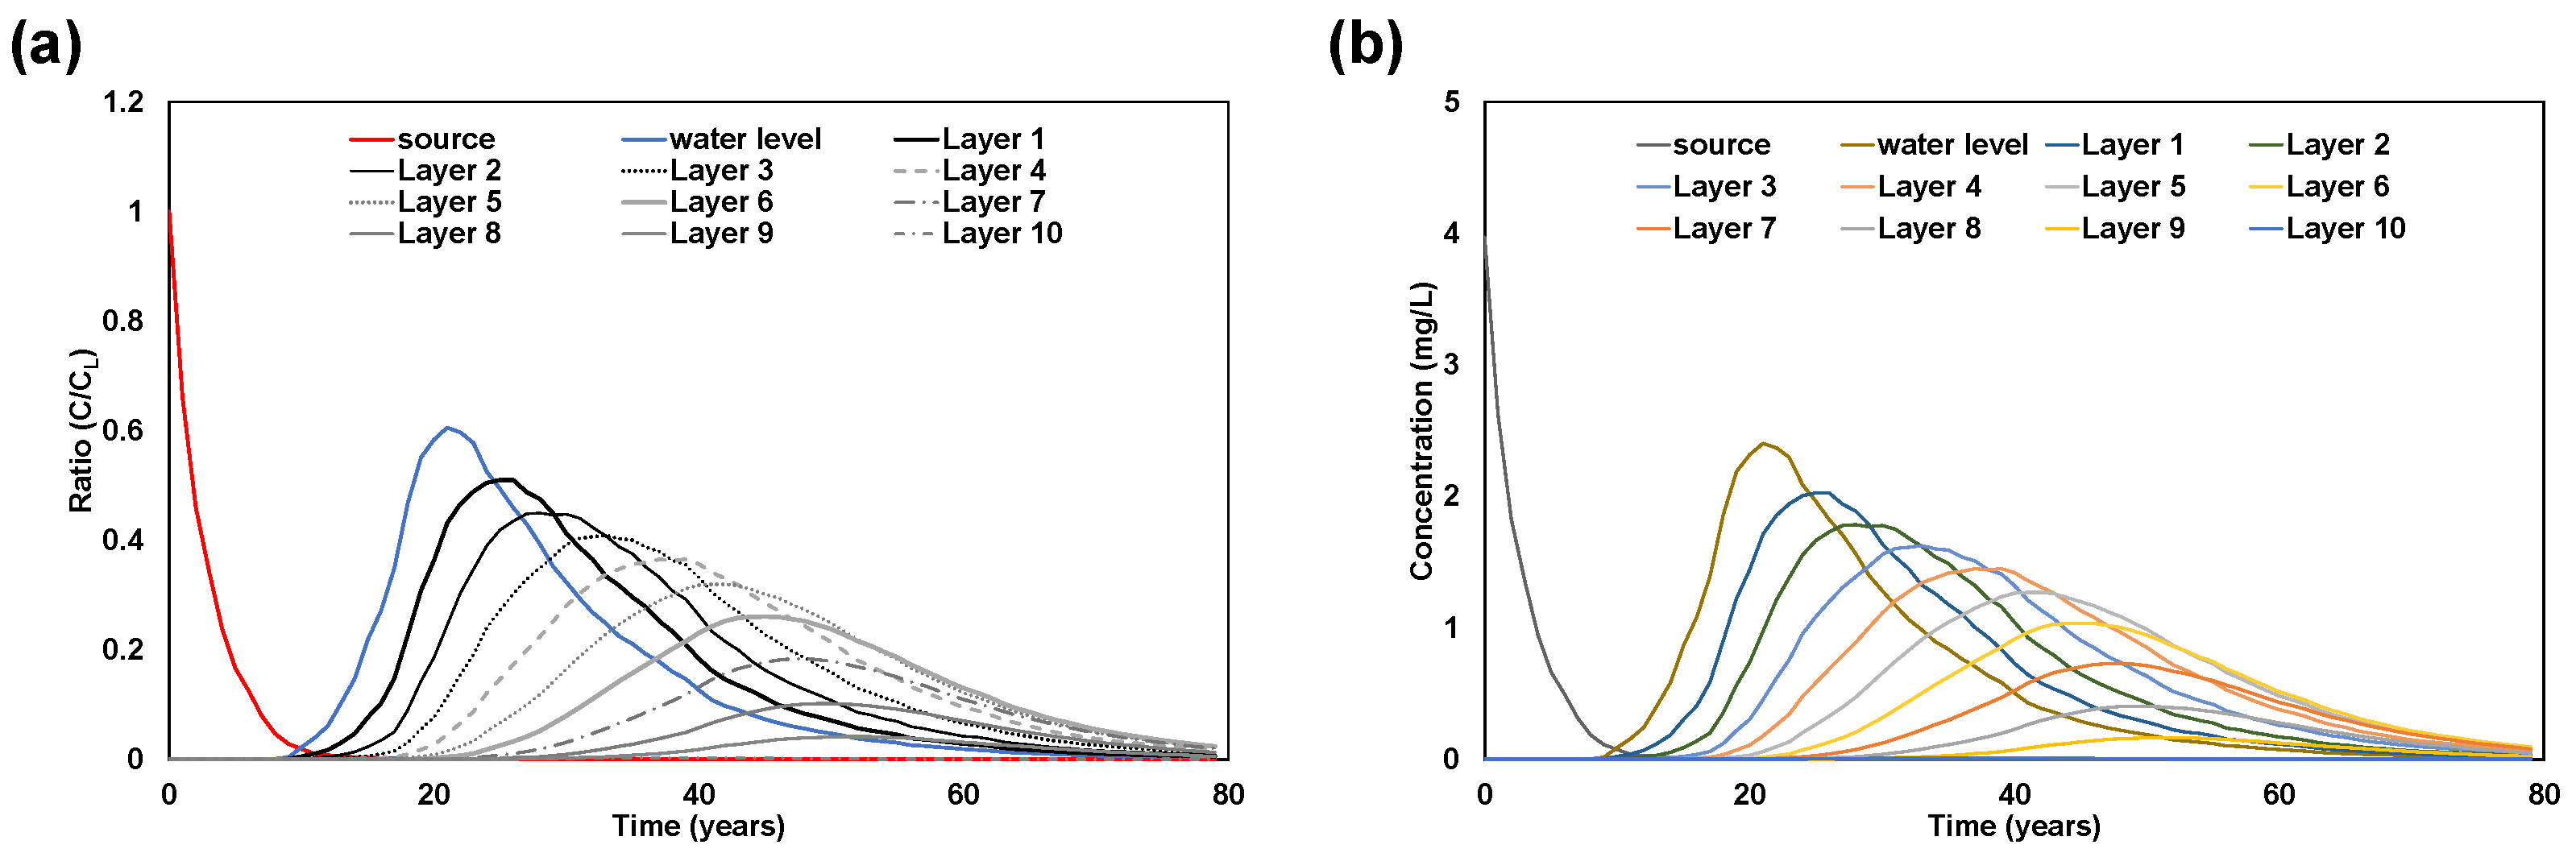
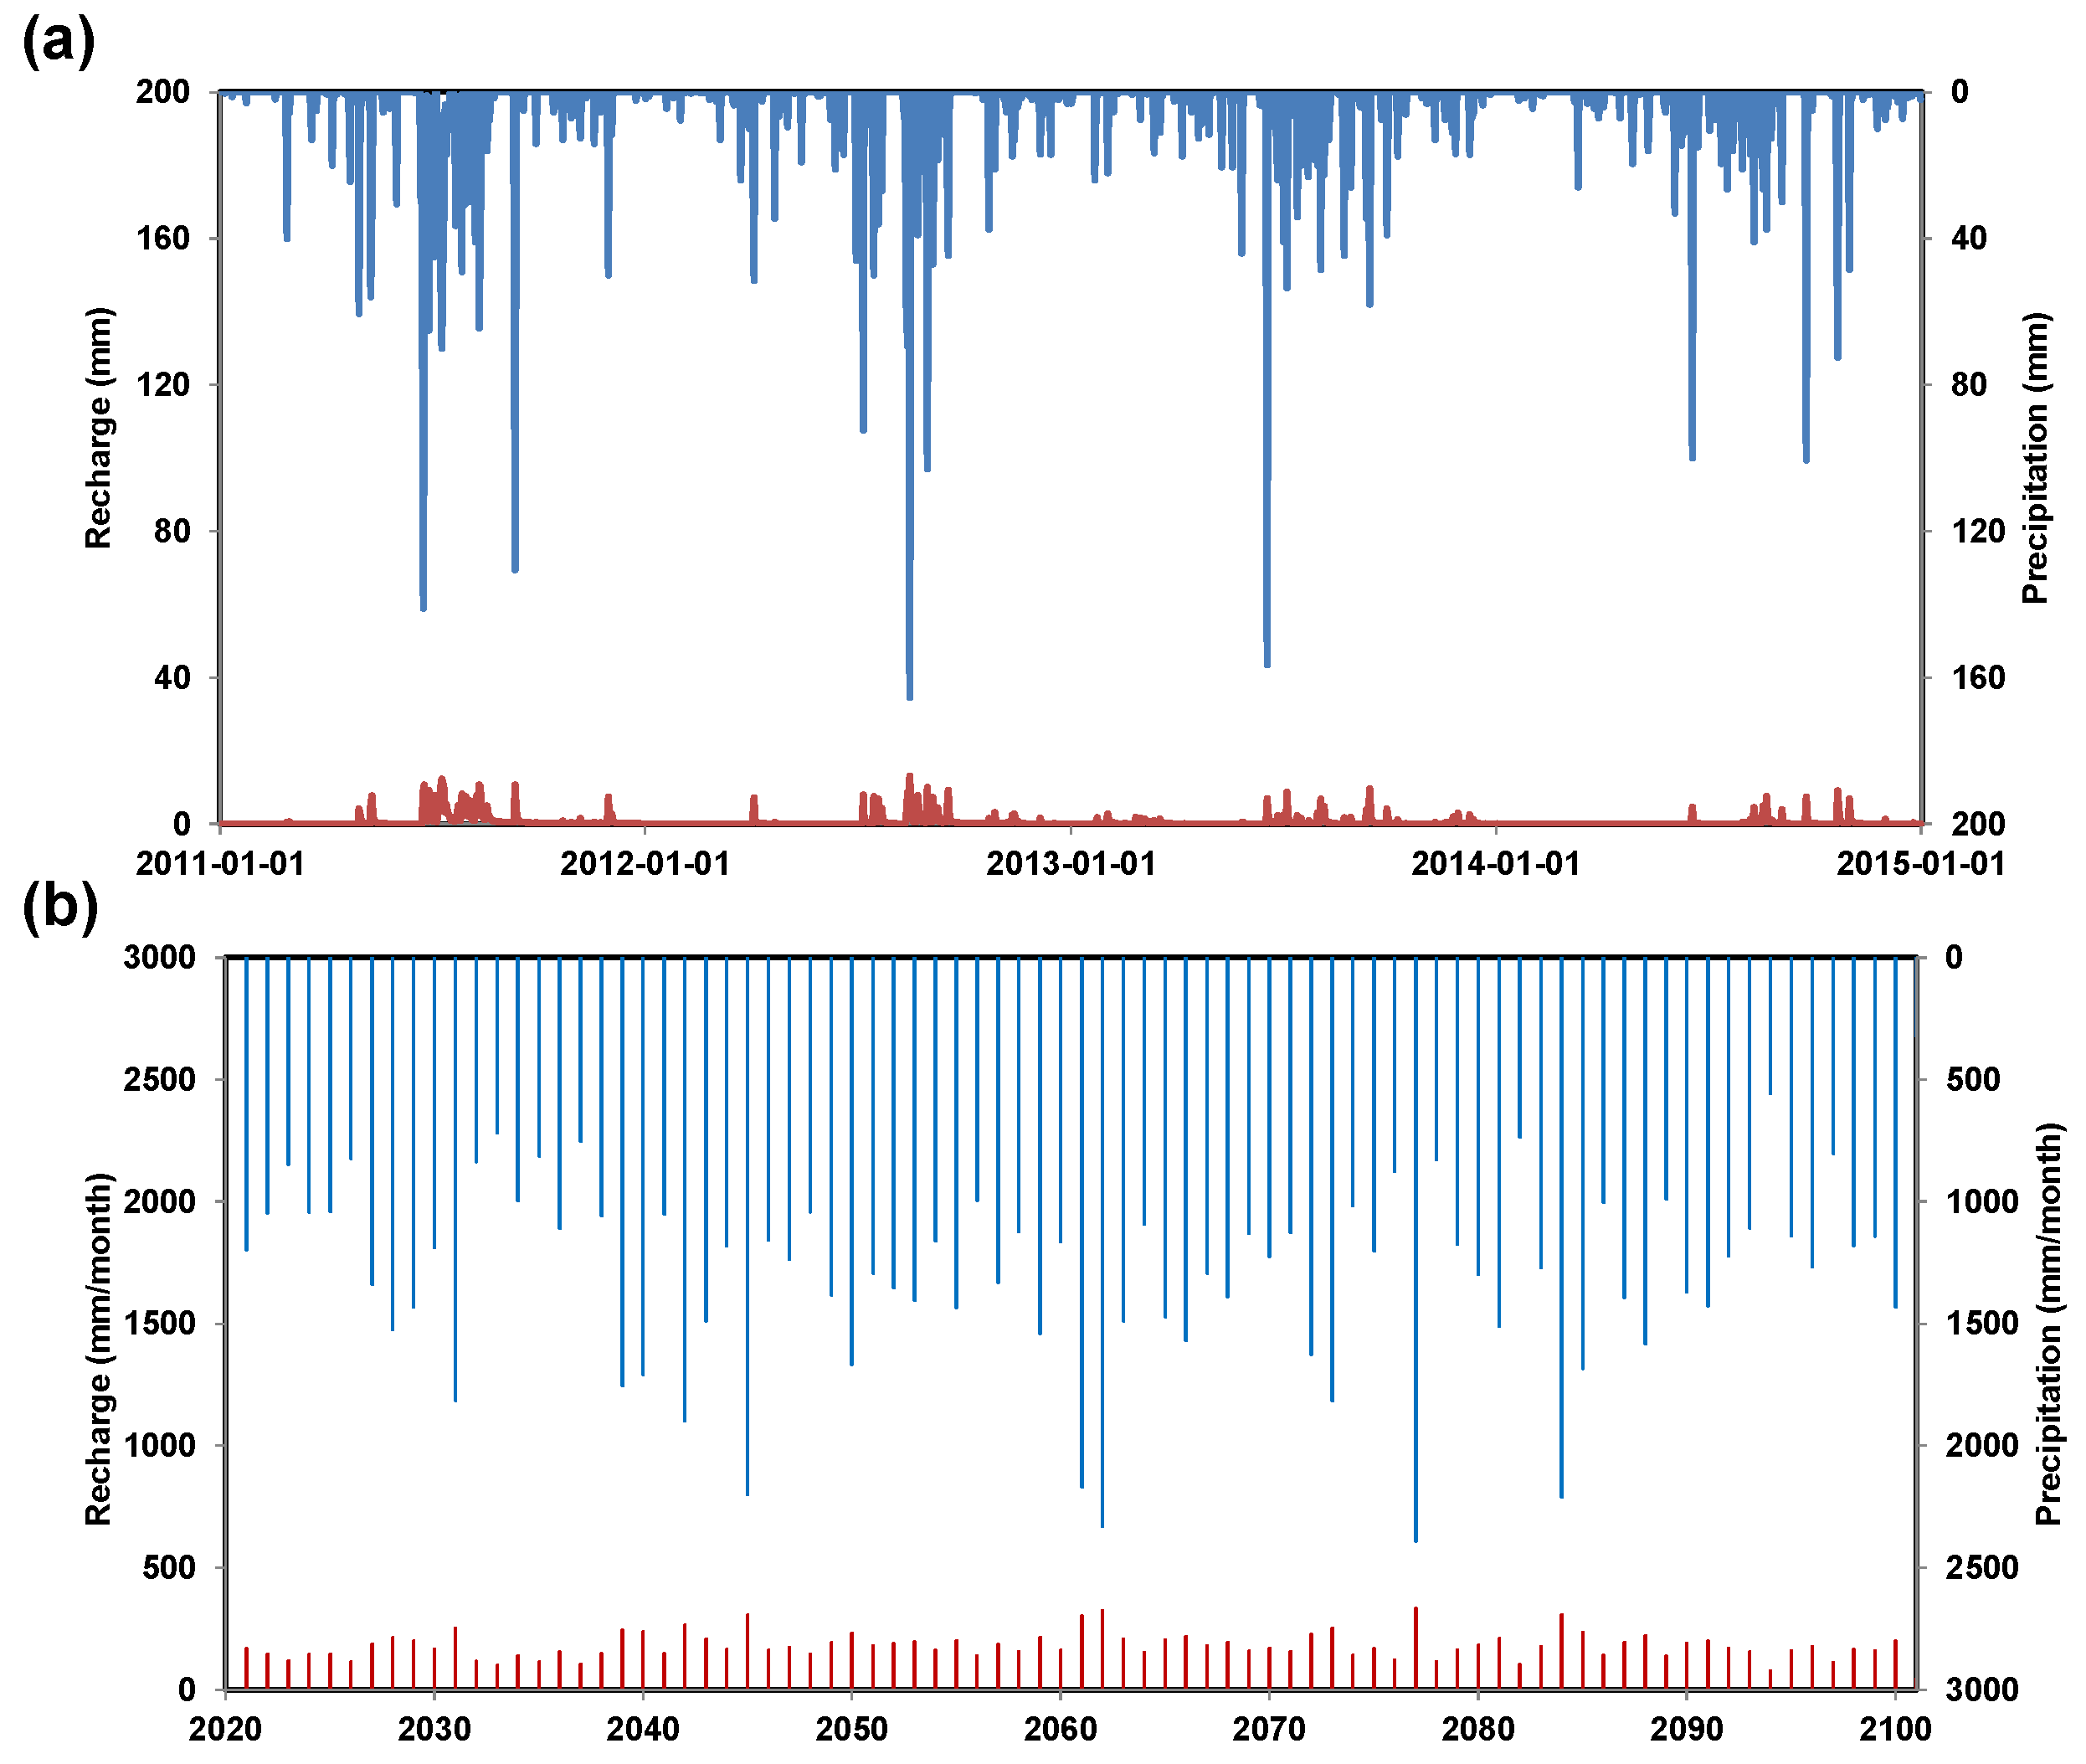
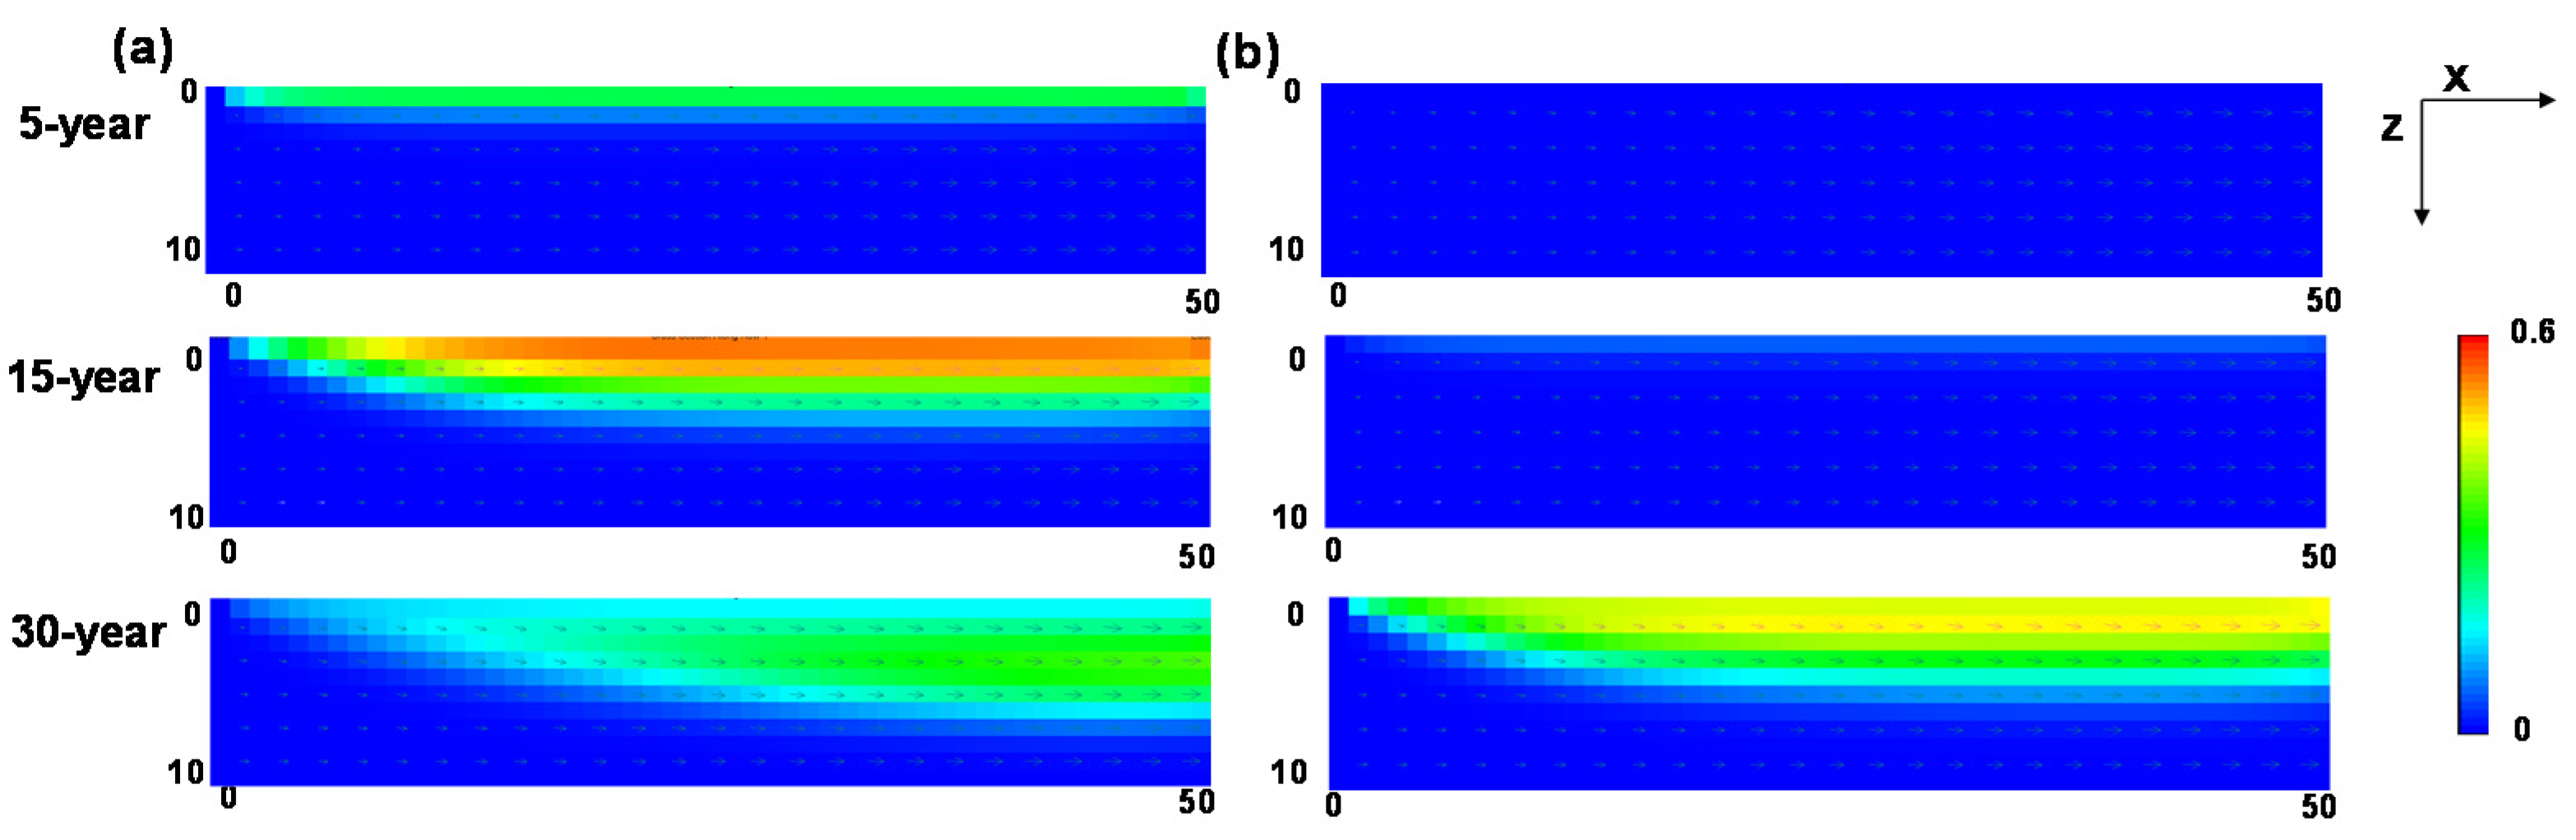
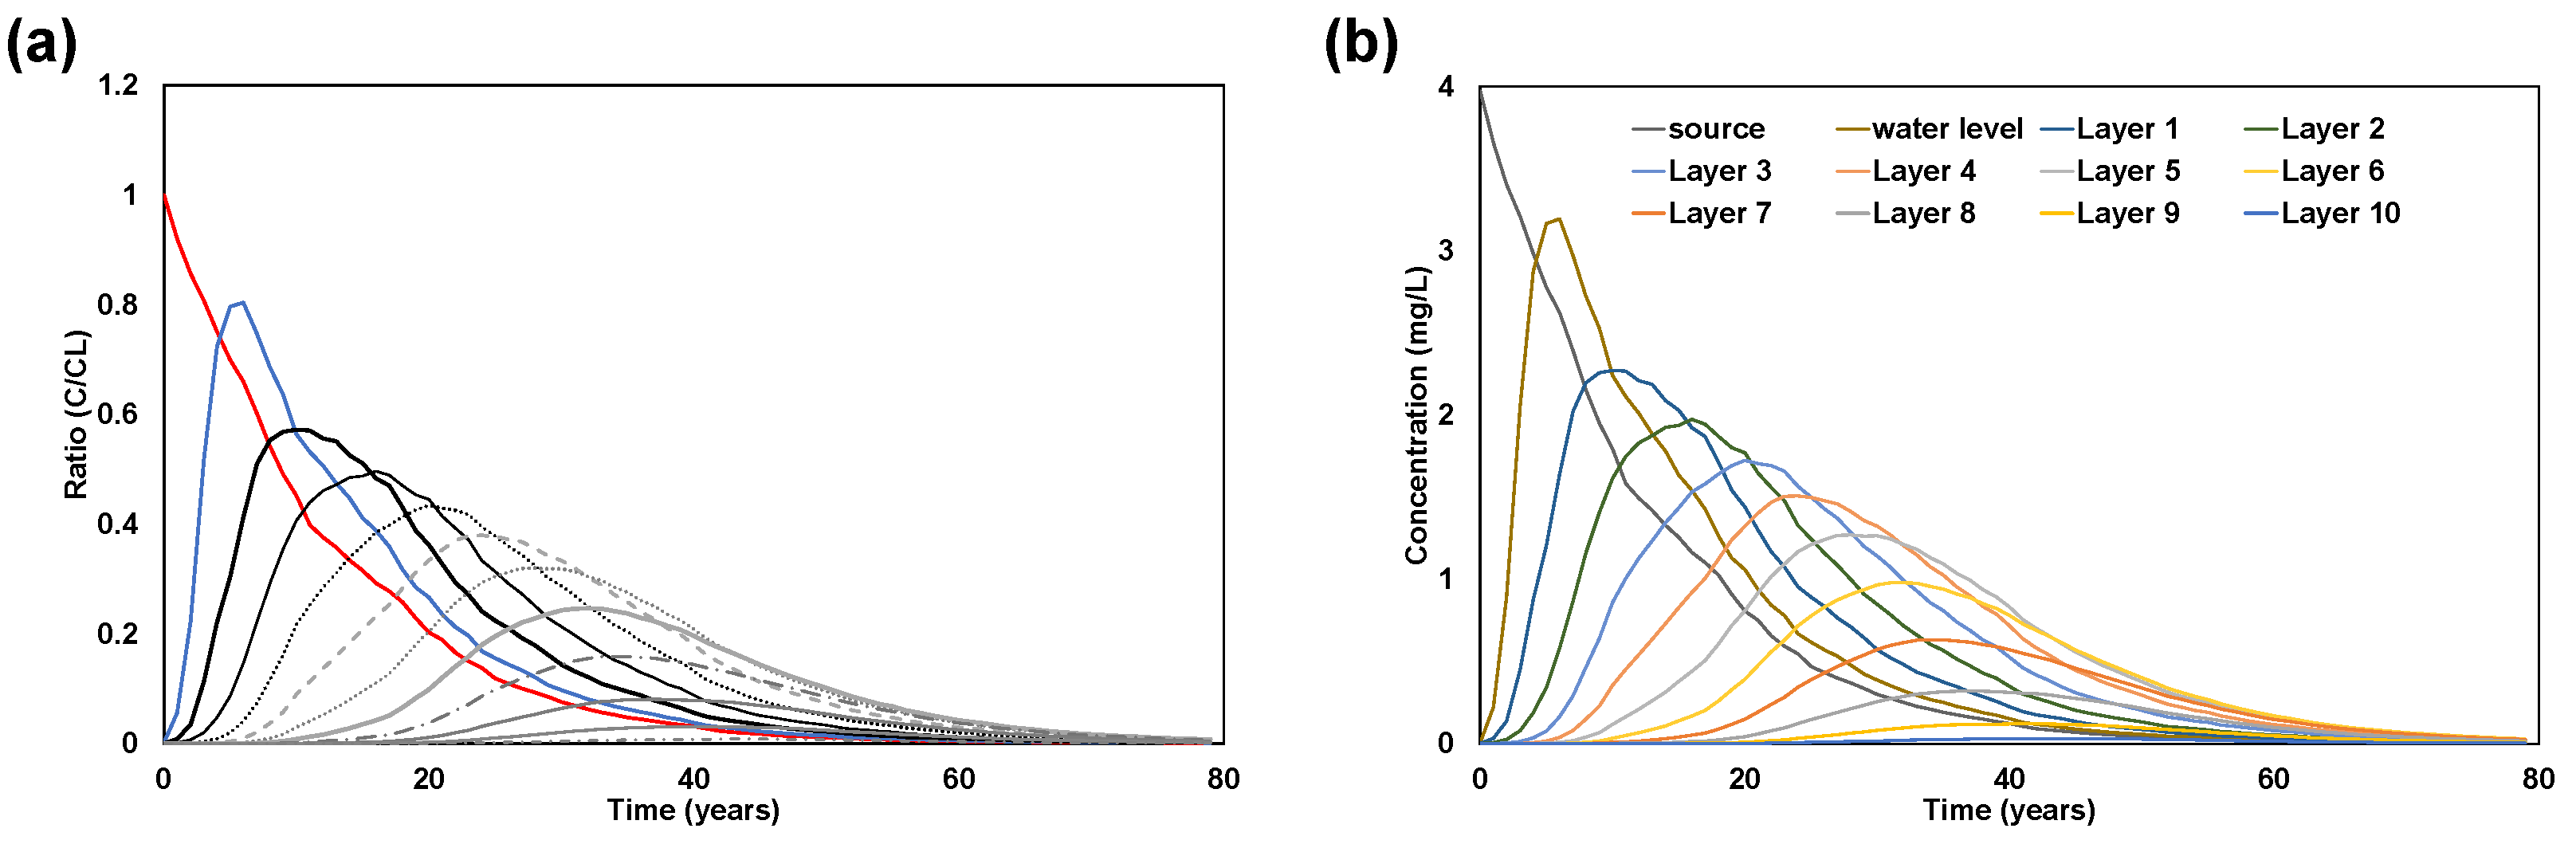
3.2. Case Study: Site Description and Simulation of the Benzene Pathway Using Hydrological Assessment

This study introduced the time-dependent varying infiltration rate to consider site-specific infiltration. The time-series pattern of site-specific infiltration rate was determined using the groundwater content of the area, and the method for calculating source depletion was explored. The study adopted the infiltration data from the previous study that investigated a test bed of Cheongju area, where the groundwater cultivation area was precisely calculated. Figure 7a shows the monthly temporal variation of precipitation and infiltration assessed by Chang and Chung [43] from January 2011 to January 2014 using a hydrological analysis tool, the SWAT model [42] developed by the USDA Agricultural Research Service (ARS), to simulate the groundwater stasis state. As input data for the SWAT model, meteorological data such as precipitation, temperature, wind speed, insolation, and relative humidity were used at the Cheongju Meteorological Observatory located in the Musimcheon Basin. The average amount of groundwater recharge in this area was estimated to be ≈13.9% of precipitation.
Figure 7b shows that precipitation from the Representative Concentration Pathway 4.5 (RCP 4.5) scenario, which is based on the Intergovernmental Panel on Climate Change (IPCC)’s Fifth Assessment Report (AR5), was applied as an 80-years future precipitation scenario from 2021 to 2100 (http://www.climate.go.kr/home/CCS/contents_new/33_2_areapoint_basic.php, accessed on 17 September 2021). Figure 7b also shows that the future effective infiltration was calculated by multiplying an 80-years RCP 4.5 precipitation scenario by the recharge rate, 13.9%. The impacts of climate change are not discussed, as they are beyond the scope of this study.
To examine the temporal change in concentrations at the exposure point through the pathways, Equations (4) and (5) were applied, assuming that the initial leachate concentration, C L ( 0 ) , is below the saturation concentration or solubility of the contaminant. Based on Equation (4), we expected that the leachate concentration may exponentially decrease over time. Therefore, the four periods were regarded as representative measurement points of the decay curve considering the log scale.
Figure 8 shows the model predicted results that simulated the plume of the contaminant in the saturation zone after reaching the water table through the unsaturated zone. The blue color indicates the concentration of contaminants as 0 and is shown in red when the relative concentration is 1. The graph shows the concentration distribution in the saturated zone after 5, 15, and 30 years of simulation. We observed that the plume moves to the right in the direction of the groundwater flow and simultaneously spreads vertically. The plume is in the form of a curved surface. It also shows a concentration level almost similar to the inflow concentration at the upper right boundary. In contrast, almost no solute concentration is present at the left and bottom sections, where the groundwater flows through the hydraulic gradient. The color near the bottom was blue, indicating that the concentration was maintained at a remarkably low level. Figure 8b shows a relatively smaller concentration when a higher depth of source and a longer distance of unsaturated zone are applied.
At the end of the simulation, the bottom indicates a relatively high concentration because benzene concentration from recharge through the vadose zone decreases over time.
Figure 9 shows the temporal profiles of source concentration, the concentration at the water table, and exposure point concentrations at different depths. The graph shows that the breakthrough curves are not smooth because of the seasonally varied infiltration that vertically flows toward the groundwater level. The top layer (layer 1) is most affected by precipitation fluctuation, and the curves get smoother approaching the bottom of the model. Source depletion decreases exponentially, and the concentration of the water table reaches its highest concentration about 10 years after leaching from the source. Contaminants introduced into saturated aquifer show a lower concentration while mixing with the existing freshwater, and the lower it goes, the lower the concentration. After 16 years, the concentration of layer 2 exceeds that of layer 1. After 20 years, layer 3 will exceed the concentrations of the upper layer. As observed in the plume movement of the model crosscut shown in Figure 8, the contaminant gradually moves down, and the recharge was introduced on the top layer at a low concentration after a certain time has elapsed. However, the lower layers after layer 6 show a gradually decreasing pattern as a whole because they are areas not affected by the contaminant’s travel path. Figure 9b is the expected concentration when the mass of the initial source was assumed to be 1 mg/kg.
Figure 10 showed that the delayed time and lower concentration after the contaminant traveled a longer distance from the top of the source to the water table in the unsaturated zone.

4. Conclusions

Risk-based management and assessment of contaminated sites is a way to evaluate the potential hazards of contaminants based on considering linkages between pollution sources, pathways, and receptors (i.e., human body or ecosystem) though measuring the probability of adverse events [44]. In addition, it makes the decisions for the cleanup of contaminated soil and sediment.
Sophisticated computational methods and site-specific data are important for increasing the reliability of risk assessment results and reducing uncertainty. Site-specific databases can be used as a basis for new site development, enabling mid to long-term risk prediction using existing remediation strategies without large-scale investments, providing a quantitative evaluation tool for long-term monitoring management.
This study emphasizes the importance of on-site investigation and site-specific risk assessment of contaminated sites. Risk-based analysis of numerical simulations of contaminants through the soil to groundwater determined the DAFs based on the geometry of contaminated sites. Conservative models, proposed in the ASTM-RBCA framework, assume steady-state leaching in the unsaturated zone, a constant leaching rate without reduction of the source, and mixing based on a mass-balance approach underneath the contaminated sites. The method established in this study considered temporal changes for leaching in the unsaturated zone, source depletion, and numerical model simulation with sophisticated boundary conditions underneath the contaminated sites. We considered the data that estimated 20 years recharge by SWAT in a sub-basin in Korea as an infiltration input of the numerical model. In addition, the reported recharge rate data collected from the national survey for the entire Korean peninsula were selected for the risk-based estimation of groundwater flow and transport. This approach enabled the narrowing of the possible range of uncertainty for the predicted spatial and temporal contaminant concentration profiles at the groundwater level. This study identified the approximate distribution of the infiltration rate in Korea. The case study also confirmed that this computing method we applied could be suitable for regional-scale investigation.
The current guidelines for risk assessment are sometimes believed to overestimate the risk of contaminants due to the conservative and safe assumptions adopted. However, as observed in the simulation results, different from the conservative assumption to be entirely mixed and diluted in the aquifer, the expected concentration from the saturated models showed time-dependent varying concentration at each depth.
This study illustrated the application of numerical analysis considering high-tiered risk-based assessment. The proposed application is simple, and only the distribution of the Korean infiltration values was identified. The distribution characteristics for other indicators should be identified. In particular, the distribution characteristics of the source depth and the distance between the groundwater level and the water source need to be further investigated in future studies. Additionally, the approximate theoretical results derived from this study should be validated against extensive field data with other organic contaminants. These proposed additional studies, as USEPA used algorithms to implement Monte Carlo simulations, can determine DAFs for unsaturated regions in Korea based on the development of appropriate and reasonable statistical analysis methods.

Author Contributions

Conceptualization, S.W.C. and I.-M.C.; methodology, S.W.C.; validation, J.C.J., H.S.M.; investigation, I.H.K. and S.W.C.; resources, J.C.J., H.S.M.; data curation, J.C.J., H.S.M.; writing—original draft preparation, S.W.C., I.H.K.; writing—review and editing, S.W.C. and I.-M.C.; visualization, I.H.K.; supervision, I.-M.C., H.S.M.; project administration, S.W.C., H.S.M.; funding acquisition, S.W.C., H.S.M. All authors have read and agreed to the published version of the manuscript.

Funding

This research was supported by a grant from the Development Program of Minimizing of Climate Change Impact Technology funded through the National Research Foundation of Korea (NRF) of the Korean government (Ministry of Science and ICT, Grant No. NRF-2020M3H5A1080735) and also supported partially by the Korea Environmental Industry & Technology Institute (KEITI) through the Subsurface Environment Management (SEM) Project funded by the Korea Ministry of Environment (MOE) (Grant No. 2018002450003 and 2018002450004).

Institutional Review Board Statement

Not applicable.

Informed Consent Statement

Not applicable.

Conflicts of Interest

The authors declare no conflict of interest.

References

  1. U.S. EPA. Soil Screening Guidance: User’s Guide; U.S. EPA. Office of Emergency and Remedial Response: Washington, DC, USA, 1996.
  2. U.S. EPA. Soil Screening Guidance: Technical Background Document; U.S. EPA. Office of Emergency and Remedial Response: Washington, DC, USA, 1996.
  3. ASTM. Standard Guide for Risk-Based Corrective Action, Standard E2081-00; American Society for Testing Materials: West Conshohocken, PA, USA, 2000; p. 95. [Google Scholar]
  4. Kechavarzi, C.; Soga, K.; Illangasekare, T.H. Two-dimensional laboratory simulation of LNAPL infiltration and redistribution in the vadose zone. J. Contam. Hydrol. 2005, 76, 211–233. [Google Scholar] [CrossRef] [PubMed]
  5. Amiaz, Y.; Sorek, S.; Enzel, Y.; Dahan, O. Solute transport in the vadose zone and groundwater during flash floods. Water Resour. Res. 2011, 47. [Google Scholar] [CrossRef]
  6. Diamantopoulos, E.; Šimůnek, J.; Oberdörster, C.; Hammel, K.; Jene, B.; Schröder, T.; Harter, T. Assessing the Potential Exposure of Groundwater to Pesticides: A Model Comparison. Vadose Zone J. 2017, 16, vzj2017.2004.0070. [Google Scholar] [CrossRef] [Green Version]
  7. Ravi, V.; Johnson, J.A. A One-Dimensional Finite Difference Vadose Zone Leaching Model. Version 2.2; U.S. EPA. Office of Research and Development: Redding, CA, USA, 1997.
  8. Suk, H.-J.; Chae, B.-G. Analytical Solution of Multi-species Transport Equations Coupled with a First-order Reaction Network Under Various Boundary Conditions. J. Soil Groundw. Environ. 2011, 16, 46–57. [Google Scholar] [CrossRef]
  9. Jang, W.; Aral, M.M. Density-driven Transport of Volatile Organic Compounds and its Impact on Contaminated Groundwater Plume Evolution. Transp. Porous Media 2007, 67, 353–374. [Google Scholar] [CrossRef]
  10. Rivett, M.O.; Wealthall, G.P.; Dearden, R.A.; McAlary, T.A. Review of unsaturated-zone transport and attenuation of volatile organic compound (VOC) plumes leached from shallow source zones. J. Contam. Hydrol. 2011, 123, 130–156. [Google Scholar] [CrossRef] [PubMed]
  11. Köhne, J.M.; Köhne, S.; Šimůnek, J. A review of model applications for structured soils: A) Water flow and tracer transport. J. Contam. Hydrol. 2009, 104, 4–35. [Google Scholar] [CrossRef]
  12. Oostrom, M.; Truex, M.J.; Carroll, K.C.; Chronister, G.B. Perched-water analysis related to deep vadose zone contaminant transport and impact to groundwater. J. Hydrol. 2013, 505, 228–239. [Google Scholar] [CrossRef]
  13. Šimůnek, J.; Jarvis, N.J.; van Genuchten, M.T.; Gärdenäs, A. Review and comparison of models for describing non-equilibrium and preferential flow and transport in the vadose zone. J. Hydrol. 2003, 272, 14–35. [Google Scholar] [CrossRef]
  14. Sookhak Lari, K.; Davis, G.B.; Rayner, J.L.; Bastow, T.P.; Puzon, G.J. Natural source zone depletion of LNAPL: A critical review supporting modelling approaches. Water Res. 2019, 157, 630–646. [Google Scholar] [CrossRef] [PubMed]
  15. Essaid, H.I.; Bekins, B.A.; Cozzarelli, I.M. Organic contaminant transport and fate in the subsurface: Evolution of knowledge and understanding. Water Resour. Res. 2015, 51, 4861–4902. [Google Scholar] [CrossRef]
  16. Dobson, R.; Schroth, M.H.; Oostrom, M.; Zeyer, J. Determination of NAPL−Water Interfacial Areas in Well-Characterized Porous Media. Environ. Sci. Technol. 2006, 40, 815–822. [Google Scholar] [CrossRef] [PubMed]
  17. Luciano, A.; Mancini, G.; Torretta, V.; Viotti, P. An empirical model for the evaluation of the dissolution rate from a DNAPL-contaminated area. Environ. Sci. Pollut. Res. 2018, 25, 33992–34004. [Google Scholar] [CrossRef] [PubMed]
  18. Luciano, A.; Viotti, P.; Papini, M.P. On Morphometric Properties of DNAPL Sources: Relating Architecture to Mass Reduction. Water Air Soil Pollut. 2012, 223, 2849–2864. [Google Scholar] [CrossRef]
  19. Dobson, R.; Schroth, M.H.; Zeyer, J. Effect of water-table fluctuation on dissolution and biodegradation of a multi-component, light nonaqueous-phase liquid. J. Contam. Hydrol. 2007, 94, 235–248. [Google Scholar] [CrossRef] [PubMed]
  20. Teramoto, E.H.; Chang, H.K. Field data and numerical simulation of btex concentration trends under water table fluctuations: Example of a jet fuel-contaminated site in Brazil. J. Contam. Hydrol. 2017, 198, 37–47. [Google Scholar] [CrossRef] [Green Version]
  21. Legout, C.; Molenat, J.; Aquilina, L.; Gascuel-Odoux, C.; Faucheux, M.; Fauvel, Y.; Bariac, T. Solute transfer in the unsaturated zone-groundwater continuum of a headwater catchment. J. Hydrol. 2007, 332, 427–441. [Google Scholar] [CrossRef]
  22. Silliman, S.E.; Berkowitz, B.; Simunek, J.; van Genuchten, M.T. Fluid flow and solute migration within the capillary fringe. Ground Water 2002, 40, 76–84. [Google Scholar] [CrossRef]
  23. Haberer, C.M.; Rolle, M.; Liu, S.; Cirpka, O.A.; Grathwohl, P. A high-resolution non-invasive approach to quantify oxygen transport across the capillary fringe and within the underlying groundwater. J. Contam. Hydrol. 2011, 122, 26–39. [Google Scholar] [CrossRef]
  24. Verginelli, I.; Baciocchi, R. Role of natural attenuation in modeling the leaching of contaminants in the risk analysis framework. J. Environ. Manag. 2013, 114, 395–403. [Google Scholar] [CrossRef]
  25. Ryu, H. Development of Realistic Risk Assessment Framework for Organic Contaminants Incorporating Desoption-Limited Bioavailability and Dilution Attenuation Factors. Ph.D. Dissertation, Seoul National University, Seoul, Korea, 2010. [Google Scholar]
  26. Li, J.; Xi, B.; Cai, W.; Yang, Y.; Jia, Y.; Li, X.; Lv, Y.; Lv, N.; Huan, H.; Yang, J. Identification of dominating factors affecting vadose zone vulnerability by a simulation method. Sci. Rep. 2017, 7, 45955. [Google Scholar] [CrossRef] [PubMed] [Green Version]
  27. Mazzieri, F.; Di Sante, M.; Fratalocchi, E.; Pasqualini, E. Modeling contaminant leaching and transport to groundwater in Tier 2 risk assessment procedures of contaminated sites. Environ. Earth Sci. 2016, 75, 1247. [Google Scholar] [CrossRef]
  28. Stoppiello, M.G.; Lofrano, G.; Carotenuto, M.; Viccione, G.; Guarnaccia, C.; Cascini, L. A Comparative Assessment of Analytical Fate and Transport Models of Organic Contaminants in Unsaturated Soils. Sustainability 2020, 12, 2949. [Google Scholar] [CrossRef] [Green Version]
  29. Park, K.S.; Sims, R.C.; Dupont, R.R.; Doucette, W.J.; Matthews, J.E. Fate of PAH compounds in two soil types: Influence of volatilization, abiotic loss and biological activity. Environ. Toxicol. Chem. 1990, 9, 187–195. [Google Scholar] [CrossRef]
  30. Freitas, J.G.; Barker, J.F. Oxygenated gasoline release in the unsaturated zone—Part 1: Source zone behavior. J. Contam. Hydrol. 2011, 126, 153–166. [Google Scholar] [CrossRef]
  31. Feenstra, S.; Mackay, D.M.; Cherry, J.A. A Method for Assessing Residual NAPL Based on Organic Chemical Concentrations in Soil Samples. Groundw. Monit. Remediat. 1991, 11, 128–136. [Google Scholar] [CrossRef]
  32. Garg, S.; Newell, C.J.; Kulkarni, P.R.; King, D.C.; Adamson, D.T.; Renno, M.I.; Sale, T. Overview of Natural Source Zone Depletion: Processes, Controlling Factors, and Composition Change. Groundw. Monit. Remediat. 2017, 37, 62–81. [Google Scholar] [CrossRef] [Green Version]
  33. Mackay, D.; Hathaway, E.; de Sieyes, N.; Zhang, H.; Rasa, E.; Paradis, C.; Schmidt, R.; Peng, J.; Buscheck, T.; Sihota, N. Comparing Natural Source Zone Depletion Pathways at a Fuel Release Site. Groundw. Monit. Remediat. 2018, 38, 24–39. [Google Scholar] [CrossRef]
  34. Park, E.; Parker, J.C. A simple model for water table fluctuations in response to precipitation. J. Hydrol. 2008, 356, 344–349. [Google Scholar] [CrossRef]
  35. Chang, S.W.; Kim, M.-G.; Chung, I.-M. Numerical Study of Contaminant Pathway based on Generic-scenarios and Contaminant-based Scenarios of Vadose Zone. KSCE J. Civ. Environ. Eng. Res. 2019, 39, 8. [Google Scholar]
  36. MOE. Soil Contamination Risk Aseessment Guildeline; Ministry of Environment: Sejong, Korea, 2006.
  37. Khan, F.I.; Husain, T. Risk-based monitored natural attenuation—A case study. J. Hazard. Mater. 2001, 85, 243–272. [Google Scholar] [CrossRef]
  38. MOE. National Groundwater Information Center. Available online: http://www.gims.go.kr (accessed on 2 September 2021).
  39. RCS. Hydrology: National Engineering handbook, Part 630 (Hydrology); USDA Soil Conservation Service: Washington, DC, USA, 2010.
  40. Healy, R.W.; Cook, P.G. Using groundwater levels to estimate recharge. Hydrogeol. J. 2002, 10, 91–109. [Google Scholar] [CrossRef]
  41. Park, E. Delineation of recharge rate from a hybrid water table fluctuation method. Water Resour. Res. 2012, 48. [Google Scholar] [CrossRef]
  42. Arnold, J.G.; Fohrer, N. SWAT2000: Current capabilities and research opportunities in applied watershed modelling. Hydrol. Processes 2005, 19, 563–572. [Google Scholar] [CrossRef]
  43. Chang, S.W.; Chung, I.-M. Analysis of Groudwater Budget in a Water Curtain Cultivation Site. J. Korean Soc. Civ. Eng. 2015, 35, 1259–1267. [Google Scholar] [CrossRef]
  44. About Risk Assessment. Available online: https://www.epa.gov/risk/about-risk-assessment (accessed on 6 October 2021).
Figure 1. Flowchart for risk-based fate and transport simulations at contaminated sites.
Water 13 03646 g001
Figure 2. Schematic diagram for a contaminated site considering fate and transport in the unsaturated zone and the saturated aquifer underneath the source zone.
Water 13 03646 g002
Figure 3. Spatial map of the (a) precipitation, (b) recharge, and (c) recharge rate estimated based on Korean surveys conducted from 1997 to 2020.
Water 13 03646 g003
Figure 4. Histogram of the (a) precipitation, (b) recharge, and (c) recharge rate estimated surveyed in Korea, conducted from 1997 to 2020.
Water 13 03646 g004
Figure 5. Maximum concentrations to reach the groundwater level using source depths from 1 to 5 m and distances from 1 to 10 m for the soil-to-groundwater pathway.
Water 13 03646 g005
Figure 6. Probability distribution of DAFunsat for a function of source depth, D, and distance from the top to the groundwater level, L.
Water 13 03646 g006
Figure 7. Comparison between estimated recharge (red line) and precipitation (blue line) for (a) validated daily recharge data (modified from Chang and Chung [43]) and (b) future annual precipitation and recharge scenario based on RCP 4.5.
Water 13 03646 g007
Figure 8. Model simulated results for the fate and transport of benzene in the saturated aquifer for (a) L = 1 m and D = 5 m, (b) L = 5 m and D = 1 m.
Water 13 03646 g008
Figure 9. Temporal profile of source depletion, BTC at groundwater level and exposure concentration (L = 1 m, D = 5 m) expressed in (a) relative concentration compared to leaching concentration from source and (b) concentration for 1 mg/kg of initial source mass considered.
Water 13 03646 g009
Figure 10. Temporal profile of source depletion, breakthrough curves (BTCs) at groundwater level, and exposure concentration (L = 5 m, D = 1 m) expressed in (a) relative concentration compared to leaching concentration from source and (b) concentration for 1 mg/kg of initial source mass considered.
Water 13 03646 g010
Table 1. Summary of the model input parameters and default values.
Input ParameterSymbolUnitDefault ValuesReference
Distance between the bottom of the source and water tableLm
Thickness of the contaminant sourceDm
Effective infiltrationi
Total porosity θ -0.396MOE [36]
Volumetric water content θ w 0.16MOE [36]
Volumetric air content θ a 0.236MOE [36]
Soil bulk densityρbg/cm31.57MOE [36]
Fraction of organic carbon in soilfoc-0.002MOE [36]
Distribution coefficient of benzeneKOCL/kg62EPA [2]
Henry’s law constantH 0.228EPA [2]
First-order decay (reaction) coefficient λ 0
Groundwater hydraulic gradient h x 0.01
Publisher’s Note: MDPI stays neutral with regard to jurisdictional claims in published maps and institutional affiliations.

