
Characteristics of Beaver Ponds and Landforms Induced by Beaver Activity, S Part of the Tuchola Pinewoods, Poland


Abstract
1. Introduction
2. Materials and Methods
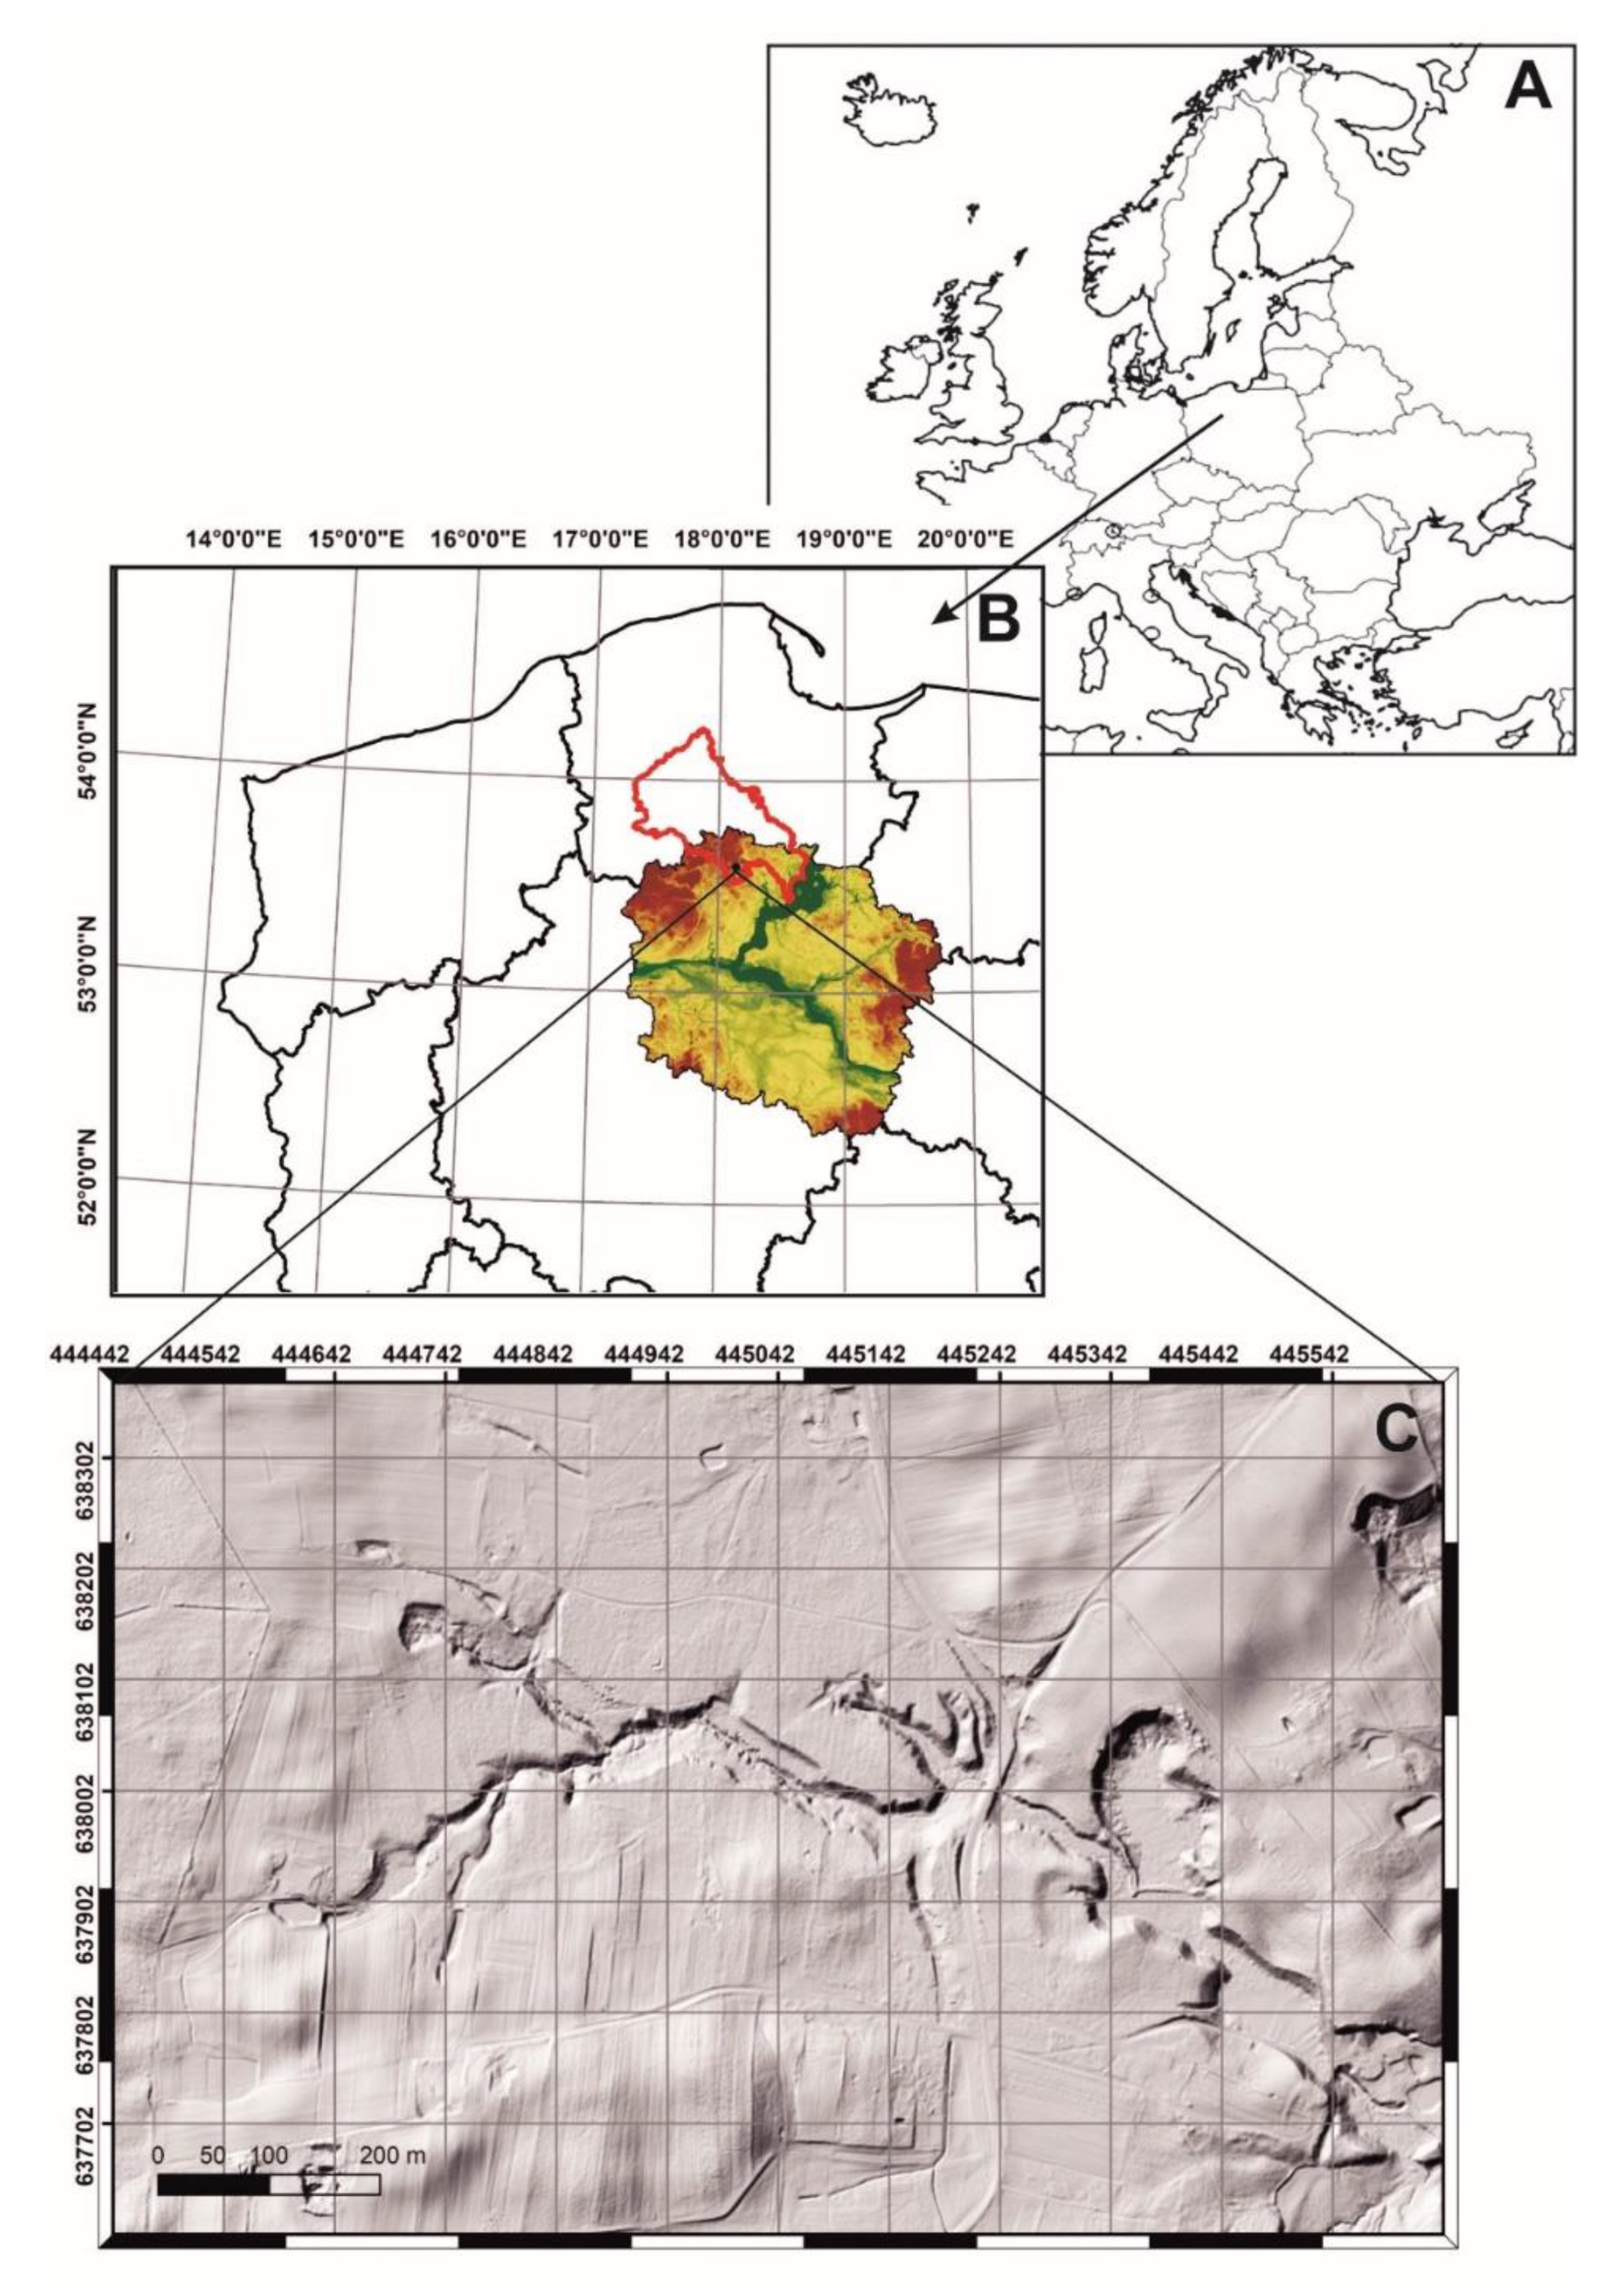
2.1. Study Area
2.2. Methods—Field and Desk Study
3. Results
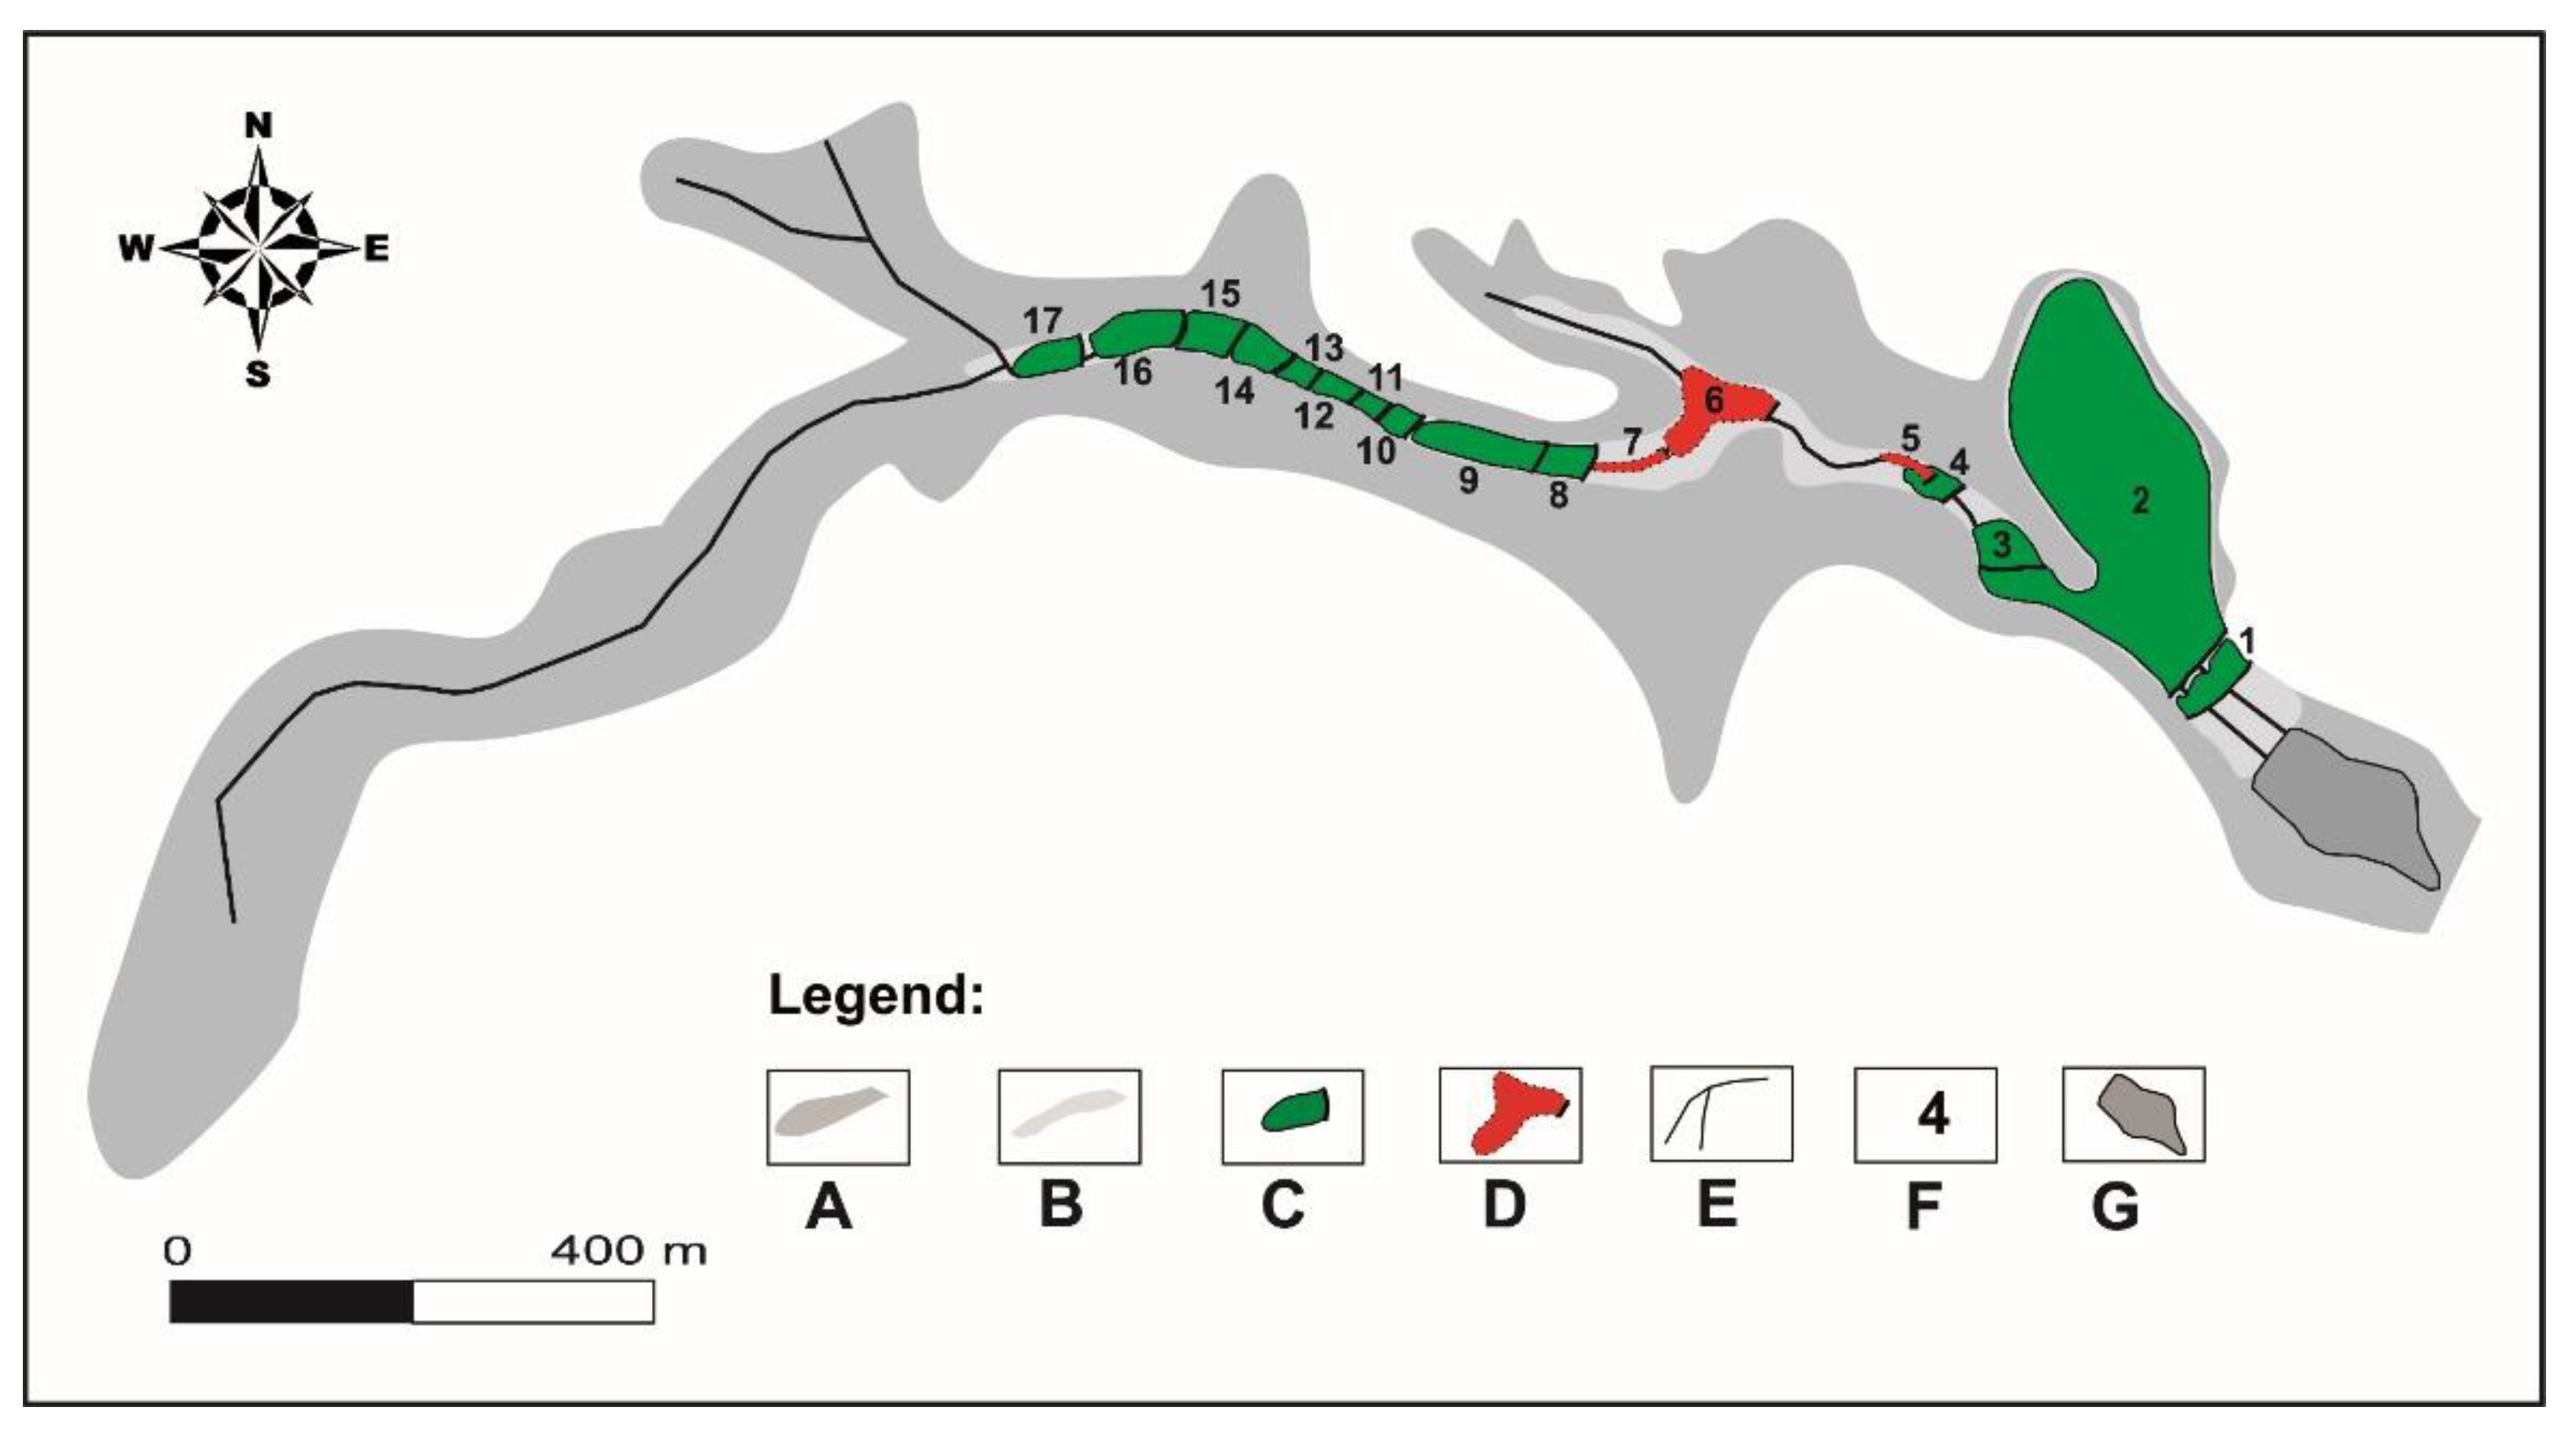
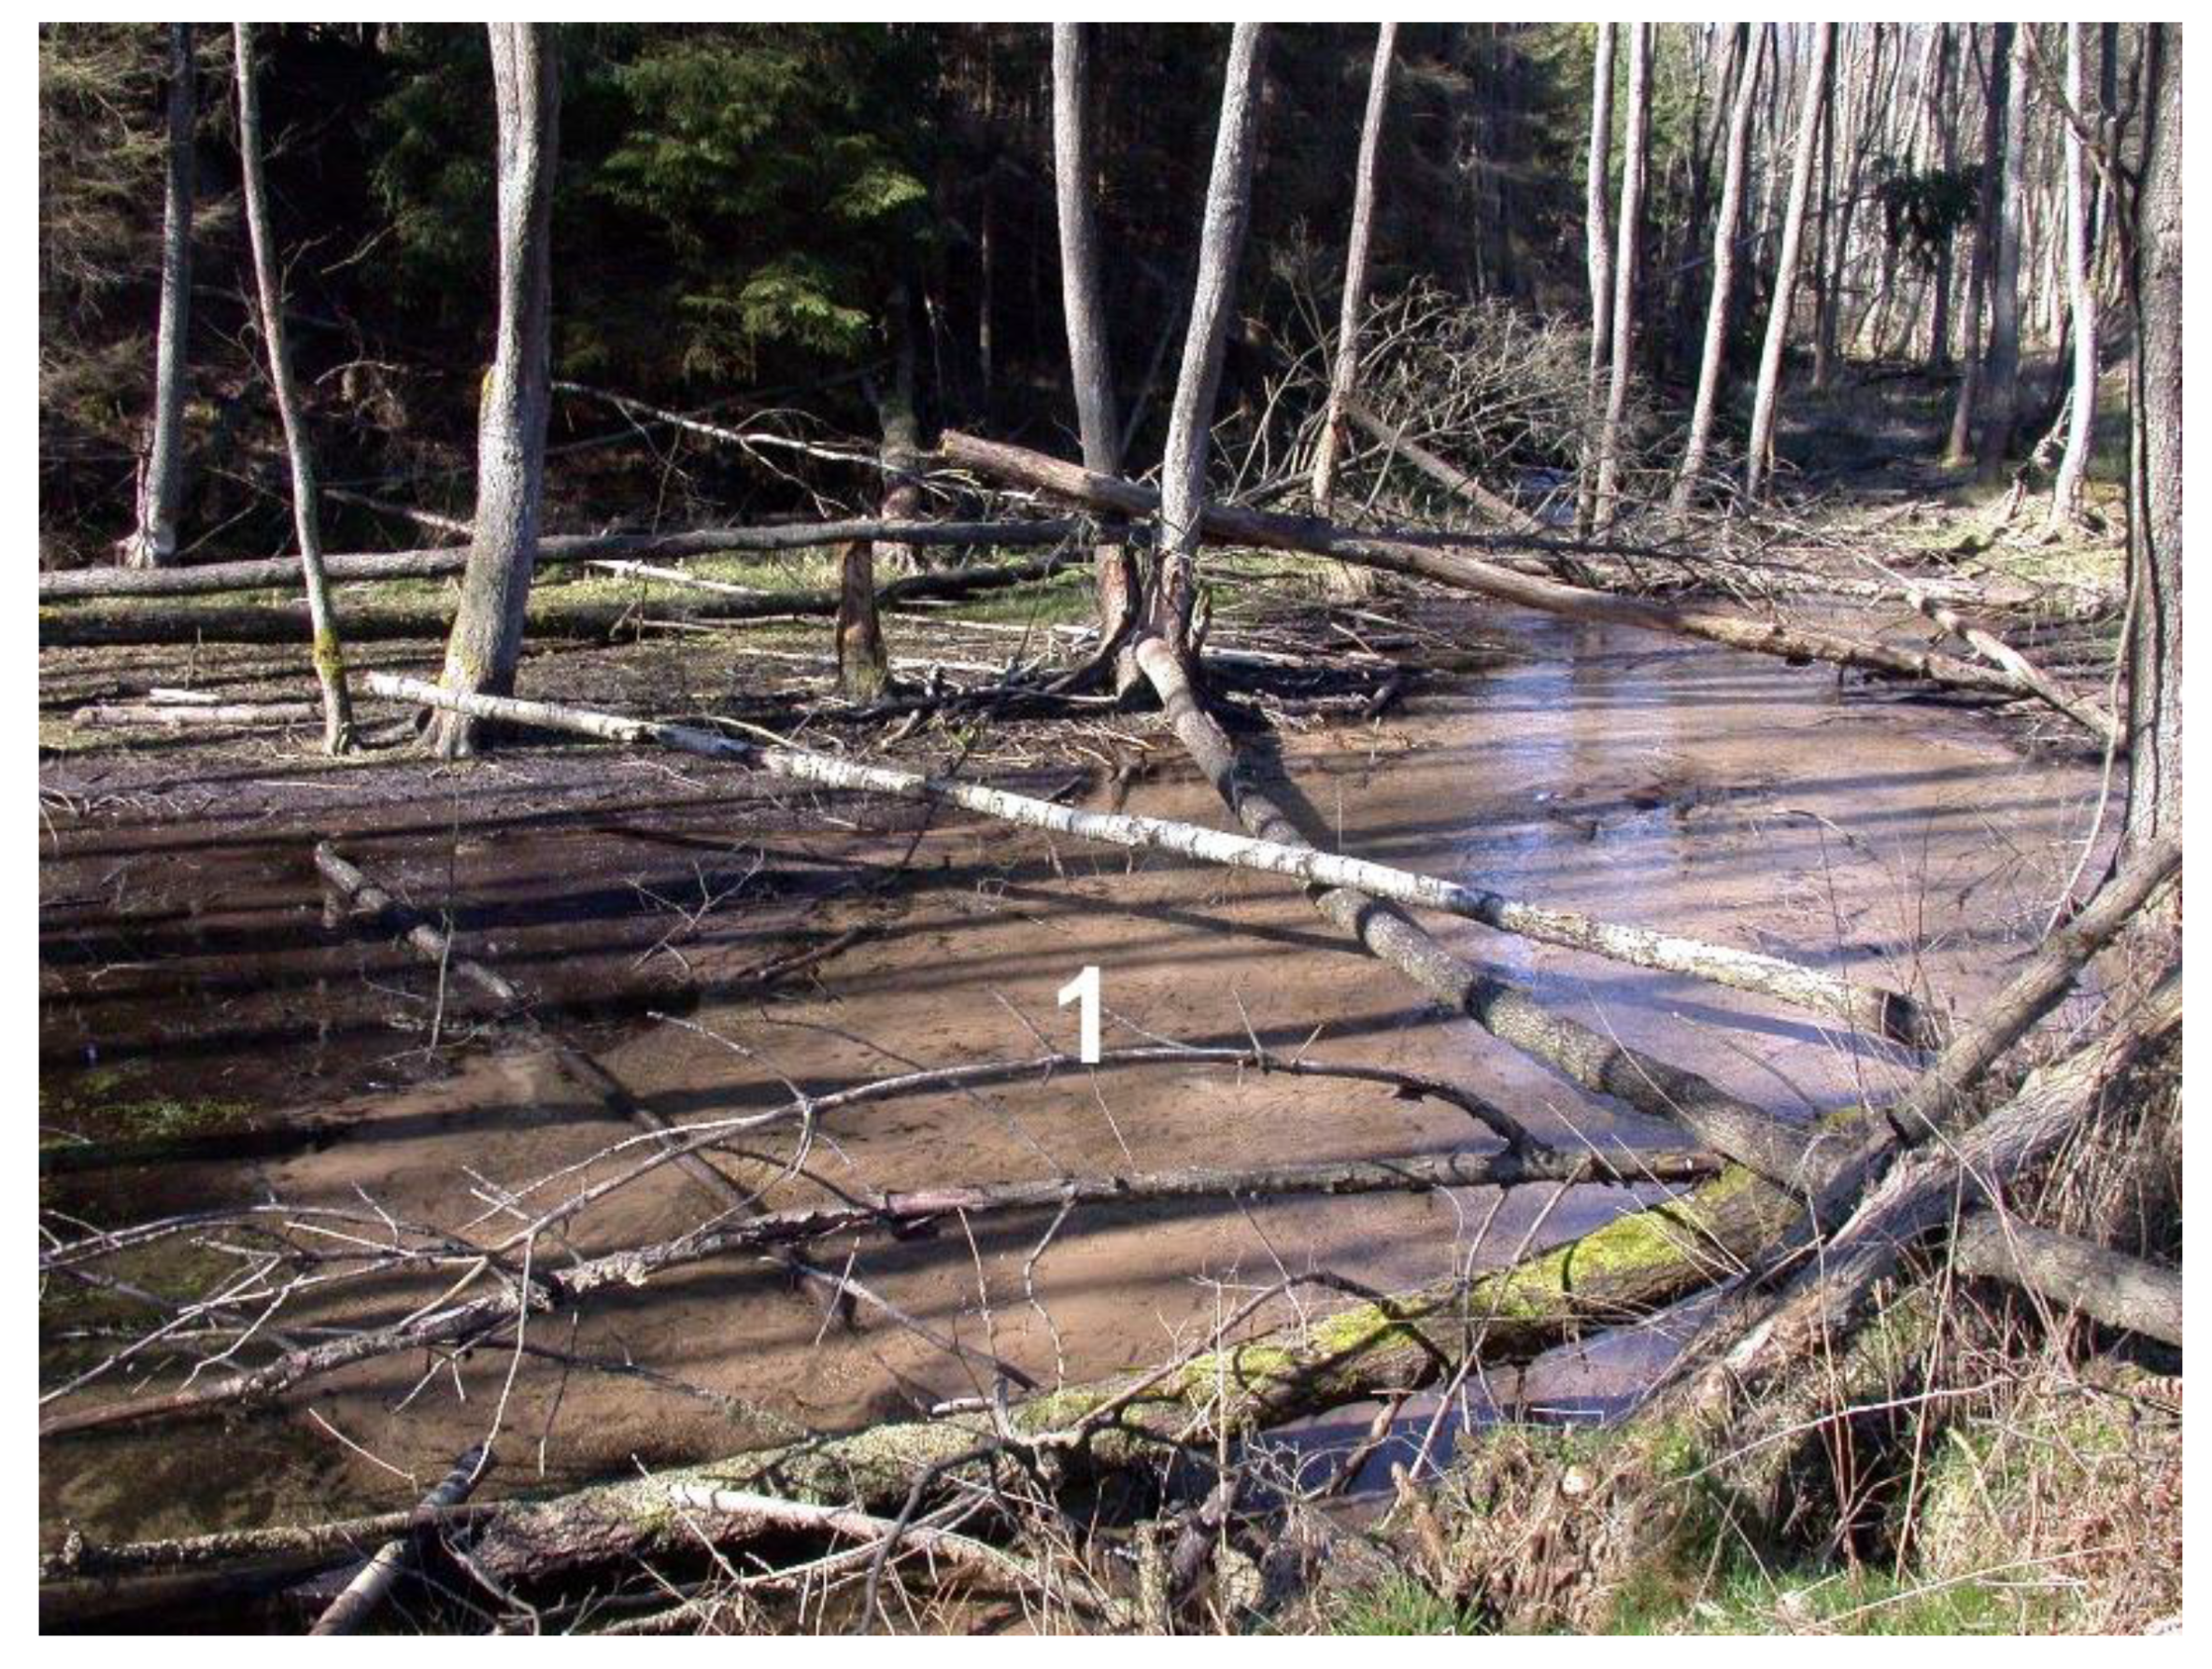
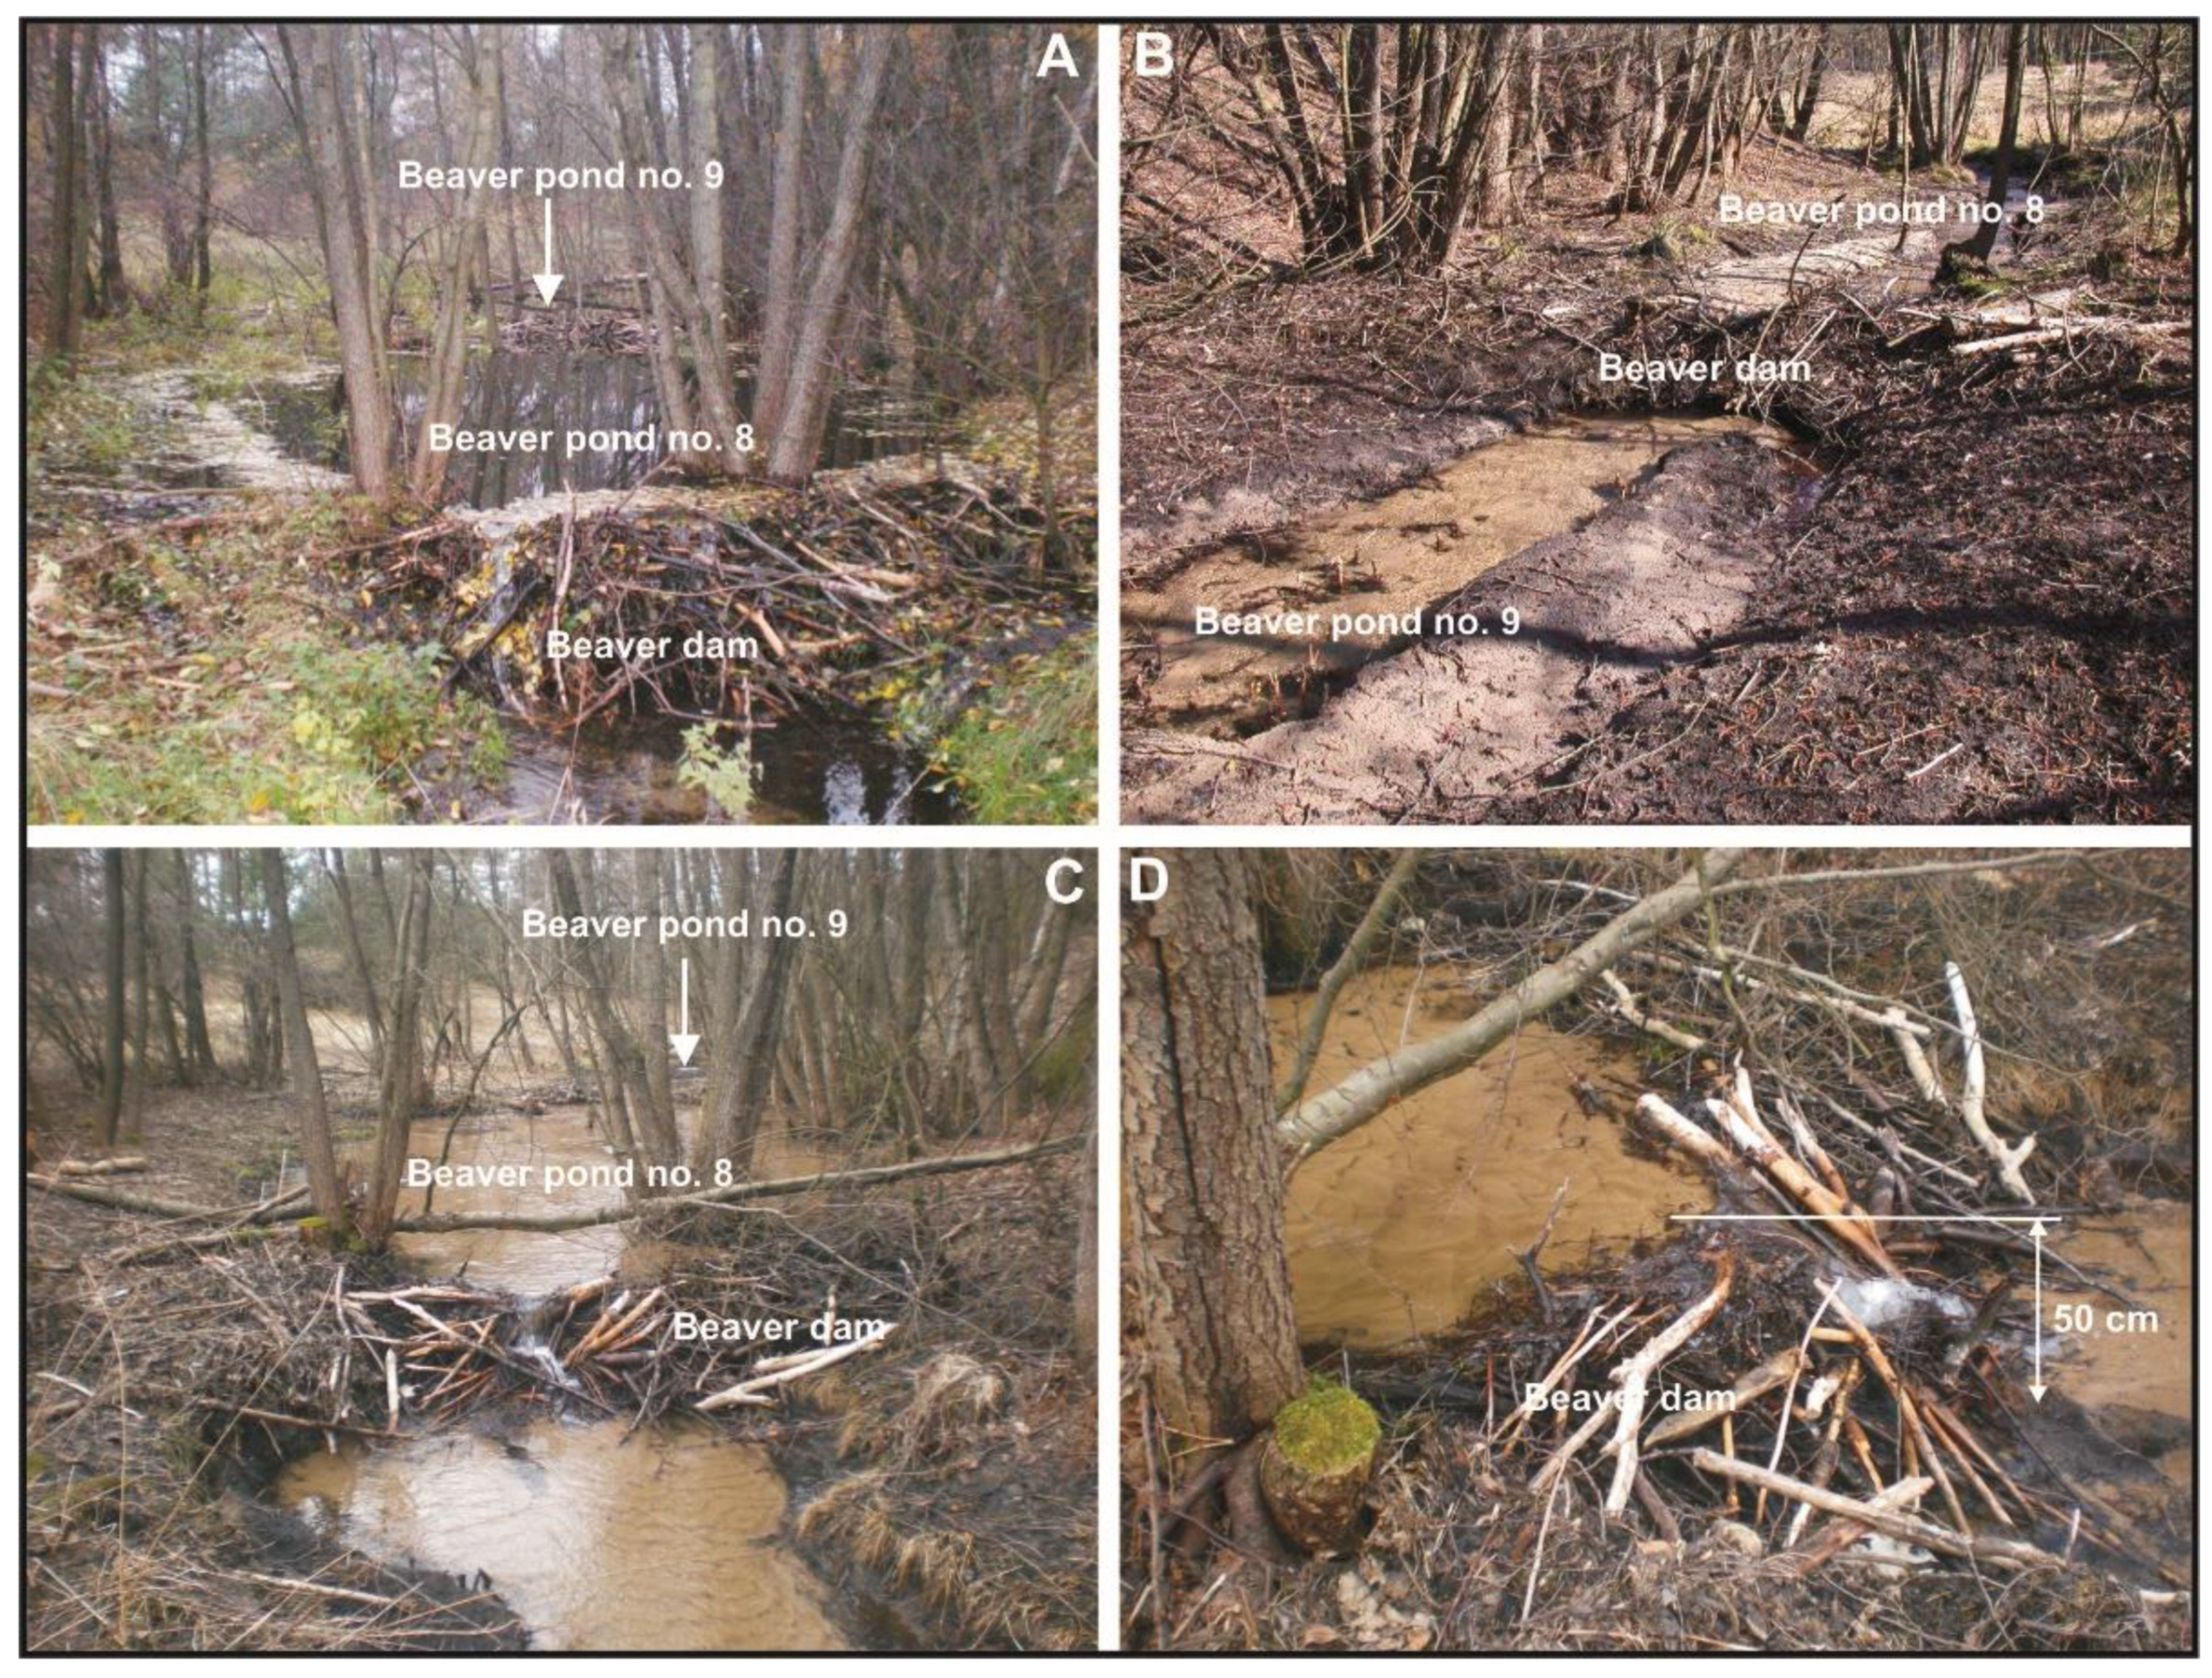
3.1. Ponds and Pond Types
3.2. Types of Forms
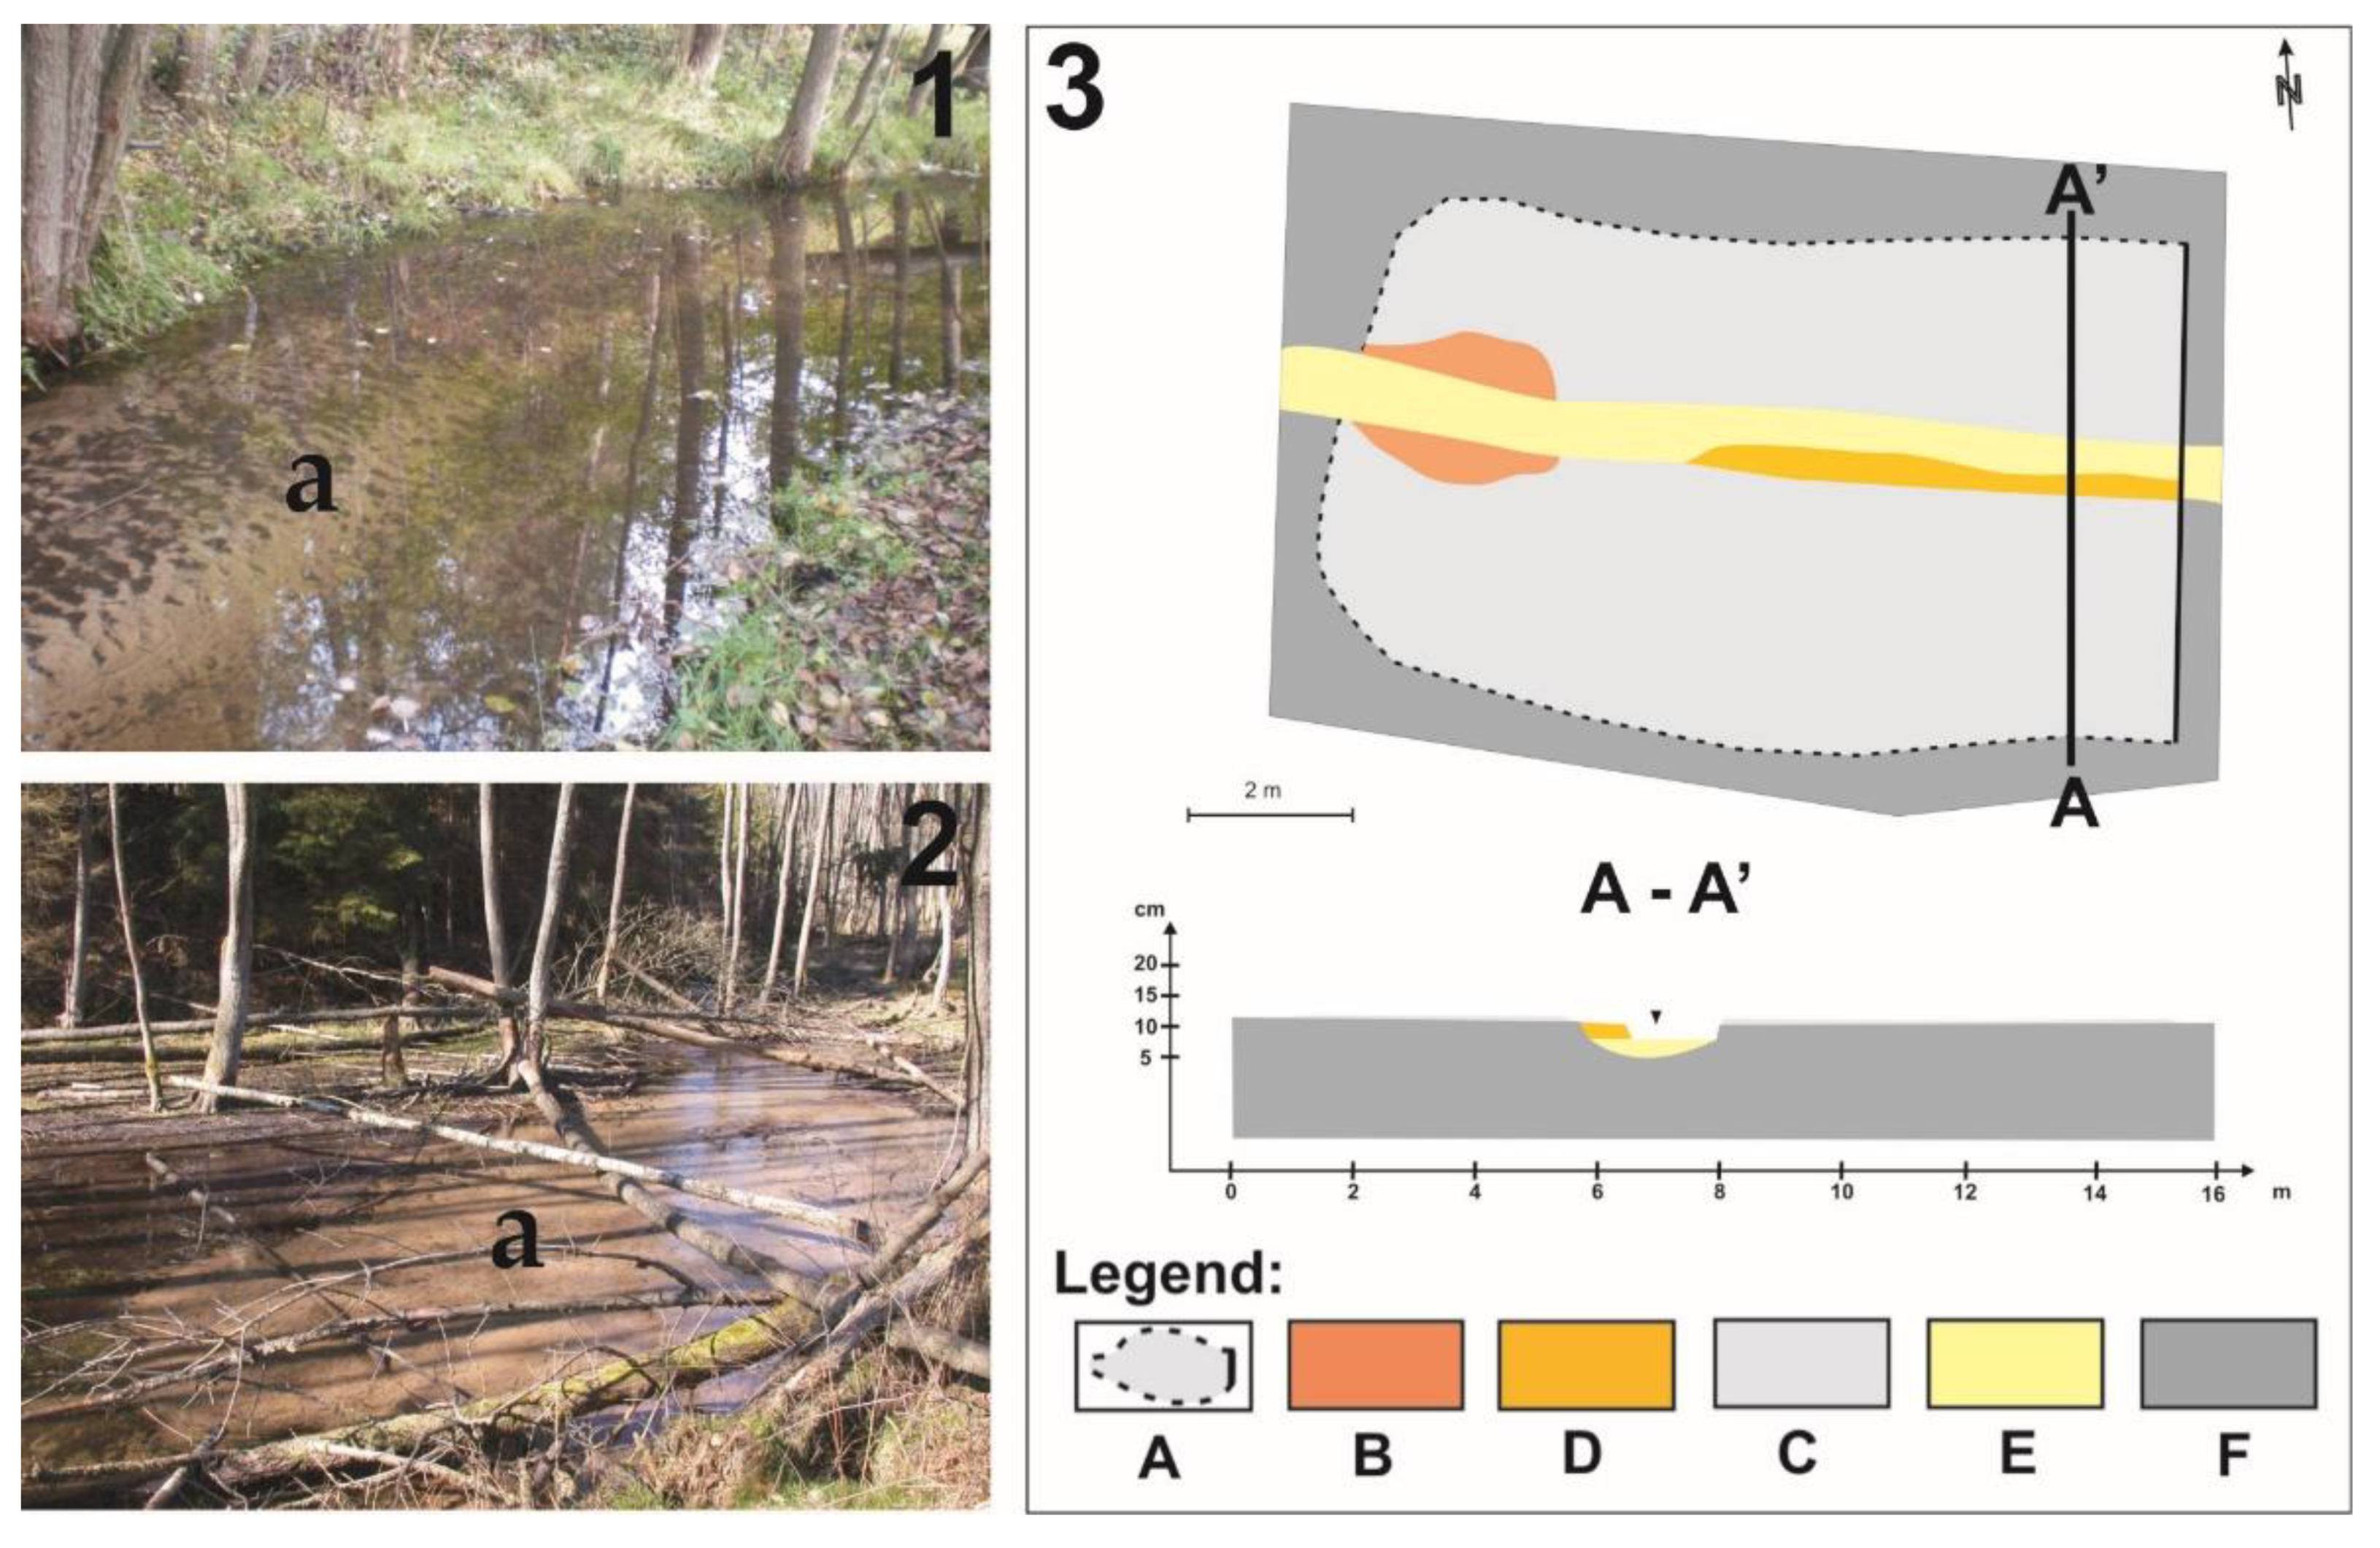
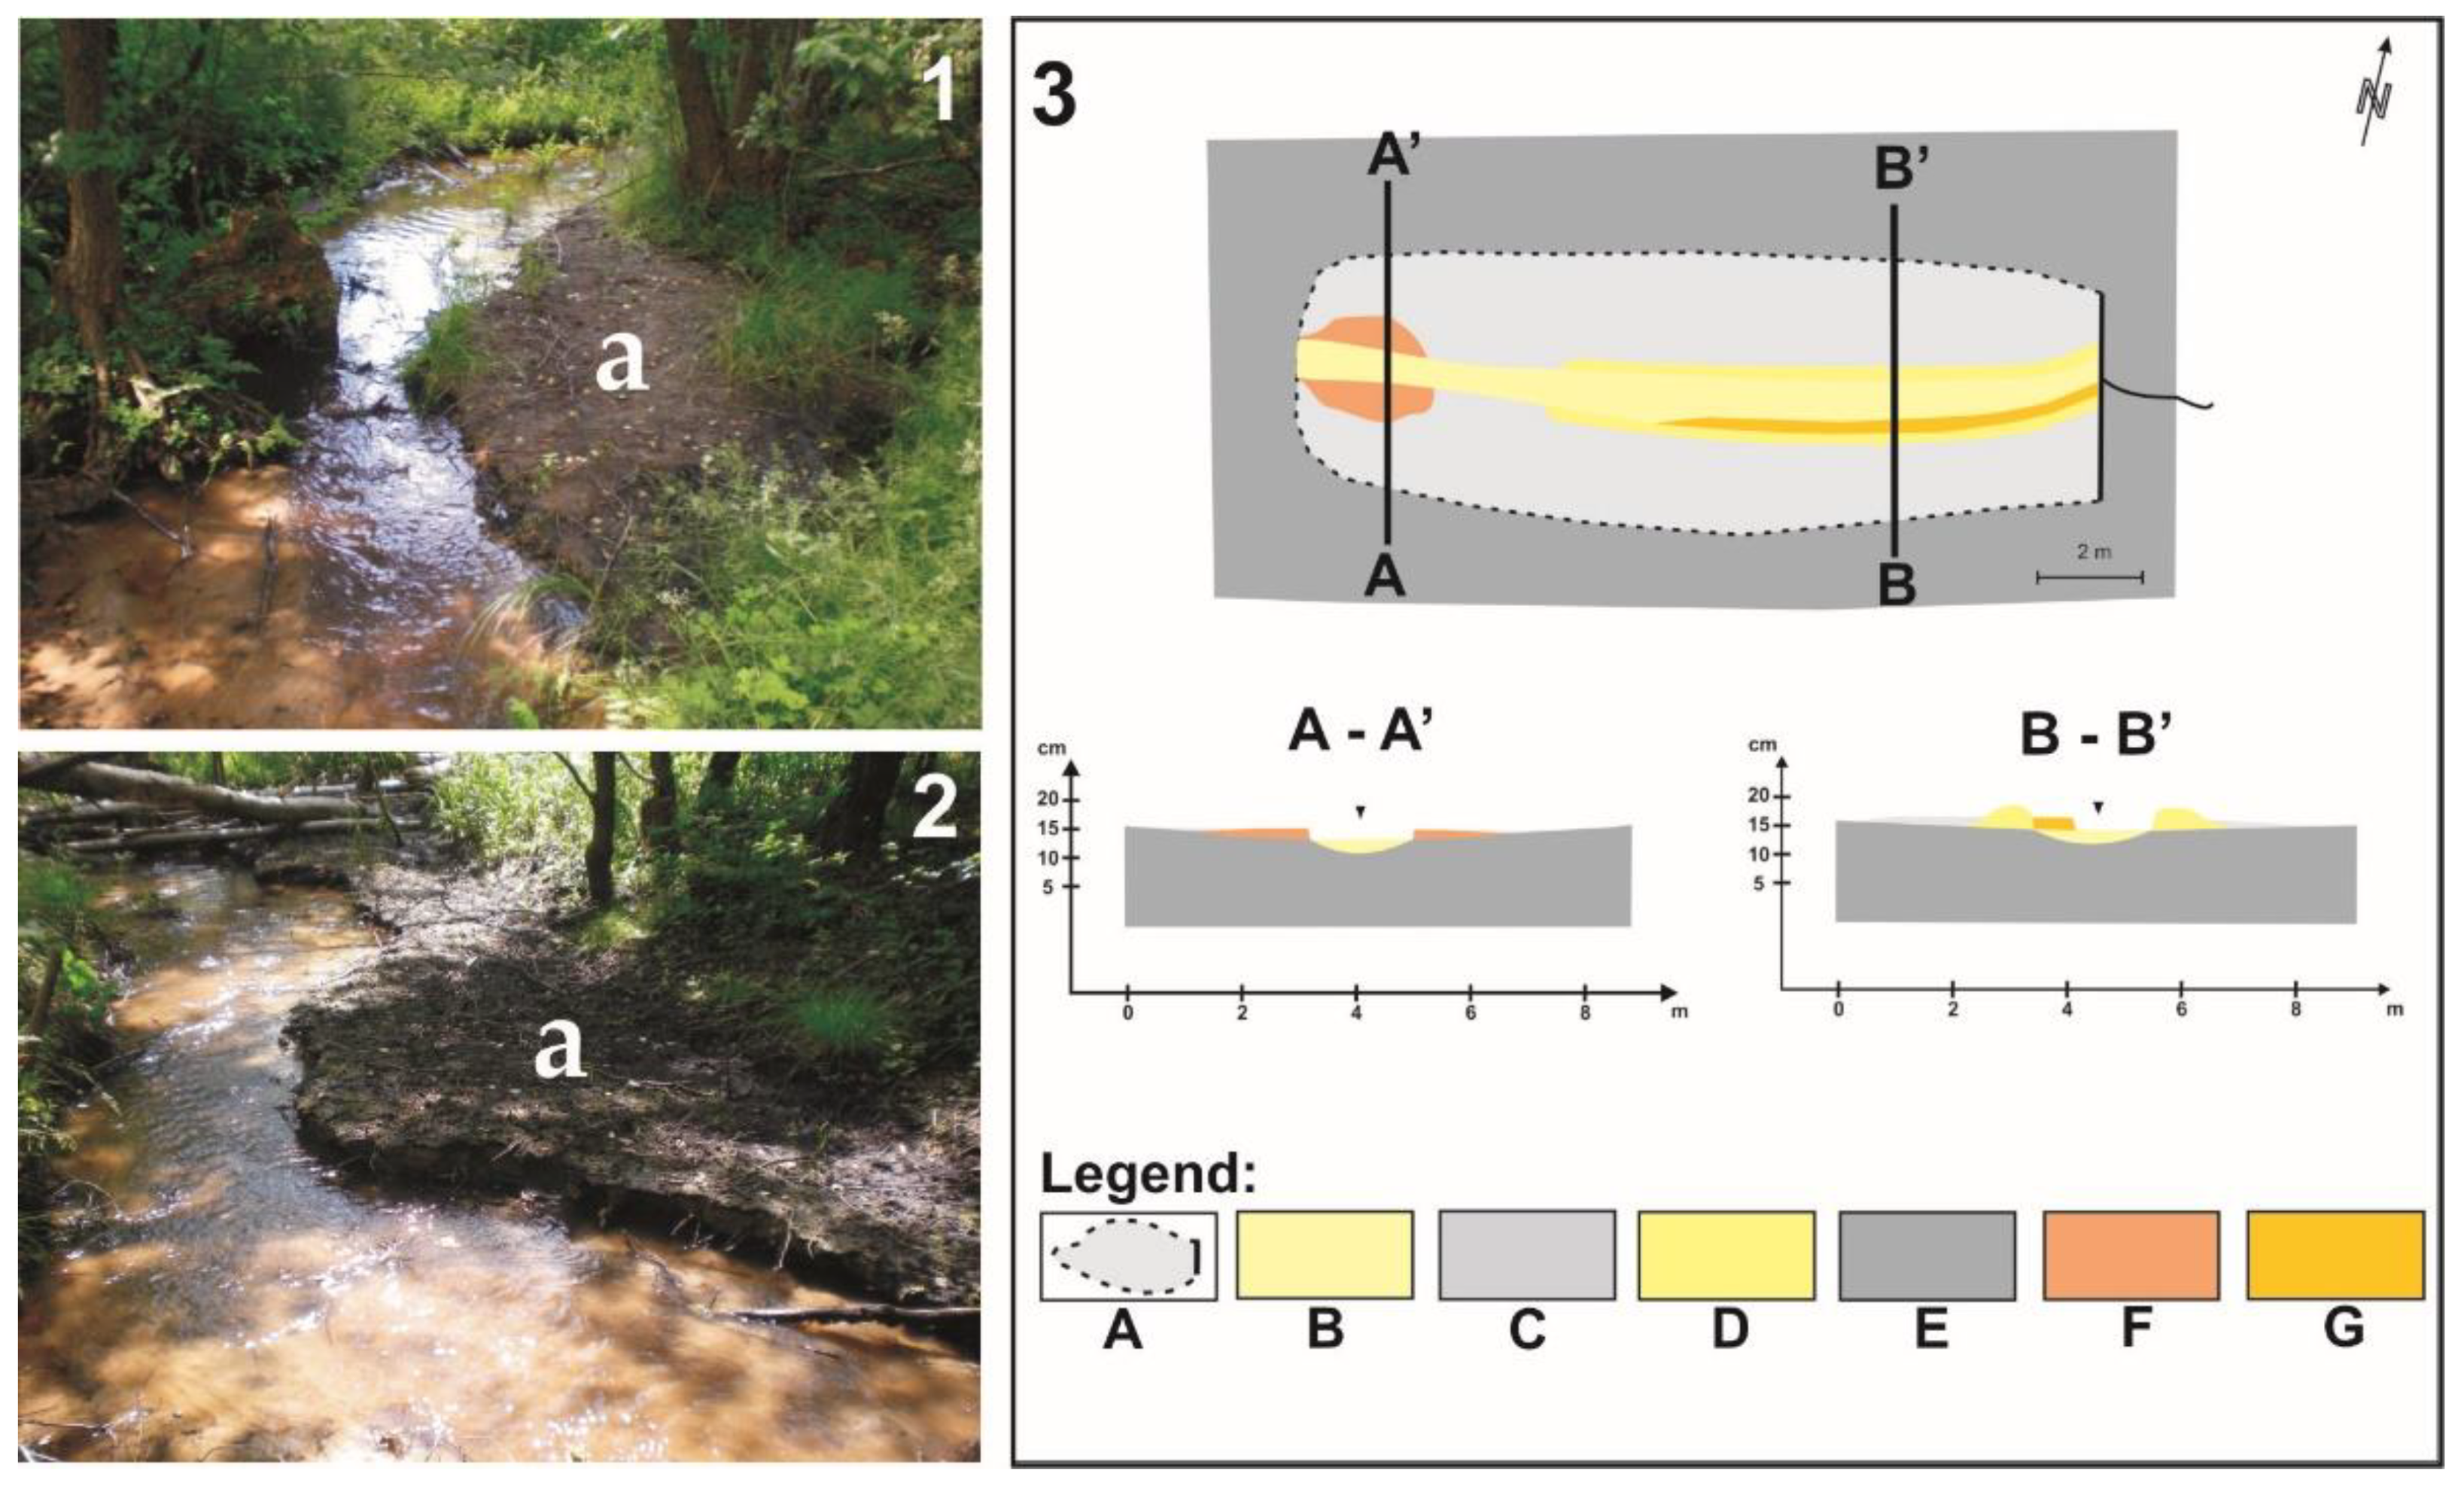
3.2.1. Alluvial Fans
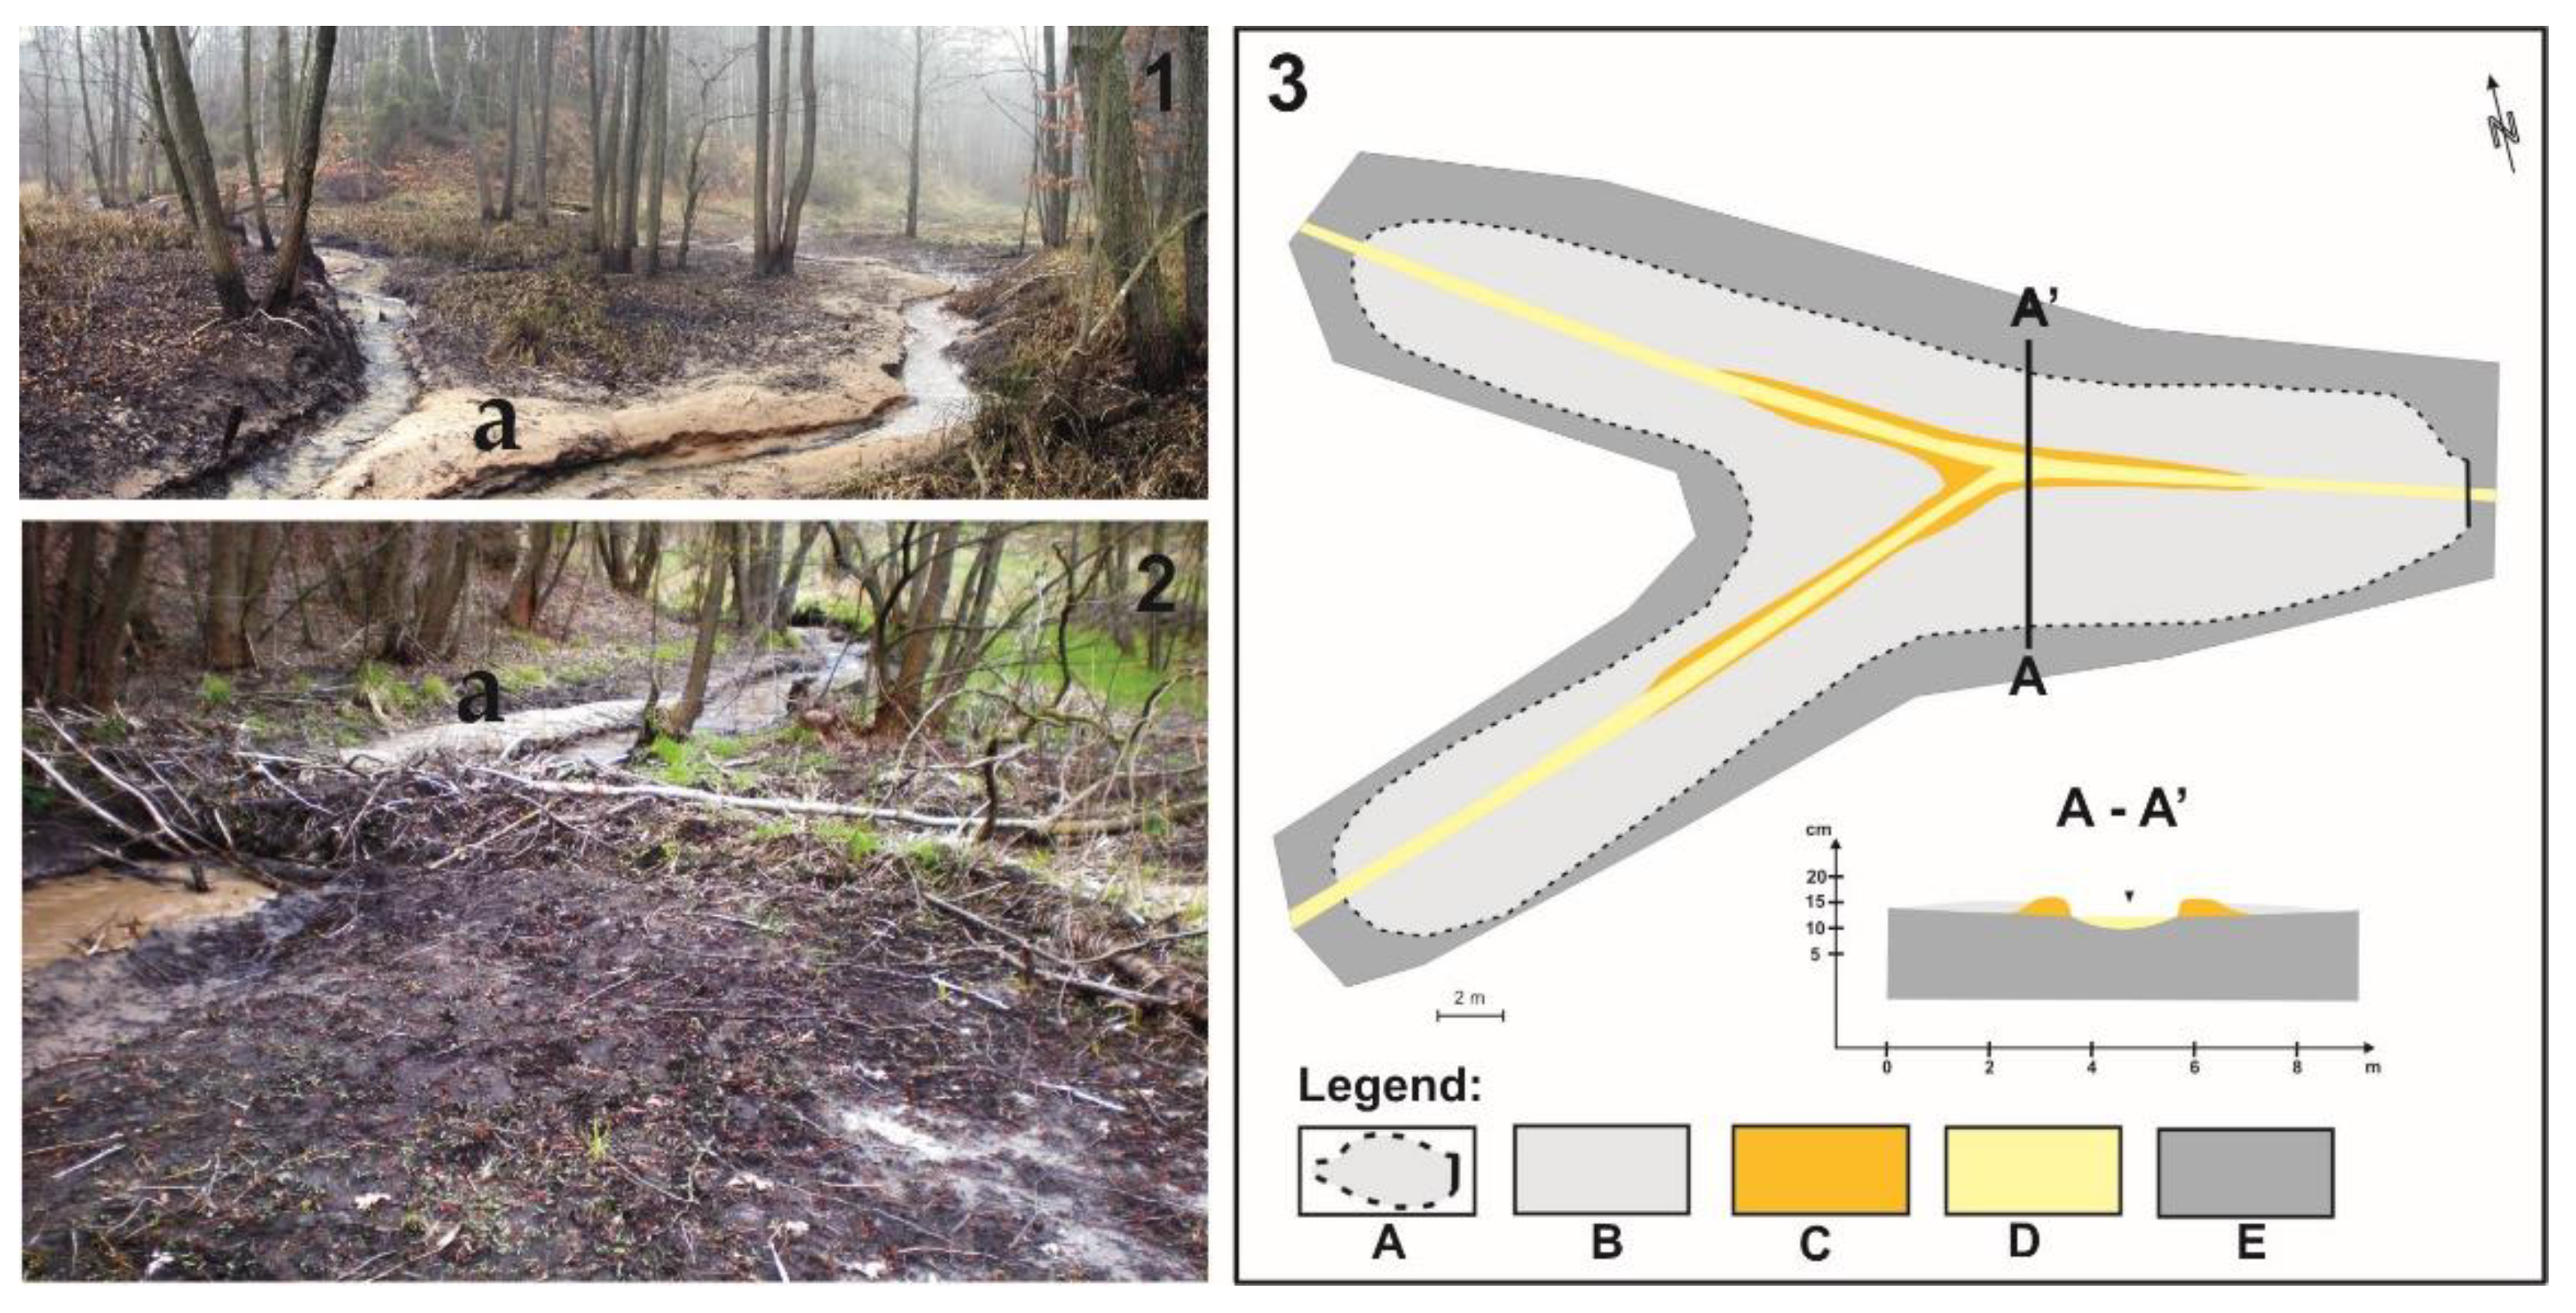
3.2.2. Levees
3.2.3. Sandy Shadow Dunes
3.2.4. Microterraces
3.2.5. Genesis of Landforms from Beaver Ponds
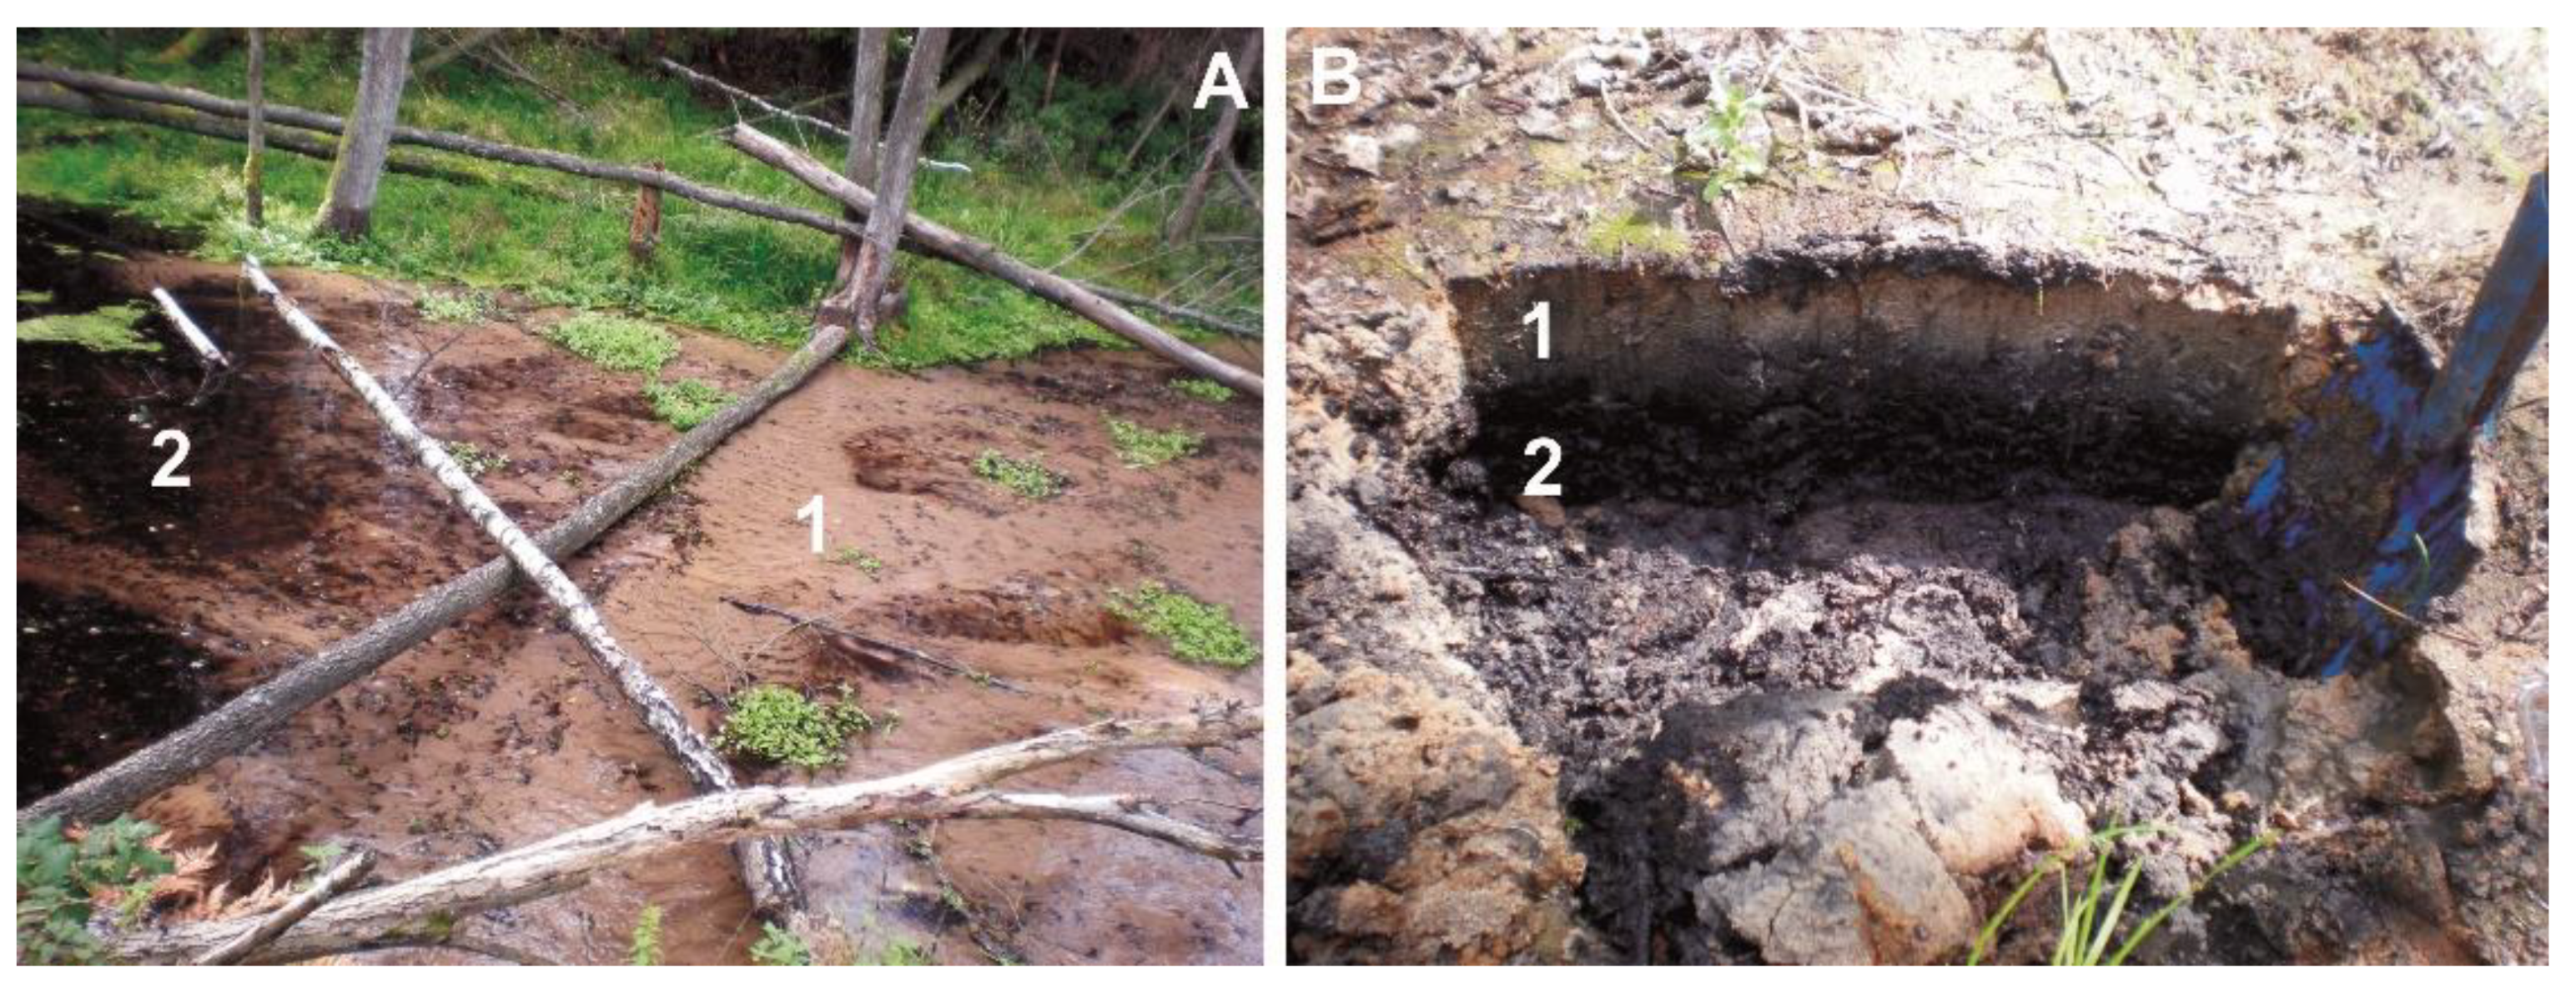
3.3. Types of Sediments
3.3.1. Sand
3.3.2. Mineral–Organic Silt
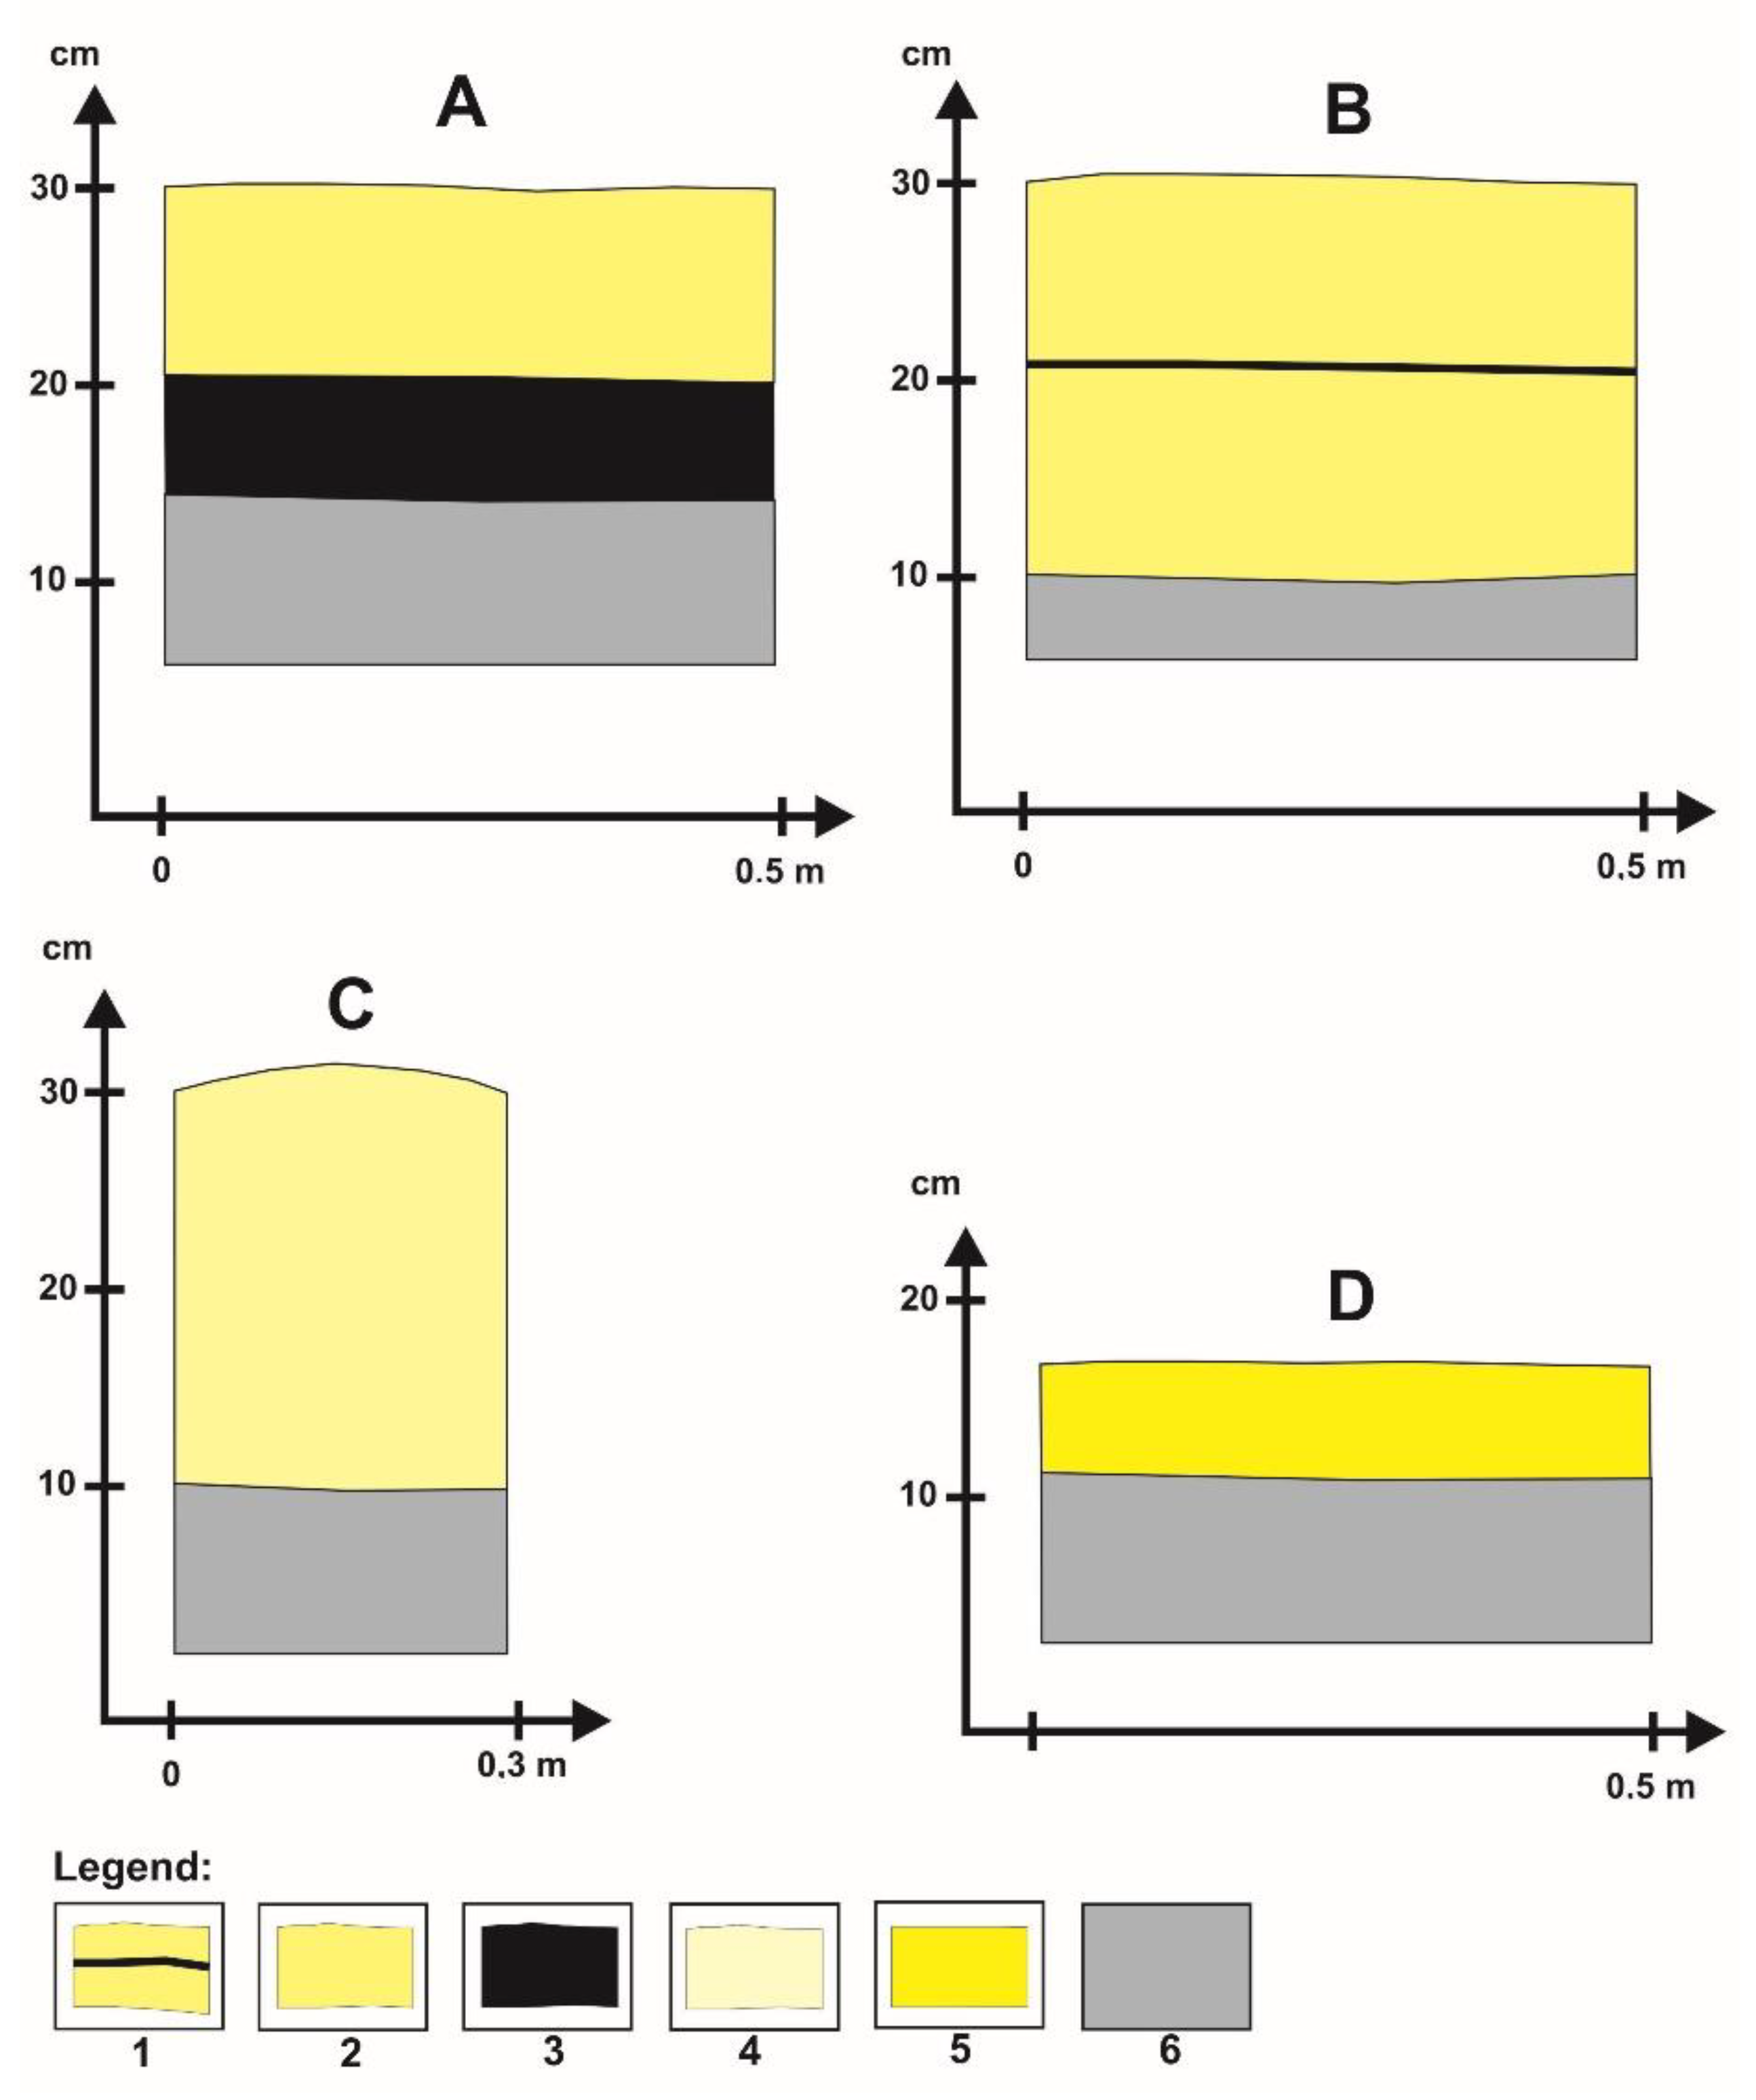
3.3.3. Sedimentary Characteristics
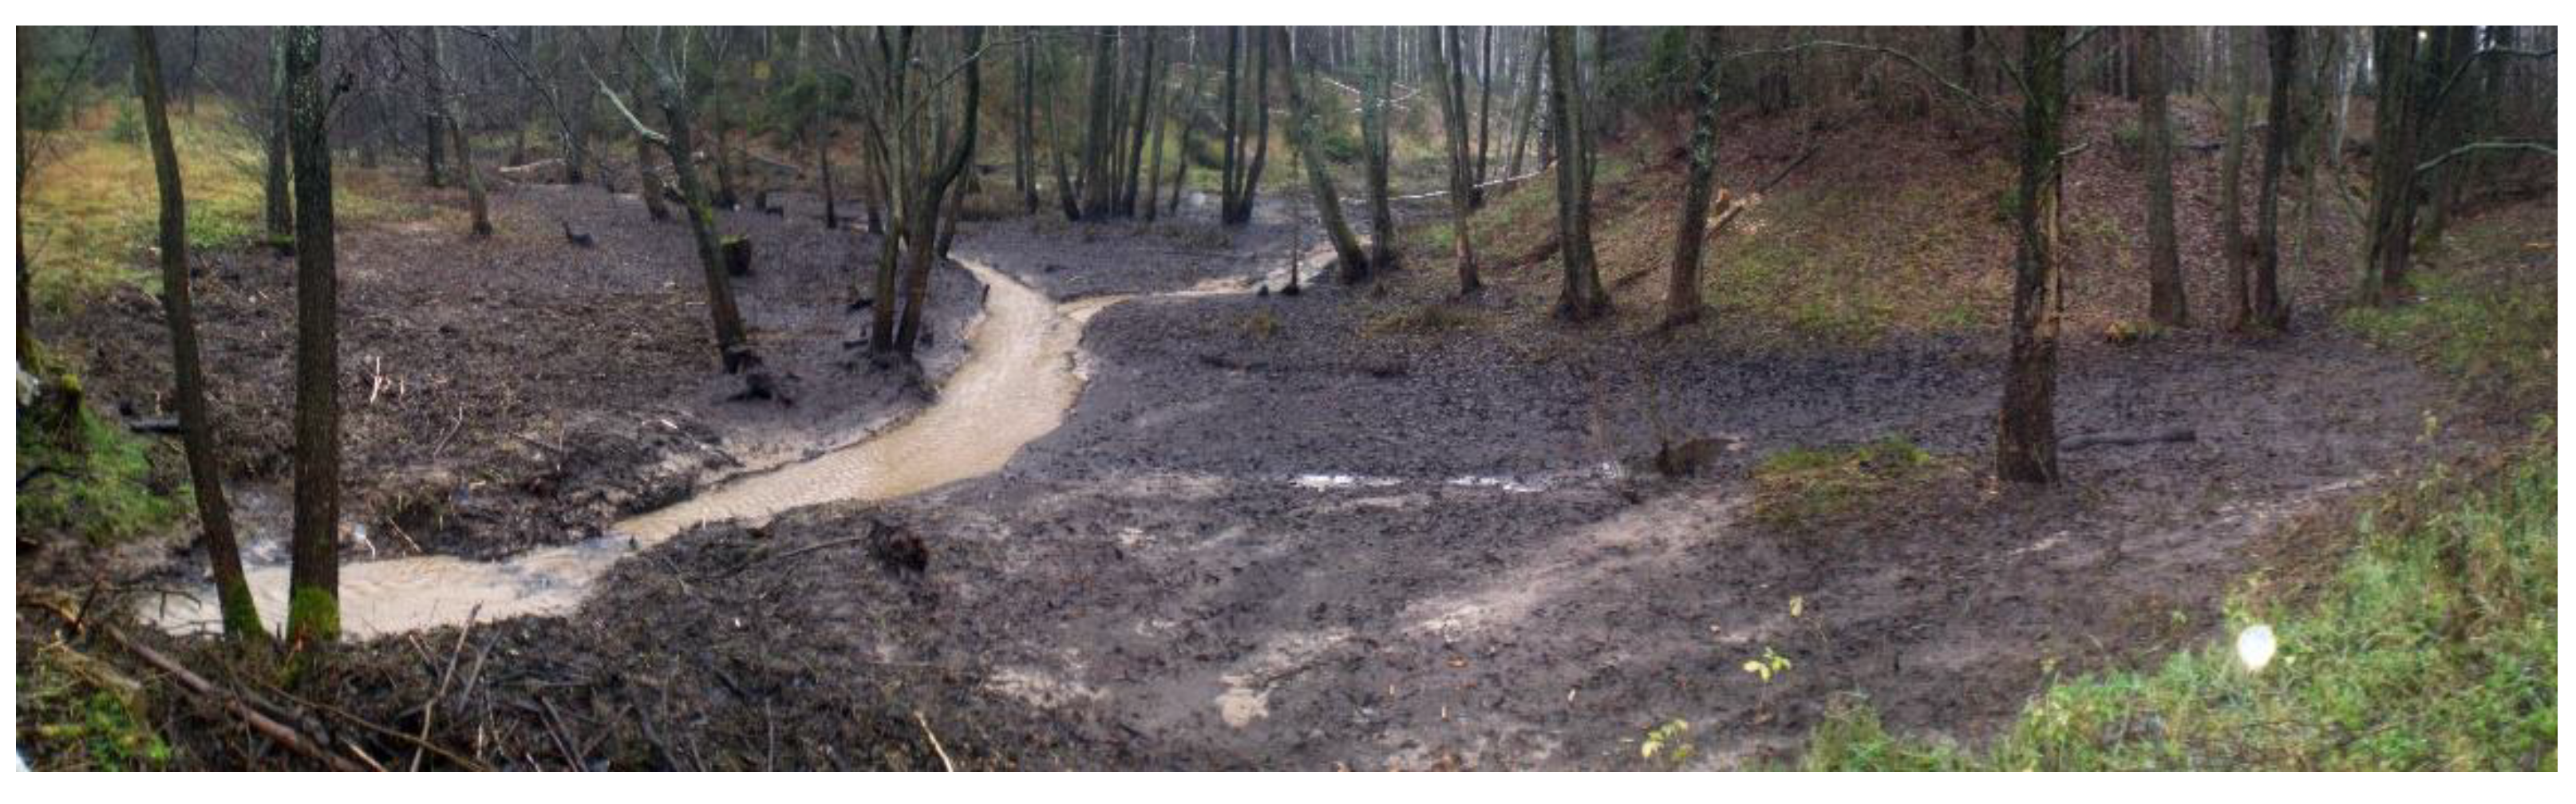
3.4. Points at Which Sedimentary Material Is Supplied to the Stream and Deposited
4. Discussion
5. Conclusions
Funding
Institutional Review Board Statement
Informed Consent Statement
Data Availability Statement
Acknowledgments
Conflicts of Interest
References
- Nolet, B.; Rosell, F. Comeback of the beaver Castor fiber: An overview of old and new conservation problems. Biol. Conserv. 1998, 83, 165–173. [Google Scholar] [CrossRef]
- Halley, D.J.; Rosell, F. The beaver′s reconquest of Eurasia: Status, population development, and management of a conservation success. Mammal. Rev. 2002, 32, 153–178. [Google Scholar] [CrossRef]
- Halley, D.J.; Rosell, F. Population and distribution of European beavers Castor fiber. Lutra 2003, 46, 91–102. [Google Scholar]
- Halley, D.J.; Rosell, F.; Saveljev, A. Population and distribution of Eurasian beaver (Castor fiber). Balt. For. 2012, 18, 168–175. [Google Scholar]
- Wróbel, M. Population of Eurasian beaver (Castor fiber) in Europe. Short Communication. Glob. Ecol. Conserv. 2020, 23, e01046. [Google Scholar] [CrossRef]
- Halley, D.J.; Saveljev, A.P.; Rosell, F. Population and distribution of beavers Castor fiber and Castor canadensis in Eurasia. Mammal Rev. 2021, 51, 1–24. [Google Scholar] [CrossRef]
- Butler, D.R.; Malanson, G.P. The geomorphic influences of beaver dams and failures of beaver dams. Geomorphology 2005, 71, 48–60. [Google Scholar] [CrossRef]
- Gurnell, A.M. The hydrogeomorphological effects of beaver dam-building activity. Prog. Phys. Geogr. 1998, 22, 167–189. [Google Scholar] [CrossRef]
- Laland, K.N.; Boogert, N.J. Niche construction, co-evolution and biodiversity. Ecol. Econ. 2010, 69, 731–736. [Google Scholar] [CrossRef]
- Westbrook, C.J.; Cooper, D.J.; Butler, D.R. Beaver hydrology and geomorphology. In Treatise on Geomorphology; Shroder, J.F., Ed.; Elsevier: Amsterdam, The Netherlands, 2013; pp. 293–306. [Google Scholar]
- Westbrook, C.J.; Ronnquist, A.; Bedard-Haughn, A. Hydrological functioning of a beaver dam sequence and regional dam persistence during an extreme rainstorm. Hydrol. Process. 2020, 34, 3726–3737. [Google Scholar] [CrossRef]
- Arismendi, I.; Penaluna, B.E.; Jara, C.G. Introduced beaver improve growth of non-native trout in Tierra del Fuego. S. Am. Ecol. Evol. 2020, 10, 9454–9465. [Google Scholar] [CrossRef] [PubMed]
- Czech, A. Bóbr. Monografie Przyrodnicze; Wyd. Lubelskiego Klubu Przyrodników: Świebodzin, Poland, 2000; pp. 1–99. ISBN 83-87846-15-5. [Google Scholar]
- Naiman, R.J.; Johnston, C.A.; Kelley, J.C. Alteration of north American Streams by beaver. BioScience 1988, 38, 753–762. [Google Scholar] [CrossRef]
- Chaubey, I.; Ward, G.M. Hydrologic budget analysis of a small natural wetland in Southeast USA. J. Environ. Inform. 2006, 8, 10–21. [Google Scholar] [CrossRef]
- Puttock, A.; Graham, H.A.; Cunliffe, A.M.; Elliott, M.; Brazier, R.E. Eurasian beaver activity increases water storage, attenuates flow and mitigates diffuse pollution from intensively-managed grasslands. Sci. Total Environ. 2017, 576, 430–443. [Google Scholar] [CrossRef] [PubMed]
- Westbrook, C.J.; Cooper, D.J.; Baker, B.W. Beaver dams and overbank floods influence groundwater–surface water interactions of a Rocky Mountain riparian area. Water Resour. Res. 2006, 42, W06404. [Google Scholar] [CrossRef]
- Butler, D.R.; Malanson, G.P. Sedimentation rates and patterns in beaver ponds in a mountain environment. Geomorphology 1995, 13, 255–269. [Google Scholar] [CrossRef]
- Meentemeyer, R.K.; Butler, D.R. Hydrogeomorphic effects of beaver dams in Glacier National Park, Montana. Phys. Geogr. 1999, 20, 436–446. [Google Scholar] [CrossRef]
- De Visscher, M.; Nyssen, J.; Pontzeele, J.; Billi, P.; Frankl, A. Spatio-temporal sedimentation patterns in beaver ponds along the Chevral river, Ardennes, Belgium. Hydrol. Process 2014, 28, 1602–1615. [Google Scholar] [CrossRef]
- John, S.; Klein, A. Hydrogeomorphic effects of beaver dams on floodplain morphology: Avulsion processes and sediment fluxes in upland valley floors (Spessart, Germany). Quaternaire 2004, 15, 219–231. [Google Scholar] [CrossRef]
- Persico, L.; Meyer, G. Holocene beaver damming, fluvial geomorphology, and climate in Yellowstone National Park, Wyoming. Quat. Res. 2009, 71, 340–353. [Google Scholar] [CrossRef]
- Persico, L.; Meyer, G. Natural and historical variability in fluvial processes, beaver activity, and climate in the Greater Yellowstone Ecosystem. Earth Surf. Process. Landf. 2013, 38, 728–750. [Google Scholar] [CrossRef]
- Pollock, M.M.; Beechie, T.J.; Jordan, C.E. Geomorphic changes upstream of beaver dams in Bridge Creek, an incised stream channel in the interior Columbia River basin, eastern Oregon. Earth Surf. Process. Landf. 2007, 32, 1174–1185. [Google Scholar] [CrossRef]
- Polvi, L.E.; Wohl, E. The beaver meadow complex revisited–the role of beavers in post-glacial floodplain development. Earth Surf. Process. Landf. 2012, 37, 332–346. [Google Scholar] [CrossRef]
- Levine, R.; Meyer, G.A. Beaver dams and channel sediment dynamics on Odell Creek, Centennial Valley, Montana, USA. Geomorphology 2014, 205, 51–64. [Google Scholar] [CrossRef]
- Levine, R.; Meyer, G.A. Beaver-generated disturbance extends beyond active dam sites to enhance stream morphodynamics and riparian plant recruitment. Sci. Rep. 2019, 9, 8124. [Google Scholar] [CrossRef]
- Johnston, C.A.; Naiman, R.J. Aquatic patch creation in relation to beaver population trends. Ecology 1990, 71, 1617–1621. [Google Scholar] [CrossRef]
- Johnston, C.A. Wetland soil and landscape alteration by beavers. In Wetland Soils. Genesis, Hydrology, Landscapes and Classification; Richardson, J.L., Vepraskas, M.J., Eds.; CRC Press LLC: Boca Raton, FL, USA, 2001; pp. 391–408. [Google Scholar]
- Naiman, R.J.; Melillo, J.M.; Hobbie, J.E. Ecosystem alteation of boreal forest streams by beaver (Castor canadensis). Ecology 1986, 67, 1254–1269. [Google Scholar] [CrossRef]
- Nummi, P. Simulated effects of the beaver on vegetation, invertebrates and ducks. Ann. Zool. Fenn. 1989, 26, 43–52. [Google Scholar]
- Ruedemann, R.; Schoonmaker, W.J. Beaver-dams as geologic agents. Science 1938, 88, 523–525. [Google Scholar] [CrossRef]
- Ives, R.L. The beaver–meadow complex. J. Geomorphol. 1942, 5, 191–203. [Google Scholar]
- Garrison, G.C. Pollen stratigraphy and age of an early postglacial beaver site near Columbus, Ohio. Ohio J. Sci. 1967, 7, 96–105. [Google Scholar]
- Robinson, S.; Beaudoin, A.B.; Froese, D.G.; Doubt, J.; Clague, J.J. Plant Macrofossils Associated with an Early Holocene Beaver Dam in Interior Alaska. Arctic 2007, 60, 430–438. [Google Scholar] [CrossRef][Green Version]
- Wells, C.E.; Hodgkinson, D.; Huckerby, E. Evidence for the possible role of beaver (Castor fiber) in the prehistoric ontogenesis of a mire in north-west England, UK. Holocene 2000, 10, 503–508. [Google Scholar] [CrossRef]
- Aalto, M.J.; Hirvas, H.; Niemelä, J. An interglacial beaver dam deposit at Vimpeli, Ostrobothnia, Finland. Geol. Surv. Finland 1989, 348, 1–34. [Google Scholar]
- Soja, R. Środowiskowe skutki reintrodukcji bobra (Castor fiber) w doliny rzek Karpackich. In Przewodnik Konferencji “Funkcjonowanie Geosystemów Dolinnych w Warunkach Zmian Klimatu i Narastania Antropopresji Późnego Glacjału i Holocenu”; Wydział Nauk o Ziemi Uniwersytetu Śląskiego: Sosnowiec, Poland, 1996; pp. 45–46. [Google Scholar]
- Witt, A. Wpływ stawów bobrowych na rozwinięcie małych koryt rzecznych w Wielkopolsce północnej. Dorobek i pozycja polskiej geomorfologii u progu XXI wieku. In V Zjazd Geomorfologów Polskich; Streszczenia Referatów; Wydawnictwo UMK: Toruń, Poland, 2000; pp. 142–143. [Google Scholar]
- Kobojek, E. Środowiskowe skutki reintrodukcji bobra (Castor fiber) w dolinie Rawki. Przegląd Geogr. 2005, 77, 383–396. [Google Scholar]
- Kobojek, E. Wpływ działalności bobrów na lokalne procesy fluwialne w wybranych rzekach równiny łowicko-błońskiej. Acta Univ. Lodz. Folia Geogr. Phys. 2013, 12, 17–22. [Google Scholar] [CrossRef]
- Szpikowska, G.; Szpikowski, J. Właściwości fizykochemiczne wód rozlewisk bobrowych w dolinie Kłudy (górna Parsęta). Monit. Sr. Przyr. 2012, 3, 95–102. [Google Scholar]
- Szpikowski, J.; Szpikowska, G. Akumulacja osadów w rozlewiskach bobrowych w ´świetle oceny wielkości denudacji mechanicznej zlewni młodoglacjalnej (Kłuda, Pomorze Zachodnie). In Geneza, Litologia i Stratygrafia Utworów Czwartorzędowych; Kostrzewski, A., Stach, A., Majewski, M., Eds.; Wydawnictwo UAM w Poznaniu: Poznań, Poland, 2018; Volume 7, pp. 197–204. ISBN 978-83-936793-0-0. [Google Scholar]
- Rurek, M. Lokalne zmiany środowiska przyrodniczego wywołane działalnością bobra europejskiego (Castor fiber L.) w okolicy Trzebcin (powiat tucholski). J. Health Sci. 2013, 3, 247–256. [Google Scholar]
- Stopka, R. Geomorfologiczne skutki działalności bobra europejskiego Castor fiber w dolinie górnego Sanu. Rocz. Bieszcz. 2011, 19, 319–334. [Google Scholar]
- Giriat, D.; Gorczyca, E.; Sobucki, M. Beaver ponds’ impact on fluvial processes (Beskid Niski Mts., SE Poland). Sci. Total Environ. 2016, 544, 339–353. [Google Scholar] [CrossRef]
- Gorczyca, E.; Krzemień, K.; Sobucki, M.; Jarzyna, K. Can beaver impact promote river renaturalization? The example of the Raba River, southern Poland. Sci. Total Environ. 2018, 615, 1048–1060. [Google Scholar] [CrossRef] [PubMed]
- Grygoruk, M. Metodyka szacowania objętości retencyjnej stawów bobrowych oraz ich oddziaływania na stosunki wodne zlewni leśnych. Studia I Mater. Cent. Edukac. Przyr. -Leśnej 2008, 2, 162–172. [Google Scholar]
- Grygoruk, M.; Nowak, M. Spatial and temporal variability of channel retention in a lowland temperate forest stream settled by European beaver (Castor fiber). Forests 2014, 5, 2276–2288. [Google Scholar] [CrossRef]
- Fajer, M.; Malik, I.; Waga, J.M.; Wistuba, M.; Woskowicz-Ślęzak, B. Współczesne wykorzystanie przez bobra europejskiego Castor fiber antropogenicznie przekształconych dolin rzecznych (przykłady z Równiny Opolskiej i Wyżyny Woźnicko-Wieluńskiej). Prz Geogr. 2017, 89, 467–489. [Google Scholar] [CrossRef]
- Rurek, M.; Śnieszko, Z.; Makohonienko, M. Contemporary and Fossil Beaver Ponds in Small River Valleys on the Area of Bory Tucholskie (North European Plain); Kazimierz Wielki University Press: Bydgoszcz, Poland, 2016; pp. 1–136. ISBN 978-83-8018-109-0. (In Polish with English Summary). [Google Scholar]
- Śnieszko, Z.; Rurek, M.; Rzętała, M. Significance of relief-forming activities by Castor fiber L. for the evolution of Holocene floodplains of small river valleys (results of studies conducted in Poland). In Proceedings of the 17th International Multidisciplinary Scientific GeoConference (SGEM 2017), Albena, Bulgaria, 29 June–5 July 2017; Volume 17, pp. 523–529. [Google Scholar]
- Śnieszko, Z.; Rurek, M.; Hojan, M. The Role of Beavers in the Holocene Landscape Evolution of the Small River Valleys (the Tuchola Forest—North European Plain); Kazimierz Wielki Univeristy Press: Bydgoszcz, Poland, 2020; pp. 1–109. ISBN 978-83-8018-344-5. [Google Scholar]
- Śnieszko, Z.; Rurek, M.; Hojan, M. Medieval Relict Beaver Ponds in the Polish Plain: Studies from the Tuchola Forest. Water 2021, 13, 777. [Google Scholar] [CrossRef]
- Ministerstwo Środowiska. Szczegółowa Mapa Geologiczna Polski 1:50 000, Arkusz: Cekcyn No. 204; Ministerstwo Środowiska: Warszawa, Poland, 2009.
- Główny Urząd Geodezji i Kartografii. Mapa Topograficzna 1:25000, Arkusz: 334.44; Główny Urząd Geodezji i Kartografii: Warszawa, Poland, 1974.
- Geoportal. Available online: https://www.geoportal.gov.pl/ (accessed on 5 October 2021).
- Wentworth, C.K. A Scale of Grade and Class Terms for Clastic Sediments. J. Geol. 1922, 30, 377–392. [Google Scholar] [CrossRef]
- Folk, R.L.; Ward, W.C. Brazos River bar: A study in the significance of grain size parameters. J. Sediment. Res. 1957, 27, 3–26. [Google Scholar] [CrossRef]
- Dalbeck, L.; Lüscher, B.; Ohlhoff, D. Beaver ponds as habitat of amphibian communities in a central European highland. Amphibia-Reptilia 2007, 28, 493–501. [Google Scholar] [CrossRef]
- Dalbeck, L.; Weinberg, K. Artificial ponds: A substitute for natural Beaver ponds in a Central European Highland (Eifel, Germany)? Hydrobiologia 2009, 630, 49–62. [Google Scholar] [CrossRef]
- Skolasińska, K.; Rotnicka, J. Pozakorytowe osady Warty zdeponowane w czasie powodzi zimowej 2010/2011 na zakolu rzeki w Marlewie (Poznań S). In Varia, Prace z Zakresu Geografii i Geologii; Biernacka, J., Kijowska, J., Eds.; Bogucki Wydawnictwo Naukowe: Poznań, Poland, 2011; pp. 7–25. [Google Scholar]
- Zieliński, T. Cykliczność w osadach rzek roztokowych. Geologia 1998, 14, 68–119. [Google Scholar]
- Zwoliński, Z. Sedymentacja osadów przyrostu pionowego na terasie zalewowej Parsęty. Bad. Fizjograf. Nad Pol. Zach. 1985, 35, 205–238. [Google Scholar]
- Larsen, A.; Larsen, J.R.; Lane, S.N. Dam builders and their works: Beaver influences on the structure and function of river corridor hydrology, geomorphology, biogeochemistry and ecosystems. Earth-Sci. Rev. 2021, 2018, 103623. [Google Scholar] [CrossRef]


| Number of Pond | Type of Beaver Pond | Length–Height–Width of the Dam (m) | Morphometric Parameters of Beaver Ponds | Average Sediment Thickness (m) | Rate in cm/Year | Average Sediment Volume (m3) | Duration of Pond Existence in Years or Months | Dominant Type of Sediment 1 | ||
|---|---|---|---|---|---|---|---|---|---|---|
| Maximum Length (m) | Average Width (m) | Area (m2) | ||||||||
| 1 | floodplain | 26.5–0.6–1 | 26 | 25.5 | 600 | 0.01 | 12 | 6 | 1 year | MOS |
| 2 | floodplain | 26.5–0.8–1.3 | 200 | 47.5 | 11,000 | 0.09 | 54 | 99 | 6 years | MOS/S |
| 3 | floodplain | 26.5–1–1.5 | 32 | 21 | 570 | 0.07 | 35 | 40 | 5 years | S/MOS |
| 4 | floodplain | 15–0.6–1 | 26 | 15 | 300 | 0.03 | 9 | 9 | 6 months | MOS/S |
| 5 | channel | 3–0.3–0.5 | 11 | 2.5 | 25 | 0.03 | 36 | 0.75 | 1 year | S |
| 6 | floodplain | 2–1–1.5 | 35 | 6 | 300 | 0.05 | 11 | 15 | 3 months | S/MOS |
| 7 | channel | 0.8–0.8–1.3 | 13 | 0.7 | 13 | 0.28 | 63 | 3.6 | 3 months | S |
| 8 | floodplain | 4–0.5–1 | 15 | 4.8 | 57 | 0.14 | 28 | 9 | 2 years | S |
| 9 | floodplain | 15–0.5–1 | 35 | 13 | 430 | 0.09 | 27 | 38.7 | 3 years | MOS/S |
| 10 | floodplain | 4–1–1.5 | 5 | 5 | 25 | 0.01 | 12 | 0.25 | 1 month | S |
| 11 | floodplain | 4–1–1.3 | 5 | 4.5 | 23 | 0.01 | 12 | 0.23 | 1 month | S |
| 12 | floodplain | 4–1–1.2 | 5 | 4.5 | 23 | 0.03 | 2 | 0.7 | 1 month | S |
| 13 | floodplain | 4.5–1–1.4 | 5 | 5 | 25 | 0.03 | 2 | 0.75 | 1 month | S |
| 14 | floodplain | 5–1–1.5 | 18 | 4.8 | 100 | 0.28 | 84 | 2.8 | 3 years | S |
| 15 | floodplain | 5–0.8–1.3 | 15.5 | 5.1 | 90 | 0.05 | 15 | 4.5 | 3 years | S |
| 16 | floodplain | 8–1.2–1.6 | 35 | 8.7 | 250 | 0.07 | 21 | 17.6 | 3 years | S/MOS |
| 17 | floodplain | 7–0.8–1.3 | 36 | 6.3 | 252 | 0.02 | 4 | 5 | 2 years | MOS/S |
| Total | 14,083 | 252.88 | ||||||||
| Number of Pond | Type of Beaver Pond | Alluvial Fan 1 | Levees 1 | Sandy Shadow Dunes 1 | Microterraces 1 | Morphometry of Forms | ||
|---|---|---|---|---|---|---|---|---|
| Length (m) | Width (m) | Height/ Thickness of Sediments (m) | ||||||
| 1 | floodplain | − | − | − | − | − | − | − |
| 2 | floodplain | + | − | − | − | 3 | 2 | 0.03 |
| 3 | floodplain | + | − | − | − | 5 | 3 | 0.05 |
| 4 | floodplain | + | − | − | 3 | 2 | 0.03 | |
| + | 1 | 0.1–0.5 | 0.05 | |||||
| 5 | channel | − | − | − | − | − | − | − |
| 6 | floodplain | − | + | − | − | 10 | 0.2–0.7 | 0.25 |
| 7 | channel | − | − | − | − | − | − | − |
| 8 | floodplain | + | − | 3 | 2 | 0.03 | ||
| + | 5 | 0.2–0.5 | 0.15 | |||||
| + | 8 | 0.1–0.3 | 0.1 | |||||
| 9 | floodplain | + | − | 5 | 3 | 0.05 | ||
| + | 12 | 0.2–0.6 | 0.2 | |||||
| + | 20 | 0.1–0.6 | 0.1 | |||||
| 10 | floodplain | − | − | − | − | − | − | − |
| 11 | floodplain | − | − | − | − | − | − | − |
| 12 | floodplain | − | − | + | − | 2 | 0.2–0.7 | 0.2 |
| 13 | floodplain | − | − | + | − | 3 | 0.2–0.7 | 0.2 |
| 14 | floodplain | + | − | − | − | 4 | 3 | 0.03 |
| 15 | floodplain | + | − | − | 3 | 2 | 0.03 | |
| + | 2 | 0.1–0.3 | 0.05 | |||||
| 16 | floodplain | + | − | 5 | 2 | 0.05 | ||
| + | 10 | 0.2–0.5 | 0.15 | |||||
| + | 10 | 0.1–0.4 | 0.05 | |||||
| 17 | floodplain | + | − | − | − | 3 | 2 | 0.03 |
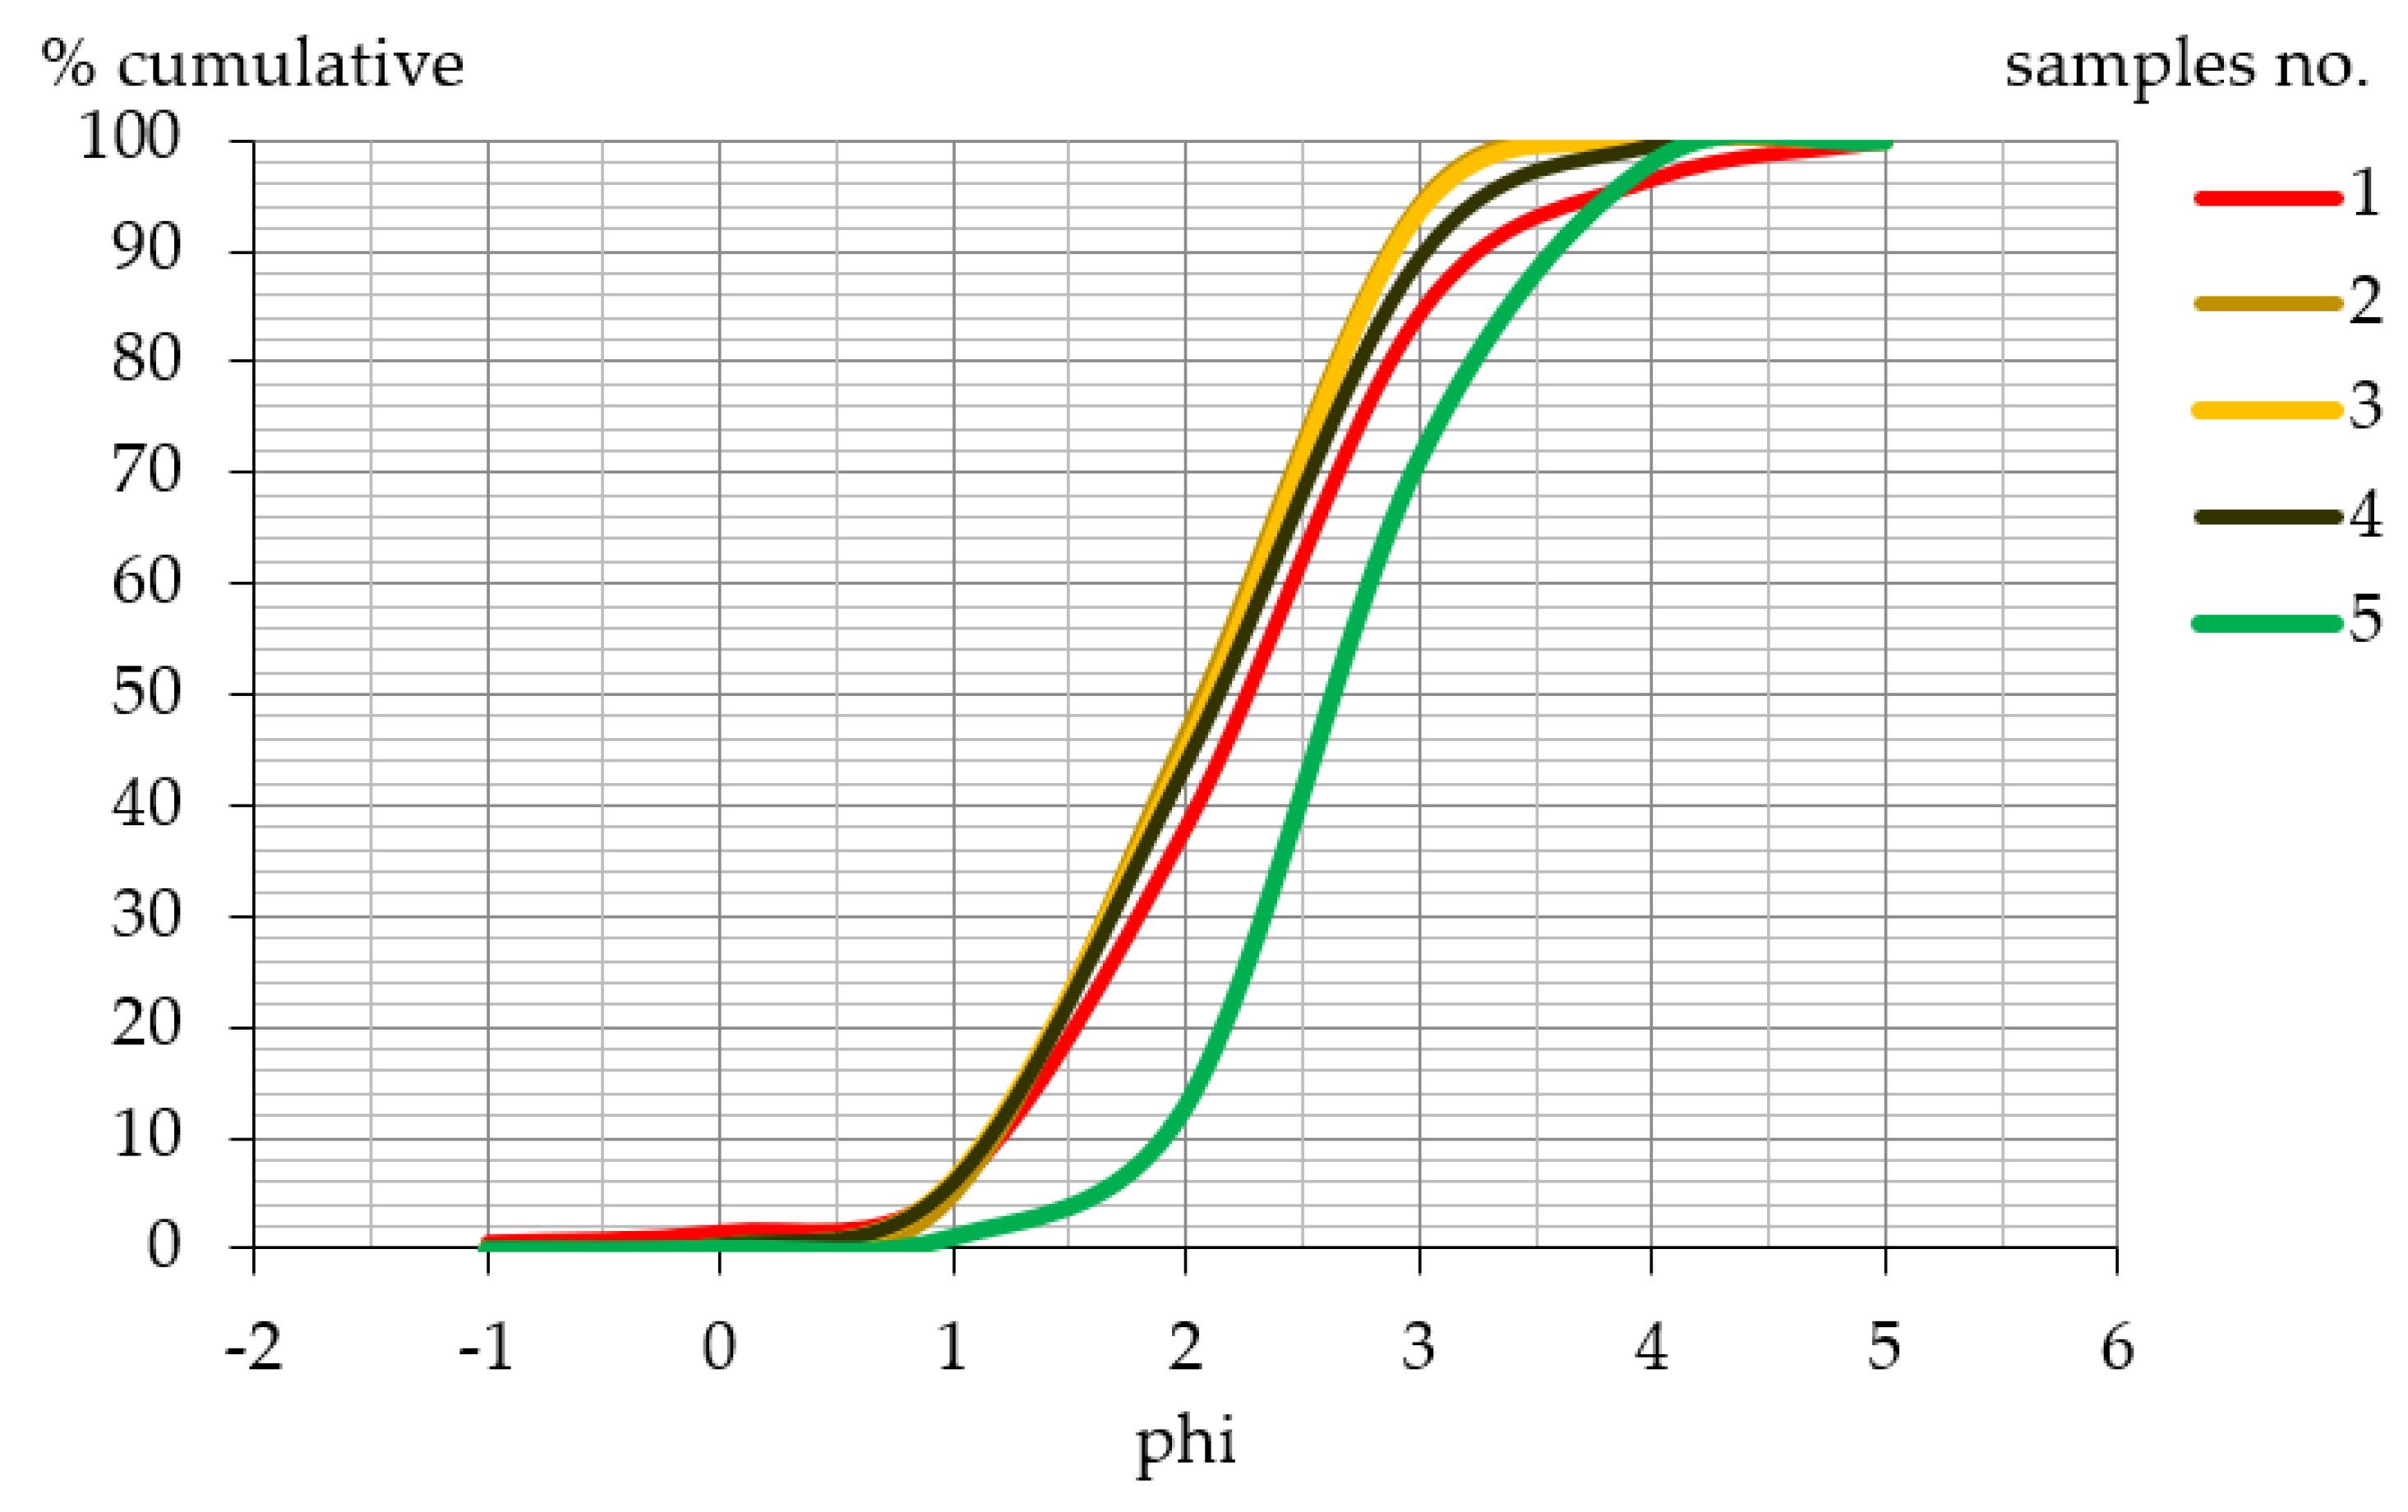
| Sample Number | Types of Sediments and Forms | Percentage Part of the Fraction Range by the Wentworth Scale [59] (in mm) | ||||||
|---|---|---|---|---|---|---|---|---|
| >2.00 | 1.0–2.0 | 0.5–1 | 0.25–0.5 | 0.125–0.25 | 0.063–0.125 | <0.063 | ||
| 1 | Sand, Alluvial fan, pond 3 | 0.65 | 0.93 | 4.16 | 32.52 | 46.17 | 12.12 | 3.44 |
| % cumulative | 0.65 | 1.58 | 5.75 | 38.26 | 84.44 | 96.56 | 100.00 | |
| 2 | Sand, Alluvial fan, pond 3 | 0.00 | 0.34 | 4.64 | 41.82 | 47.50 | 5.58 | 0.12 |
| % cumulative | 0.00 | 0.34 | 4.98 | 46.80 | 94.30 | 99.88 | 100.00 | |
| 3 | Sand, Levees pond 8 | 0.00 | 0.26 | 5.88 | 38.74 | 48.67 | 6.34 | 0.12 |
| % cumulative | 0.00 | 0.26 | 6.14 | 44.88 | 93.55 | 99.88 | 100.00 | |
| 4 | Sand, Levees pond 9 | 0.00 | 0.27 | 5.67 | 37.93 | 45.46 | 10.11 | 0.55 |
| % cumulative | 0.00 | 0.27 | 5.95 | 43.88 | 89.33 | 99.45 | 100.00 | |
| 5 | Sand, Alluvial fan, pond 4 | 0.00 | 0.15 | 0.99 | 11.78 | 58.24 | 26.90 | 1.94 |
| % cumulative | 0.00 | 0.15 | 1.14 | 12.92 | 71.16 | 98.06 | 100.00 | |
| Sedimentological Indicators (Folk and Ward (1922) Method) | Samples Number | ||||
|---|---|---|---|---|---|
| 1 | 2 | 3 | 4 | 5 | |
| Mean grain size (Mz) | 2.187 | 2.038 | 2.055 | 2.094 | 2.721 |
| fine-grained sand | fine-grained sand | fine-grained sand | fine-grained sand | fine-grained sand | |
| Sorting (¦Ň) | 0.880 | 0.702 | 0.754 | 0.817 | 0.741 |
| moderately sorted | moderately sorted | moderately sorted | moderately sorted | moderately sorted | |
Publisher’s Note: MDPI stays neutral with regard to jurisdictional claims in published maps and institutional affiliations. |
© 2021 by the author. Licensee MDPI, Basel, Switzerland. This article is an open access article distributed under the terms and conditions of the Creative Commons Attribution (CC BY) license (https://creativecommons.org/licenses/by/4.0/).
Share and Cite
Rurek, M. Characteristics of Beaver Ponds and Landforms Induced by Beaver Activity, S Part of the Tuchola Pinewoods, Poland. Water 2021, 13, 3641. https://doi.org/10.3390/w13243641
Rurek M. Characteristics of Beaver Ponds and Landforms Induced by Beaver Activity, S Part of the Tuchola Pinewoods, Poland. Water. 2021; 13(24):3641. https://doi.org/10.3390/w13243641
Chicago/Turabian StyleRurek, Mirosław. 2021. "Characteristics of Beaver Ponds and Landforms Induced by Beaver Activity, S Part of the Tuchola Pinewoods, Poland" Water 13, no. 24: 3641. https://doi.org/10.3390/w13243641
APA StyleRurek, M. (2021). Characteristics of Beaver Ponds and Landforms Induced by Beaver Activity, S Part of the Tuchola Pinewoods, Poland. Water, 13(24), 3641. https://doi.org/10.3390/w13243641