Article

Uncertainty in Drought Identification Due to Data Choices, and the Value of Triangulation

1
IRI THESys, Humboldt-Universität zu Berlin, Unter den Linden 6, 10099 Berlin, Germany
2
Geography Department, Humboldt-Universität zu Berlin, Unter den Linden 6, 10099 Berlin, Germany
3
Earth and Life Institute, Université Catholique de Louvain, Place Pasteur 3, 1348 Louvain-la-Neuve, Belgium
*
Author to whom correspondence should be addressed.
Water 2021, 13(24), 3611; https://doi.org/10.3390/w13243611
Submission received: 1 November 2021 / Revised: 4 December 2021 / Accepted: 6 December 2021 / Published: 16 December 2021
(This article belongs to the Topic Water Management in the Era of Climatic Change)

Abstract

:
Droughts are complex and gradually evolving conditions of extreme water deficits which can compromise livelihoods and ecological integrity, especially in fragile arid and semi-arid regions that depend on rainfed farming, such as Kitui West in south-eastern Kenya. Against the background of low ground-station density, 10 gridded rainfall products and four gridded temperature products were used to generate an ensemble of 40 calculations of the Standardized Precipitation Evapotranspiration Index (SPEI) to assess uncertainties in the onset, duration, and magnitude of past droughts. These uncertainties were driven more by variations between the rainfall products than variations between the temperature products. Remaining ambiguities in drought occurrence could be resolved by complementing the quantitative analysis with ground-based information from key informants engaged in disaster relief, effectively formulating an ensemble approach to SPEI-based drought identification to aid decision making. The reported trend towards drier conditions in Eastern Africa was confirmed for Kitui West by the majority of data products, whereby the rainfall effect on those increasingly dry conditions was subtler than just annual and seasonal declines and greater annual variation of rainfall, which requires further investigation. Nevertheless, the effects of increasing droughts are already felt on the ground and warrant decisive action.

1. Introduction

Drought is a slow-onset phenomenon characterized by spatiotemporal water deficits restricting water accessibility and availability for social–ecological systems at varying temporal scales [1,2,3,4,5]. Characteristic persistent negative anomalies in precipitation and high temperatures leading to high evapotranspiration from soils and crops eventually have cross-sectoral effects on agriculture, food, and livelihoods, particularly in East Africa where rainfed agriculture is the economic mainstay [1,6,7,8,9,10,11]. Droughts and other environmental changes prevalent in East Africa, such as agricultural expansion and corresponding land degradation, contribute to water crises as they aggravate the competition of water demands [1]. Droughts may be categorized as: (i) meteorological (resulting from rainfall deficit) or, depending on duration and additional drivers and impacts, (ii) agricultural (exceptionally low soil moisture), (iii) hydrological (exceptionally low surface and/or subsurface water levels), and (iv) socio-economic (resulting from water supply and demand failure in relation to the previous categories) [1,4].
Droughts have severe, widespread effects on livelihoods, especially in arid and semi-arid regions, contributing inter alia to declining crop quality and quantity and forest productivity [12,13], and deterioration of aquatic life [10]. East Africa, and especially Kenya, is emblematic of the recurring drought regions worldwide [10,14,15,16,17]. The agroecosystems of semi-arid eastern Kenya are particularly vulnerable, with an inconsistent rainfall regime and the frequency and intensity of droughts increasing [3,10,12,18]. Kitui County in south-eastern Kenya is such a vulnerable semi-arid region with inconsistent rainfall and high temperatures, featuring dry spells in the growing season that impede the dominantly rainfed agriculture [10,16,19]. Water demand will likely follow the projected population increase in the area KNBS [20]; hence, monitoring and understanding of drought dynamics and the development of management interventions are ever more necessary.
Precipitation and temperature are the primary meteorological variables modulating drought duration and severity. However, the impact of prevailing data uncertainties as McMillan et al. [21] found in the identification of past droughts, particularly in data scarce regions like East Africa, has received little attention in the literature. Identification of past drought occurrence is essential to assess responses and mitigate against current and future events. The inherent interrelation of hydrological and social factors in drought occurrences, impacts, and responses has attracted a range of research fields across the natural and social sciences [2,22,23]. It seems apt, therefore, to complement the meteorological data with qualitative, ground-based information from disaster response and other sources in order to verify the drought identification based on the quantitative products. This promising approach has to date remained largely unexplored.
The Standardized Precipitation Index (SPI) and the Standardized Precipitation-Evapotranspiration Index (SPEI) are two widely used drought intensity monitoring indices. The SPI is recommended by the World Meteorological Organization (WMO) [1,15,24] and requires rainfall as the only parameter. The SPEI, an extension of the SPI, is a more recent statistical index where the water balance is represented by precipitation and potential evapotranspiration (PET) Svoboda and Fuchs [25], making it arguably more reliable for the detection and monitoring of drought [25,26,27]. The SPEI identifies meteorological drought at a sub-annual scale but can be a proxy for hydrological, agricultural, and socioeconomic drought [28].
SPI and SPEI have been applied to various ecosystems in East Africa. Studies have typically responded to the uneven distribution and general scarcity of station-based data over East Africa with the use of gridded data products [7,9,29,30,31,32]. For instance, Polong et al. [27] demonstrated near similarity of SPEI and SPI using the Modern-Era Retrospective Analysis for Research and Applications (MERRA-2) temperature product, merged with the Climate Hazards group InfraRed Precipitation with Station data (CHIRPS) rainfall product. Nguvava et al. [33], by contrast emphasized the value of PET for drought identification, and hence the superiority of SPEI over SPI. Bayissa et al. [34] showed the value of gridded data for drought assessment in the Ethiopian Upper Blue Nile Basin; in their case, the CHIRPS product outperformed the Tropical Applications of Meteorology using SATellite data and ground-based observations (TAMSAT) product, the TAMSAT African Rainfall Climatology And Time series (TARCAT) product, the Precipitation Estimation from Remotely Sensed Information using Artificial Neural Network (PERSIANN) product, and the Tropical Rainfall Measuring Mission (TRMM) product. Gebrechorkos et al. [35] also emphasized the usefulness of CHIRPS considering the uneven topography of East Africa. The authors revealed the value of precipitation and minimum and maximum temperature at monthly resolution for long-term climate variability assessment.
Naumann et al. [9] used an array of five gridded data products to compute SPI, SPEI, and soil moisture anomalies, demonstrating the uncertainty in existing products, with discrepancies particularly in mountainous areas and areas with low ground-station density. Gebrechorkos et al. [35] emphasized the need to consider temperature variation alongside rainfall and the need for higher quality data to manage data-related uncertainties in the central Kenyan highlands. Gebremeskel, Gebremedhin, Qiuhong Tang, Siao Sun, Zhongwei Huang, Xuejun Zhang, and Xingcai Liu [36] provided an account of drought impacts over East African agroecosystems and the importance of temporal assessment using gridded data, further emphasizing uncertainty and spatial variability.
Against this background, the objectives of the present study were to: (i) quantify similarities and differences between precipitation and temperature products available for the study region; (ii) propagate these similarities and differences to trend analyses and SPEI to judge the ambiguity of trends and drought identification; and (iii) explore whether ambiguities in drought identification can be resolved by triangulation with key informant information. The paper is structured as follows. Section 2 introduces data and methods. Section 3 and Section 4 present and discuss the results in light of other studies in Kenya and East Africa. Section 5 concludes with a summary and recommendations for policy and practice.

2. Materials and Methods
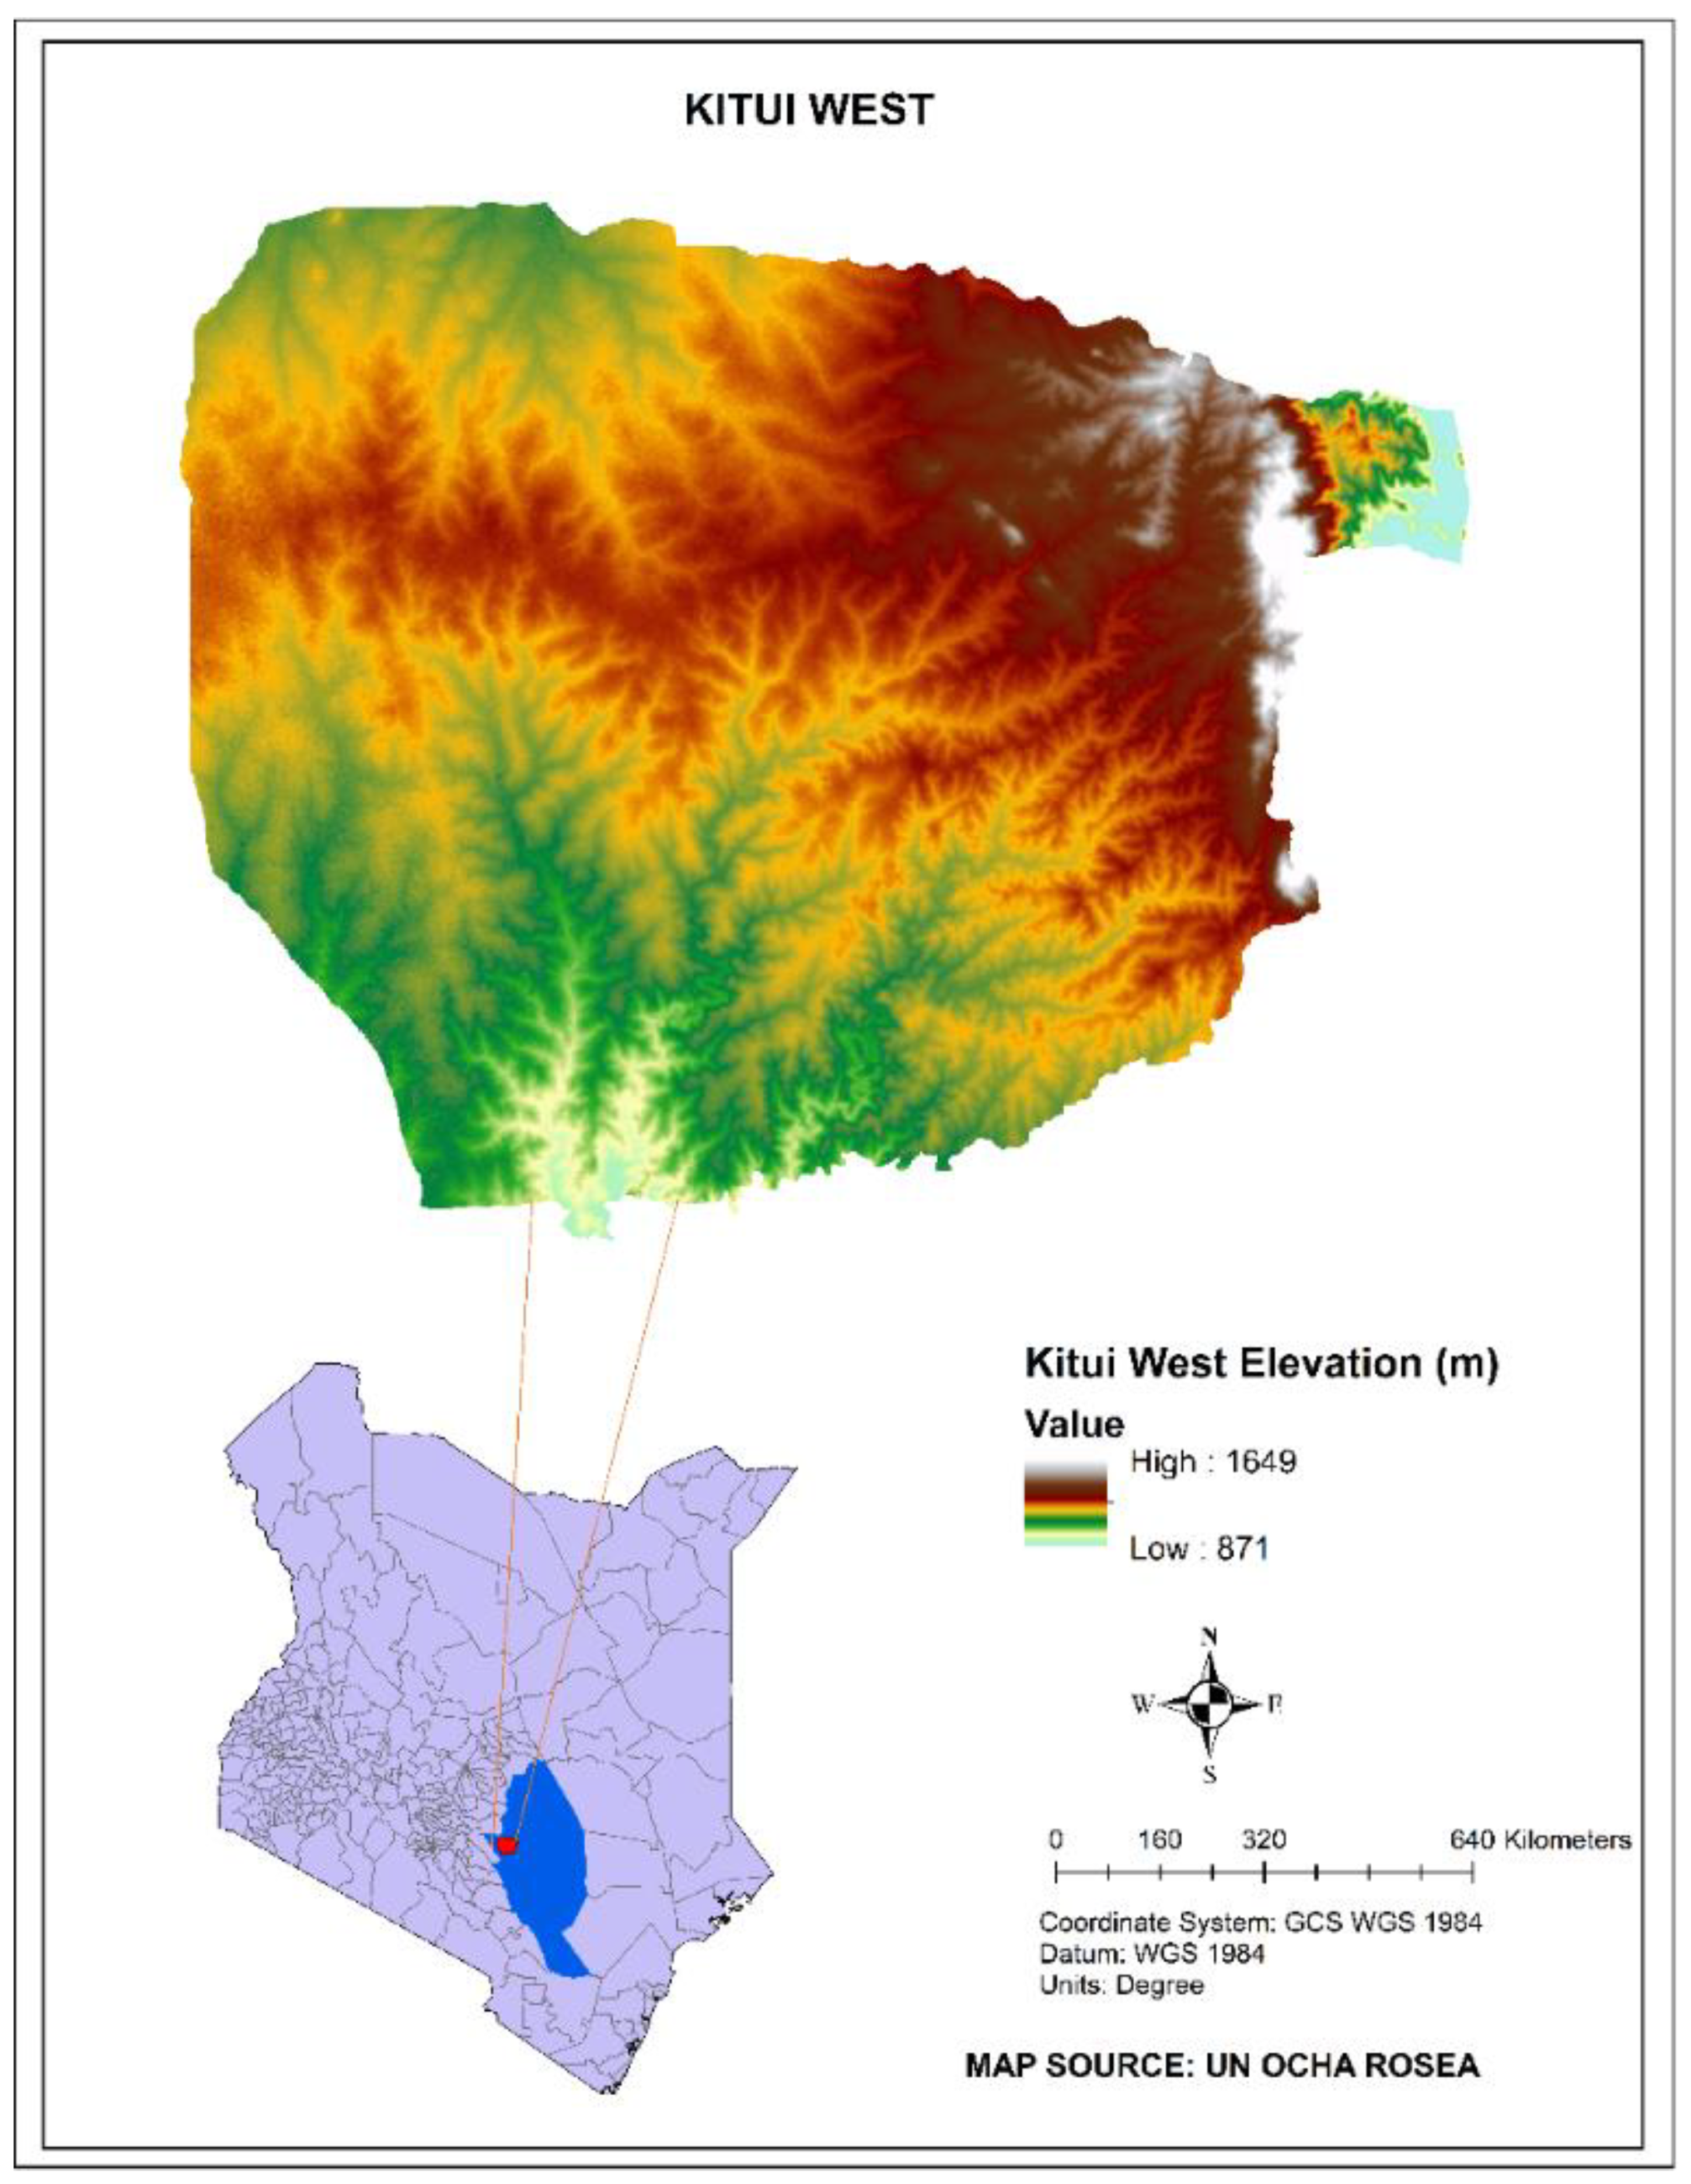
2.1. Study Area

Kitui County is a largely semi-arid to arid locality in south-eastern Kenya (Figure 1) with an intermittent river regime. The county has a population of over 1.1 million persons with a density of 37 persons per km2, an average household size of 4.3 and a total area of about 30,430 km2 [20]. The county is characterized by relatively high poverty levels, with indicators of food and water insecurity highlighted in the sub-national development blueprint, the Kitui County Integrated Development Plan (2018–2022) [37]. Food poverty is estimated at about 39.4% compared to Kenya’s average of 32% [37]. Approximately 50% of inhabitants do not have access to water sources within a walking distance of 5 km [37]. The erratic rainfall regime is considered a principal driver of the risk to the viability of the mixed crop agroecosystem in the face of recurrent drought conditions [11]. As in most of East Africa, small-scale mixed crop farming is the primary livelihood in Kitui County, supporting food production among other benefits [11].
Kenya receives rainfall in two seasons, a longer one in March–May (MAM) and a shorter but more reliable season in October–December (OND) [38]. Temperatures range from 14 to 34 °C, with January–February being the warmest months followed by MAM [39]. The ecological profile of the county includes seven agroecological zones that reflect the agricultural development potential as well as varying vegetative cover. Dominant soil groups include Dystric Regosols, Lithosols and Humic Cambisols, the Ferralo category consisting of Acrisols (ferric), Luvisols and Ferralsols, and Chromic Luvisols and Ferralsols [8].

2.2. SPEI Calculation

The SPEI was calculated using the R package SPEI version 1.7 Vicente-Serrano et al. [40] for a 30-year period (1987–2016) using all combinations of 10 monthly rainfall (P) and four monthly min/max temperature (Tmin/Tmax) products (Table 1), which yielded a total of 40 data blends. These products were chosen because they had proven reliable in the variable terrain of East Africa [27,34,35,41]. A 30-year window of analysis was chosen as all products overlapped during this period. The units of all data sources were harmonized to mm month−1 and °C (monthly average), respectively. Monthly PET was calculated from Tmin and Tmax using the reduced data Hargreaves method in the SPEI package. Following previous studies, a 12-month accumulation was used as it yielded a smoother annual drought visualization compared to 3- and 6-month accumulations, while depicting generally similar drought patterns [27,42]. The 12-month SPEI also represented an annual hydrometeorological regime matching the semi-arid agro-ecology of the study area which often receives minimal rainfall. It also aligned with the observed inter-annual distribution of drought instances as learned from interviews in the field. The accumulated differences between rainfall and PET were normalized using the log-logistic distribution, fitted using the unbiased estimator of probability-weighted moments, as implemented in the SPEI package. In addition to the SPEI, the P and Tmin/Tmax anomaly were derived by computing the Standardized Anomaly Index (SAI) after Ali and Lebel [43] where the annual deviation of the 30-year mean is calculated and then normalized by the 30-year standard deviation.

2.3. Meteorological Data Products

2.3.1. Rainfall (P) Only Products

The data from the Global Precipitation Climatology Centre (GPCC), operated by the German Weather Service, consists of the world’s largest database of station-based precipitation data [44]. The primarily monthly data is used to develop gridded products such as version 6 monthly rainfall data, which integrates the largest station number. The GPCC data showed reliable performance when compared at various locations at the global level compared to the Climatic Research Unit gridded data (CRU CL 2.0) and ERA40 product from the European Center for Medium-Range Weather Forecasts (ECMWF). The data from the Global Precipitation Climatology Project (GPCP) from the World Data Center for Meteorology, in turn, is a monthly gridded product built by merging satellite estimates and gauge analysis from the GPCC. Version 2.3 includes adjustments for improved rainfall estimates compared to version 2.2 [45]. A study over the complex terrain of the Ethiopian highlands by Dinku et al. [7] showed the applicability of the product under those circumstances compared to the TRMM 3B43 and the Climate Prediction Center (CPC) Merged Analysis of Precipitation (CMAP) data.
The CHIRPS data is a merged product including five satellite-based and ground-station products [41]. It has previously proven reliable in the uneven topography of East Africa [30]. Over Kenya, the product has demonstrated remarkable performance as Ayugi et al. [46] found out and over drier regions as Gebrechorkos et al. [35] report, where it out-performed the Africa Rainfall Climatology (ARC2) and CHIRPS datasets. The latest version of TAMSAT data (TAMSAT 3.1), in turn, merges Meteosat thermal infrared imagery and rain gauge observations covering the entire African continent since 1983 [47]. Alongside the TRMM 3B42 and Climate Prediction Center Morphing Method (CMORPH) product, TAMSAT demonstrated high performance over the complex Ethiopian highlands in a study by [7]. Another largely satellite based product, the PERSIANN-CDR (Climate Data Record), is developed from GPCP and satellite-based data [48]. The PERSIANN-CDR has proven useful in detecting disasters as Ashouri et al. [48] showed in the 2005 Katrina hurricane product verification study, comparing also GPCP, TRMM, and the CPC gridded data.

2.3.2. Rainfall (P) and Temperature (Tmin/Tmax) Products

The Kenya Meteorological Department (KMD) indicated Machakos and Makindu, located approximately 100–200 km away from the study area KMD [32], as the two nearest ground stations. The nearest station, Kitui Agrometeorological Station, had only a 5-year record and too many data gaps to be useful for our analysis. The same applied to adjacent volunteer stations [32]. Hence the gridded data products could only be compared to the Machakos and Makindu stations that had reliable records [32,49]. The gridded products are summarized in Table 1. The KMD also provided gridded data for Kitui West [32,50]. This product is developed through the Enhancing National Climate Services (ENACTS) program [50,51,52], which works with national meteorological services across Africa to improve the quality of climate data and enhance access in essential sectors such as agriculture to counter the problem of scarce ground-based stations [29,52]. The KMD product combines spatially downscaled reanalysis data and bias corrected satellite-based rainfall estimates with sparse station-based observations. For Tmax and Tmin, 37 weather stations across Kenya were used and merged with data from the JRA-55 (Japanese 55-year Reanalysis) product (see Table 1 for JRA-55 background) [53]. Rainfall was generated using data from about 700 stations which were merged with satellite data from the CHIRPS product (see Table 1) [41,50].
The CRU TS data is a gridded product based on angular distance weighting of ground-station data from national meteorological services around the world [54]. The product’s performance has been compared to the GPCC data. The JRA-55 data, produced by the Japanese Meteorological Agency, is an improvement of the predecessor, JRA-25, where shortcomings, such as cold bias in the lower atmosphere, dry bias in the Amazon, and a longer time scale, since 1958, have been addressed [55]. Following Hua et al. [56], the product has demonstrated reliability in central equatorial Africa where a comparison was made with other reanalysis products including MERRA-2, ERA-Interim, The Twentieth Century Reanalysis (20CR), the Climate Forecast System (CFSR), the National Center for Atmospheric Prediction NCEP-1 and NCEP-2. The ERA5 data is a fifth-generation reanalysis product of the ECMWF [57]. It has a longer temporal coverage and higher resolution than the predecessor, ERA-Interim, and provides more parameters at hourly resolution accompanied by uncertainty information. A study by Tetzner et al. [58] compared the performance of the product to in-situ stations, with Kawohl [59] revealing the usefulness of ERA5 especially at high elevations. The MERRA-2 data is a reanalysis product of the Global Modeling and Assimilation Office of the Goddard Space Flight Center developed towards the aim of an integrated earth system analysis [60]. The satisfactory performance of the product as compared to the Global Precipitation Climatology Project (GPCP) and JRA-55 products is depicted by Bosilovich et al. [61] and by Hua et al. [56] over central equatorial Africa through comparison with the new gauge-based NIC31 product alongside other reanalysis data such as JRA-55 and ERA-Interim.
Table 1. Rainfall (P) and temperature (Tmin/Tmax) products used in the computation of SPEI. Original daily data were aggregated to a common monthly resolution. Only validated and widely used products with a length of more than 30 years were used.
Data ProductURLSpatial ResolutionTemporal ResolutionTemporal CoverageSpatial CoverageDesign ApplicationData Sources
KMD gridded P and Tmin/Tmax; P from ground-stations Machakos and Makindu [32,50,52]https://meteo.go.ke/, accessed on 25 February 2020.0.0375° (P)/1.25° (Tmin/Tmax)Monthlybefore 1987-after 2016KenyaDrought monitoringGauge, satellite, reanalysis
JRA-55 P and Tmin/Tmax [53,62] https://rda.ucar.edu/datasets/ds628.0/, accessed on 21 February 2021. 1.25°HourlySince 1958GlobalClimate variability/change monitoringReanalysis
ERA5 P [57]https://cds.climate.copernicus.eu/cdsapp#!/dataset/reanalysis-era5-land-monthsly-means?tab=overview, accessed on 6 May 2020.1° × 0.1°; native resolution 9 kmHourlySince 1981GlobalDrought forecastingReanalysis
MERRA-2 P and Tmin/Tmax [60]https://disc.gsfc.nasa.gov/information/howto?title=How%20to%20Download%20MERRA-2%20Daily%20Mean%20Data, accessed on 20 June 2020.0.5° × 0.625°Hourly1980–2017GlobalClimate monitoringReanalysis
GPCC 2018 P [44]https://opendata.dwd.de/climate_environment/GPCC/html/, accessed on 17 March 2020. 0.5°Daily1891–2016GlobalDrought monitoringGauge, satellite
GPCP 2.03 P [45]https://www.ncei.noaa.gov/data/global-precipitation-climatology-project-gpcp-monthly/access/, accessed on 12 June 2020.0.5°Daily1901–2018GlobalClimate variability/extremesGauge, reanalysis
CRU TS 4.03 P and Tmin/Tmax [54]https://www.chc.ucsb.edu/data/chirps, accessed on 23 March 2020.0.05°5 daysSince 198150° S–50° NEarly warning, drought monitoringGauge, satellite
CHIRPS 2.0 P [41]https://www.chc.ucsb.edu/data/chirps, accessed on 18 September 2020. 0.0375° 5 days, dailySince 198350° S–50° NRisk assessment, drought insurance, early warningSatellite
TAMSAT 3.1 P [47]https://www.tamsat.org.uk/data/rfe/index.cgi#main-content, accessed on 16 June 2020.0.25°HourlySince 198360° S–60° NClimate change/variability studiesSatellite

2.4. Areal Averages

The meteorological data were averaged over the study area by weighted average, proportional to the contribution of each grid cell to the study area shape (see Figure S1 and Equation (S1) of the Supplementary Information). For each data product, the grids differed in their intersection with the study area (see Figure S2). Correlations of the areal averages with the nearest ground-stations at Machakos and Makindu and the gridded rainfall data provided by the KMD were greater than 0.6 (see Figure S3). Following Sun et al. [63], we used the native resolution of the products (Table 1) in the computation of areal averages. Nevertheless, topographic information could be included in interpolation in future studies, certainly when covering greater areas in East Africa where the topography is highly variable.

2.5. Key Informant Interviews

Balint et al. [3] recommend the triangulation of SPEI output in order to reinforce the results while also contributing to a broader understanding of the temporal evolution of droughts and ongoing responses. Following Denscombe [64], we additionally view methodological triangulation (referred to as triangulation in the text) as an optimal approach for integrating qualitative and quantitative data to generate a confirmatory picture. Therefore, in addition to the SPEI calculations using the 40 blends of rainfall and temperature products, information on drought occurrence and severity was obtained by interviews with 14 key informants with a track record of working on droughts and related activities, e.g., food security, humanitarian, and farm-based interventions, in the study region (Table 2). The key informants include representatives from Non-Governmental Organizations (NGOs) and government agencies at the national and county-level). The interviews were conducted between August 2020 and February 2021 as video meetings and were preceded by official communication. They included discussions under the broad subjects of drought frequency, trends, and history as observed in the interviewee’s line of activity, nature of responses implemented with regard to water storage and on-farm interventions, collaboration with the affected communities, and experiences and prospects under the relatively new county governance system. The interview guide is included in the Supplementary Information under Breakdown S1. A snowball sampling approach was used, where each key informant was asked to suggest equally active organizations in the study area for further interviews [64]. The organization’s profile and activities were also reviewed via desktop-based research. Some interviews were recorded upon consent of the interviewee; for others, notes were taken.

3. Results

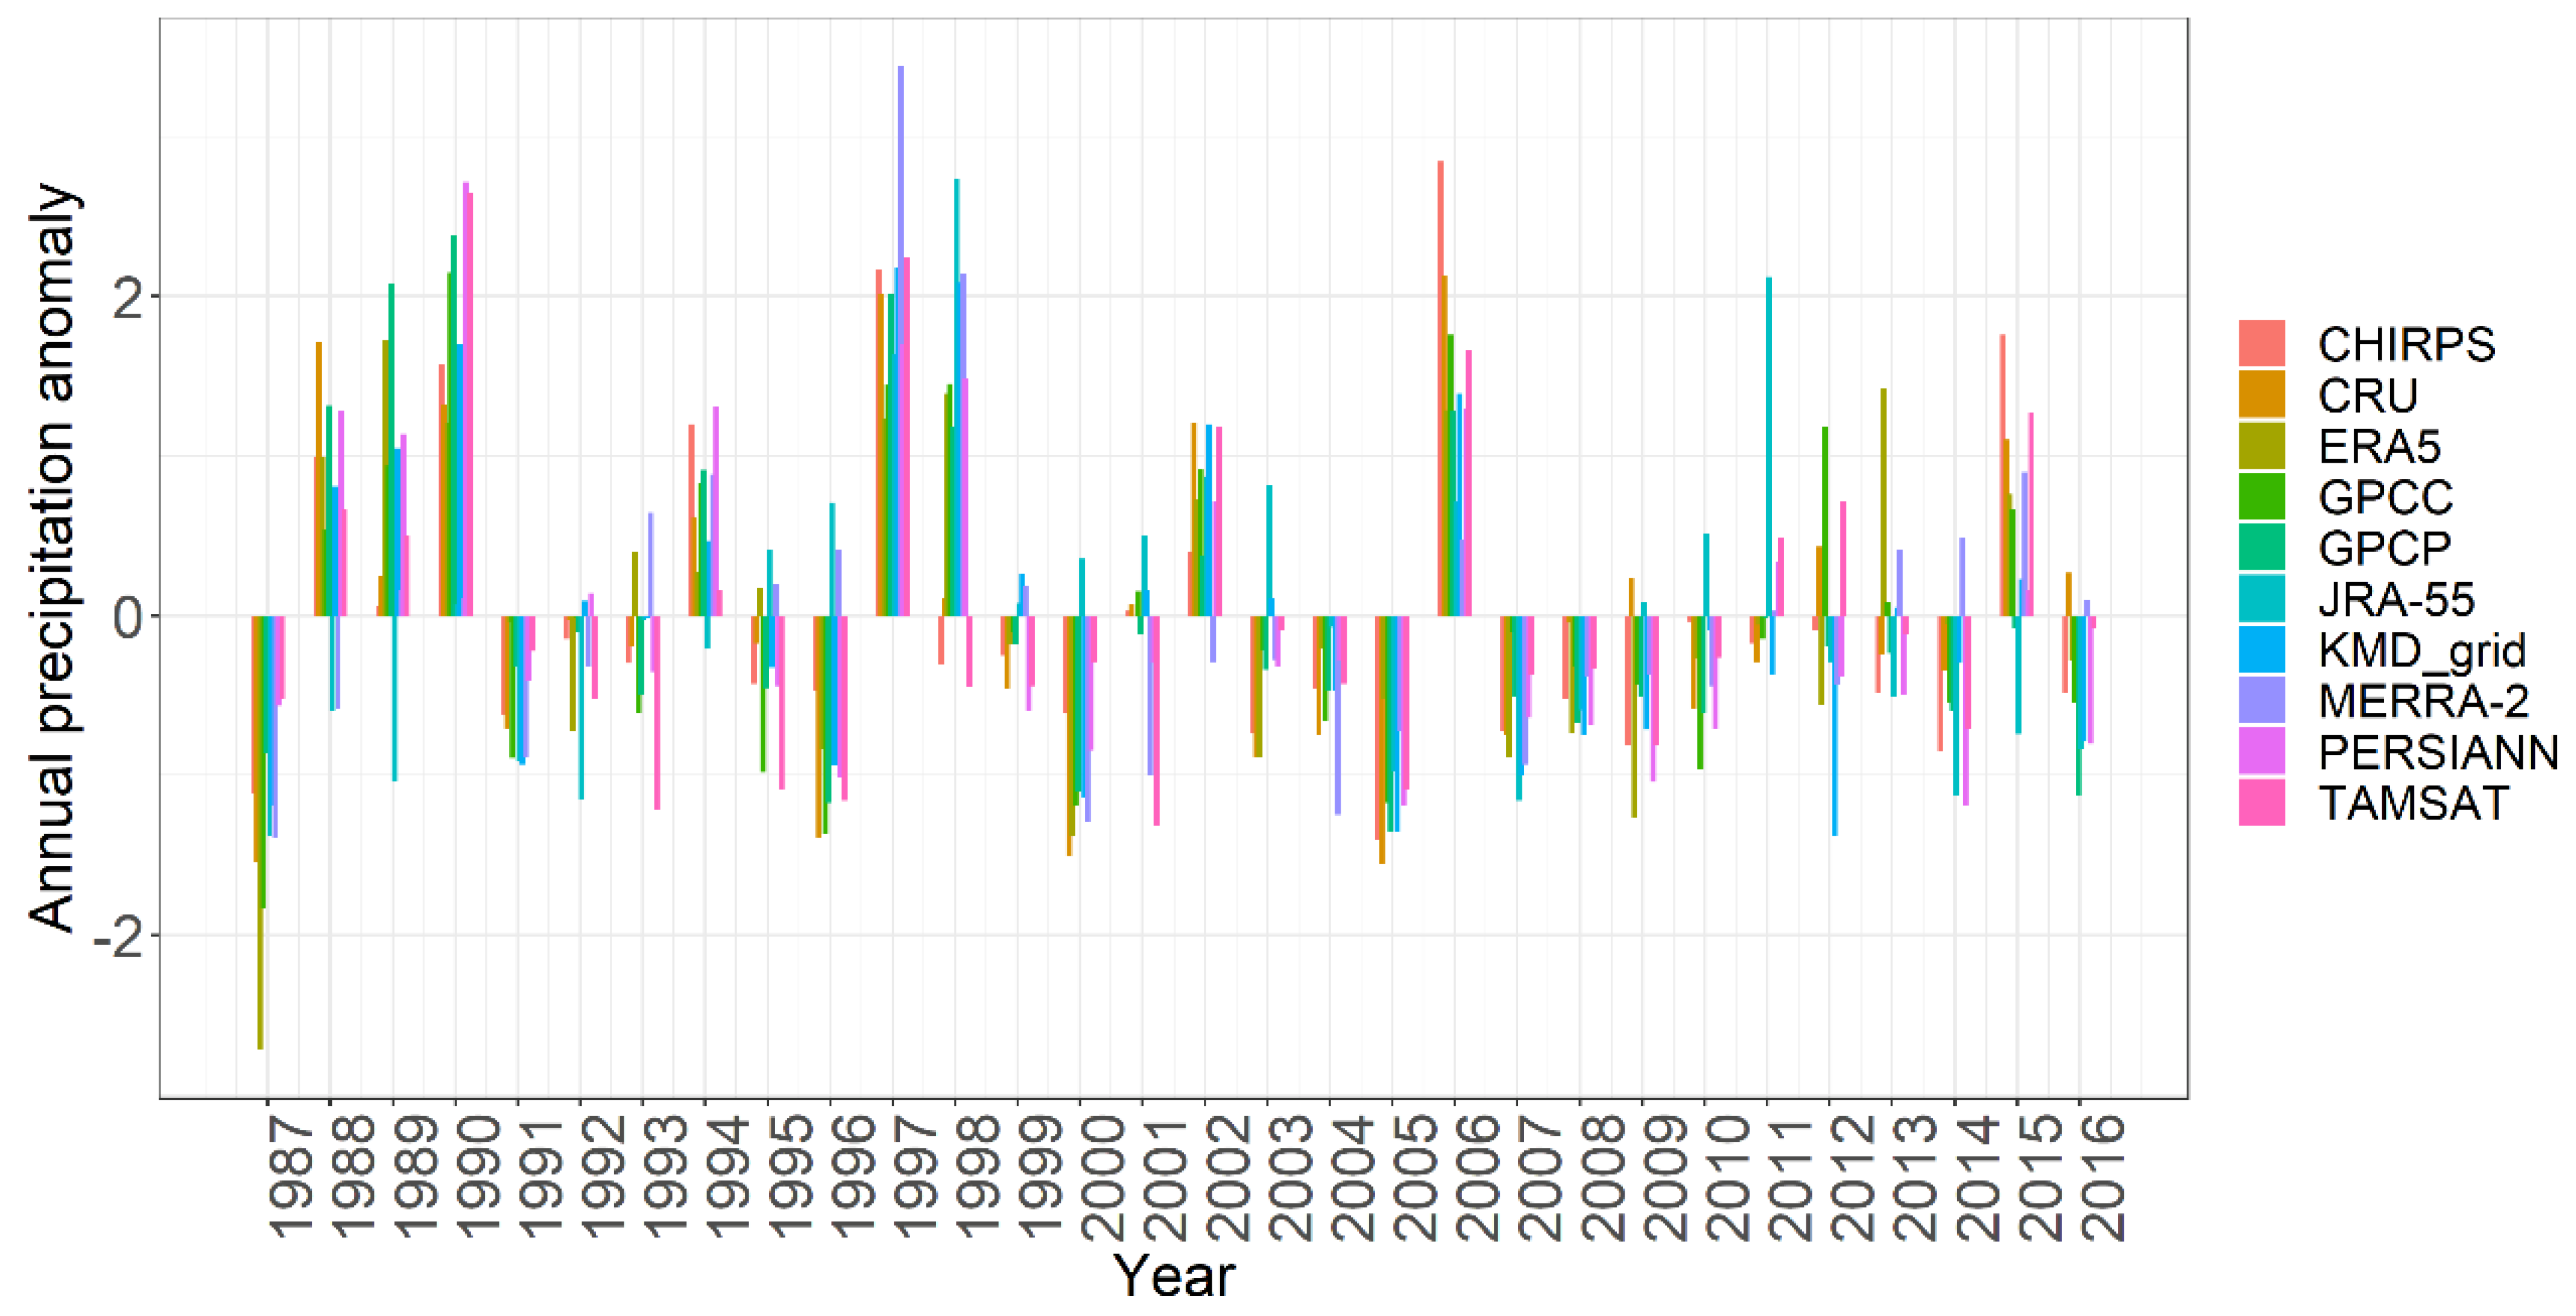
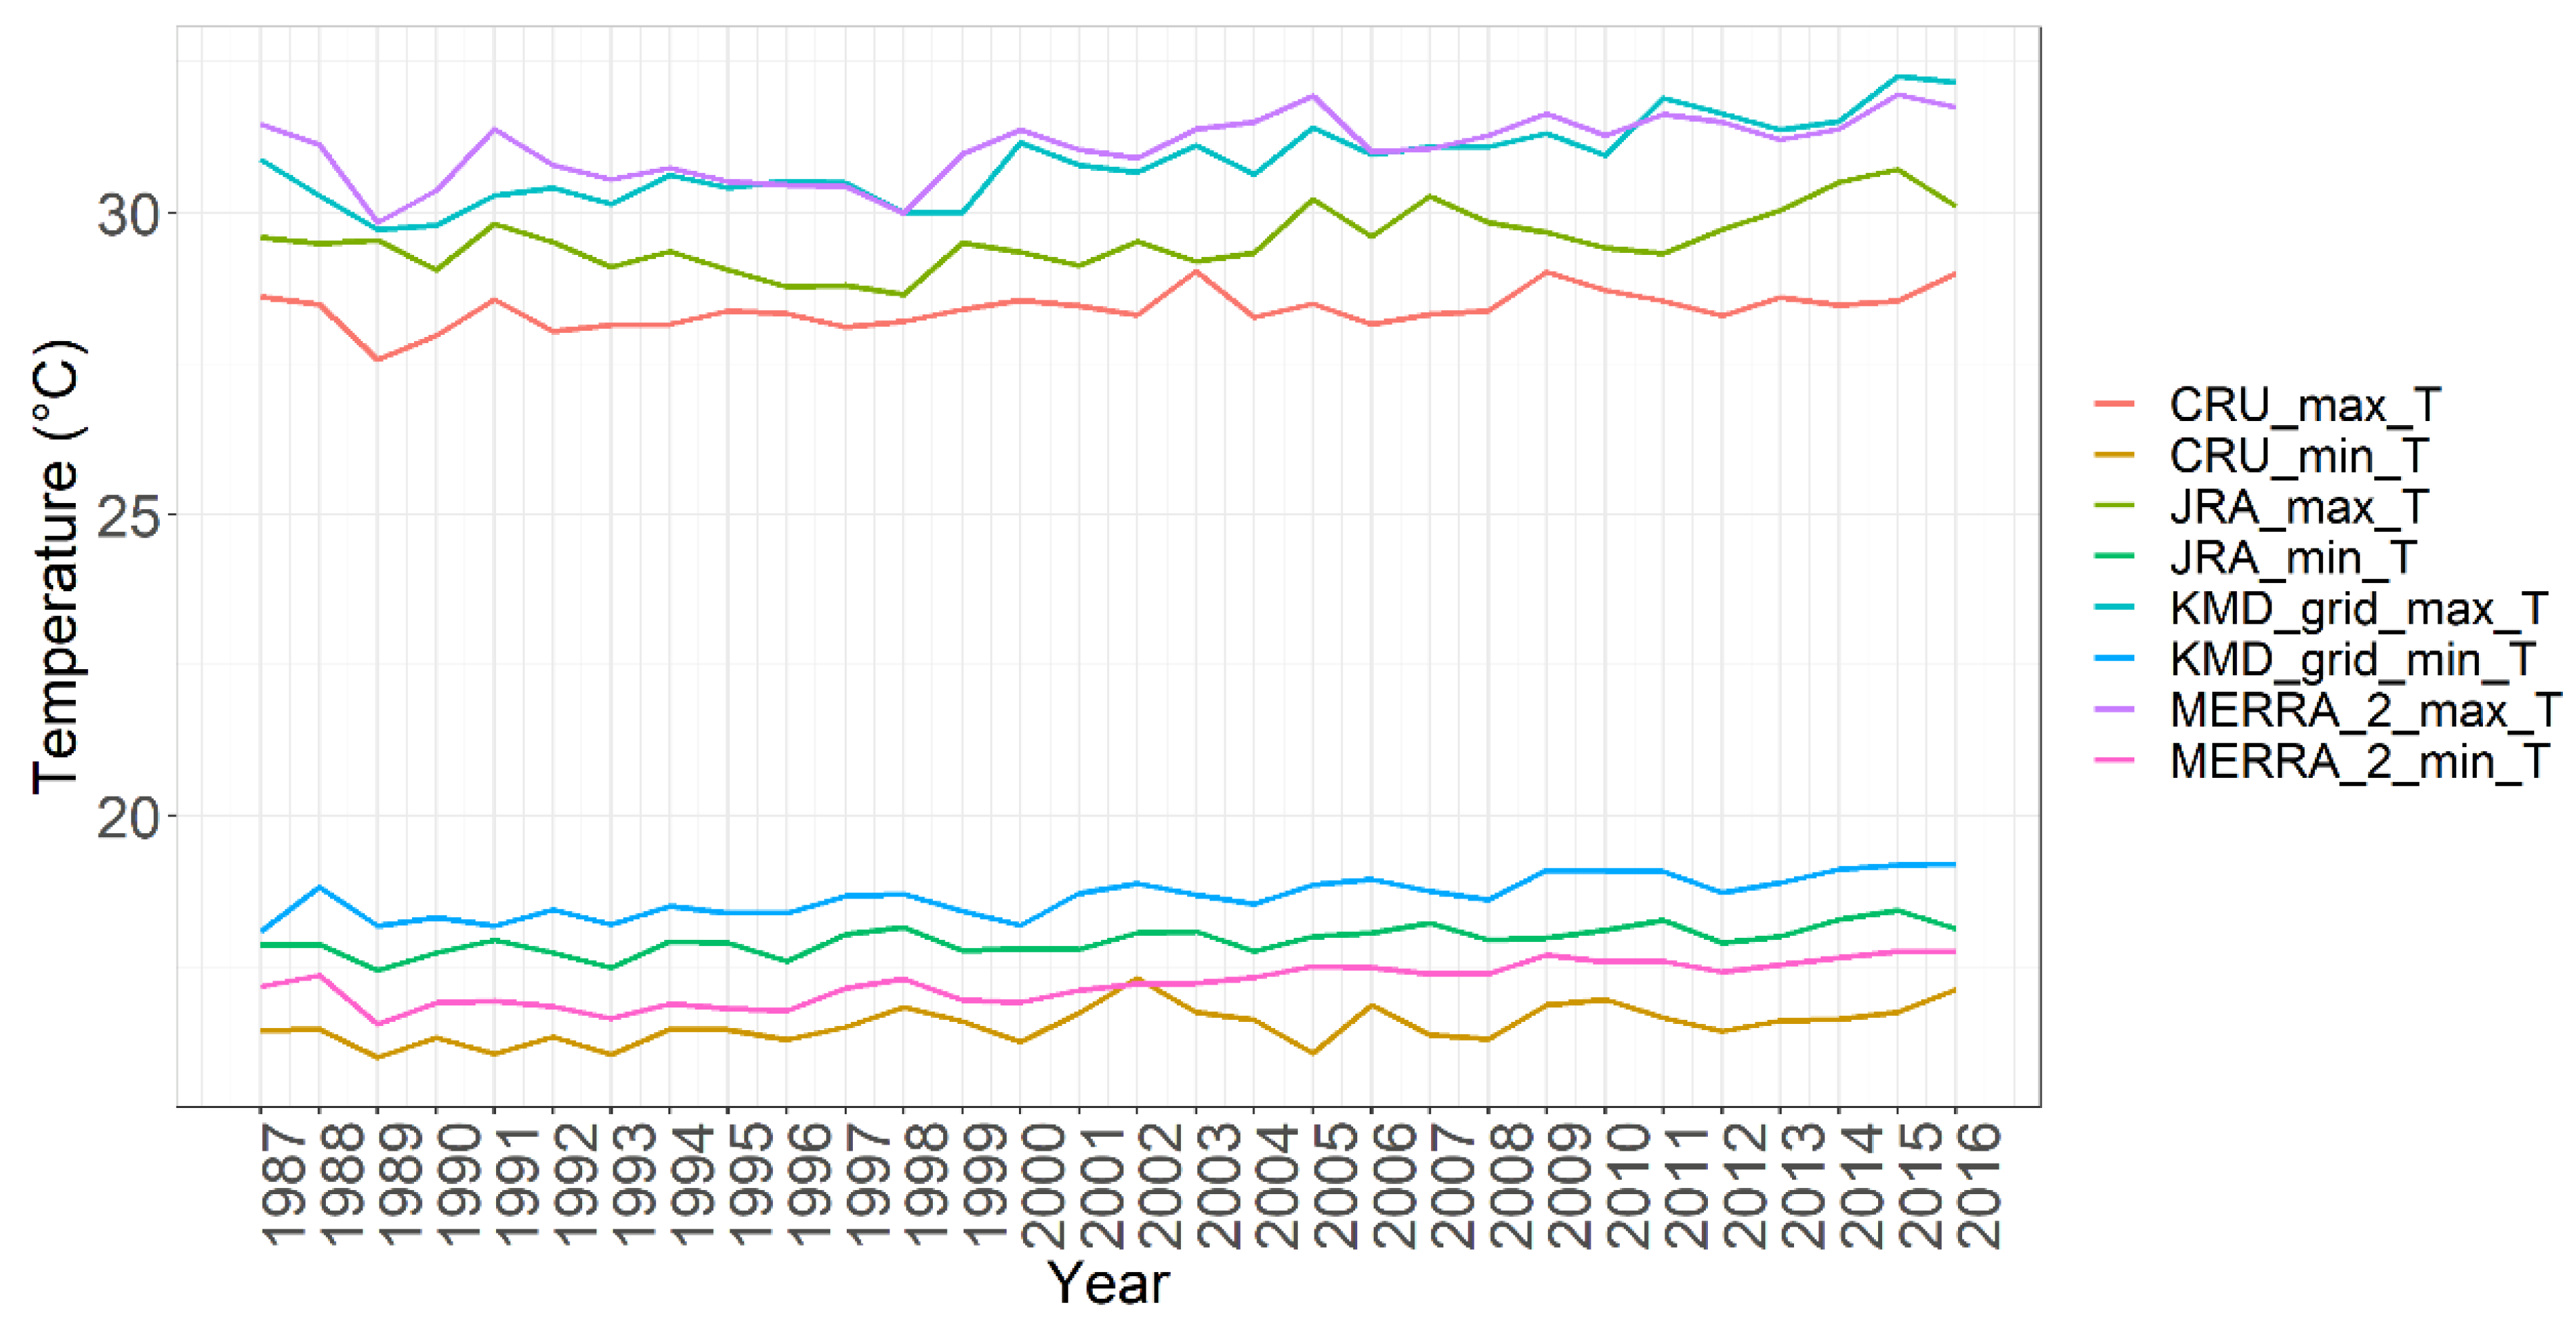
3.1. Precipitation and Temperature Variability

The inter-annual variability in precipitation across the study area is high and frequently exceeded ±1 standard deviation (in 30% of the cases), less often ±2 standard deviations (5% of the cases), (Figure 2; for zoomed-in versions see Supplementary Information, Figure S5). Mean absolute deviation; for zoomed-in versions see Supplementary Information, Figure S5). Mean absolute deviation was 154 mm for annual precipitation, and negative precipitation anomalies were more frequent but had lower magnitudes as compared to the positive precipitation anomalies. The annual mean of all products was 656 mm, with a standard deviation (SD) of 197 mm and a coefficient of variation (CV) of 32%. The data products often, but not always, agreed on the direction of the anomaly (70% of the cases), but generally disagreed on the magnitude of the anomaly across all years (Figure 2). The precipitation products in greatest disagreement with the others were JRA-55 and MERRA-2 reanalysis. These products showed positive anomalies when most of the other products agreed on negative anomalies in 1993, 1995–1996 (both), 1999 (MERRA-2), 2000–2001, 2003, 2009–2010 (JRA-55), and 2013–2014, 2016 (MERRA-2), or negative anomalies in case of otherwise widespread agreement on positive anomalies in 1988 (both), 1989, 1994 (JRA-55), 2002 (MERRA-2), and 2015 (JRA-55). These two products also turned out the least correlated with other products and the measurement stations (Figure S3; correlations between 0.5 and 0.8). The greatest inter-product agreement was found in the years 1987, 1991 (negative anomalies), 1997 (positive anomaly), 2004–2005 (negative anomalies), 2006 (positive anomaly) and 2007–2008 (negative anomalies). The greatest disagreement was found in the years 1989, 1992–1993, 1995, 1998, and 2001, and the more recent years of 2010, 2012–2013, and 2015–2016.
There was less variation in Tmin/Tmax compared to precipitation (mean = 29.97 °C, SD = 0.86 °C, CV = 1.74%; mean = 17.59 °C, SD = 0.30 °C, CV = 1.67% for Tmax and Tmin, respectively). The Tmin/Tmax products were more similar in inter-annual pattern than magnitude (Figure 3). KMD and MERRA-2 largely agreed both in terms of Tmax pattern and magnitude, whereas CRU and JRA-55 showed a similar pattern but lower values (see Table S1 for means and CV). For Tmin, the products were largely in agreement in terms of pattern, but not in magnitude, with mean Tmin decreasing in the order KMD, JRA-55, MERRA-2, and CRU (see Figure 3 and Table S1). The agreement in pattern could also be seen in the correlation analysis (Figure S4; all coefficients greater than 0.8).

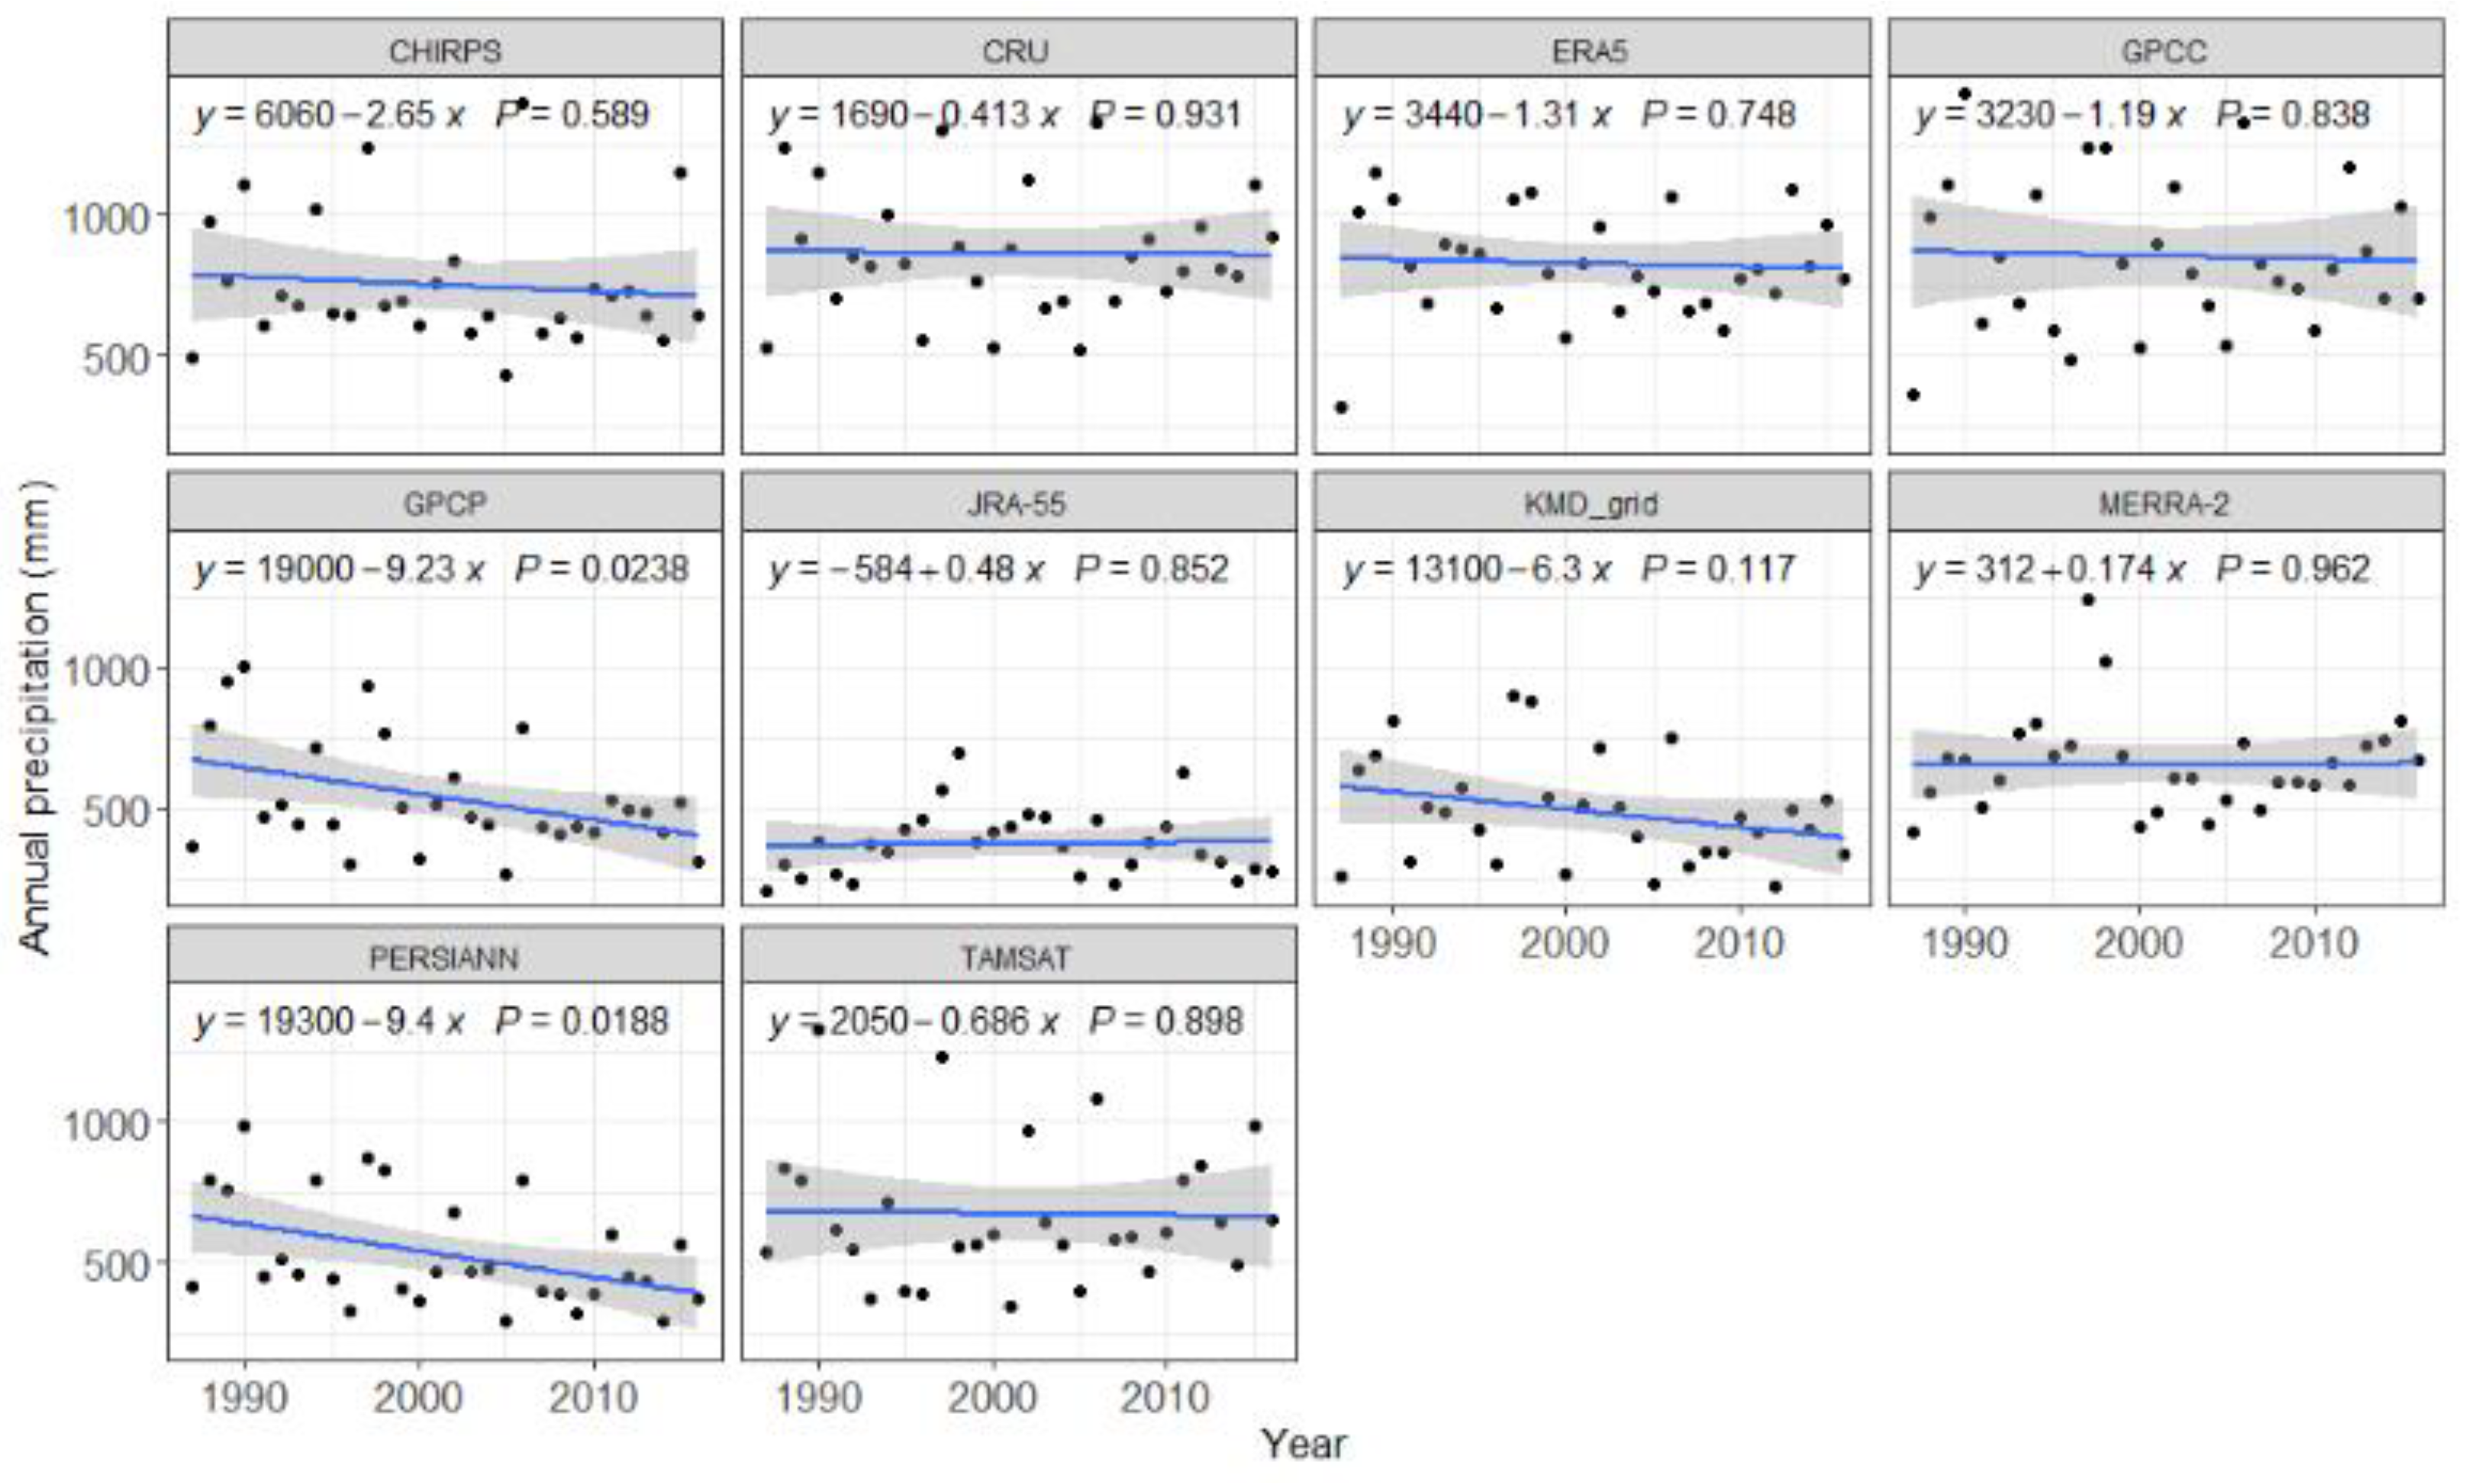
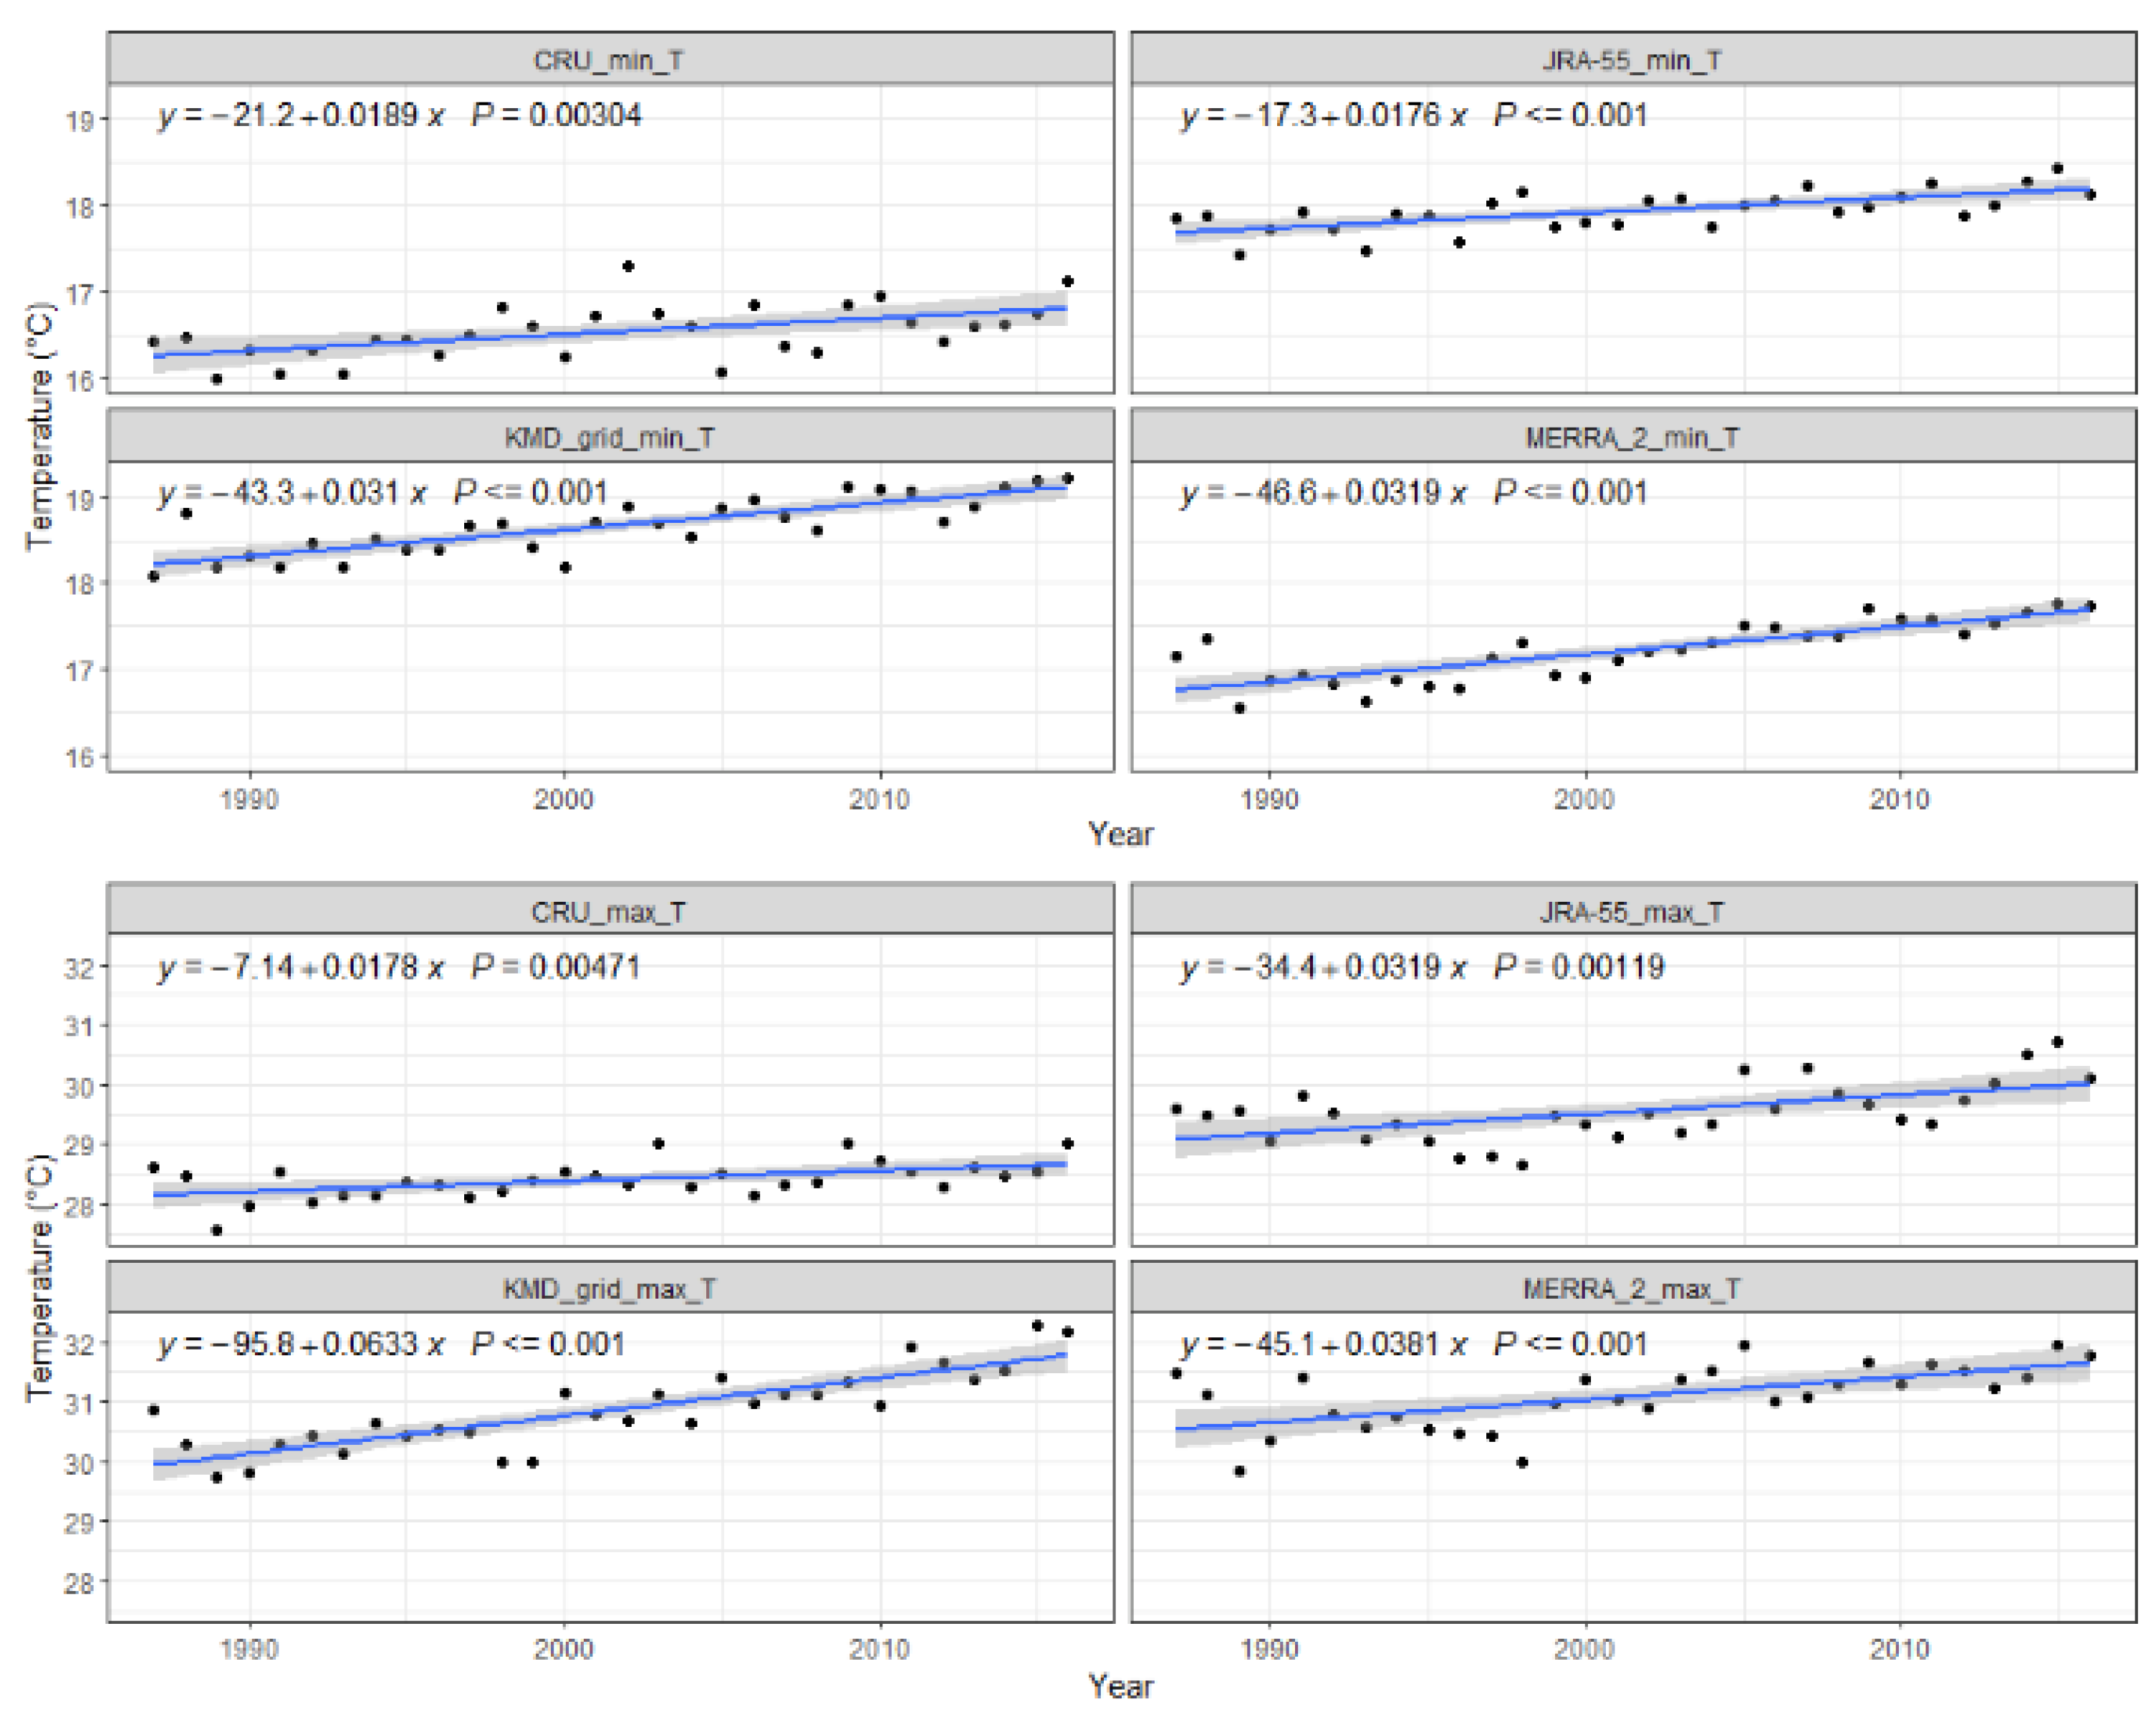
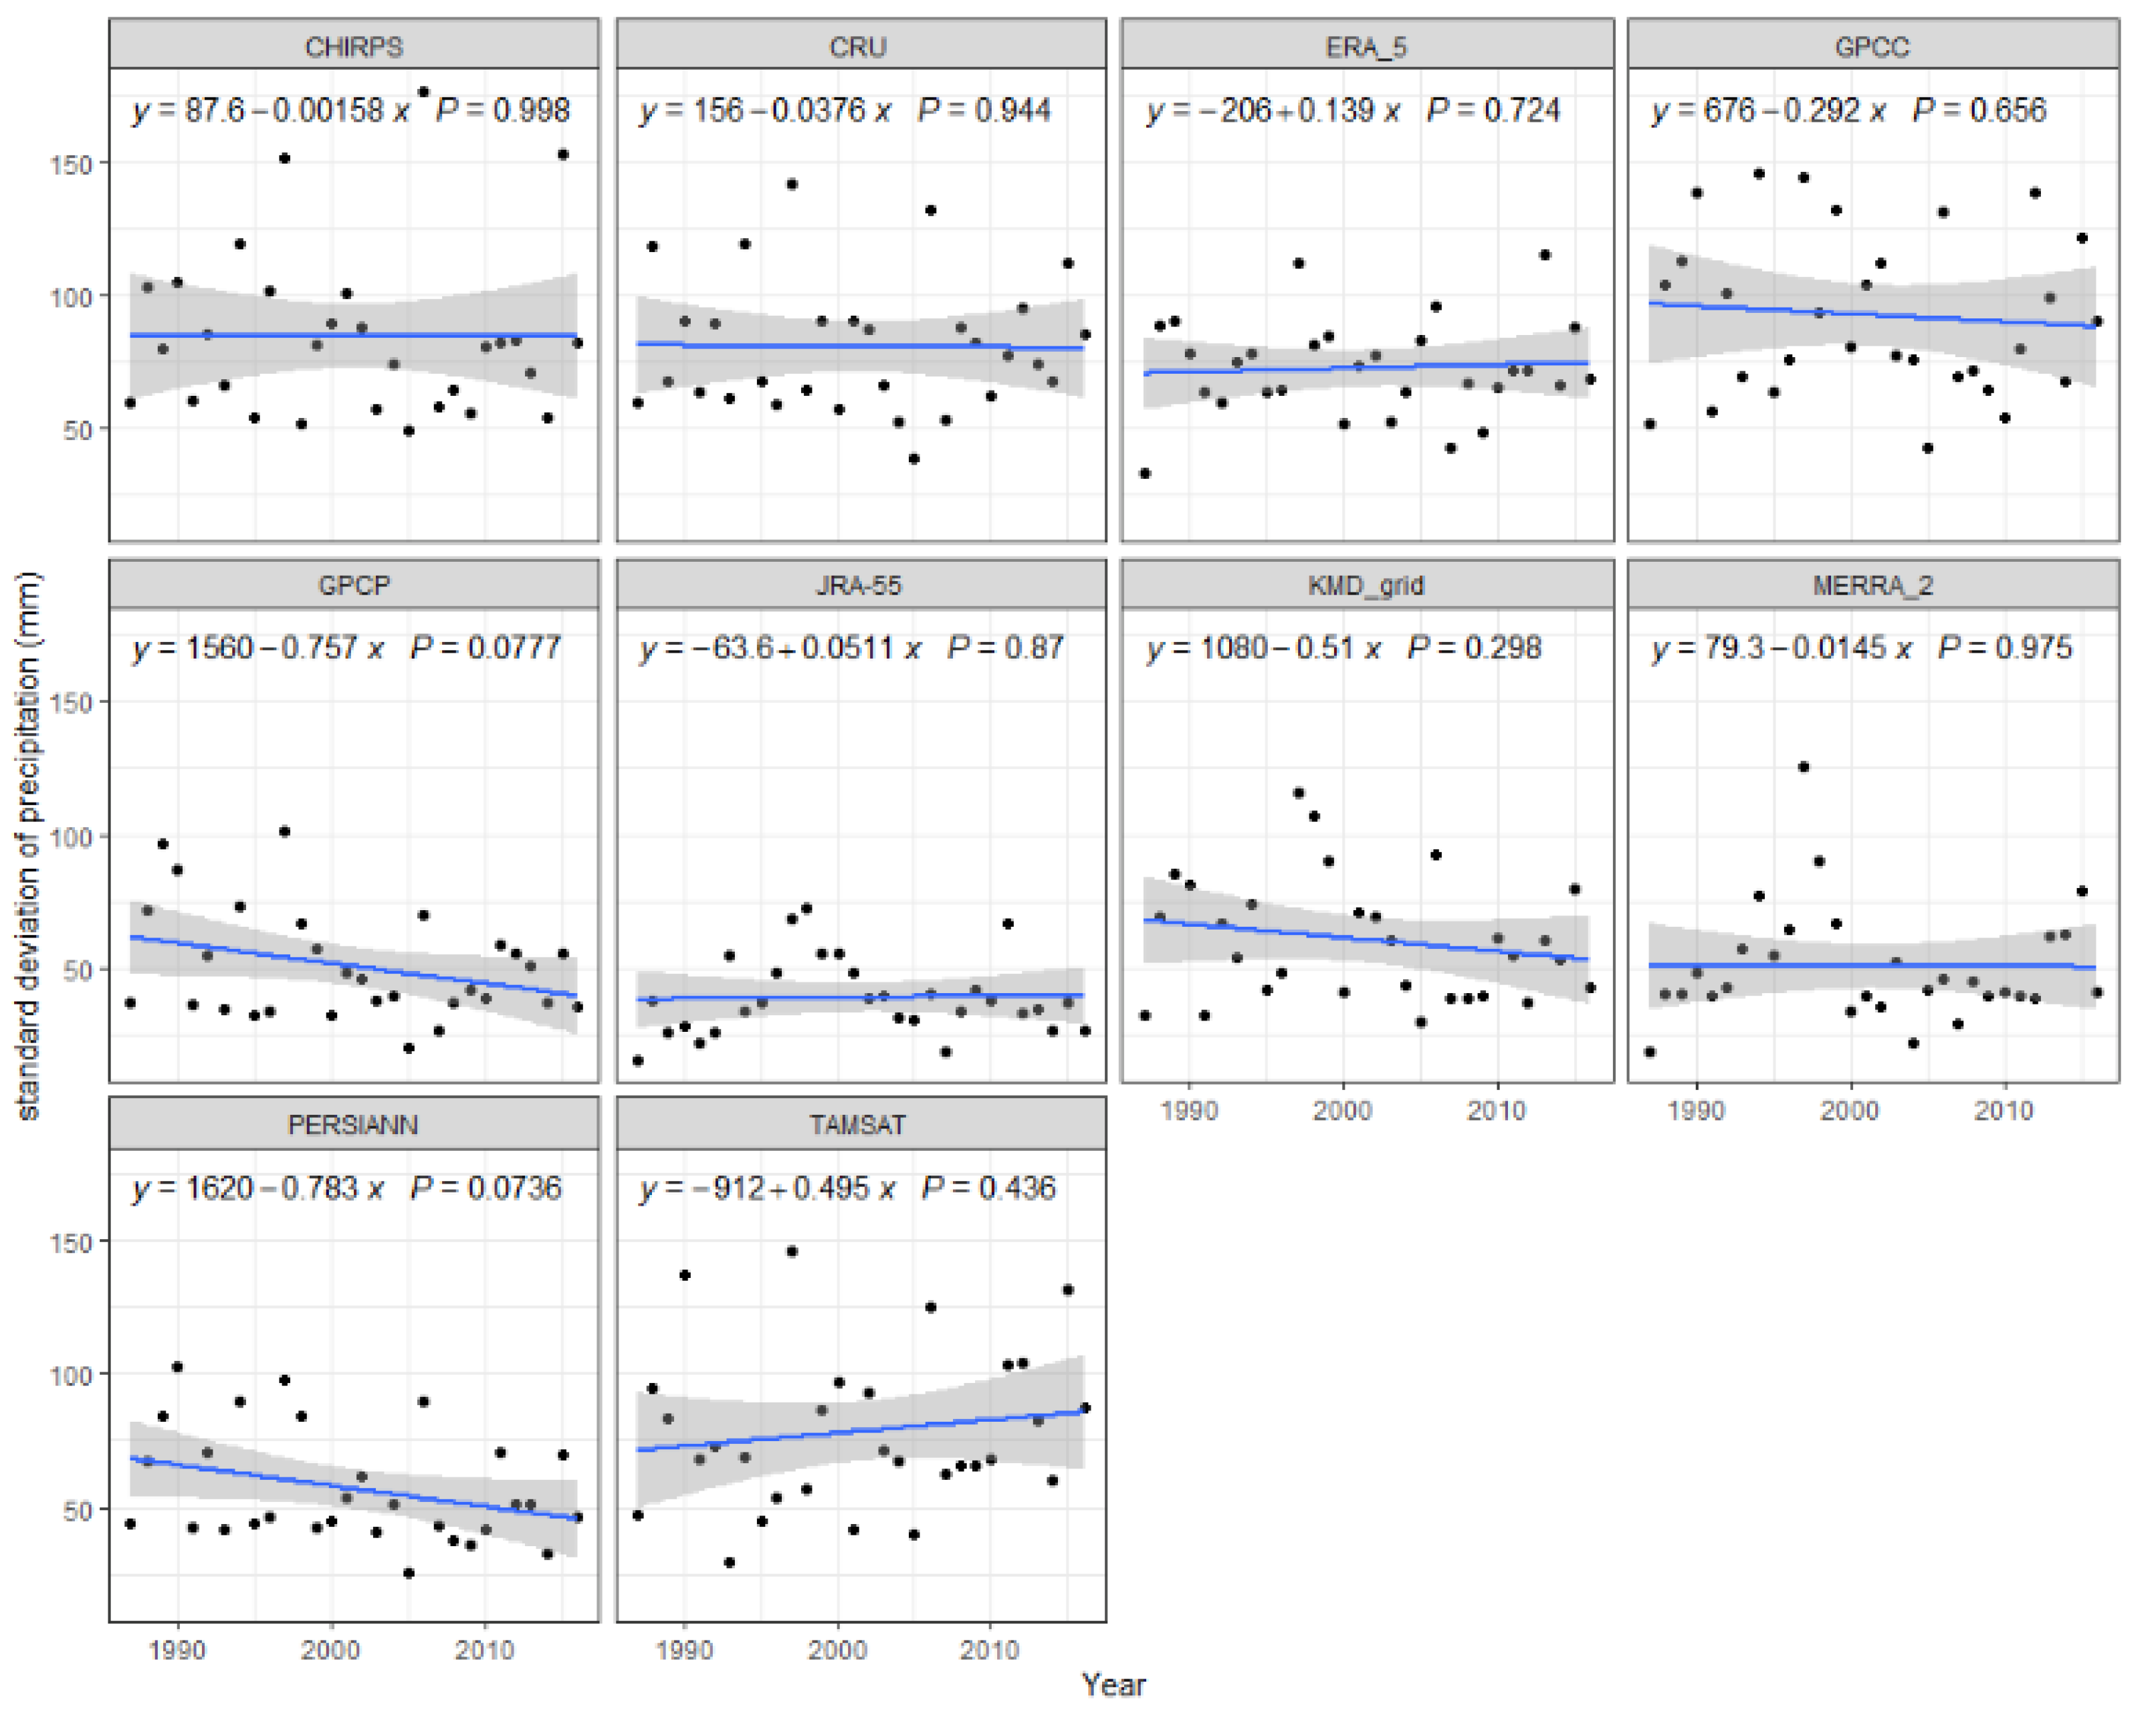
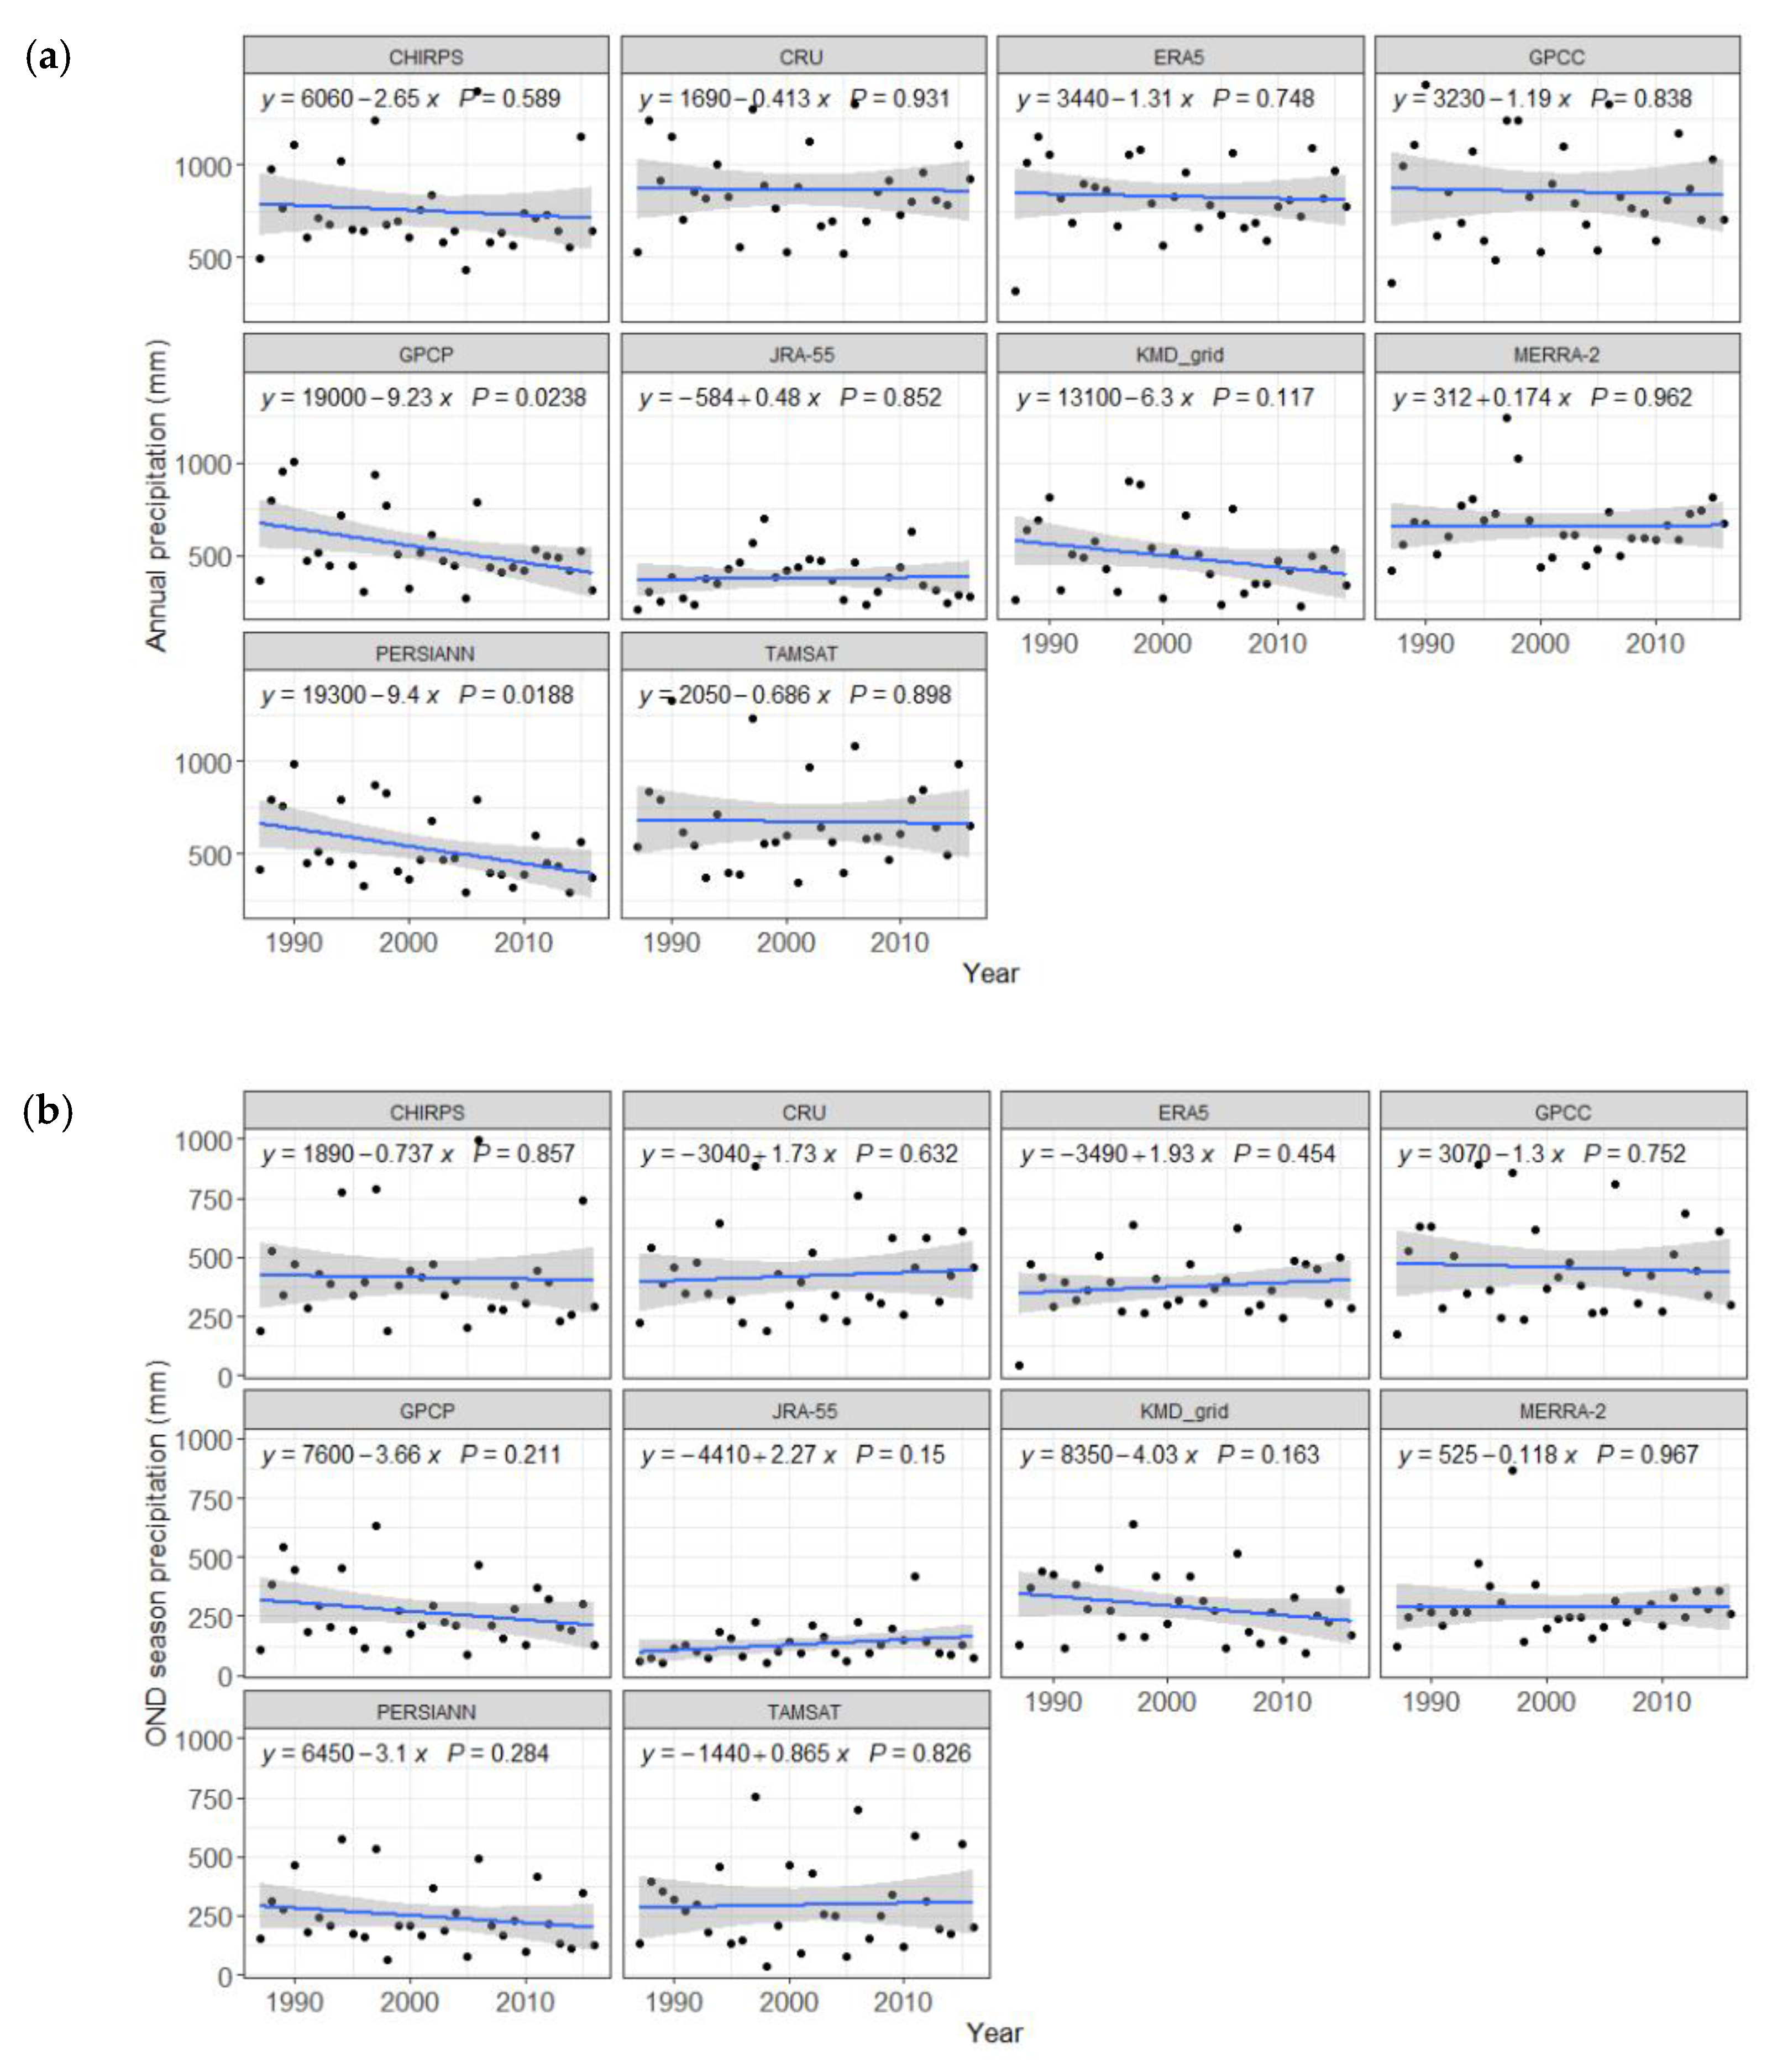
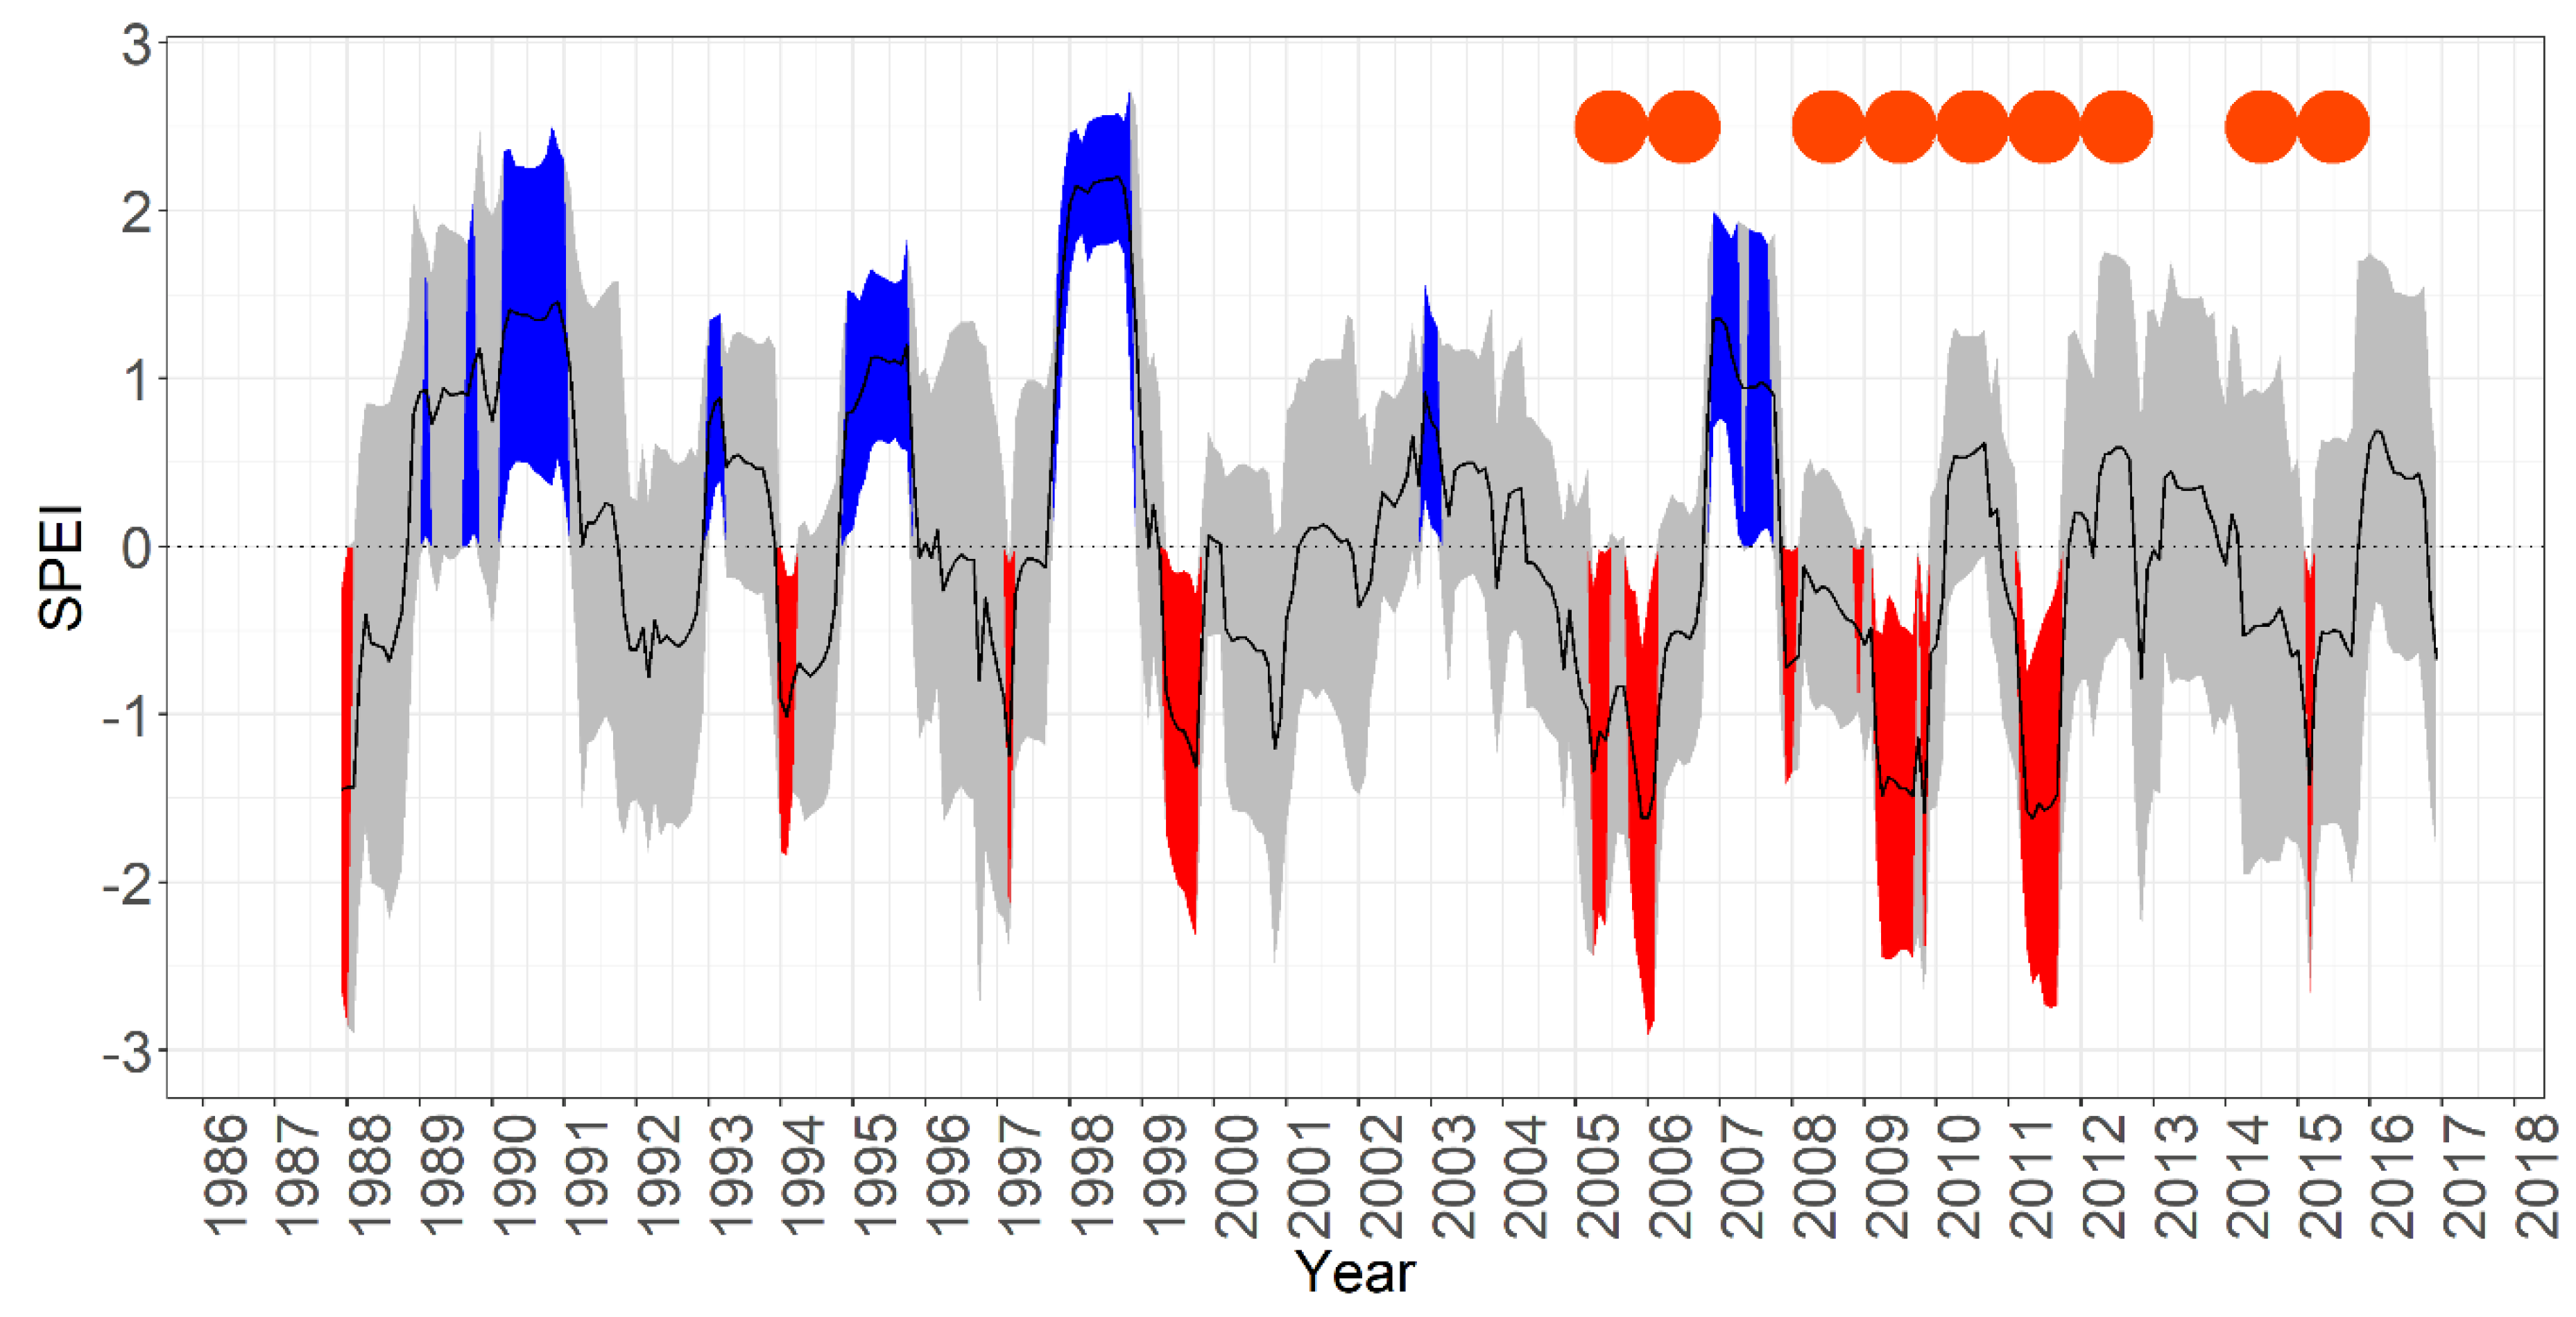
3.2. Precipitation, Temperature Trends, and SPEI-Based Drought Identification

All products agreed (at the 0.01 significance level, referring to the t-test of significance of linear regression slope) on an upward trend of Tmin of about 0.02–0.03 °C per year and of Tmax of about 0.02–0.06 °C per year (Figure 4). The annual rainfall sums showed no trend or a declining trend, but none of these were significant at the 0.01 level (Figure 5). The standard deviations of rainfall likewise showed no significant trends (Figure 6). The same applied for seasonal trends (Figure 7). Despite the differences in the precipitation and temperature products, once propagated to the SPEI the differences smoothed out, yet differences in onset, duration, and magnitude of drought remained (Figures S7–S10).
Out of the 40 blends, 18 agreed on a statistically significant (at 0.01 level) trend in SPEI of 0.0001 to −0.0098 units month−1, suggesting increasing instances of drought occurrence (Figure S7–S10). Those trends were consistent across the temperature products with CHIRPS, GPCP, KMD_grid, and PERSIANN rainfall, sometimes with ERA-5 and JRA-55, and in one instance with CRU rainfall (Figure S7–S10). Plotting the SPEI mean and standard deviation across the product blends further consolidated the picture (Figure 8). Unambiguous drought years, according to the data products, were 1994, 1996–1997, 1999–2000, 2005–2006, 2009, and 2011. More ambiguous were 1988, 1991–1993, 2001–2004, 2008, 2010, and 2012–2016. Drier conditions in recent years, as suggested by the trend analysis, could be seen in 2005–2006 and 2008–2012, compared to more positive anomalies in the 1990s and early 2000s.
The information from the key informant interviews agrees with all unambiguous droughts in the timespan (2005–2006, 2009, and 2011) and the one year which was unambiguously wet (2007). The interviews also pointed to droughts in 2008, 2010, 2012, and 2014–2015 where the SPEI information based on the different data products was ambiguous. In the other ambiguous years, 2013 and 2016, the key informant interviews pointed to no drought. Hence it would seem that key informants engaged in drought relief on the ground can help resolve the ambiguity resulting from the disagreement between meteorological data products. Their input is thus fundamental for drought identification in regions with scarce ground stations.

4. Discussion

4.1. Uncertainty in Rainfall and Temperature Estimates and Propagation to SPEI

Reliable assessments of the onset, magnitude, and duration of drought are vital in agro-pastoral ecosystems, not only to understand impacts on livelihoods but also to signal and assess the reliability of responses [2,65]. In the absence of reliable meteorological data as a result of sparse in-situ station density over Kenya [16,32,35] and other African countries, rainfall and temperature data from gridded products can overcome data scarcity for large-scale drought assessment [7,46,66]. These products, however, are subject to uncertainty, including gauge-level measurement errors in the underlying station data, the number and representativeness of the stations used, interpolation steps, structural, parameter, and general input data uncertainties of the meteorological models used [21].
The abundance of gridded data products available thus creates both a challenge and an opportunity for users. Choosing a single product can lead to biased drought estimations as AghaKouchak et al. [67] found out; hence; the use of multiple products in an ensemble approach is preferable [68]. Such an approach will add uncertainty information to the gridded products that can improve decision making in response and management operations [67]. That said, uncertainty in drought magnitude should in no way instill a sense of complacency as increasing extreme events such as droughts over East Africa have already resulted in deterioration of livelihoods and ecosystem integrity [69,70,71].
In the current study, uncertainty manifests itself in differences between the data values of gridded meteorological products, with annual minimum and maximum temperature varying less than rainfall. The temporal pattern of the Tmax and Tmin input was also more similar across products than that of rainfall. The variation of SPEI across data blends therefore predominantly reflects the variation of the rainfall data. Plotting the SPEI ensemble mean ±2 standard deviations identified periods of unambiguous dry and wet years, while ambiguous periods could be resolved by information from key informants engaged in drought relief on the ground. It should be noted that the uniform weighting of SPEI ensemble members neglects the similarity between some of the data blends, as they use similar data and assumptions, which are, however, hard to disentangle and quantify in an alternative weighting scheme. As such, we could not authoritatively pick out a superior data product but observed the similarity in detecting drier years. Drought occurrence was thereby much less ambiguous than drought severity.

4.2. Annual and Seasonal Trends

By comparing 10 precipitation products, we found no evidence of a statistically significant trend (although there could be a trend), neither in annual rainfall nor seasonal rainfall totals, nor annual standard deviations. This finding is in contrast with the declining rainfall trend over East Africa reported by [36,38,71,72] and [11]. It is also in contrast with the key informant information that the March-April-May (MAM) rain season, being the longer of the two seasons and essential in the farming calendar, has demonstrated unreliability in recent years. Agricultural water demand is likely rising considering the growing population [20,37], nevertheless declining length of the March-April-May season could be the principal factor of increasing water scarcity, rather than burgeoning anthropogenic water needs. Since rain-fed agriculture is the primary source of livelihoods in the study area and the primary contributor to the economy [36,37], a decrease of rainfall in the long season and a general shortening of the season is a major concern [73]. However, the reported unreliability of the March-April-May season in recent years could also be reflective of generally drier soil conditions in response to the positive temperature trend which we did find across all data products, or changes in sub-seasonal rainfall timing that are not visible as a trend in annual standard deviations. Both would propagate to lower SPEI values, which in our case and for most products agree with an increase in drought instances in recent years.
The absence of evidence of a significant trend in the shorter October-November-December (OND) rain season in our case (Figure 7) differs from recent studies over Kenya [38]. The key informants and the Kenyan Government GoK [74], however, support our finding by mentioning that the shorter OND season has shown more reliability in supporting farming compared to the longer MAM season. This is manifested by greater seasonal rainfall averages in the OND season in most products (Table S2). The OND season, however, shows greater variation than the MAM season (Table S2) as also reported by [75]. The MAM, especially due to its lower variability, thus remains important for agroecosystem productivity in the region, with a likely atmospheric teleconnection with the OND as shown by [71]. The MAM season plays a primary role in the farming calendar of the study area, accounting for about 30% of crop productivity, and supporting cultivation of staple pulses such as pigeon peas and green grams [74].
With regard to temperature, all data products compared in this study agreed on positive trends in min/max temperatures. While the products were in greater agreement about the magnitude of the Tmin trend, the Tmax trend magnitude varied more between products. This agrees with findings over Kenya by Ayugi and Tan [46] who found increasing trends of min/max temperatures, and Camberlin [76] who similarly reports a marked warming in the Horn of Africa. Ayugi and Tan [46] found warm days to be increasing and cold nights to be decreasing, as well as summer days to be increasing, over Kenya, confirming the picture of rising temperatures.

4.3. Anomalies, Drought Identification, and the Value of Triangulation

The 10 different precipitation products compared in this study generally agreed on years with negative rainfall anomalies. However, the products disagreed considerably on the magnitudes of those anomalies. The anomalies, seen in Figure 2, demonstrate the prevailing inter-annual variability in the study area [75]. The anomalies propagated to droughts of varying magnitude, confirmed by unanimously negative SPEI values or key informants in 27% of the 30 years. However, in 1988, 1991–1993, and 2001–2004 there was disagreement between the products and the key informant information did not reach that far back.
The 2010–2011 period is widely reported as the worst drought in a 60-year span in the Horn of Africa [11,71,77] which is confirmed by the key informants for the study area but unanimously confirmed by the SPEI products only for 2011. While in most years the multi-product approach allows us to robustly identify drought and get a handle on the uncertainty in drought magnitude, from 2008 onwards, the greater disagreement between the data products, both in terms of SPEI direction and magnitude, highlights the potential of information from actors engaged in drought relief in the region. Our key informants worked in disaster risk management, food security, water storage/harvesting and climate change resilience building, i.e., sectors that are sensitive to drought conditions. These experts’ inputs are therefore viewed as important in the continued assessment and response to droughts with their observations contributing to resolving ambiguity.
These inputs are particularly valuable in drought assessments for relatively constrained spatial extents, as informant data on droughts can be assumed to cover the entire study area. For large-area drought estimations covering larger regions or featuring more localized droughts, spatially explicit information on the location and extent of informant activities must be collected during interviews and integrated into the verification of the drought occurrence estimation. The involvement of key informant observations and meteorological data covers the blind spots of the respective category.
According to the EM-DAT global disasters database EM-DAT [78], the year 2010 experienced large-scale drought conditions in the coastal, northern-most, and north-eastern locations. Our analysis suggests that the 2010–2011 drought conditions had existed already since 2008 and continued until 2012, even though the year 2010 showed wetter conditions in some of the products, as also confirmed by [70]. The effects of the severe 2011 drought might have carried over to 2012, with SPEI showing no sign of relief, although the actual magnitude of SPEI is ambiguous in that year. The effects of this prolonged drought period were devastating among the households largely dependent on rainfed agriculture. Essential sectors such as energy, which is largely hydro-based, were negatively impacted across East Africa [2,6]. In Kenya, a total of 3.75 million persons, primarily in the north and parts of the south-east, were affected by the resulting food shortage according to the global record of mass disaster occurrence [78]. The drought period 2005–2006, confirmed by most products, was followed by wetter conditions in 2007, which exacerbated impacts. As [18,36,77] discuss, livelihoods and natural ecosystems across East Africa were severely impacted by the drought and, as Nicholson [70] reiterates, subsequent flash floods. The drought conditions seem to have commenced in 2004 and peaked in 2006, a classic demonstration of the evolving nature of the hazard [4,22].
A case of disagreement between the SPEI blends are the years 2014–2015, which were confirmed as drought years by actors engaged in drought relief in the area and the EM-DAT database. EM-DAT mentions the year 2014 with only a few areas in northern and north-eastern Kenya affected. In this light, south-eastern Kenya, including Kitui West, might have seen milder drought conditions. The National Drought Management Authority of the Kenyan government (NDMA) reports that in 2013–2014, during the OND, the greater Kitui region experienced moderate drought conditions and instances of decline in crop production and crop failure [79,80]. Triangulation of the SPEI calculations with qualitative information on the ground showed its greatest value here. The qualitative input effectively resolved the ambiguity between the data products. However, the qualitative data, too, have the potential for errors, including false recollections, difficulties in estimating the length of a drought and distinguishing trends and extremes, influences of recent events and media attention on past occurrences, and willfully biased responses with the aim to attract funding by exaggerating the severity of the drought situation [81]. On their own, the qualitative data lack information on drought magnitude and timing, which is something that the SPEI analysis can provide, albeit with uncertainty.

5. Conclusions

We revealed uncertainties related to the choice of rainfall and temperature products for the calculation of SPEI in the context of identifying past drought conditions in the semi-arid Kitui West area of Kitui County, south-east Kenya. We thereby complement existing studies with a demonstration of the variation of data products and the resulting SPEI calculations at the sub-national scale, which is relevant for assessing drought impacts on agriculture-based livelihoods. In an attempt to resolve the ambiguity in drought identification resulting from the differences in products, we assessed the value of complementing the SPEI analysis with key informant interviews, effectively demonstrating the added value of triangulation.
We observed that blends of 10 gridded rainfall and four gridded temperature products unanimously identified years experiencing drought conditions amidst a few variations. Moreover, 18 of the 40 SPEI combinations, revealed trends towards drier conditions, statistically significant at the 0.01 level. Using the ensemble of gridded meteorological data blends in the calculation of drought indices, the SPEI in this study, facilitated greater understanding of the uncertainties in onset, duration, and magnitude of past droughts. These uncertainties were driven more by the variation between rainfall products than temperature products in our case. Understanding past droughts is important to study their social-ecological impacts and assess the adequacy of responses in the future. Our study thus holds an important lesson for studies of past droughts: using any one of the available data products would risk severely misrepresenting drought characteristics and perhaps instituting erroneous responses. It is similarly important to bear in mind that, in the absence of a dense ground-station network, there is no benchmark dataset against which the individual data products can be assessed. Searching for a “best” product is thus not viable, and the value of these products can only be realized in an ensemble as we have revealed.
An ensemble approach to SPEI could not, however, identify all droughts unanimously in our case, using an ensemble of 10 rainfall products times four temperature products over the Kitui West area in south-east Kenya. This ambiguity could only be resolved with the information from 14 key informants engaged in disaster relief on the ground. Our study thus demonstrates the value of triangulating quantitative drought analysis with qualitative data. The qualitative data alone, in turn, would miss information on drought onset, duration, and magnitude; this is what the ensemble approach to SPEI provides, albeit with uncertainty. It is thus the juxtaposition of both types of data that is most fruitful.
Engaging organizations involved in disaster relief locally in drought identification will also strengthen their role in the region. Since drought is a gradually evolving phenomenon with long-lasting socio-economic impacts, there is need to develop and/or intensify integrated interventions and capacity building where affected communities are actively engaged at sub-national levels. The evolving and complex dry conditions accompanied by uncertainty are a challenge for the relatively recently devolved Kitui County administration, which has the mandate to coordinate multistakeholder risk management strategies at county-level. Such management strategies and collaborative networks should be flexible to detect, track, and respond effectively to various unique drought episodes. Effective responses include enhancement of government, private sector, and community-based disaster relief systems, targeting, for example, crop diversification with cultivation of drought resistant varieties as championed by the Kenya Red Cross [82]. An ensemble approach to SPEI will provide the necessary quantitative basis for these policies, while the experience of community, regional and national organizations will help resolve data ambiguities as well as strengthen the implementation of national policies.
Appreciating uncertainties in drought characteristics should in no way distract from decisive action to mitigate the impacts of droughts, improve disaster relief, and strengthen adaptive capacity, because extreme events such as droughts have been increasing over East Africa and have already resulted in deterioration of livelihoods and ecosystem integrity. While there is likely spatial variation over the region, we confirmed a statistically significant trend towards increasingly drier conditions also for Kitui West with just over half of the SPEI ensemble members. This trend was partly driven by a significant increase of minimum and maximum temperature over time in all data products, while negative annual and seasonal rainfall trends in some of the products could not be proven statistically significant. Beyond the temperature, and therefore evapotranspiration, effect, it will be worth investigating next how the timing and sub-annual variation of rainfall propagates into negative SPEI values, i.e., drier conditions. Such an analysis should go beyond trends in annual standard deviations of rainfall, which in our case did not turn out significantly either.

Supplementary Materials

The following are available online at https://www.mdpi.com/article/10.3390/w13243611/s1, Figure S1: Illustration of the areal weighting approach, Figure S2: Various grid resolutions of the data products used and their contribution to the areal average, Figures S3 and S4: Correlation matrices between the weighted gridded rainfall products and KMD Gridded data and the weighted gridded Min/Max temperature and the KMD Gridded data, Figure S5: Rainfall anomalies zoomed in the respective decades over the study period ; zoom1, 1987–1996, zoom2, 1997–2006, and zoom3, 2007–2016, Figure S6: Cumulative negative SPEI among the 40 combinations, Figures S7–S10: SPEI outputs using CRU, MERRA-2, JRA-55, and KMD_grid Tmax/Tmin with the 10 rainfall products, with linear trend superimposed., Table S1: KMD-Grid, CRU, MERRA-2, and JRA-55 Tmax/Tmin Statistics, Table S2: Seasonal (MAM and OND) and annual precipitation statistics,. Equation (S1): Steps used in weighting of respective Gridded products., Breakdown S1: Guiding questions used in key informant interviews.

Author Contributions

Conceptualization, methodology, investigation and project administration P.B. and T.K.; Software, F.B.; Validation, P.B., F.B. and T.K.; Formal analysis, F.B.; Resources, P.B. and T.K.; Data curation, P.B. and F.B.; Writing-original draft preparation, P.B. and T.K.; Writing—review and editing, P.B., T.K. and P.R.; Visualization, F.B, T.K. and P.B.; Supervision, T.K. and P.R.; Funding acquisition, T.K. All authors have read and agreed to the published version of the manuscript.

Funding

This research including the APC, was funded by Geo.X Research Network for Geosciences in Berlin and Potsdam, grant number SO_087_GeoX.

Data Availability Statement

The data and code used in the article can be accessed as detailed under, Table 1, the corresponding author can readily provide further clarification on a need basis.

Acknowledgments

We are grateful to the Kenya Meteorological Department for providing the requested gridded and ground station data. Further, we are equally thankful to the various gridded data providers as accessed in the respective interfaces and the input of Key informants.

Conflicts of Interest

The authors declare no conflict of interest. The funders had no role in the design of the study; in the collection, analyses, or interpretation of data; in the writing of the manuscript, or in the decision to publish the results.

References

  1. Wilhite, D.A. Drought and Water Crises: Science, Technology, and Management Issues; CRC Press: Boca Raton, FL, USA, 2005; pp. 5–12. ISBN 1420028383. [Google Scholar] [CrossRef]
  2. Mishra, A.K.; Singh, V.P. A review of drought concepts. J. Hydrol. 2010, 391, 202–216. [Google Scholar] [CrossRef]
  3. Balint, Z.; Mutua, F.; Muchiri, P.; Omuto, C.T. Monitoring Drought with the Combined Drought Index in Kenya. In Developments in Earth Surface Processes; Elsevier BV: Amsterdam, The Netherlands, 2013; pp. 341–356. [Google Scholar]
  4. Van Loon, A.F.; Stahl, K.; Di Baldassarre, G.; Clark, J.; Rangecroft, S.; Wanders, N.; Gleeson, T.; Van Dijk, A.I.J.M.; Tallaksen, L.M.; Hannaford, J.; et al. Drought in a human-modified world: Reframing drought definitions, understanding, and analysis approaches. Hydrol. Earth Syst. Sci. 2016, 20, 3631–3650. [Google Scholar] [CrossRef] [Green Version]
  5. Labudová, L.; Labuda, M.; Takáč, J. Comparison of SPI and SPEI applicability for drought impact assessment on crop production in the Danubian Lowland and the East Slovakian Lowland. Theor. Appl. Clim. 2017, 128, 491–506. [Google Scholar] [CrossRef]
  6. Haile, M. Weather patterns, food security and humanitarian response in sub-Saharan Africa. Philos. Trans. R. Soc. B Biol. Sci. 2005, 360, 2169–2182. [Google Scholar] [CrossRef] [PubMed] [Green Version]
  7. Dinku, T.; Ceccato, P.; Grover-Kopec, E.; Lemma, M.; Connor, S.J.; Ropelewski, C.F. Validation of satellite rainfall products over East Africa’s complex topography. Int. J. Remote Sens. 2007, 28, 1503–1526. [Google Scholar] [CrossRef]
  8. Jaetzold, R.; Schmidt, B.H.; Hornetz, C.S.; Ministry of Agriculture. Deutsche Gesellschaft für Technische Zusammenarbeit. In Farm Management Handbook of Kenya. Natural Conditions and Farm Management Information; Annex: Atlas of Agro-Ecological Zones, Soils and Fertilising by Group of Districts; Subpart B1b: Northern Rift Valley Province Keiyo Marakwet County: Nairobi; Ministry of Agriculture: Nairobi, Kenya, 2010; Volume 2, pp. 3–38. [Google Scholar]
  9. Naumann, G.; Dutra, E.; Barbosa, P.; Pappenberger, F.; Wetterhall, F.; Vogt, J.V. Comparison of drought indicators derived from multiple data sets over Africa. Hydrol. Earth Syst. Sci. 2014, 18, 1625–1640. [Google Scholar] [CrossRef] [Green Version]
  10. Gebrechorkos, S.H.; Hülsmann, S.; Bernhofer, C. Changes in temperature and precipitation extremes in Ethiopia, Kenya, and Tanzania. Int. J. Clim. 2019, 39, 18–30. [Google Scholar] [CrossRef] [Green Version]
  11. Kew, S.F.; Philip, S.Y.; Hauser, M.; Hobbins, M.; Wanders, N.; van Oldenborgh, G.J.; van der Wiel, K.; Veldkamp, T.I.E.; Kimutai, J.; Funk, C.; et al. Impact of precipitation and increasing temperatures on drought trends in eastern Africa. Earth Syst. Dyn. 2019, 12, 17–35. [Google Scholar] [CrossRef]
  12. Parry, J.-E.; Echeverria, D.; Dekens, J.; Maitima, J. Climate Risks, Vulnerability and Governance in Kenya: A Review. Available online: https://www.iisd.org/system/files/publications/climate_risks_kenya.pdf (accessed on 30 September 2021).
  13. Ryan, C.; Elsner, P. The potential for sand dams to increase the adaptive capacity of East African drylands to climate change. Reg. Environ. Chang. 2016, 16, 2087–2096. [Google Scholar] [CrossRef] [Green Version]
  14. Muller, J.C.-Y. Adapting to climate change and addressing drought–learning from the Red Cross Red Crescent experiences in the Horn of Africa. Weather Clim. Extrem. 2014, 3, 31–36. [Google Scholar] [CrossRef] [Green Version]
  15. Stagge, J.H.; Tallaksen, L.M.; Gudmundsson, L.; Van Loon, A.F.; Stahl, K. Candidate Distributions for Climatological Drought Indices (SPI and SPEI). Int. J. Clim. 2015, 35, 4027–4040. [Google Scholar] [CrossRef]
  16. Nicholson, S.E. Climate and climatic variability of rainfall over eastern Africa. Rev. Geophys. 2017, 55, 590–635. [Google Scholar] [CrossRef] [Green Version]
  17. Barrett, A.B.; Duivenvoorden, S.; Salakpi, E.E.; Muthoka, J.M.; Mwangi, J.; Oliver, S.; Rowhani, P. Forecasting vegetation condition for drought early warning systems in pastoral communities in Kenya. Remote Sens. Environ. 2020, 248, 111886. [Google Scholar] [CrossRef]
  18. Huho, J.M.; Kosonei, R.C. Understanding Extreme Climatic Events for Economic Development in Kenya. IOSR J. Environ. Sci. Toxicol. Food Technol. 2014, 8, 14–24. [Google Scholar] [CrossRef]
  19. Ngugi, K.N.K.; Gichaba, C.M.M.; Kathumo, V.M.V.; Ertsen, M.W.M. Back to the drawing board: Assessing siting guidelines for sand dams in Kenya. Sustain. Water Resour. Manag. 2020, 6, 1–28. [Google Scholar] [CrossRef]
  20. KNBS. 2019 Kenya Population and Housing Census Volume I: Population by County and Sub-County. Kenya National Bureau of Statistics. Available online: https://www.knbs.or.ke/?wpdmpro=2019-kenya-population-and-housing-census-volume-i-population-by-county-and-sub-county&wpdmdl=5615&ind=ofmSJoaYtvLMlnjHVYdPqM05joT3xLzh83mGEm1gaCnKmGFl1onO8aCXdVdIpVoF (accessed on 18 November 2020).
  21. McMillan, H.K.; Westerberg, I.K.; Krueger, T. Hydrological data uncertainty and its implications. Wiley Interdiscip. Rev. Water 2018, 5, e1319. [Google Scholar] [CrossRef] [Green Version]
  22. Van Loon, A.F.; Gleeson, T.; Clark, J.; Van Dijk, A.; Stahl, K.; Hannaford, J.; Di Baldassarre, G.; Teuling, A.; Tallaksen, L.M.; Uijlenhoet, R.; et al. Drought in the Anthropocene. Nat. Geosci. 2016, 9, 89–91. [Google Scholar] [CrossRef] [Green Version]
  23. Kallis, G. Droughts. Annu. Rev. Environ. Resour. 2008, 33, 85–118. [Google Scholar] [CrossRef]
  24. WMO. Standardized Precipitation Index User Guide; World Meteorological Organization: Geneva, Switzerland, 2012; pp. 1–15. ISBN 978-92-63-11091-6. [Google Scholar]
  25. Svoboda, M.; Fuchs, B. Handbook of Drought Indicators and Indices; World Meteorological Organization: Geneva, Switzerland, 2016; pp. 1–52. ISBN 978-92-63-11173-9. [Google Scholar]
  26. Vicente-Serrano, S.M.; Sergio, M. The Climate Data Guide: Standardized Precipitation Evapotranspiration Index (SPEI); Accedido: 2014. Available online: https://climatedataguide.ucar.edu/climate-data/standardized-precipitation-evapotranspiration-index-spei (accessed on 12 February 2020).
  27. Polong, F.; Chen, H.; Sun, S.; Ongoma, V. Temporal and spatial evolution of the standard precipitation evapotranspiration index (SPEI) in the Tana River Basin, Kenya. Theor. Appl. Clim. 2019, 138, 777–792. [Google Scholar] [CrossRef]
  28. Masih, I.; Maskey, S.; Mussá, F.E.F.; Trambauer, P. A review of droughts on the African continent: A geospatial and long-term perspective. Hydrol. Earth Syst. Sci. 2014, 18, 3635–3649. [Google Scholar] [CrossRef] [Green Version]
  29. Dinku, T.; Cousin, J.; del Corral, R.; Ceccato, P. The Enacts Approach. Available online: https://ccafs.cgiar.org/resources/publications/enhancing-national-climate-services-enacts-development-africa (accessed on 12 August 2021).
  30. Gebrechorkos, S.H.; Hülsmann, S.; Bernhofer, C. Analysis of climate variability and droughts in East Africa using high-resolution climate data products. Glob. Planet. Chang. 2020, 186, 103130. [Google Scholar] [CrossRef]
  31. Nathan, O.O.; Felix, N.K.; Milka, K.N.; Anne, M.; Noah, A.; Daniel, M.N. Suitability of different data sources in rainfall pattern characterization in the tropical central highlands of Kenya. Heliyon 2020, 6, e05375. [Google Scholar] [CrossRef] [PubMed]
  32. KMD. Gridded 30 Year Monthly Station Meteorological Data and Monthly Station Data; Kenya Meteorological Department, Ed.; Kenya Meteorological Department: Nairobi, Kenya, 2020.
  33. Nguvava, M.; Abiodun, B.J.; Otieno, F. Projecting drought characteristics over East African basins at specific global warming levels. Atmos. Res. 2019, 228, 41–54. [Google Scholar] [CrossRef]
  34. Bayissa, Y.; Maskey, S.; Tadesse, T.; Van Andel, S.J.; Moges, S.A.; Van Griensven, A.; Solomatine, D. Comparison of the Performance of Six Drought Indices in Characterizing Historical Drought for the Upper Blue Nile Basin, Ethiopia. Geosciences 2018, 8, 81. [Google Scholar] [CrossRef] [Green Version]
  35. Gebrechorkos, S.H.; Hülsmann, S.; Bernhofer, C. Evaluation of multiple climate data sources for managing environmental resources in East Africa. Hydrol. Earth Syst. Sci. 2018, 22, 4547–4564. [Google Scholar] [CrossRef] [Green Version]
  36. Haile, G.G.; Tang, Q.; Sun, S.; Huang, Z.; Zhang, X.; Liu, X. Droughts in East Africa: Causes, impacts and resilience. Earth-Sci. Rev. 2019, 193, 146–161. [Google Scholar] [CrossRef]
  37. Kitui-County. County Intergrated Development Plan, 2018–2022. Kitui County Government. Available online: https://cog.go.ke/downloads/category/106-county-integrated-development-plans-2018-2022?download=314:kitui-county-integrated-development-plan-2018-2022 (accessed on 14 November 2020).
  38. Mumo, L.; Yu, J.; Ayugi, B. Evaluation of spatiotemporal variability of rainfall over Kenya from 1979 to 2017. J. Atmos. Sol.-Terr. Phys. 2019, 194, 105097. [Google Scholar] [CrossRef]
  39. Ongoma, V.; Chen, H.; Gao, C.; Sagero, P.O. Variability of temperature properties over Kenya based on observed and reanalyzed datasets. Theor. Appl. Clim. 2017, 133, 1175–1190. [Google Scholar] [CrossRef]
  40. Vicente-Serrano, S.M.; Beguería, S.; López-Moreno, J.I. A Multiscalar Drought Index Sensitive to Global Warming: The Standardized Precipitation Evapotranspiration Index. J. Clim. 2010, 23, 1696–1718. [Google Scholar] [CrossRef] [Green Version]
  41. Funk, C.C.; Peterson, P.J.; Landsfeld, M.F.; Pedreros, D.H.; Verdin, J.P.; Rowland, J.D.; Romero, B.E.; Husak, G.J.; Michaelsen, J.C.; Verdin, A.P. A Quasi-Global Precipitation Time Series for Drought Monitoring; U.S. Geological Survey: Reston, VA, USA, 2014. [CrossRef]
  42. Musei, S.K.; Nyaga, J.M.; Dubow, A.Z. SPEI-based spatial and temporal evaluation of drought in Somalia. J. Arid. Environ. 2021, 184, 104296. [Google Scholar] [CrossRef]
  43. Ali, A.; Lebel, T. The Sahelian standardized rainfall index revisited. Int. J. Clim. 2009, 29, 1705–1714. [Google Scholar] [CrossRef]
  44. Schneider, U.; Becker, A.; Finger, P.; Meyer-Christoffer, A.; Rudolf, B.; Ziese, M. GPCC Full Data Reanalysis Version 7.0 at 0.5°: Monthly Land-Surface Precipitation from Rain-Gauges Built on GTS-Based and Historic Data; Global Precipitation Climatology Centre (GPCC) at Deutscher Wetterdienst: Offenbach am Main, Germany, 2018. [Google Scholar]
  45. Adler, R.F.; Sapiano, M.R.P.; Huffman, G.J.; Wang, J.-J.; Gu, G.; Bolvin, D.; Chiu, L.; Schneider, U.; Becker, A.; Nelkin, E.; et al. The Global Precipitation Climatology Project (GPCP) Monthly Analysis (New Version 2.3) and a Review of 2017 Global Precipitation. Atmosphere 2018, 9, 138. [Google Scholar] [CrossRef] [PubMed] [Green Version]
  46. Ayugi, B.; Tan, G.; Ullah, W.; Boiyo, R.; Ongoma, V. Inter-comparison of remotely sensed precipitation datasets over Kenya during 1998–2016. Atmos. Res. 2019, 225, 96–109. [Google Scholar] [CrossRef]
  47. Maidment, R.I.; Grimes, D.; Black, E.; Tarnavsky, E.; Young, M.; Greatrex, H.; Allan, R.P.; Stein, T.; Nkonde, E.; Senkunda, S.; et al. A new, long-term daily satellite-based rainfall dataset for operational monitoring in Africa. Sci. Data 2017, 4, 170063. [Google Scholar] [CrossRef] [PubMed]
  48. Ashouri, H.; Hsu, K.-L.; Sorooshian, S.; Braithwaite, D.K.; Knapp, K.; Cecil, L.D.; Nelson, B.R.; Prat, O. PERSIANN-CDR: Daily Precipitation Climate Data Record from Multisatellite Observations for Hydrological and Climate Studies. Bull. Am. Meteorol. Soc. 2015, 96, 69–83. [Google Scholar] [CrossRef] [Green Version]
  49. KMD. Gridded 30 Year Daily Daily Meteorological Data; Kenya Meteorological Department, Ed.; Kenya Meteorological Department: Nairobi, Kenya, 2020.
  50. KMD. Enhanced National Climate Services (Enacts) Data Documentation; Faniriantsoa, R., Ed.; Kenya Meteorological Department: Nairobi, Kenya, 2020.
  51. ENACTS. Enhancing Climate Services Initiative. International Research Institute for Climate and Society, Columbia University. Available online: https://iri.columbia.edu/resources/enacts/ (accessed on 20 January 2021).
  52. Dinku, T.; Thomson, M.C.; Cousin, R.; del Corral, J.; Ceccato, P.; Hansen, J.; Connor, S.J. Enhancing National Climate Services (ENACTS) for development in Africa. Clim. Dev. 2018, 10, 664–672. [Google Scholar] [CrossRef]
  53. Kobayashi, S.; NCARF. Climate Data. Available online: https://climatedataguide.ucar.edu/climate-data/jra-55 (accessed on 23 March 2020).
  54. Harris, I.; Osborn, T.J.; Jones, P.; Lister, D. Version 4 of the Cru Ts Monthly High-Resolution Gridded Multivariate Climate Dataset. Sci. Data 2020, 7, 1–18. [Google Scholar] [CrossRef] [Green Version]
  55. Kobayashi, S.; Ota, Y.; Harada, Y.; Ebita, A.; Moriya, M.; Onoda, H.; Onogi, K.; Kamahori, H.; Kobayashi, C.; Endo, H.; et al. The JRA-55 Reanalysis: General Specifications and Basic Characteristics. J. Meteorol. Soc. Jpn. 2015, 93, 5–48. [Google Scholar] [CrossRef] [Green Version]
  56. Hua, W.; Zhou, L.; Nicholson, S.E.; Chen, H.; Qin, M. Assessing reanalysis data for understanding rainfall climatology and variability over Central Equatorial Africa. Clim. Dyn. 2019, 53, 651–669. [Google Scholar] [CrossRef] [Green Version]
  57. Hersbach, H.; Bell, B.; Berrisford, P.; Hirahara, S.; Horanyi, A.; Muñoz-Sabater, J.; Nicolas, J.; Peubey, C.; Radu, R.; Schepers, D.; et al. The ERA5 global reanalysis. Q. J. R. Meteorol. Soc. 2020, 146, 1999–2049. [Google Scholar] [CrossRef]
  58. Tetzner, D.; Thomas, E.; Allen, C. A Validation of ERA5 Reanalysis Data in the Southern Antarctic Peninsula—Ellsworth Land Region, and Its Implications for Ice Core Studies. Geosciences 2019, 9, 289. [Google Scholar] [CrossRef] [Green Version]
  59. Kawohl, T.O. Evaluation of Era5, Era5-Land, and Imerg-F Precipitation with a Particular Focus on Elevation-Dependent Variations: A Comparative Analysis Using Observations from Germany and Brazil. Ph.D. Thesis, Universität Hamburg, Hamburg, Germany, 2020. [Google Scholar]
  60. Gelaro, R.; McCarty, W.; Suárez, M.J.; Todling, R.; Molod, A.; Takacs, L.; Randles, C.A.; Darmenov, A.; Bosilovich, M.G.; Reichle, R.; et al. The Modern-Era Retrospective Analysis for Research and Applications, Version 2 (MERRA-2). J. Clim. 2017, 30, 5419–5454. [Google Scholar] [CrossRef] [PubMed]
  61. Bosilovich, M.G.; Robertson, F.R.; Takacs, L.; Molod, A.; Mocko, D. Atmospheric Water Balance and Variability in the MERRA-2 Reanalysis. J. Clim. 2017, 30, 1177–1196. [Google Scholar] [CrossRef]
  62. Suranjana, S.; Moorthi, S.; Pan, H.-L.; Wu, X.; Wang, J.; Nadiga, S.; Tripp, P.; Kistler, R.; Woollen, J.; Behringer, D.; et al. Ncep Climate Forecast System Reanalysis (Cfsr) 6-Hourly Products, January 1979 to December 2010; Research Data Archive at the National Center for Atmospheric Research; Computational and Information Systems Laboratory: Boulder, CO, USA, 2010. [Google Scholar]
  63. Qiaohong, S.; Miao, C.; Duan, Q.; Ashouri, H.; Sorooshian, S.; Hsu, K.-L. A Review of Global Precipitation Data Sets: Data Sources, Estimation, and Intercomparisons. Rev. Geophys. 2018, 56, 79–107. [Google Scholar] [CrossRef]
  64. Denscombe, M. The Good Research Guide: For Small-Scale Social Research Projects; Open University Press: Maidenhead, UK, 2017; pp. 167–171. ISBN 9780335226863. [Google Scholar]
  65. Okal, H.A.; Ngetich, F.K.; Okeyo, J.M. Spatio-temporal characterisation of droughts using selected indices in Upper Tana River watershed, Kenya. Sci. Afr. 2020, 7, e00275. [Google Scholar] [CrossRef]
  66. Nkunzimana, A.; Bi, S.; Alriah, M.A.A.; Zhi, T.; Kur, N.A.D. Comparative Analysis of the Performance of Satellite-Based Rainfall Products Over Various Topographical Unities in Central East Africa: Case of Burundi. Earth Space Sci. 2020, 7, e2019EA000834. [Google Scholar] [CrossRef] [Green Version]
  67. AghaKouchak, A.; Farahmand, A.M.; Melton, F.S.; Teixeira, J.P.; Anderson, M.; Wardlow, B.; Hain, C.R. Remote sensing of drought: Progress, challenges and opportunities. Rev. Geophys. 2015, 53, 452–480. [Google Scholar] [CrossRef] [Green Version]
  68. Hao, Z.; AghaKouchak, A. A Nonparametric Multivariate Multi-Index Drought Monitoring Framework. J. Hydrometeorol. 2014, 15, 89–101. [Google Scholar] [CrossRef]
  69. Marchant, R.; Mumbi, C.; Behera, S.; Yamagata, T. The Indian Ocean dipole? the unsung driver of climatic variability in East Africa. Afr. J. Ecol. 2007, 45, 4–16. [Google Scholar] [CrossRef]
  70. Nicholson, S.E. A detailed look at the recent drought situation in the Greater Horn of Africa. J. Arid. Environ. 2014, 103, 71–79. [Google Scholar] [CrossRef]
  71. Lyon, B.; DeWitt, D.G. A recent and abrupt decline in the East African long rains. Geophys. Res. Lett. 2012, 39. [Google Scholar] [CrossRef] [Green Version]
  72. Liebmann, B.; Bladé, I.; Funk, C.; Allured, D.; Quan, X.-W.; Hoerling, M.; Hoell, A.; Peterson, P.; Thiaw, W.M. Climatology and Interannual Variability of Boreal Spring Wet Season Precipitation in the Eastern Horn of Africa and Implications for Its Recent Decline. J. Clim. 2017, 30, 3867–3886. [Google Scholar] [CrossRef]
  73. Wainwright, C.M.; Marsham, J.H.; Keane, R.; Rowell, D.P.; Finney, D.L.; Black, E.; Allan, R.P. ‘Eastern African Paradox’ rainfall decline due to shorter not less intense Long Rains. NPJ Clim. Atmos. Sci. 2019, 2, 34. [Google Scholar] [CrossRef]
  74. GoK. Kitui County Climate Information Services Strategic Plan 2015. Kenya Meteorological Service. Available online: https://www.adaconsortium.org/index.php/component/k2/item/download/51_c1737bfaf1145ef5fcf15dd148e6b742 (accessed on 12 June 2021).
  75. Rowell, D.P.; Booth, B.B.B.; Nicholson, S.E.; Good, P. Reconciling Past and Future Rainfall Trends over East Africa. J. Clim. 2015, 28, 9768–9788. [Google Scholar] [CrossRef]
  76. Camberlin, P. Temperature trends and variability in the Greater Horn of Africa: Interactions with precipitation. Clim. Dyn. 2017, 48, 477–498. [Google Scholar] [CrossRef]
  77. Ongoma, V.; Guirong, T.; Ogwang, B.; Ngarukiyimana, J. Diagnosis of Seasonal Rainfall Variability over East Africa: A Case Study of 2010–2011 Drought over Kenya. Pak. J. Meteorol. 2015, 11, 13–21. [Google Scholar]
  78. EM-DAT: The CRED/OFDA International Disaster Database. Available online: http://www.emdat.be/ (accessed on 20 January 2020).
  79. GoK. Kitui Early Warning Bulletin; National Drought Management Authority: Nairobi, Kenya, 2014.
  80. GoK. Kitui County 2018 Short Rains Food Security Assessment Report; National Drought Management Authority: Nairobi, Kenya, 2019.
  81. De Longueville, F.; Ozer, P.; Gemenne, F.; Henry, S.; Mertz, O.; Nielsen, J. Comparing climate change perceptions and meteorological data in rural West Africa to improve the understanding of household decisions to migrate. Clim. Chang. 2020, 160, 123–141. [Google Scholar] [CrossRef]
  82. KRCS. Forecast Based Action in Kitui, Kenya: A Case Study. Kenya Red Cross Society. Available online: https://reliefweb.int/sites/reliefweb.int/files/resources/Kitui%20full%20elnino%20report.pdf (accessed on 15 August 2021).
Figure 1. Map of the study area, Kitui West Sub County, in Kitui County, south-eastern Kenya, with a Digital Elevation Model (DEM) overlay obtained from, https://dwtkns.com/srtm30m/, accessed on 25 February 2020.
Water 13 03611 g001
Figure 2. Annual precipitation anomalies as conveyed by the different data products.
Water 13 03611 g002
Figure 3. Annual maximum (Tmax) and minimum (Tmin) temperature time series as conveyed by the different data products.
Water 13 03611 g003
Figure 4. Significant annual maximum (Tmax) and minimum (Tmin) temperature trends in the MERRA-2, KMD_grid, CRU, and JRA-55 gridded products. The black dots represent annual precipitation values with the blue line indicating the linear regression.
Water 13 03611 g004
Figure 5. Non-significant annual precipitation trends in the 10 products. The back dots represent annual precipitation values with the blue line indicating the linear regression.
Water 13 03611 g005
Figure 6. Non-significant annual precipitation standard deviation trends in the 10 products. The black dots represent annual precipitation values with the blue line indicating the linear regression.
Water 13 03611 g006
Figure 7. Non-significant seasonal precipitation trends for the 10 products: (a) March–April–May and (b) October-November-December. The black dots represent annual precipitation values with the blue line indicating the linear regression.
Water 13 03611 g007
Figure 8. Inter-product SPEI mean (black line) ± 2 standard deviations (gray shading), compared with key informant information from 2005 to 2016 (Red dots). Periods where mean SPEI ± 2 standard deviations were below zero are colored red, those above zero are blue.
Water 13 03611 g008
Table 2. Key informants with operations in Kitui West and their corresponding designation, categorization, organization, or department and interview date.
Organization/
Department
CategoryInterview DateWebsite
CARITAS-KituiNGO10 January 2020https://caritaskitui.org/
Africa sand dam foundation-ASDFNGO15 May 2020https://asdfafrica.org/
Anglican Development Services ADS-EasternNGO5 August 2020https://www.adseastern.org/
Kenya Red CrossNGO12 August 2020https://www.redcross.or.ke/
Sahelian Solutions (SASOL) NGO12 October 2020https://www.sasolfoundation.co.ke/
National Drought Management Authority (NDMA)-KenyaNational Government12 November 2020https://www.ndma.go.ke/
Adventist Development and Relief Agency (ADRA)-KenyaNGO01 December 2020https://www.adrakenya.org/
German Agro Action NGO17 December 2020https://www.welthungerhilfe.org/our-work/countries/kenya/
Kitui County Government County Government12 January 2021https://kitui.go.ke/countygovt/ministries/ministry-of-agriculture-water-and-livestock/
World Vision NGO14 January 2021https://www.wvi.org/kenya
National Water Harvesting & Storage Authority (NWHA)-KenyaNational Government26 January 2021https://www.waterauthority.go.ke/index.php?option=com_content&view=featured&Itemid=369
Samaritans PurseNGO29 January 2021https://www.samaritanspurse.org/operation-christmas-child-countries/kenya/
Kitui County Government County Government5 February 2021https://kitui.go.ke/countygovt/about-kitui/
Water Resources Management Authority (WARMA)-KenyaNational Government26 February 2021https://wra.go.ke/
Publisher’s Note: MDPI stays neutral with regard to jurisdictional claims in published maps and institutional affiliations.

