Article

Altitudinal Gradient Characteristics of Spatial and Temporal Variations of Snowpack in the Changbai Mountain and Their Response to Climate Change

1
School of Hydraulic Engineering, Dalian University of Technology, Dalian 116024, China
2
Jilin Institute of Hydraulic Research, Changchun 130500, China
3
Key Laboratory of Wetland Ecology and Environment, Northeast Institute of Geography and Agroecology, Chinese Academy of Sciences, Shengbei Street, Changchun 130102, China
*
Author to whom correspondence should be addressed.
Yongming Chen and Zehua Chang are first co-authors.
Water 2021, 13(24), 3580; https://doi.org/10.3390/w13243580
Submission received: 27 October 2021 / Revised: 9 December 2021 / Accepted: 10 December 2021 / Published: 14 December 2021
(This article belongs to the Special Issue The Role of Snow in High-Mountain Hydrologic Cycle)

Abstract

:
The variations in the snowpack in water towers of the world due to climate change have threatened the amount and timing of freshwater supplied downstream. However, it remains to be further investigated whether snowpack variation in water towers exhibits elevational heterogeneity at different altitude gradients and which climatic factors mainly influence these differences. Therefore, Changbai Mountain, a high-latitude water tower, was selected to analyze the changes in the snowpack by the methods of modified Mann–Kendall based on the daily meteorological data from the China Meteorological Data Service Centre. Meanwhile, the responses of snowpack change to climatic factors over recent decades were assessed and generalized using additive models. The results showed that the snow depth was greater in the higher altitude areas than in the lower elevation areas at different times. Areas with a snow depth of over 70 mm increased significantly in the 2010s. Increasing trends were shown at different altitudes from December to March of the next year during 1960~2018. However, a significant decreasing trend was shown in April, except for altitudes of 600–2378 m. The snow cover time at different altitudes showed a trend of first increasing and then decreasing during 1960~2018. The date of maximum snow depth appears to be more lagged as the altitude increases. In addition, the spring snowpack melted significantly faster in the 2010s than that in the 1960s. The snowpack variation in low-altitude regions is mainly influenced by ET and relative humidity. However, the mean temperature gradually became an important factor, affecting the snow depth variation with the increase in altitude. Therefore, the results of this study will be beneficial to the ecological protection and sustainable development of water towers.

1. Introduction

Mountains are the water towers of the world and are important sources of freshwater; they supply a substantial proportion of both natural and anthropogenic water demands [1,2]. In these high-altitude regions, snow is the main component of the hydrological cycle, because changes in the snowpack have a great impact on streamflow, groundwater recharge, hydropower production [3], agricultural irrigation and ecosystem function [4]. Due to climate change over the past few decades, the duration, depth and cover of snowpacks in these mountain regions have all changed, which has threatened the amount and timing of the freshwater supply [5]. Therefore, it is very important to maintain the stability of the ecological environment in a water tower and provide sustainable water resources for downstream by assessing the spatial and temporal evolution characteristics of mountain snowpacks and their responses to climate change.
Snow depth is an indispensable indicator for estimating snow water equivalent, calculating surface radiation and the water budget, and simulating snowmelt runoff in spring. Changes in the snow depth in the context of climate change are found in many regions of the world. Widespread decreases have meant that snow depths were found to exhibit average decreases of −12.2%/10 years for over Europe since 1951 [6]. An increasing trend (>0.01 cm/year) in maximum and mean snow depth was found north of 40° N in China [7]. Moreover, shifting precipitation from snowfall to rain results in less winter precipitation falling as snow, and the melting of winter snow occurs earlier in spring all over the world [8]. Many snow-dependent regions of the Northern Hemisphere are likely to experience increasing stress from low snow years within the next three decades [6]. Climatic factors are often considered to be the main drivers of snowpack changes. Many studies have shown that the increase in temperature [9,10] and the decrease in snowfall [11,12] are the main reasons for the change in snowpacks. However, it remains to be further investigated whether snowpack variation in water towers exhibits elevational heterogeneity at different altitude gradients, and which climatic factors mainly influence these differences.
Changbai Mountain is an important water tower located in a high-latitude region, and is the source of the Second Songhua River, Tumen River, and Yalu River [13]. It is also an important ecological functional area with a typical vertical belt spectrum, from temperate broad-leaved forest to tundra in eastern Eurasia [14]. Snow is an important factor in maintaining the balance of this region’s ecosystem. Several studies have already found that the climate has been changing in the Changbai Mountains over recent decades. The temperature has increased significantly, and the snowmelt period has advanced, which has caused several ecosystem changes [15,16]. However, little attention has been paid to spatio-temporal variations in the snowpack in the Changbai Mountains and its response to the climatic factors.
The objective of this study was to fill the above-mentioned research gaps by investigating the interannual variations and trends in the snowpack and how it has been affected by climatic drivers in high-latitude water towers during 1960–2018. Firstly, the spatio-temporal variations of the snowpack were analyzed at different altitudes. Secondly, the variable characteristics of snow duration were simulated at different altitudes. Finally, the contributions of these climatic factors to the snowpack were identified.

2. Materials and Methods

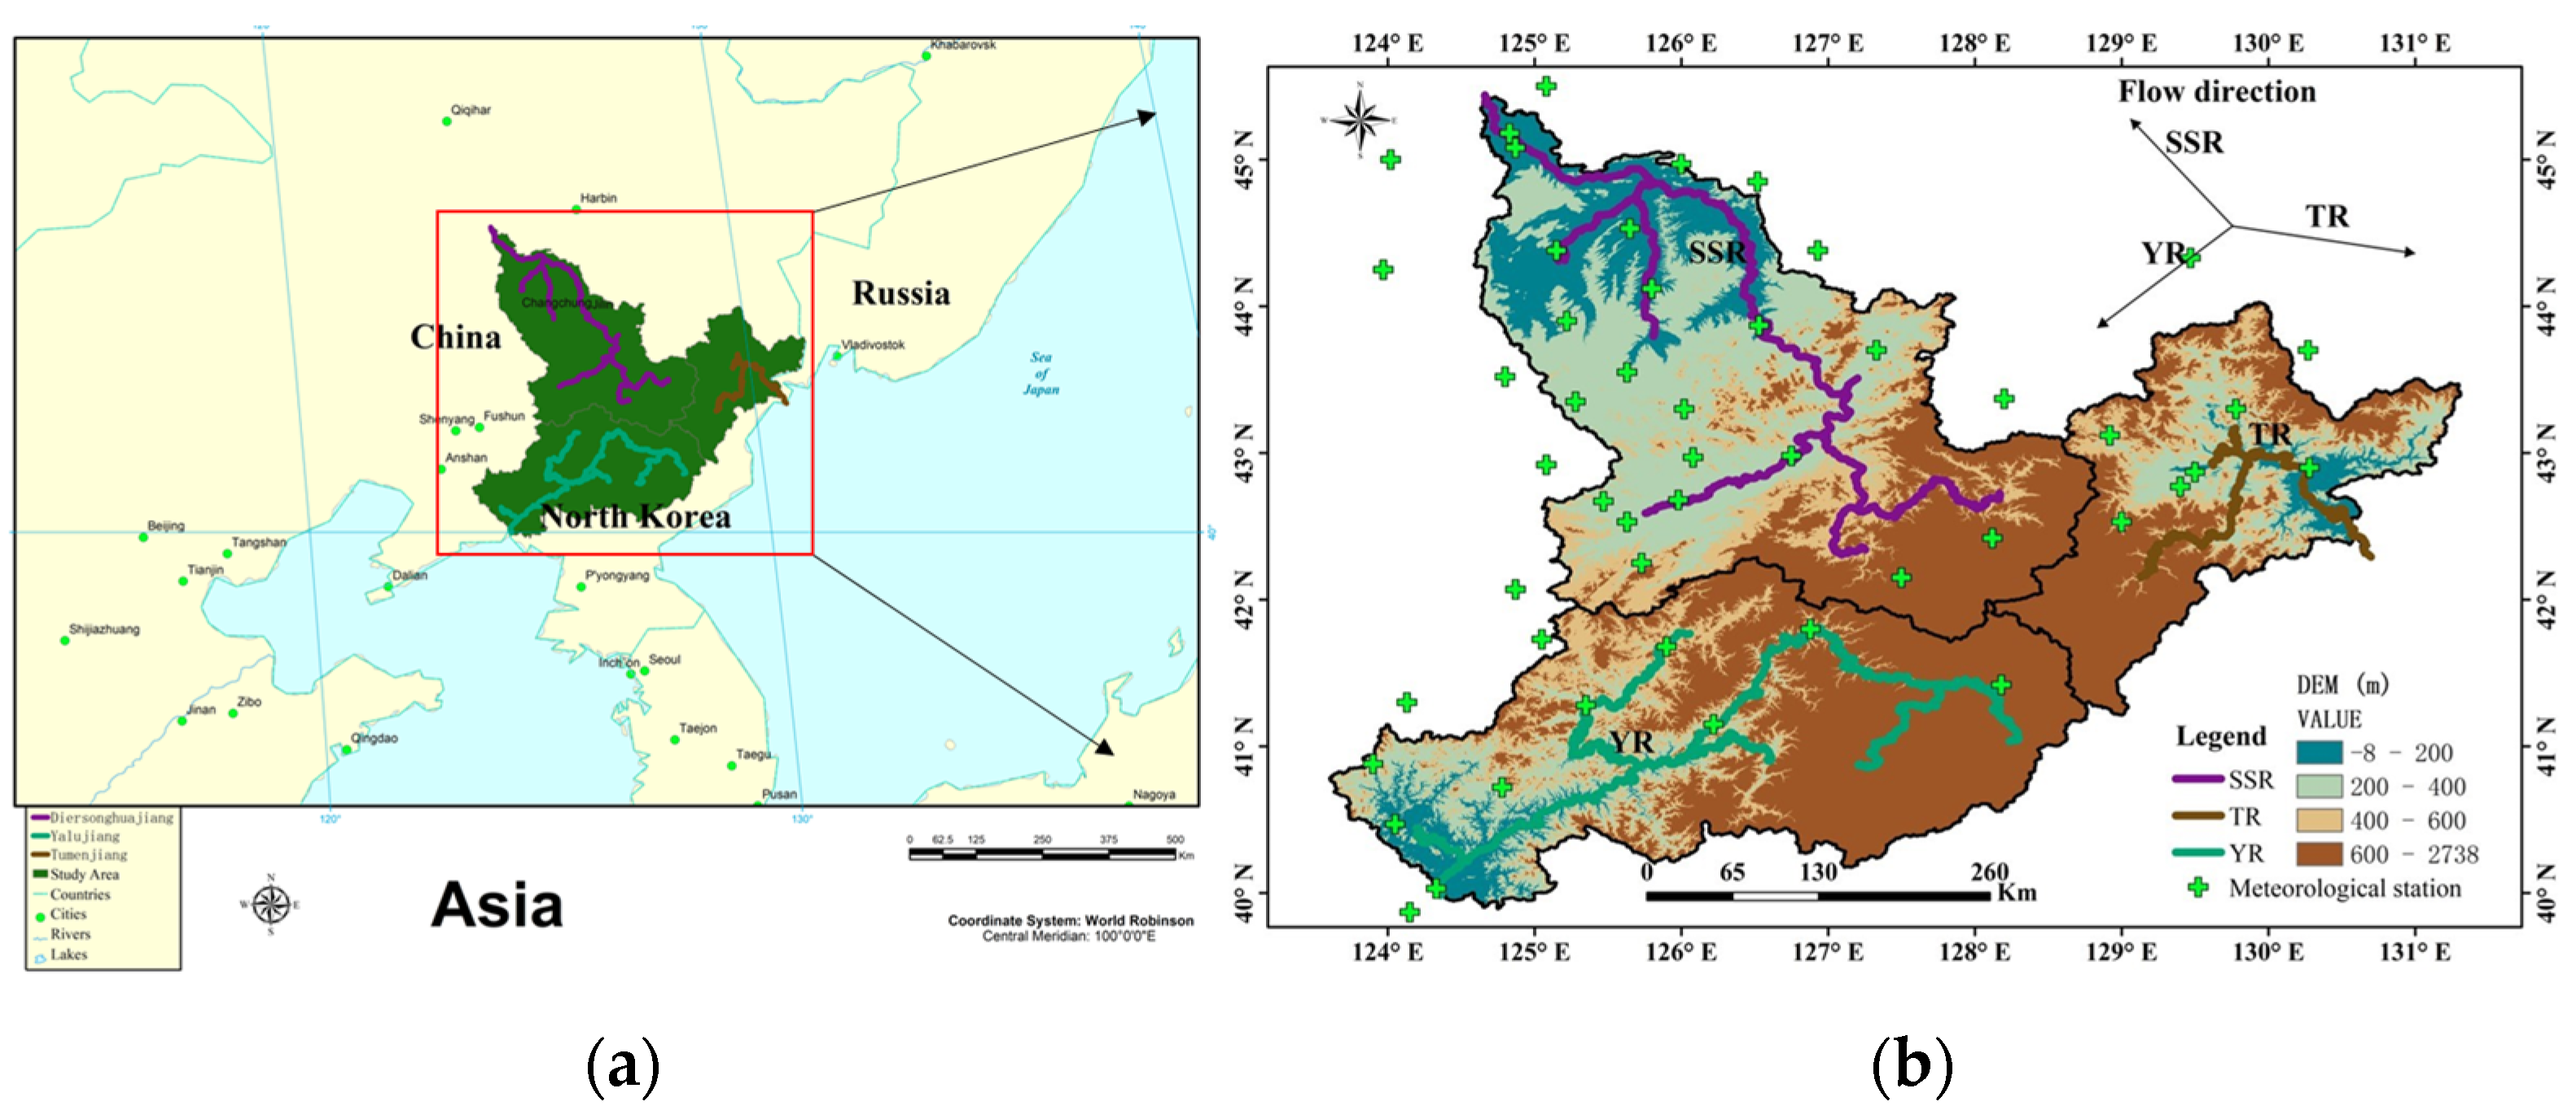
2.1. Study Site Description

This research was conducted in the Changbai Mountains, which are the source of Second Songhua River (SSR), Tumen River (TR), and Yalu River (YR); the area is approximately 17.16 × 10⁴ km2, and they are located at 39.8–45.4° N and 123.5–131.3° E (Figure 1a). The Tumen River and Yalu River are international boundary rivers between China and North Korea and Russia, respectively.
Changbai Mountains exhibit an obvious elevation gradient, ranging from −8 m to 2738 m (Figure 1b). This area is characterized by a temperate continental mountain climate affected by monsoons. It is cold and dry in winter. The climate exhibits an annual average temperature of −7~3 °C, and annual average snowfall of more than 600 mm in certain areas.

2.2. Data

Daily meteorological data from 54 stations (Table 1) in the Changbai Mountains were obtained for the period of 1960–2018 from the China Meteorological Data Service Centre. The variables included snow depth (SD), snowfall (SF), evapotranspiration (ET0), relative humidity (RH), wind (W), sunlight hours (SH) and mean temperature (MT). The missing rate of snow depth is 0.98%, and the suspicious rate is 0.002‰.

2.3. Methods

2.3.1. Modified Mann-Kendall Method

A modified Mann–Kendall (MMK) test was applied to analyze the long-term trends in snow depth throughout the entire study period. To correct serial correlations in the data, the trend-free pre-whitening procedure was used: a more specific process of this methodology is described by Qi et al. [17]. After the Z value was calculated for all meteorological stations, they were spatially aggregated to obtain probability maps of the statistical differences.

2.3.2. Generalized Additive Model

Generalized additive models (GAM) are a nonparametric generalized multiple linear regression method which can overcome limitations of the multiple linear regression model and predict nonlinear relationships as a flexible regression technique using nonparametric smoothers. The general formula of a GAM is:
g ( μ y ) = β 0 + i = 1 n f i ( X i ) + ε i
where g ( μ y ) represents a function of the conditional mean of the response variable y , and the term β 0 is recognized as any strictly parametric component in the model, such as the intercept. The component f i ( X i ) is designated as the variable explained by the nonparametric smoothing function, and ε i is identically and independently distributed as a normal random variable. The detailed calculation process can be found in the paper by Liu et al. [6].

2.3.3. Spatial Interpolation

In recent years, based on meteorological station data, some spatial interpolation methods have been applied to study the spatial distributions of snow depth and the climate variations. Due to the inverse distance weighting method gave the lowest mean error than other methods, the Inverse Distance Weight method (IDW) was applied widely in all over world [17,18]. Thus, in this study, the IDW method was selected to analyze the spatial variation of snow depth.

3. Results

3.1. Spatial Evolution of Snow Depth in the Changbai Mountains

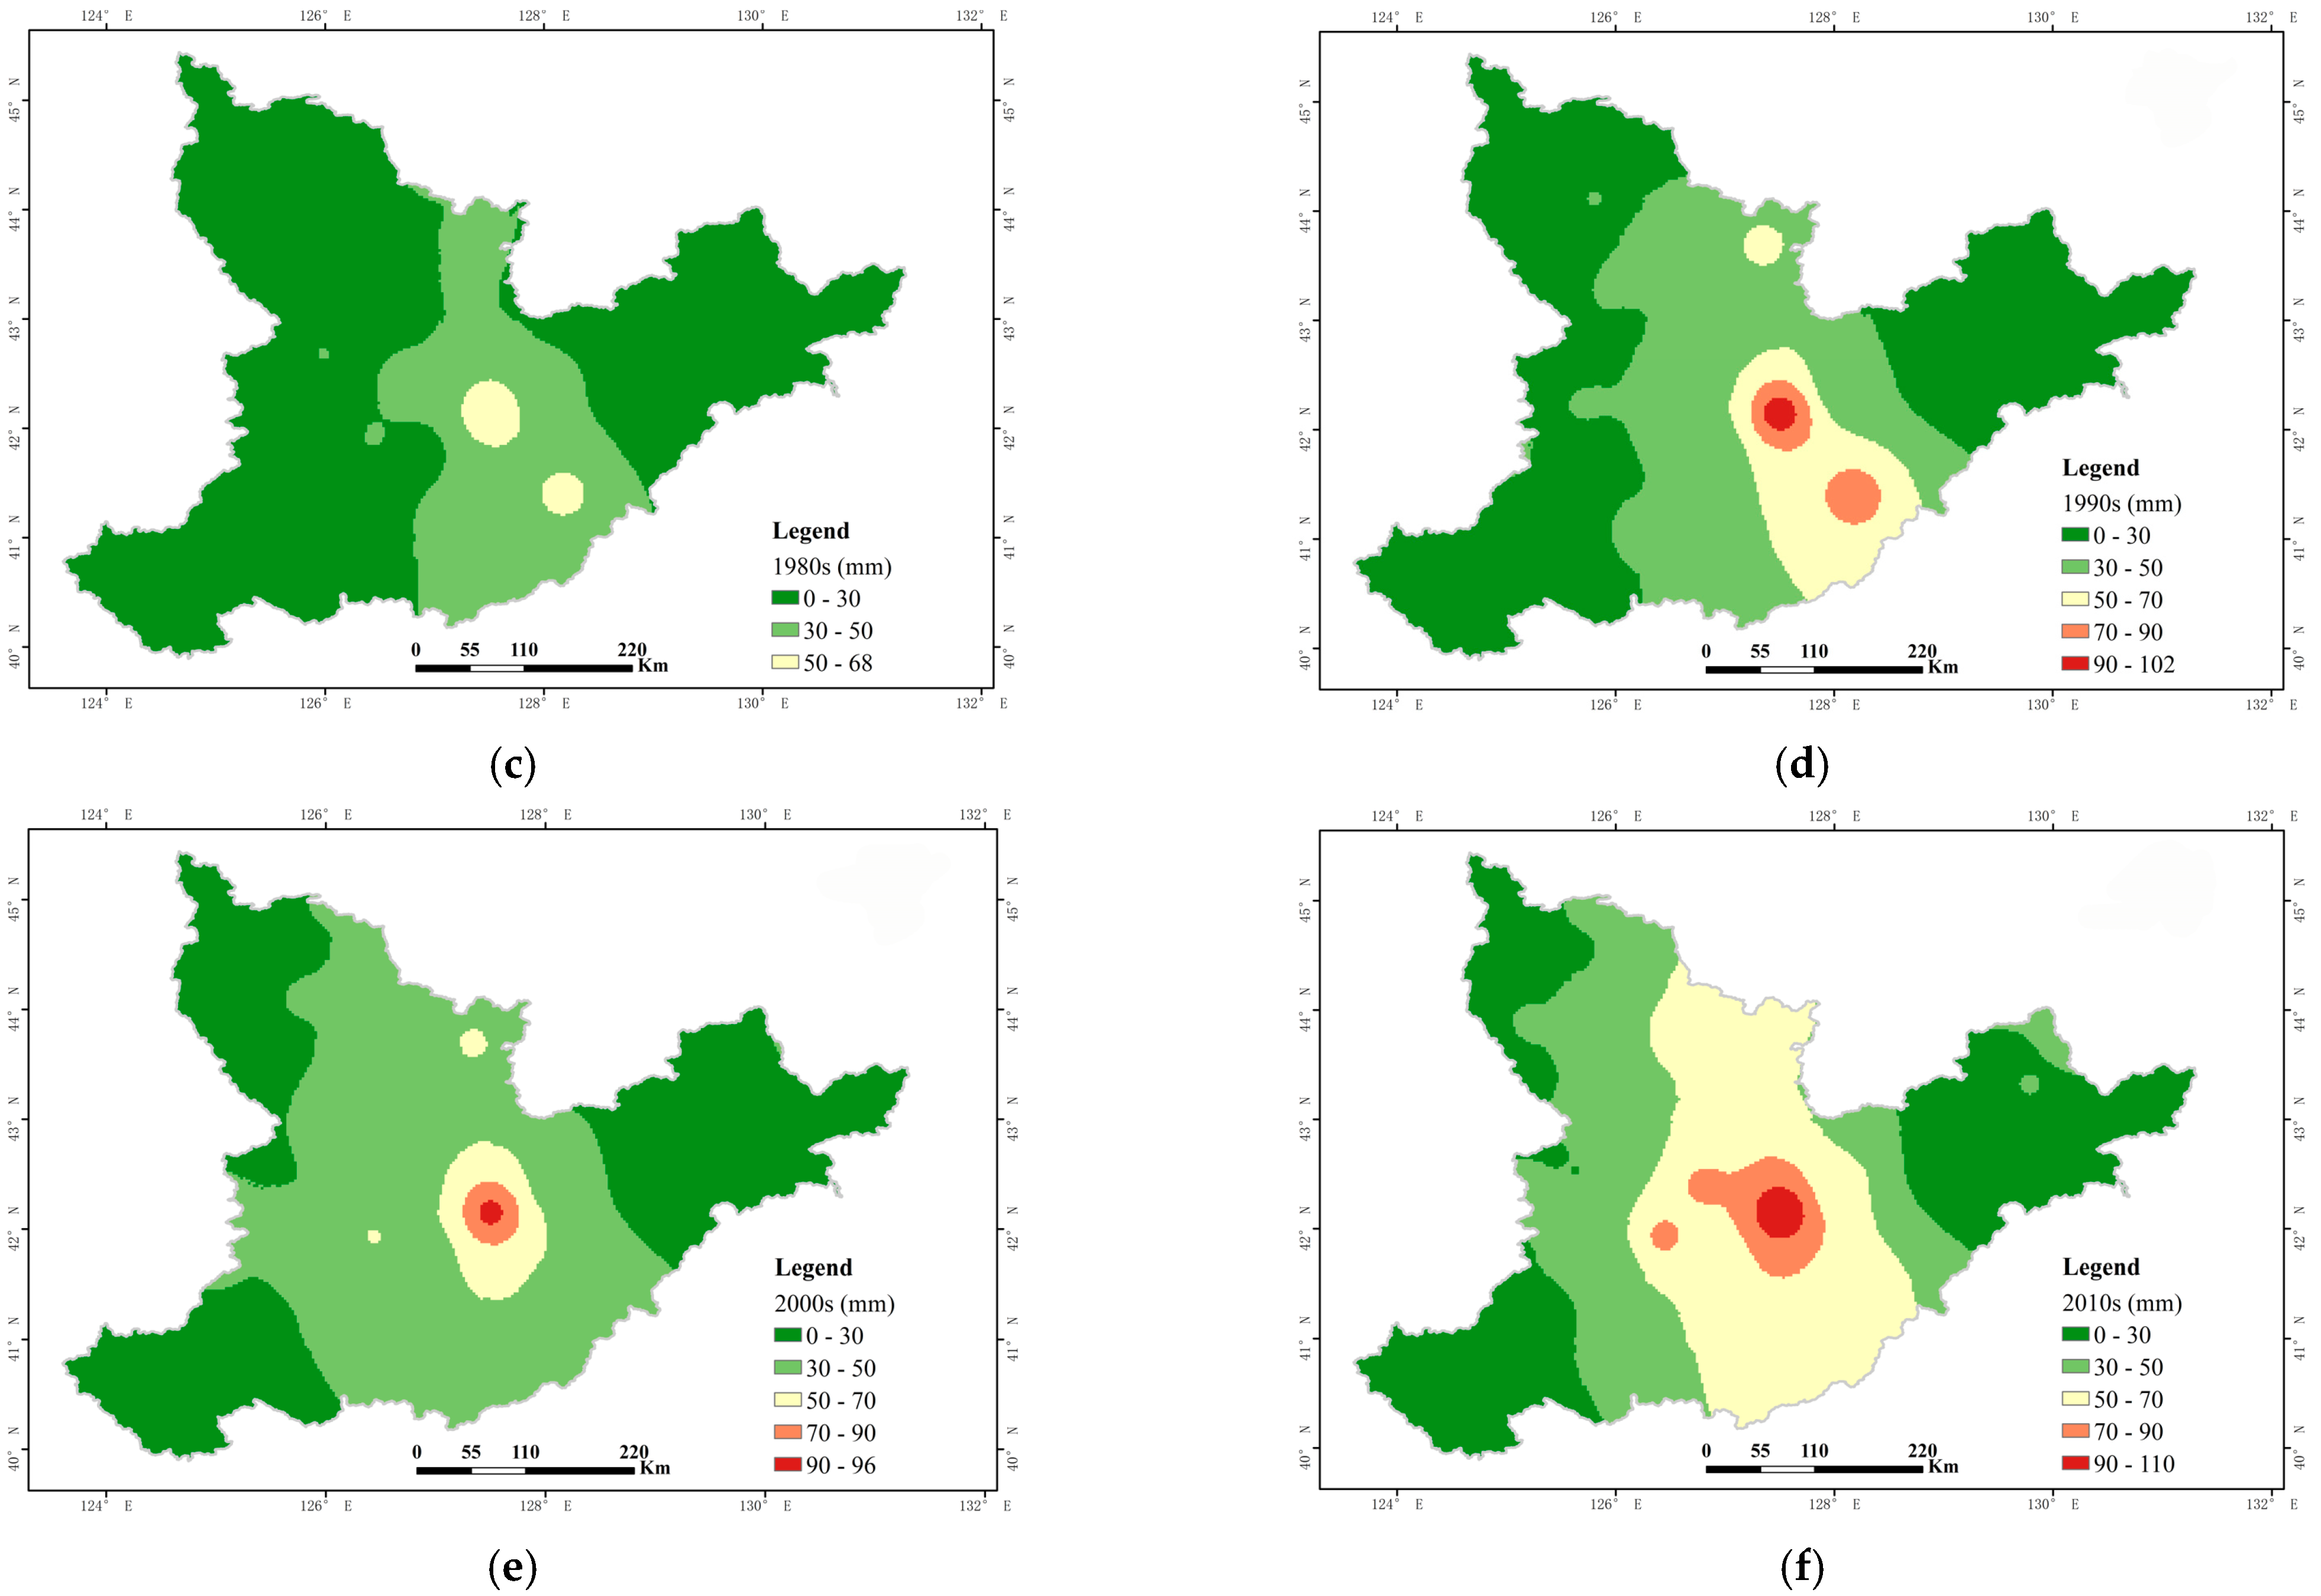
3.1.1. Interdecadal Variation of Annual Mean Snow Depth

As shown in Figure 2, snow depth in the Changbai Mountains was greater in the higher altitude areas than in the lower elevation areas at different times. It showed that snow distribution in the Changbai Mountains exhibits obvious altitude gradient characteristics. In the past 60 years, the spatial distribution of the interannual average snow depth of the Changbai Mountains has changed greatly. A trend of increasing and then decreasing was shown in the Changbai Mountains at different times. Compared with the 1960s (Figure 2a,b), the snow depth decreased most significantly in the 1980s, with a mean value of 25.44 mm (Figure 2c); then, snow depth gradually increased (Figure 2d,e), and it was the largest in the 2010s with mean value of 33.89 mm (Figure 2f). Compared with other years, the area with a snow depth of 70–90 mm increased significantly in the 2010s.

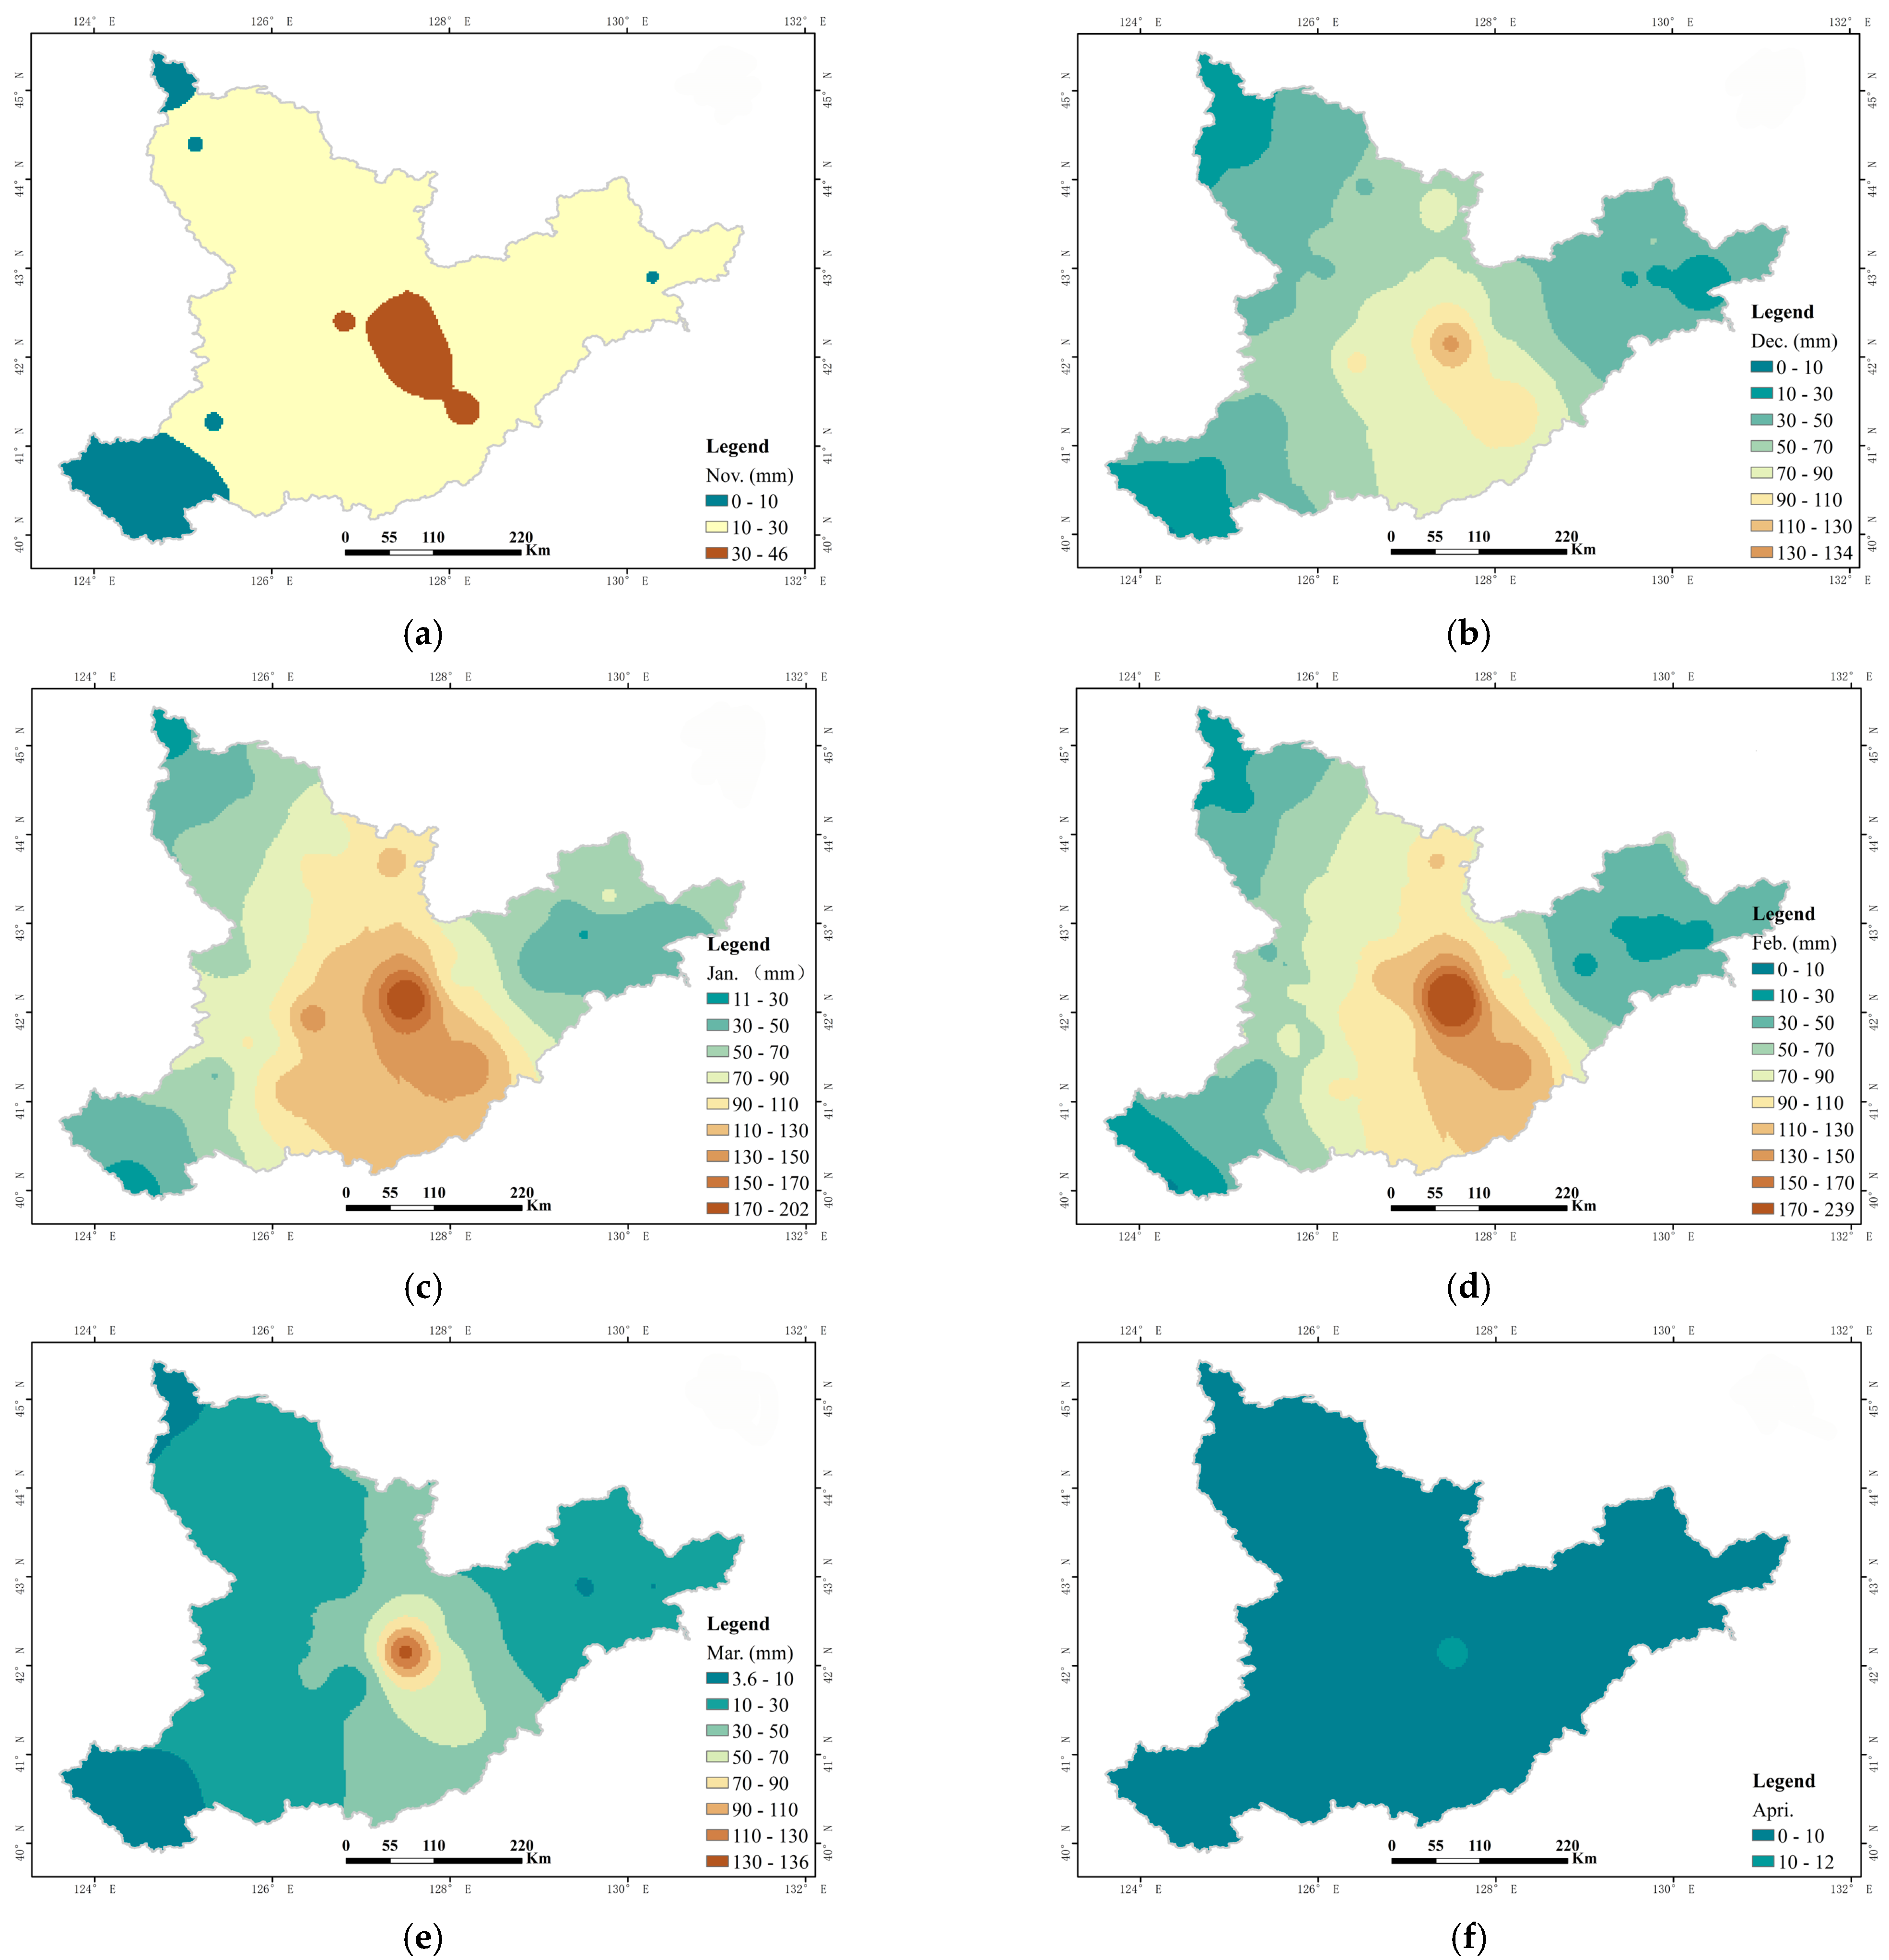
3.1.2. Variation of Monthly Mean Snow Depth

Snow depth in the Changbai Mountains has obvious seasonal variation characteristics. In November, the entire region was completely covered with snow, with snow depths reaching 30–50 mm at higher elevations (Figure 3a). After that, snow depths increased month by month (Figure 3b), reaching a maximum in January (Figure 3c), with an average snow depth of 68.30 mm. The maximum snow depth in the high-altitude area could reach 170–207 mm. After the snow depth reached its maximum, it starts to decrease gradually (Figure 3d–f). The average snow depth in February was 57.29 mm (Figure 3d); however, the snow in some stations at high altitudes reached 239 mm deep, which is higher than the maximum in January. This indicates that the snow season was delayed, and the snow period was longer in the high-altitude area than that of the low altitude area. The snow depth decreases significantly in April (Figure 3f), and most of the areas have between 0 and 10 mm of snow, which is significantly affected by the increase in temperature.

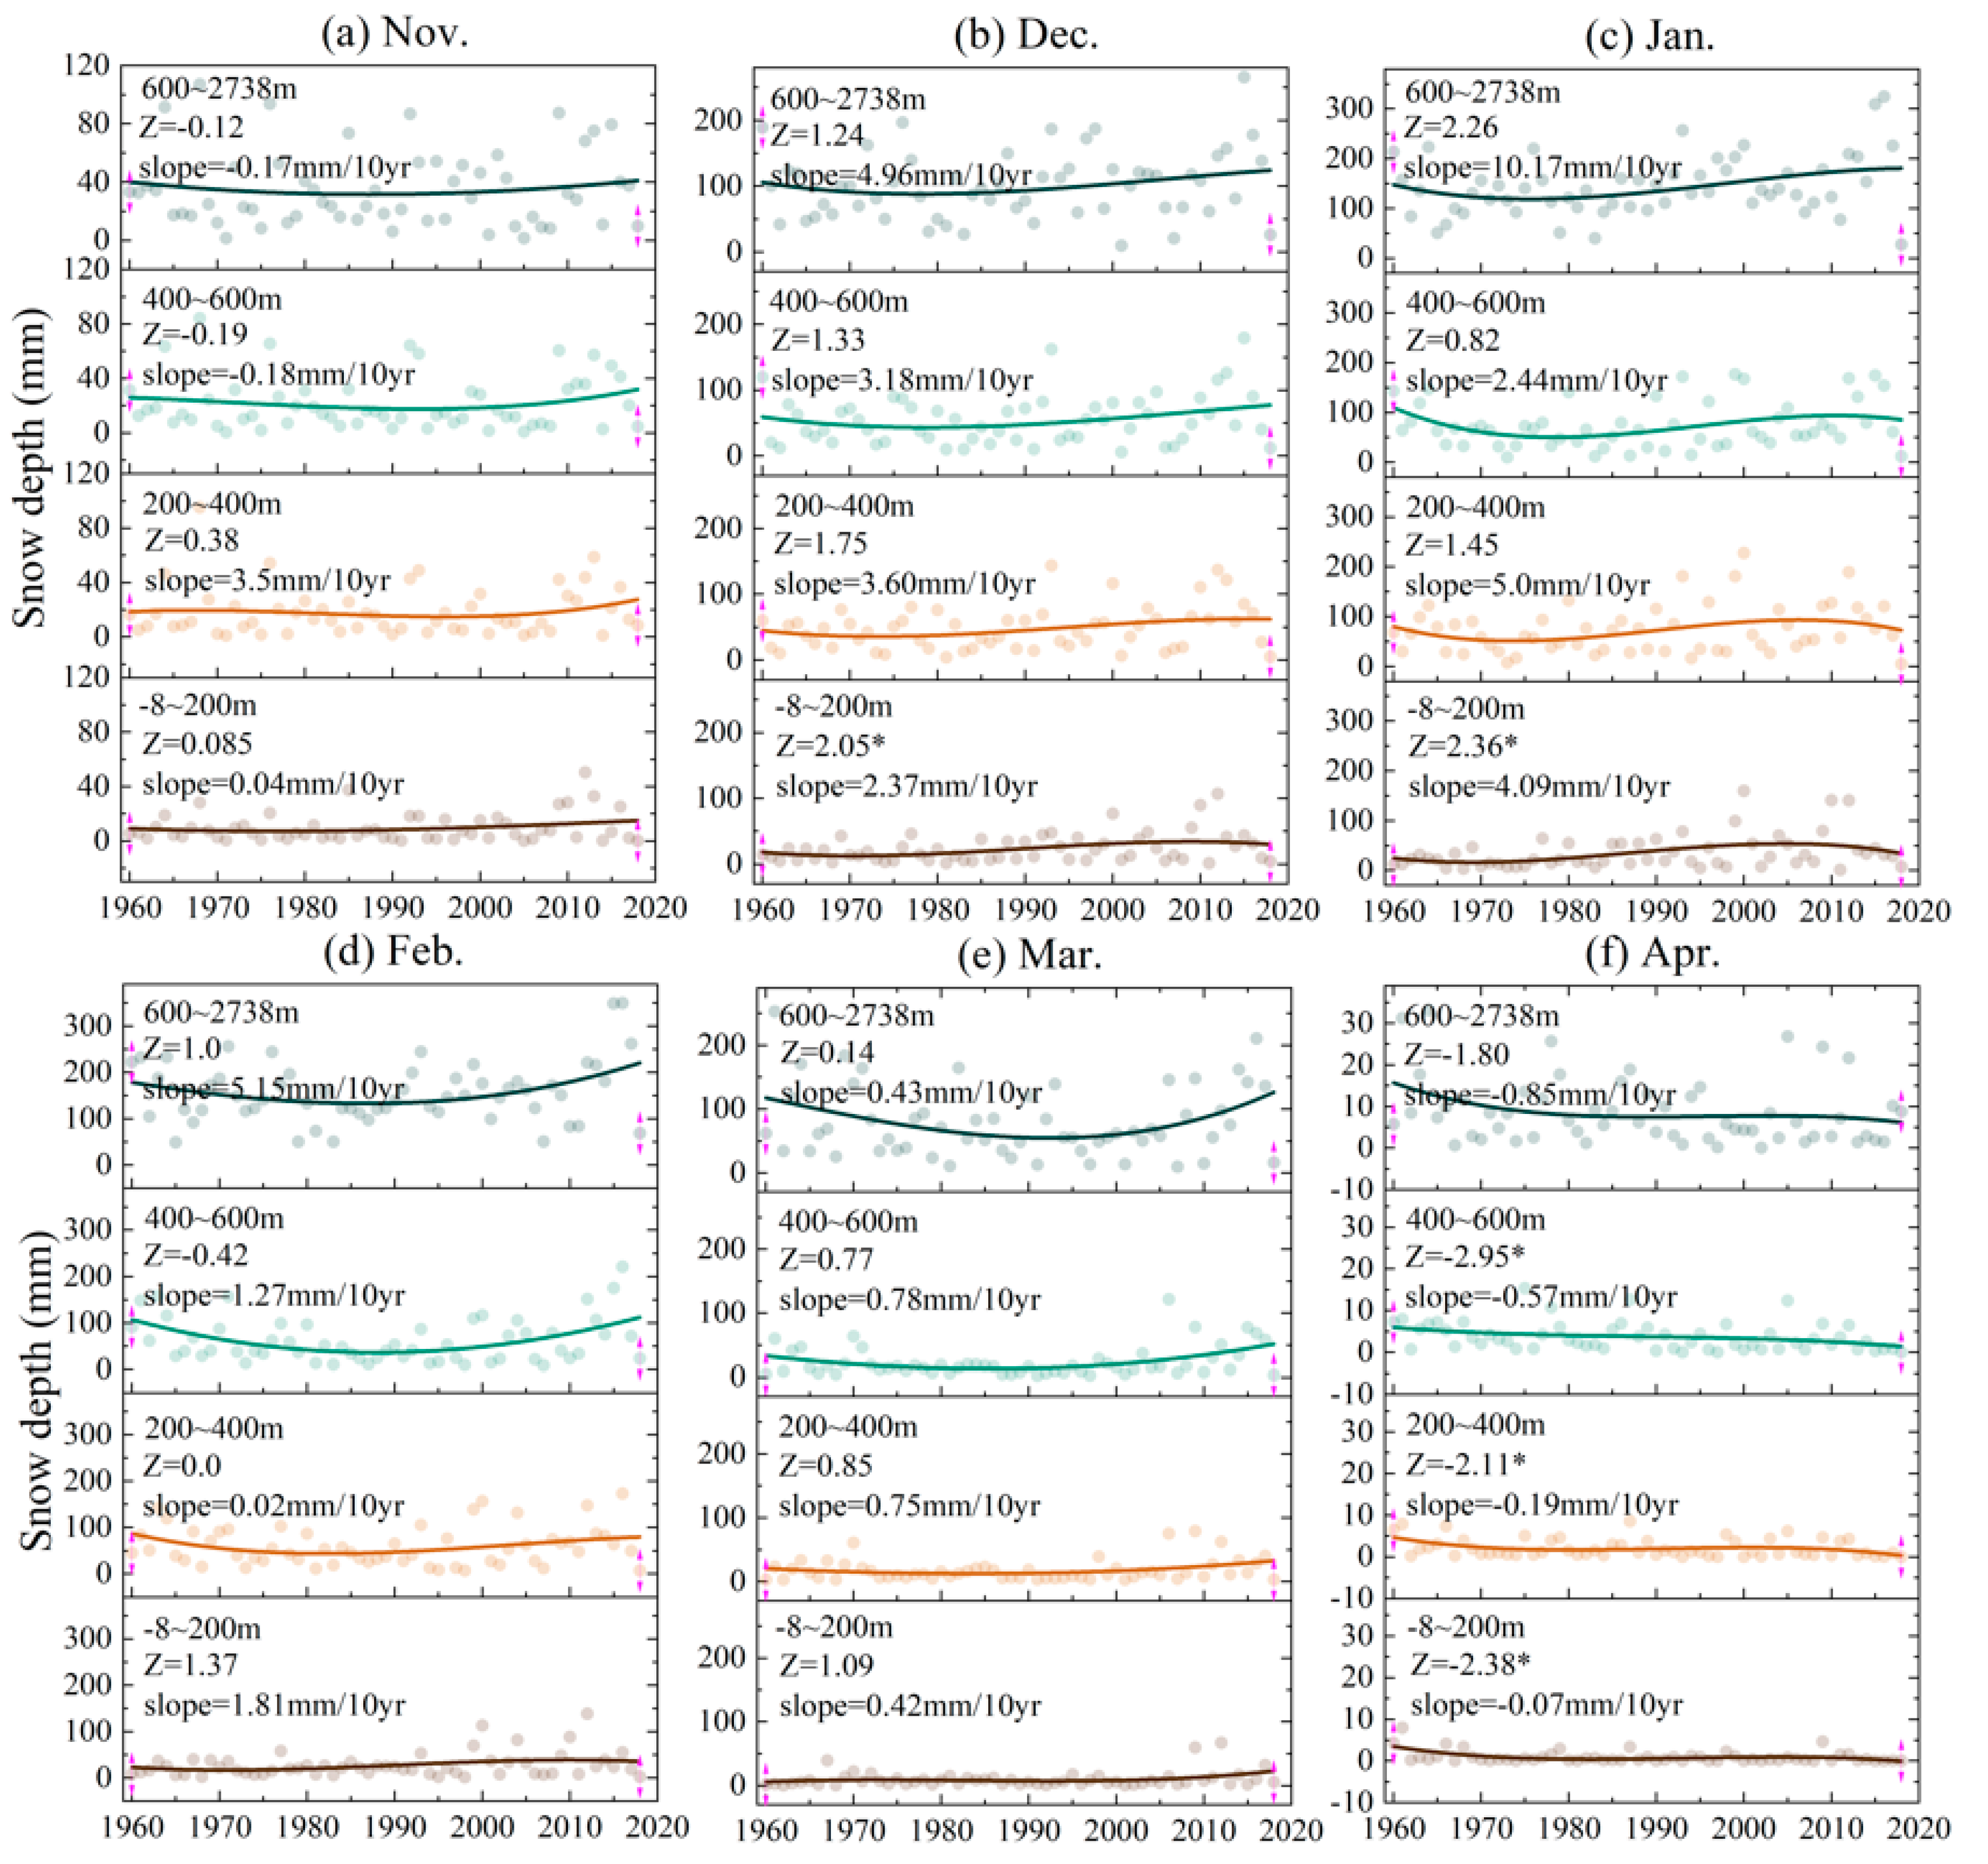
3.2. Interannual Evolution of Snow Depth at Different Altitudes in the Changbai Mountains

There was no significant trend in snow depth at different altitudes in November from 1960 to 2018 (Figure 4a). The trend in variation was not consistent under each altitude gradient. Increasing trends were observed at −8~200 m (slope = 0.04 mm/10 years) and 200–400 m (slope = 3.5 mm/10 year). Meanwhile, decreasing trends were observed at 400~600 m (slope = −0.18 mm/10 year) and 600~2738 m (slope = −0.17 mm/10 year). Increasing trends in snow depth were observed at different altitudes in December during 1960~2018 (Figure 4b). The trend in increasing snow depth at −8~200 m is significant (Z = 2.05), with a rate of 2.37 mm/10 year, and there was no significant change at all other altitudes. Similar to December, only the snow depth from −8 to 200 m showed a significant increasing trend (Z = 2.38) at a rate of 4.09 mm/10 year in January (Figure 4c). There was no significant trend in snow depth in either February (Figure 4d) or March (Figure 4e), showing only a weakly increasing trend. The most significant change in snow depth was in April, which showed a significant decreasing trend, except for between 600 and 2378 m (Figure 4f). The decreasing trend was 0.07 mm/10 year at −8~200 m, −0.19 mm/10 year at 200~400 m and 2.44 mm/10 year at 400~600 m, respectively. Compared with other altitudes, interannual variation in snow depth was more significant at −8~200 m from 1960 to 2018.

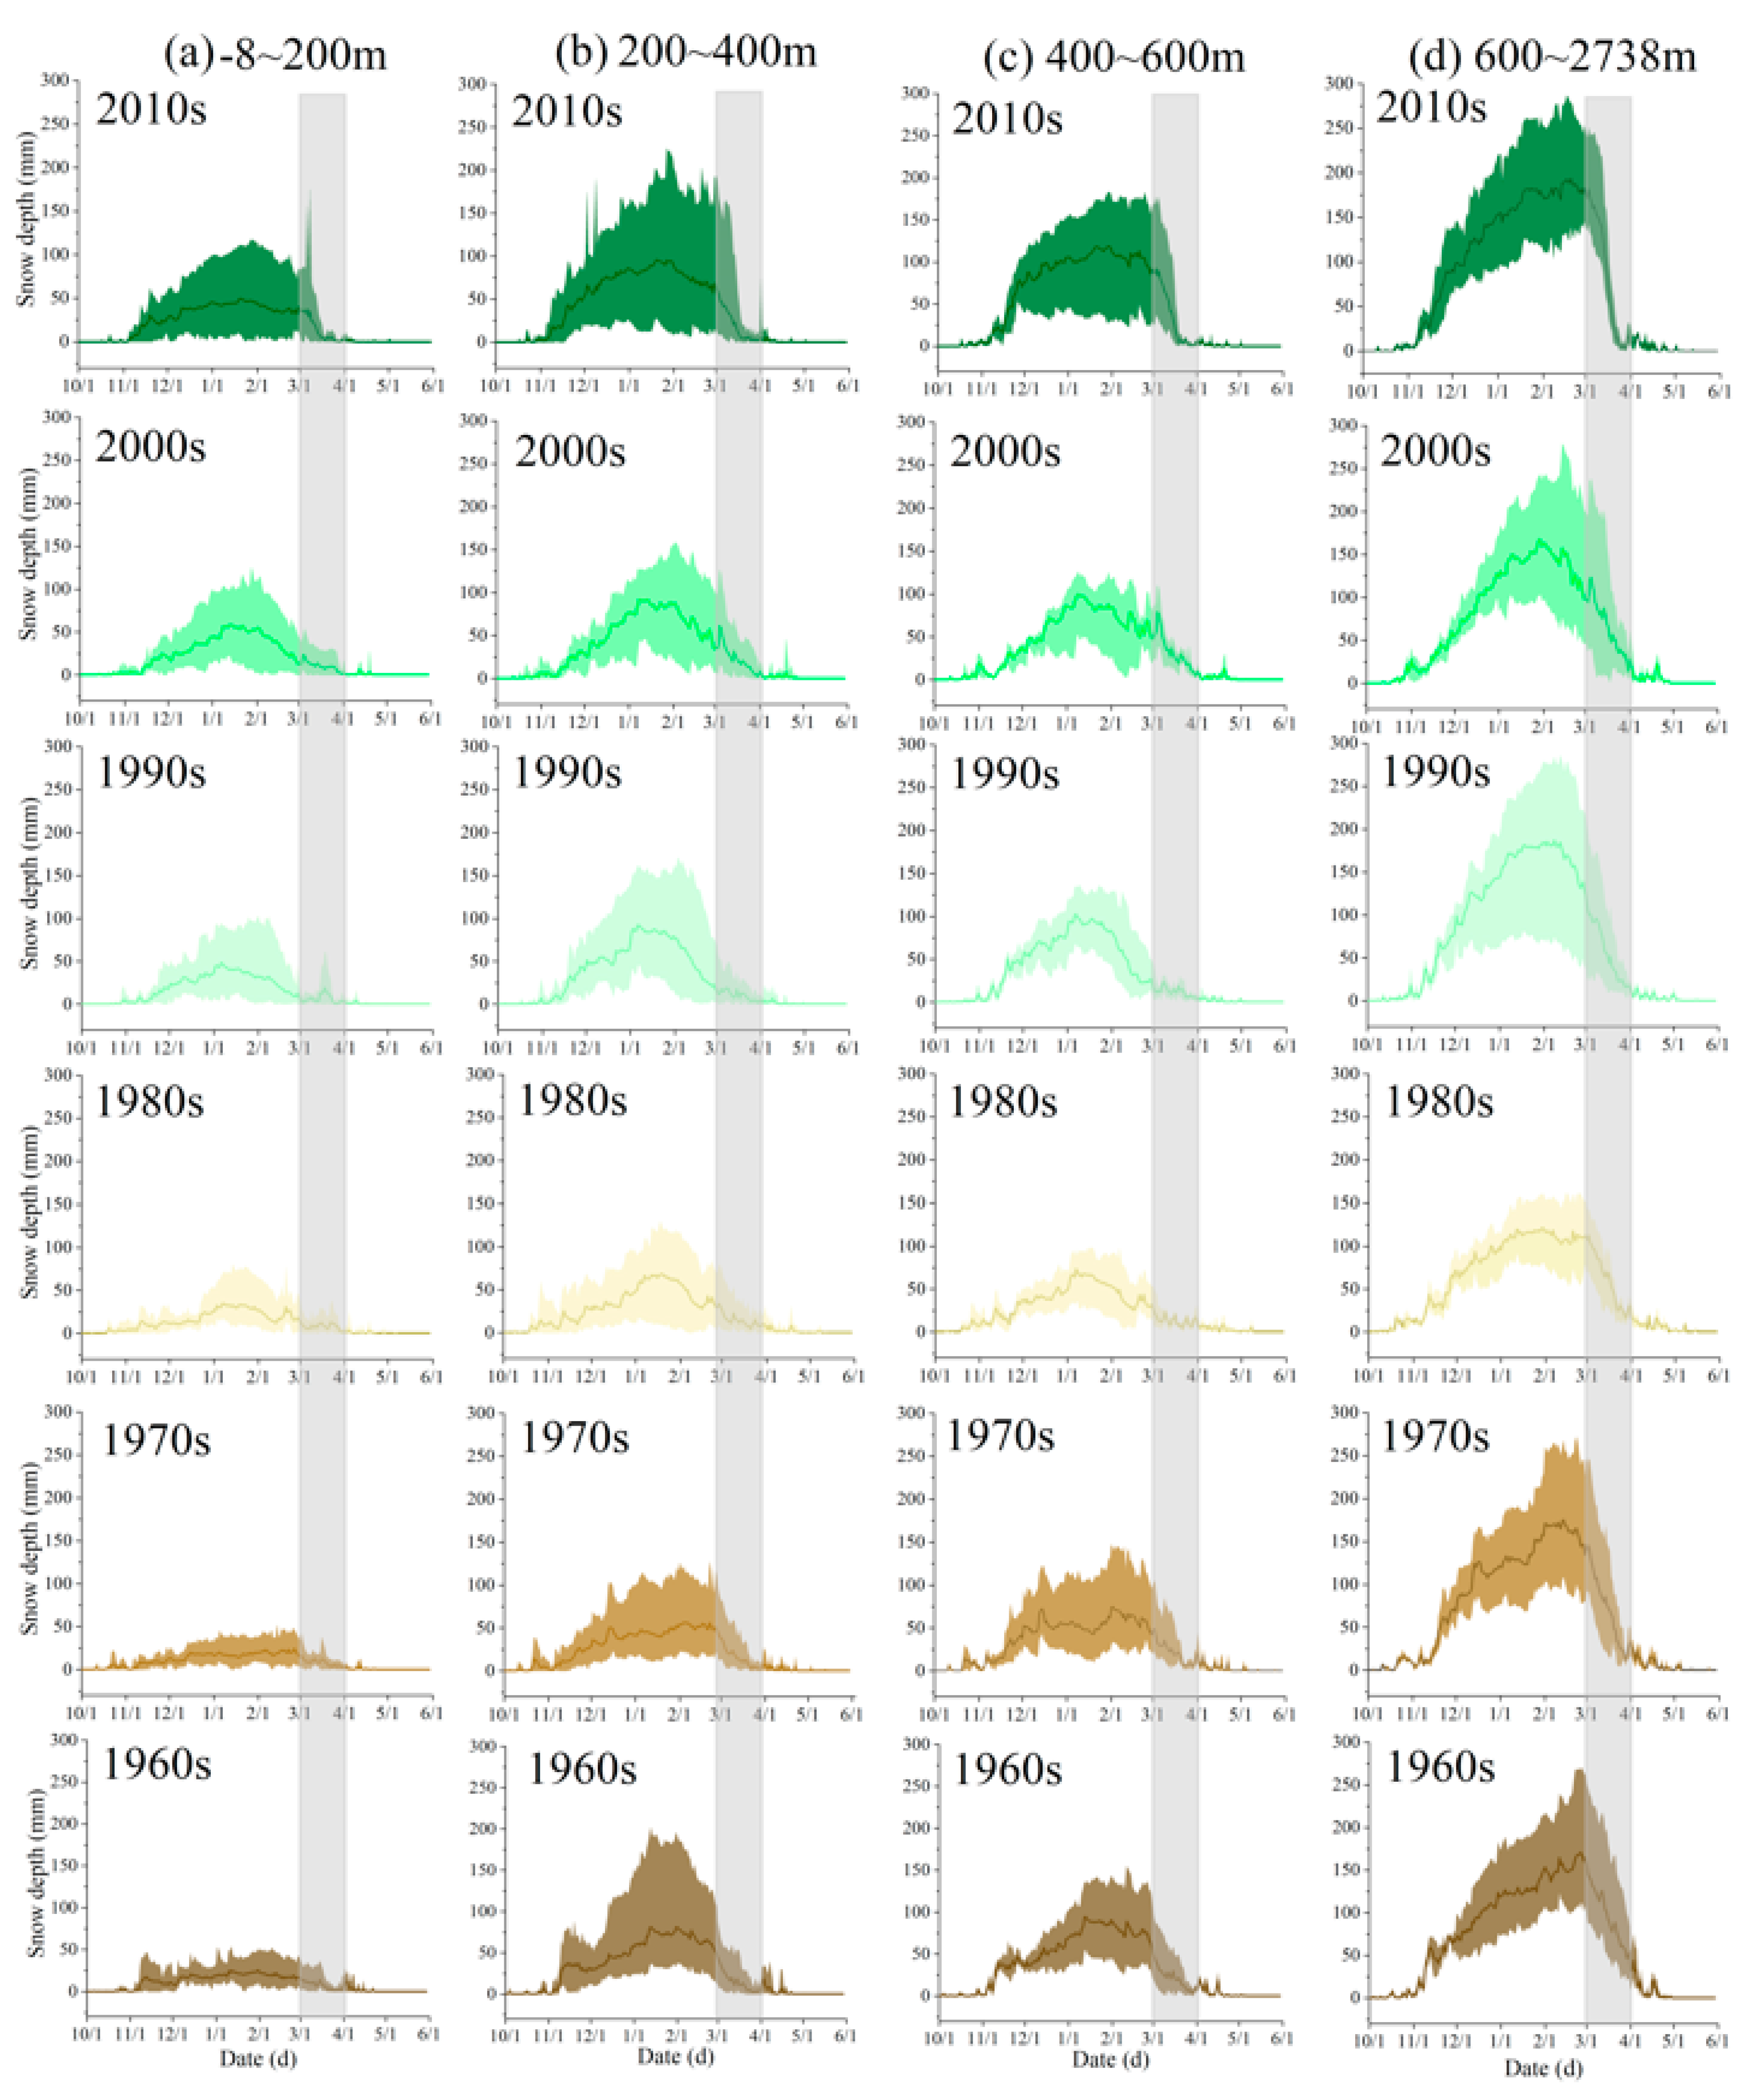
3.3. Intra-Annual Evolution of Snow Depth at Different Altitudes in the Changbai Mountains

The Changbai Mountains are a seasonal frozen soil area; the snow period lasts from October to May. It can clearly be seen that as the altitude rises, the date of maximum snow depth appears more lagged, with 0~200 m presenting at the end of January and 600~2738 m presenting in mid-February (Figure 5). At the same time, the start and end times of the snowpack were different in different years. In the 2010s, the snow began on October 17 at an altitude of −8~200 m; this start time lagged behind that in the 1960s by 11 days. The spring snowpack melted significantly faster in the 2010s than that in the 1960s. The snow disappeared on 9 April in 2010s, 10 days earlier than in the 1960s at −8~200 m. The same phenomenon was observed at other altitudes; only the change was different with increasing altitudes.
In contrast to the changes in snow depth, the snow cover time at different altitudes in the Changbai Mountains exhibited a trend of first increasing and then decreasing from 1960 to 2018 (Figure 6). In addition, the average snow cover time in the 1960s was 185 days at −8~200 m, 195 days at 200~400 m, 193 days at 400~600 m and 198 days at 600~2738 m. Compared with the 1960s, the average snow cover time in the 2010s had decreased by 8 days at −8~200 m, 6 days at 200~400 m, 5 days at 400~600 m and 2 days at 600~2738 m.
In contrast to the change in snow depth, the snow cover time at different altitudes in Changbai Mountain showed a trend of first increasing and then decreasing during 1960~2018 (Figure 6). In addition, the average snow cover time in 1960s was 185 days in −8~200 m, 195 days in 200~400 m, 193 days in 400~600 m and 198 days in 600~2738 m, respectively. Compared with 1960, the average snow cover time in 2010s decreased by 8 days in −8~200 m, 6 days in 200~400 m, 5 days in 400~600 m and 2 days in 600~2738 m, respectively.

3.4. The Drivers of Snow Depth Variation in the Changbai Mountains

Based on the results of the GAM, the main drivers of snow depth variation differed at different elevations. The snowpack variation was mainly influenced by SF (deviance explained = 57.50%), followed by ET0 (deviance explained = 51.50%) and RH (deviance explained = 40.60%) in November at −8~200 m during 1960~2018 (Table 2). It was mainly influenced by ET0 (deviance explained = 64.90%), followed by RH (deviance explained = 57.80%) and SF (deviance explained = 37.10%) in December. It was mainly influenced by ET0 (deviance explained = 60.50%), followed by RH (deviance explained = 38.00%) and SH (deviance explained = 34.80%) in January. It was mainly influenced by RH (deviance explained = 55.40%), followed by ET0 (deviance explained = 50.80%) and wind (deviance explained = 32.90%) in February. It was mainly influenced by ET0 (deviance explained = 53.70%), followed by RH (deviance explained = 46.90%) and SH (deviance explained = 31.80%) in March. It was mainly influenced by RH (deviance explained = 52.70%), followed by ET0 (deviance explained = 46.90%) and SH (deviance explained = 39.00%) in April.
The snowpack variation was mainly influenced by RH (deviance explained = 47.60%), followed by ET0 (deviance explained = 46.80%) and SH (deviance explained = 32.60%) in November at 200~400 m during 1960~2018 (Table 3). It was mainly influenced by ET0 (deviance explained = 58.30%), followed by RH (deviance explained = 45.50%) and Tm (deviance explained = 14.80%) in December. It was mainly influenced by ET0 (deviance explained = 38.30%), followed by RH (deviance explained = 26.50%) and SH (deviance explained = 20.80%) in January. It was mainly influenced by ET0 (deviance explained = 42.50%), followed by RH (deviance explained = 41.80%) and Tm (deviance explained = 21.50%) in February. It was mainly influenced by ET0 (deviance explained = 45.90%), followed by RH (deviance explained = 39.60%) and SH (deviance explained = 34.90%) in March. It was mainly influenced by RH (deviance explained = 52.10%), followed by ET0 (deviance explained = 42.90%) and Tm (deviance explained = 37.70%) in April.
The snowpack variation was mainly influenced by ET0 (deviance explained = 40.80%), followed by RH (deviance explained = 39.90%) and SH (deviance explained = 24.90%) in November at 400~600 m during 1960~2018 (Table 4). It was mainly influenced by ET0 (deviance explained = 29.70%), followed by RH (deviance explained = 26.40%) and wind (deviance explained = 14.60%) in December. It was mainly influenced by ET0 (deviance explained = 25.10%), followed by wind (deviance explained = 22.40%) and SF (deviance explained = 16.20%) in January. It was mainly influenced by ET0 (deviance explained = 40.20%), followed by RH (deviance explained = 28.00%) and wind (deviance explained = 25.60%) in February. It was mainly influenced by Tm (deviance explained = 37.90%), followed by SH (deviance explained = 32.20%) and ET0 (deviance explained = 21.70%) in March. It was mainly influenced by RH (deviance explained = 49.60%), followed by Tm (deviance explained = 46.90%) and ET0 (deviance explained = 33.30%) in April.
The snowpack variation was mainly influenced by ET0 (deviance explained = 37.00%), followed by RH (deviance explained = 31.50%) and SH (deviance explained = 22.00%) in November at 600~2738 m during 1960~2018 (Table 5). It was mainly influenced by RH (deviance explained = 11.70%), followed by ET0 (deviance explained = 11.20%) and SH (deviance explained = 8.03%) in December. It was mainly influenced by Tm (deviance explained = 8.31%), followed by wind (deviance explained = 7.87%) and RH (deviance explained = 5.77%) in January. It was mainly influenced by SH (deviance explained = 7.77%), followed by RH (deviance explained = 7.21%) and wind (deviance explained = 25.60%) in February. It was mainly influenced by Tm (deviance explained = 26.10%), followed by ET0 (deviance explained = 17.20%) and RH (deviance explained = 6.33%) in March. It was mainly influenced by Tm (deviance explained = 61.40%), followed by ET0 (deviance explained = 50.60%) and SF (deviance explained = 36.00%) in April.

4. Discussion

4.1. Spatio-Temporal Changes of Snow in the Changbai Mountains

The Changbai Mountains are an important, functional ecological area in East Asia, with a typical vertical belt spectrum, from temperate broad-leaved forest to tundra in the east of Eurasia. Snow is one of the most important water sources for maintaining ecological function of the region. It has been shown that snowmelt runoff can account for 14.1% to 59.8% of the total runoff in watersheds in the source area of the Changbai Mountains [19]. In recent decades, the snowpack of Changbai Mountain has changed considerably with climate change. In general, the snow depth showed a trend of decreasing and then increasing during 1961~2018; it was at a minimum value in the 1980s, which has been proven by Li and Ke [20]. In terms of space, the area of snow cover with an annual average of more than 70 mm has been expanding since the 1990s (Figure 3). Temporally, snow depth showed a trend of increasing and then decreasing during 1961–2018. This finding was consistent with the existing research results [21,22,23]. However, previous studies have lacked the heterogeneity of snow depth variation at different altitudes. The most significant increase in snow depth was observed at lower altitudes (−8~200 m), but the increased value was greater at higher altitudes than in other regions (600~2738 m) in December, January and February (Figure 4) during 1961~2018. The duration of snow cover also first increased and then decreased at different altitudes. The duration increased before 1980 and then decreased. The spring snowpack melted significantly faster in the 2010s compared with that of the 1960s.

4.2. Climatic Drivers for Changes in Snow Depth

Changbai Mountains are a mountainous area with little human activity; thus, snow depth is mainly influenced by climate change [22]. In recent decades, significant changes in climate factors have occurred in the Changbai Mountains [24]. Wind speed has decreased year by year (Figure 7a), snowfall has increased (Figure 7b), ET has increased (Figure 7c), SH has decreased (Figure 7d), RH has decreased (Figure 7e) and Tm has increased (Figure 7f) at different altitudes over the past few decades. It has been found that there is a negative relationship between snow depth and average temperature [20]. Another study concluded that snowfall has a greater effect on snow depth than temperature [21]. We found that the dominant factors affecting snow depth variability were not consistent across different months at different altitudes. The snowpack variation was mainly influenced by snowfall in November at −8~200 m during 1961~2018 (Table 1). However, the dominant factor was ET0 from December to March of the next year, and RH in April (Table 1). Variations in snow depth from 200 m to 400 m and 400 m to 600 m are mainly influenced by ET0 and RH (Table 2 and Table 3); the gradual increase in altitude temperature has become an important factor affecting the variation in snow depth. As shown in Table 4, the dominant factor affecting snow depth variability was Tm in December, March and April at 600~2738 m. At this time, a significant negative correlation was observed between snow depth and temperature.

5. Conclusions

This study identified the trend in changes in the snowpack at different altitudes during recent decades and their driving factors in a high-latitude water tower. Based on these findings, the following conclusions can be drawn:
(1)
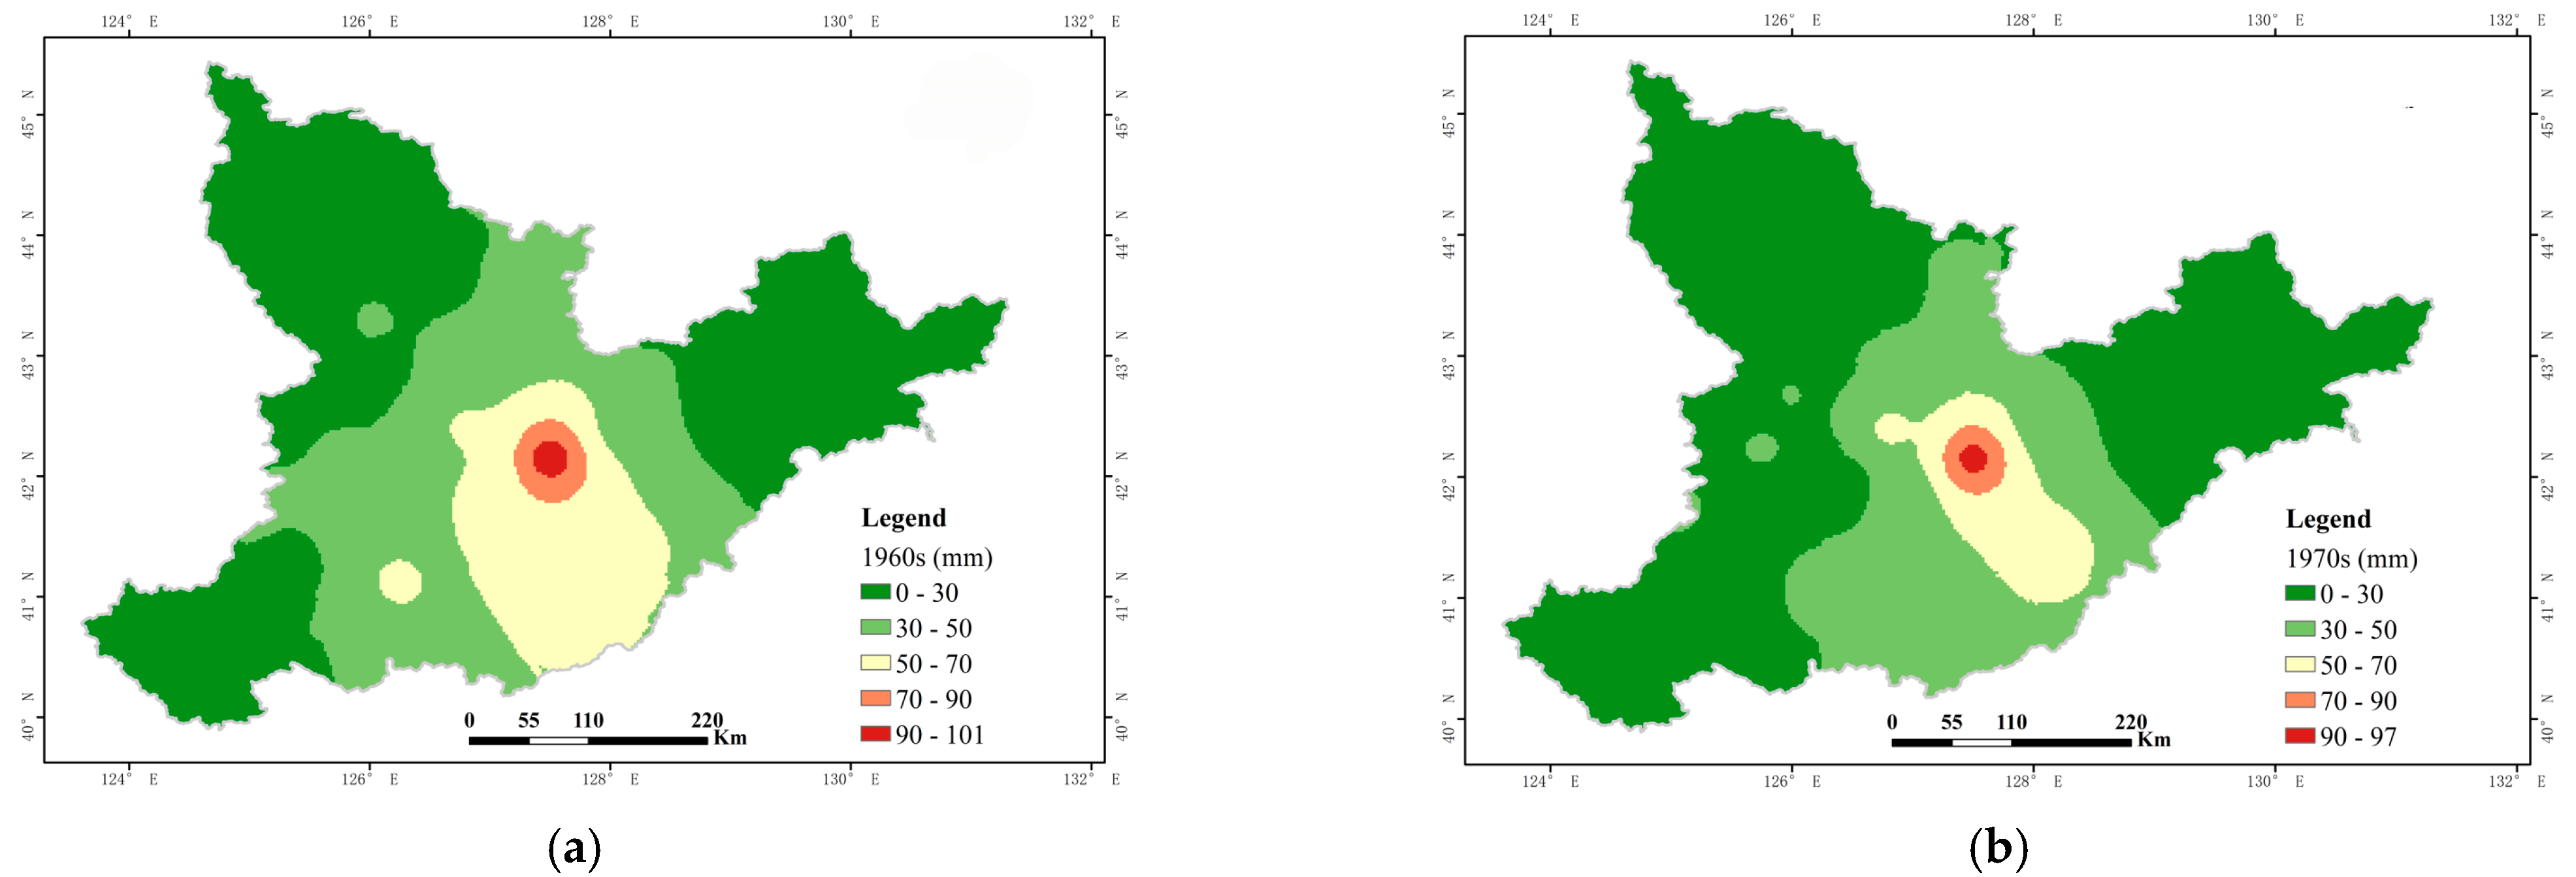
Altitude gradient characteristics of the snow distribution were identified in the Changbai Mountains. Snow depth was greater in the higher altitude areas than in the lower elevation areas at different times of the year. Compared with other years, the area with a snow over 70 mm deep increased significantly in the 2010s.
(2)
The changing trend in snow depth is not consistent under each altitude gradient. Increasing trends were observed at different altitudes from December to March of the next year during 1960~2018. The most significant change was in April, which presented a significant decreasing trend except for at 600–2378 m.
(3)
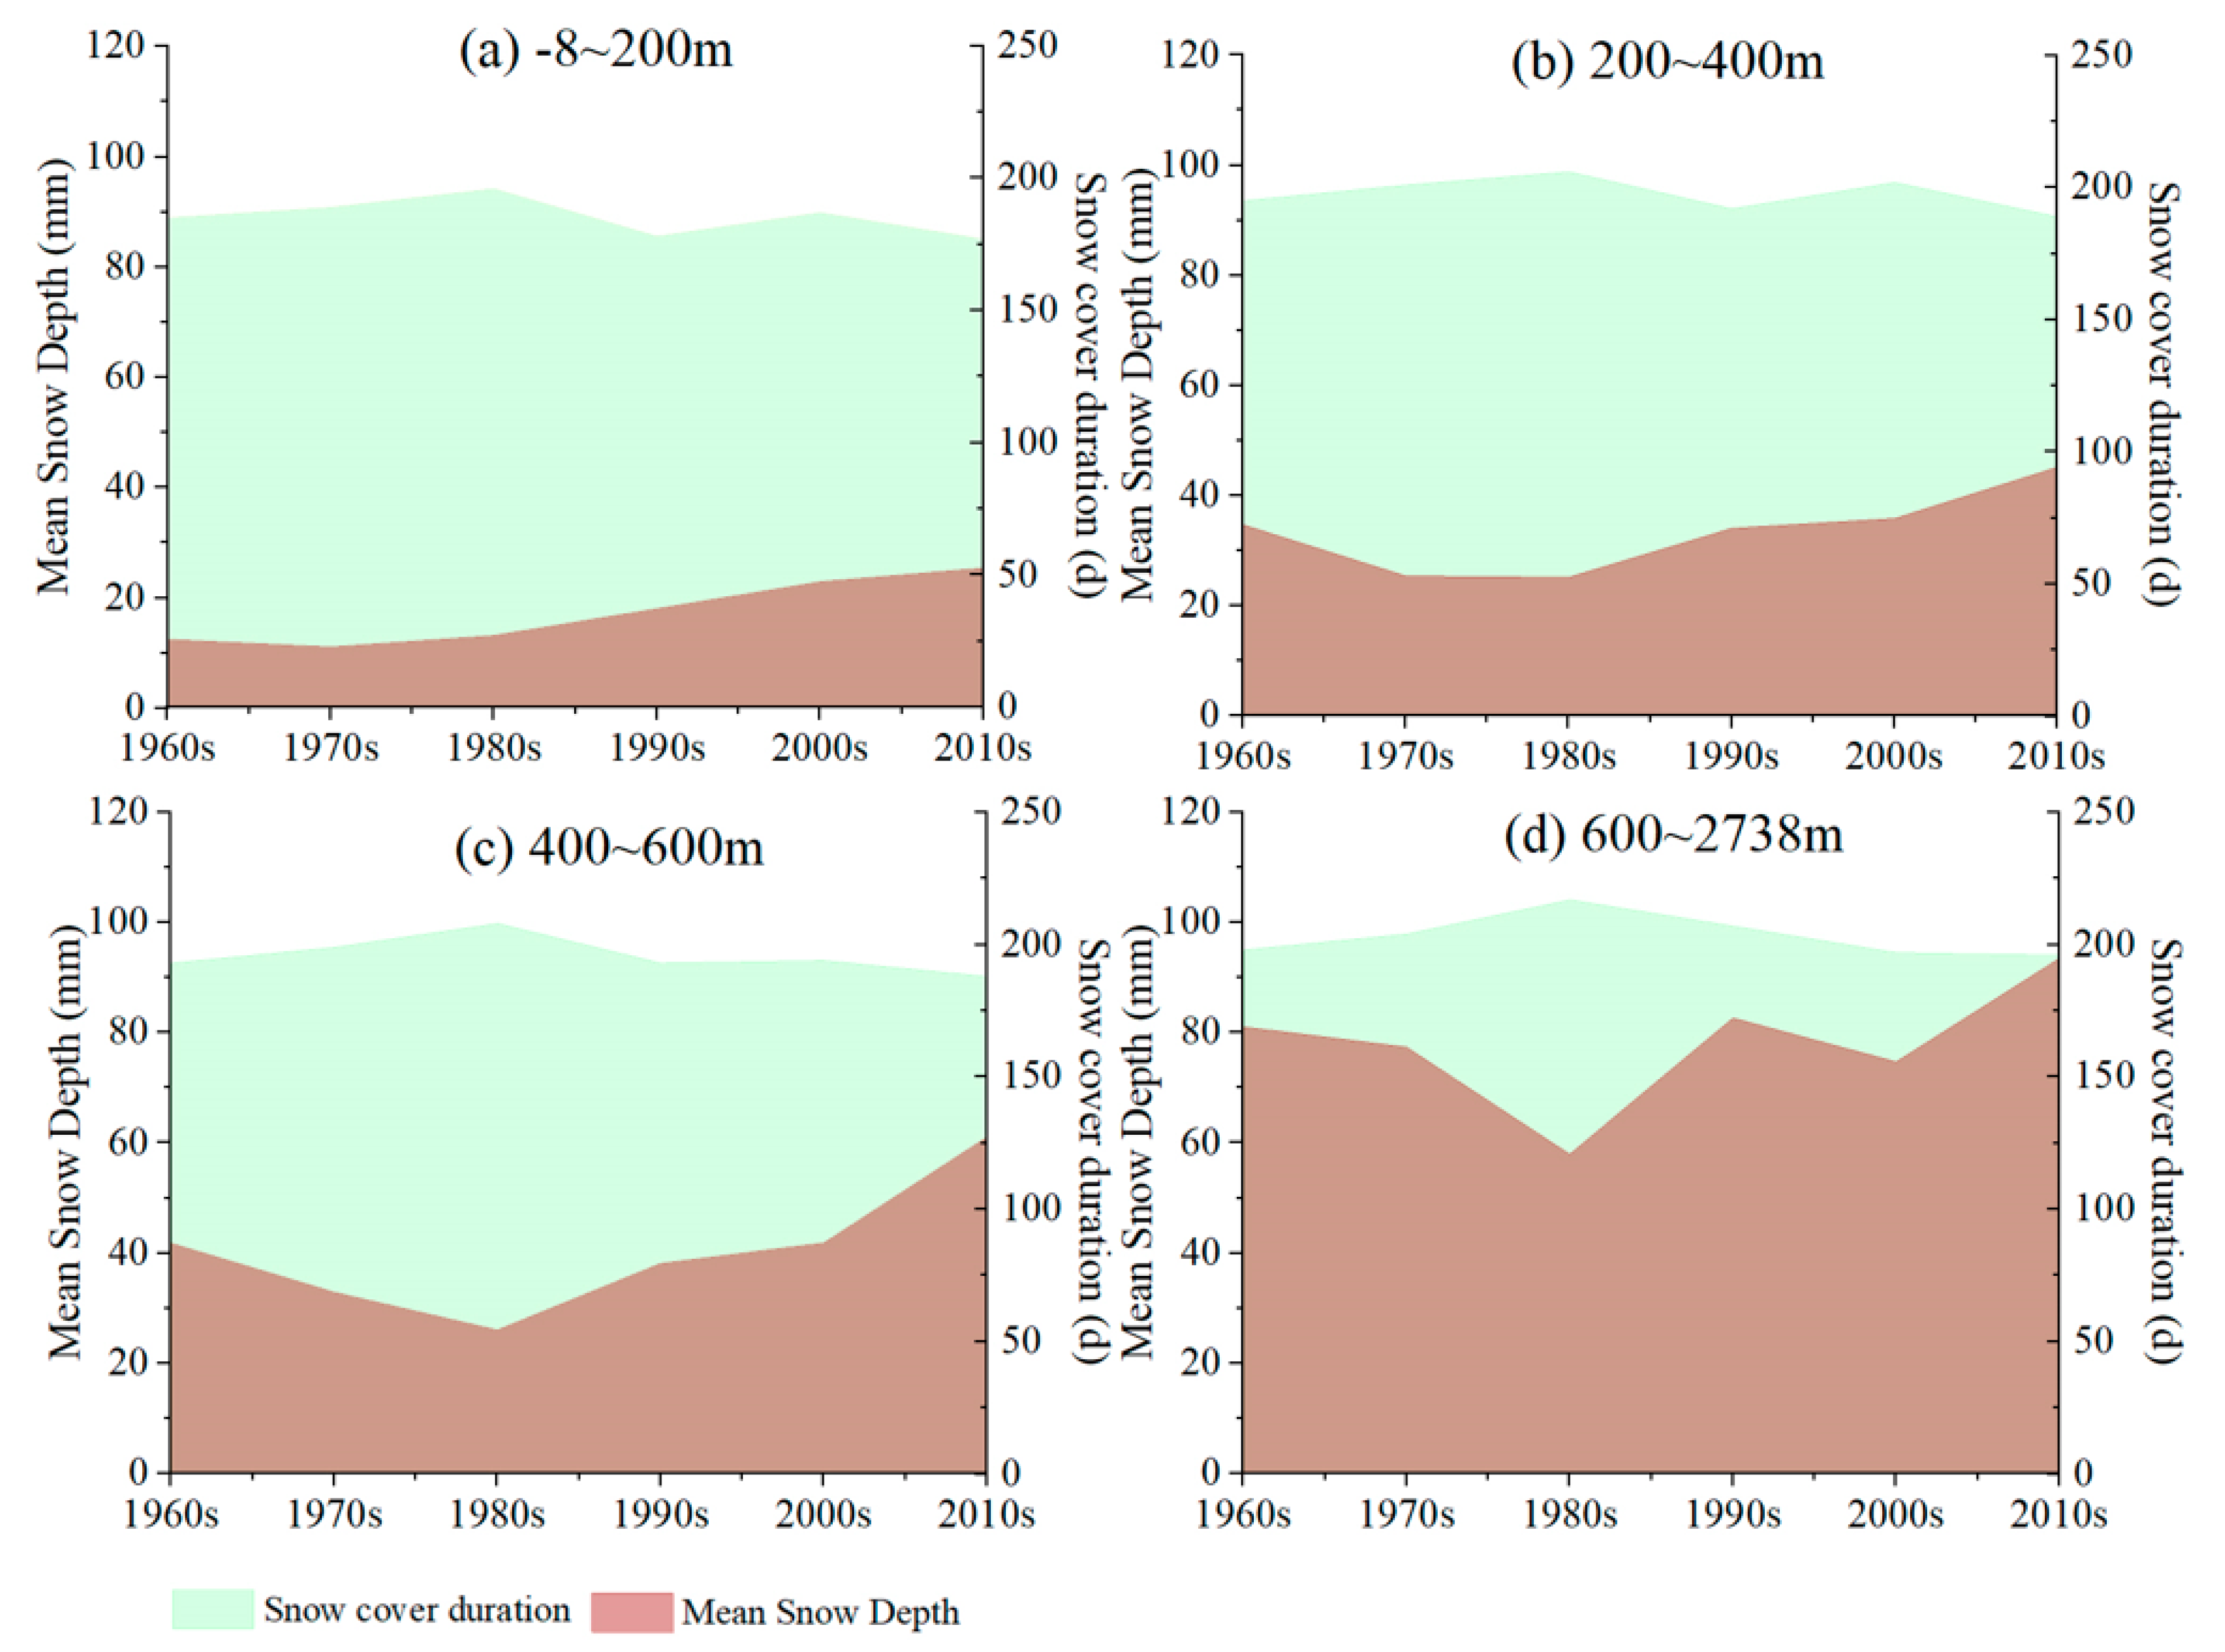
The Changbai Mountains are a seasonal frozen soil area, and the snow cover duration at different altitudes showed a trend of first increasing and then decreasing from 1960 to 2018. The date of maximum snow depth appeared to become more lagged as the altitude increased. In addition, the spring snowpack melted significantly faster in the 2010s compared with that of the 1960s. Meanwhile, the change was different with increasing altitudes.
(4)
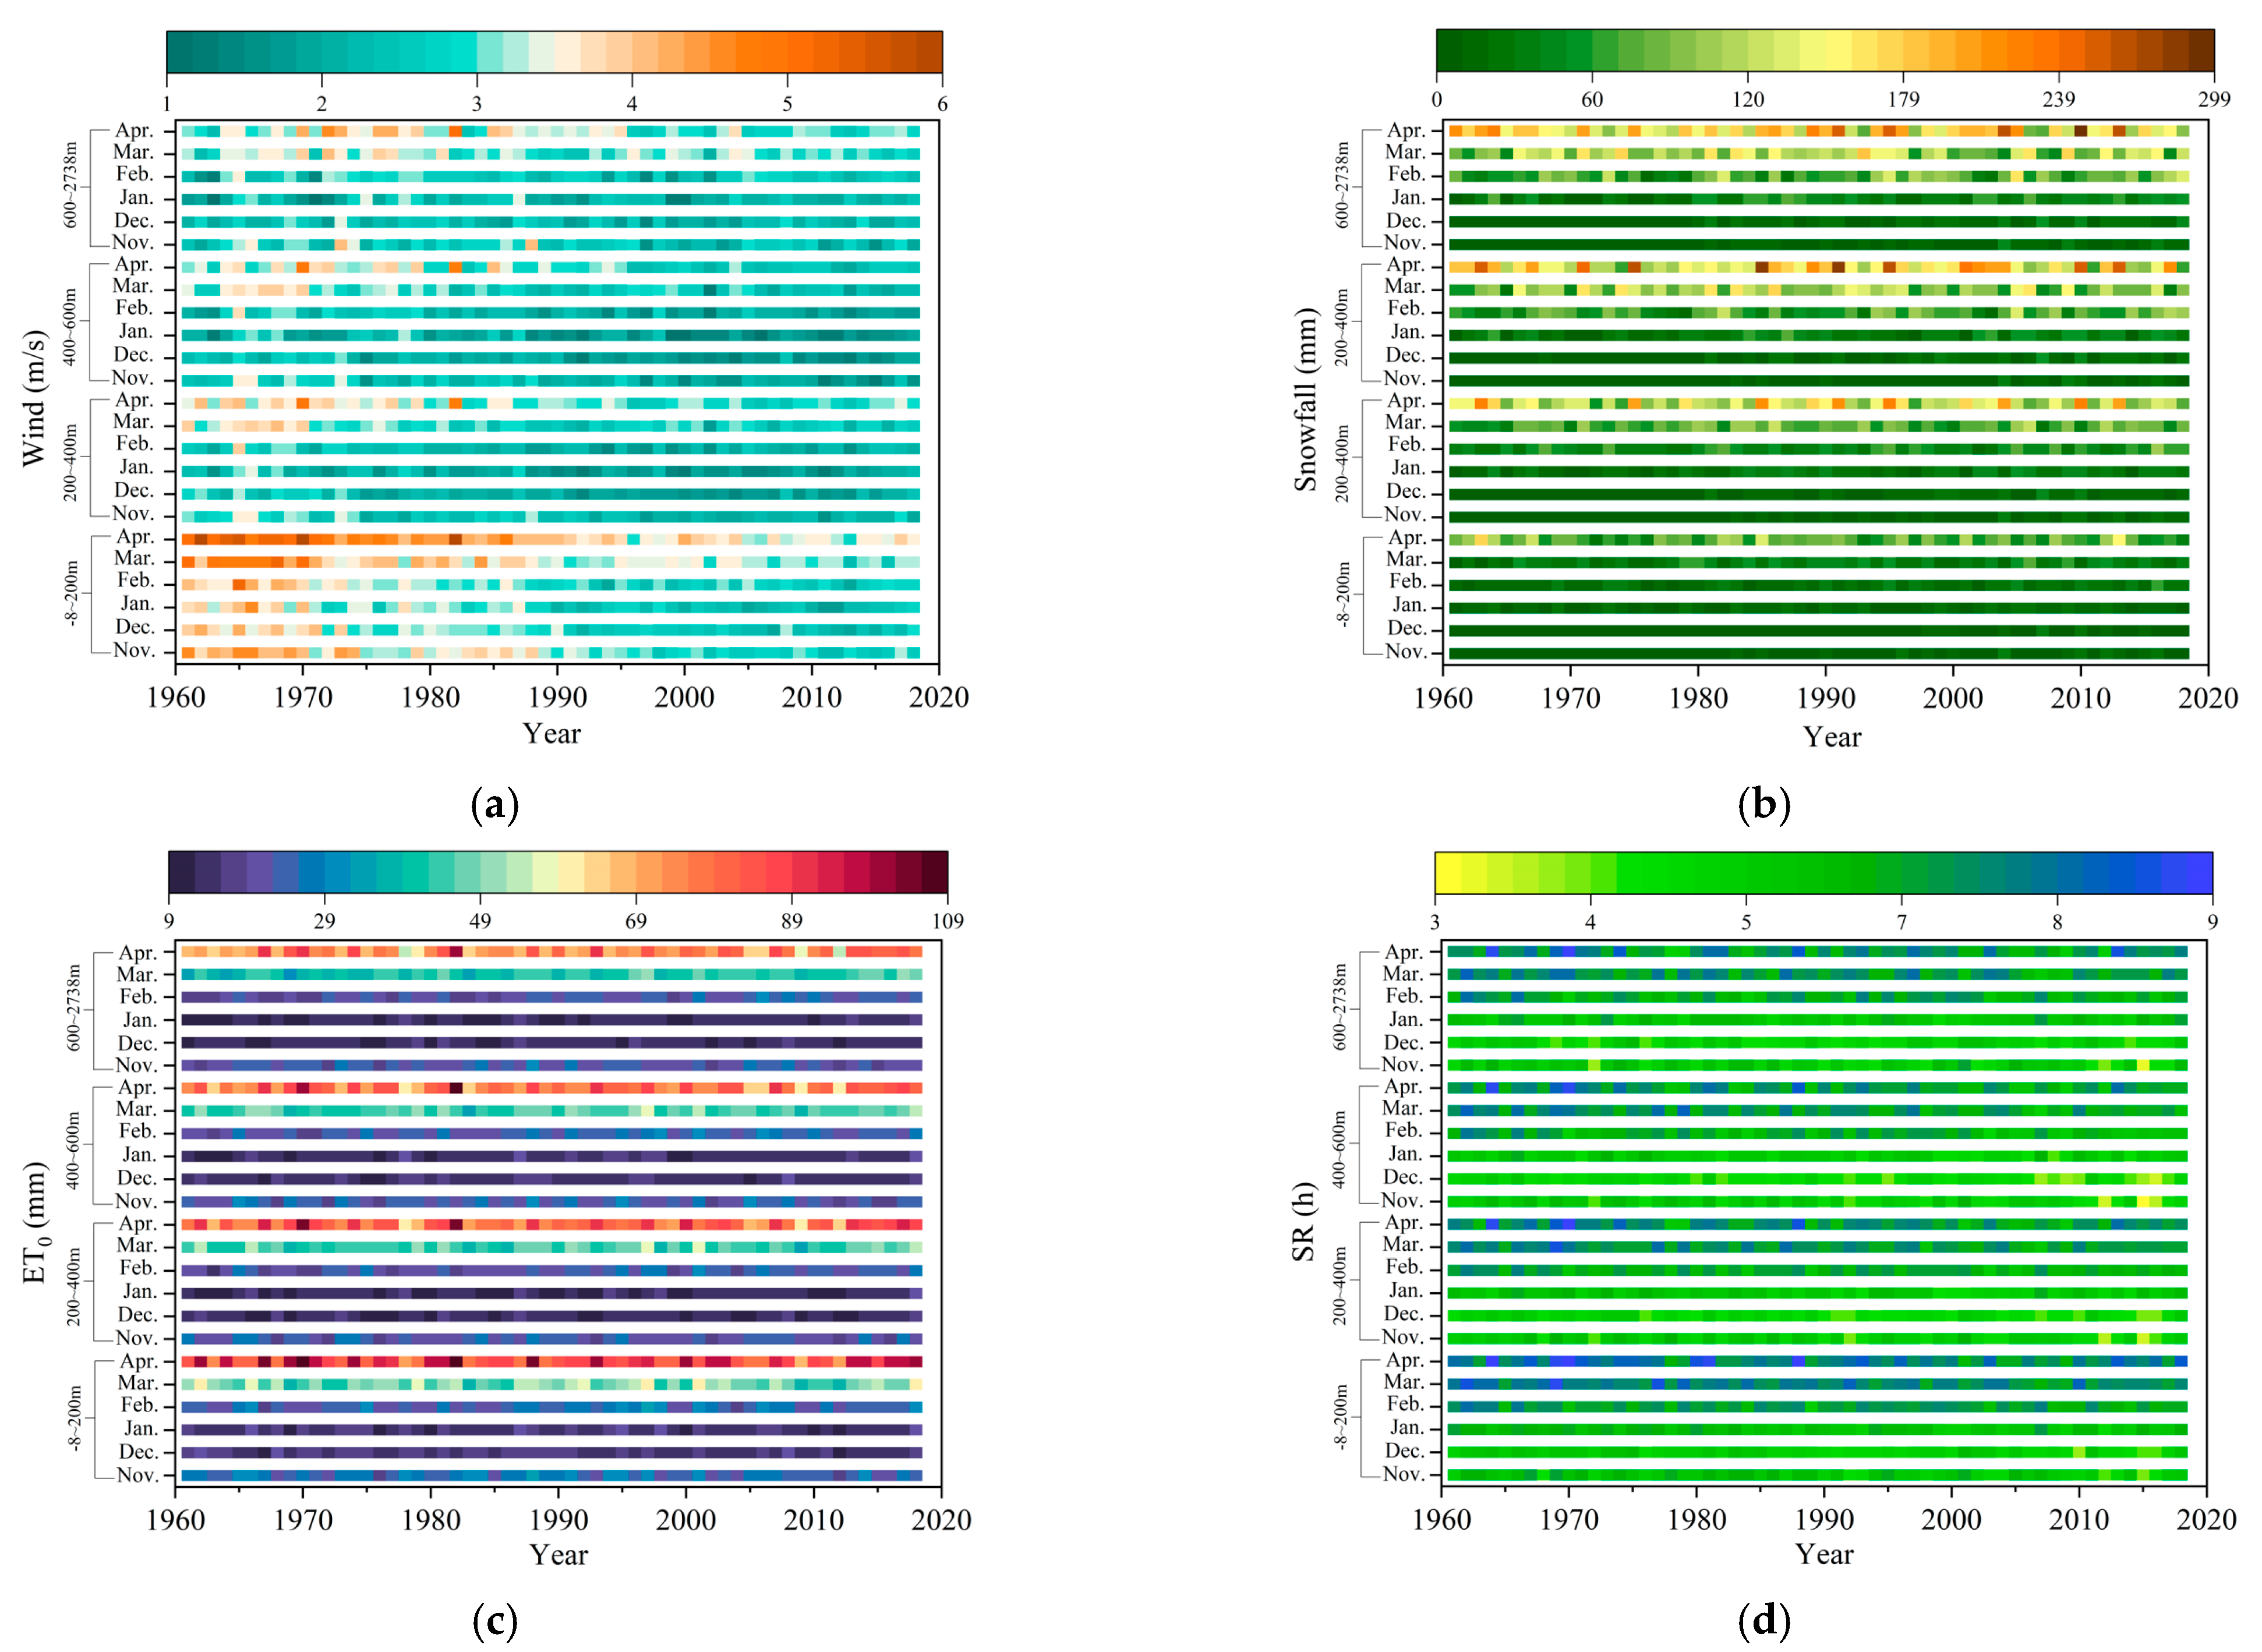
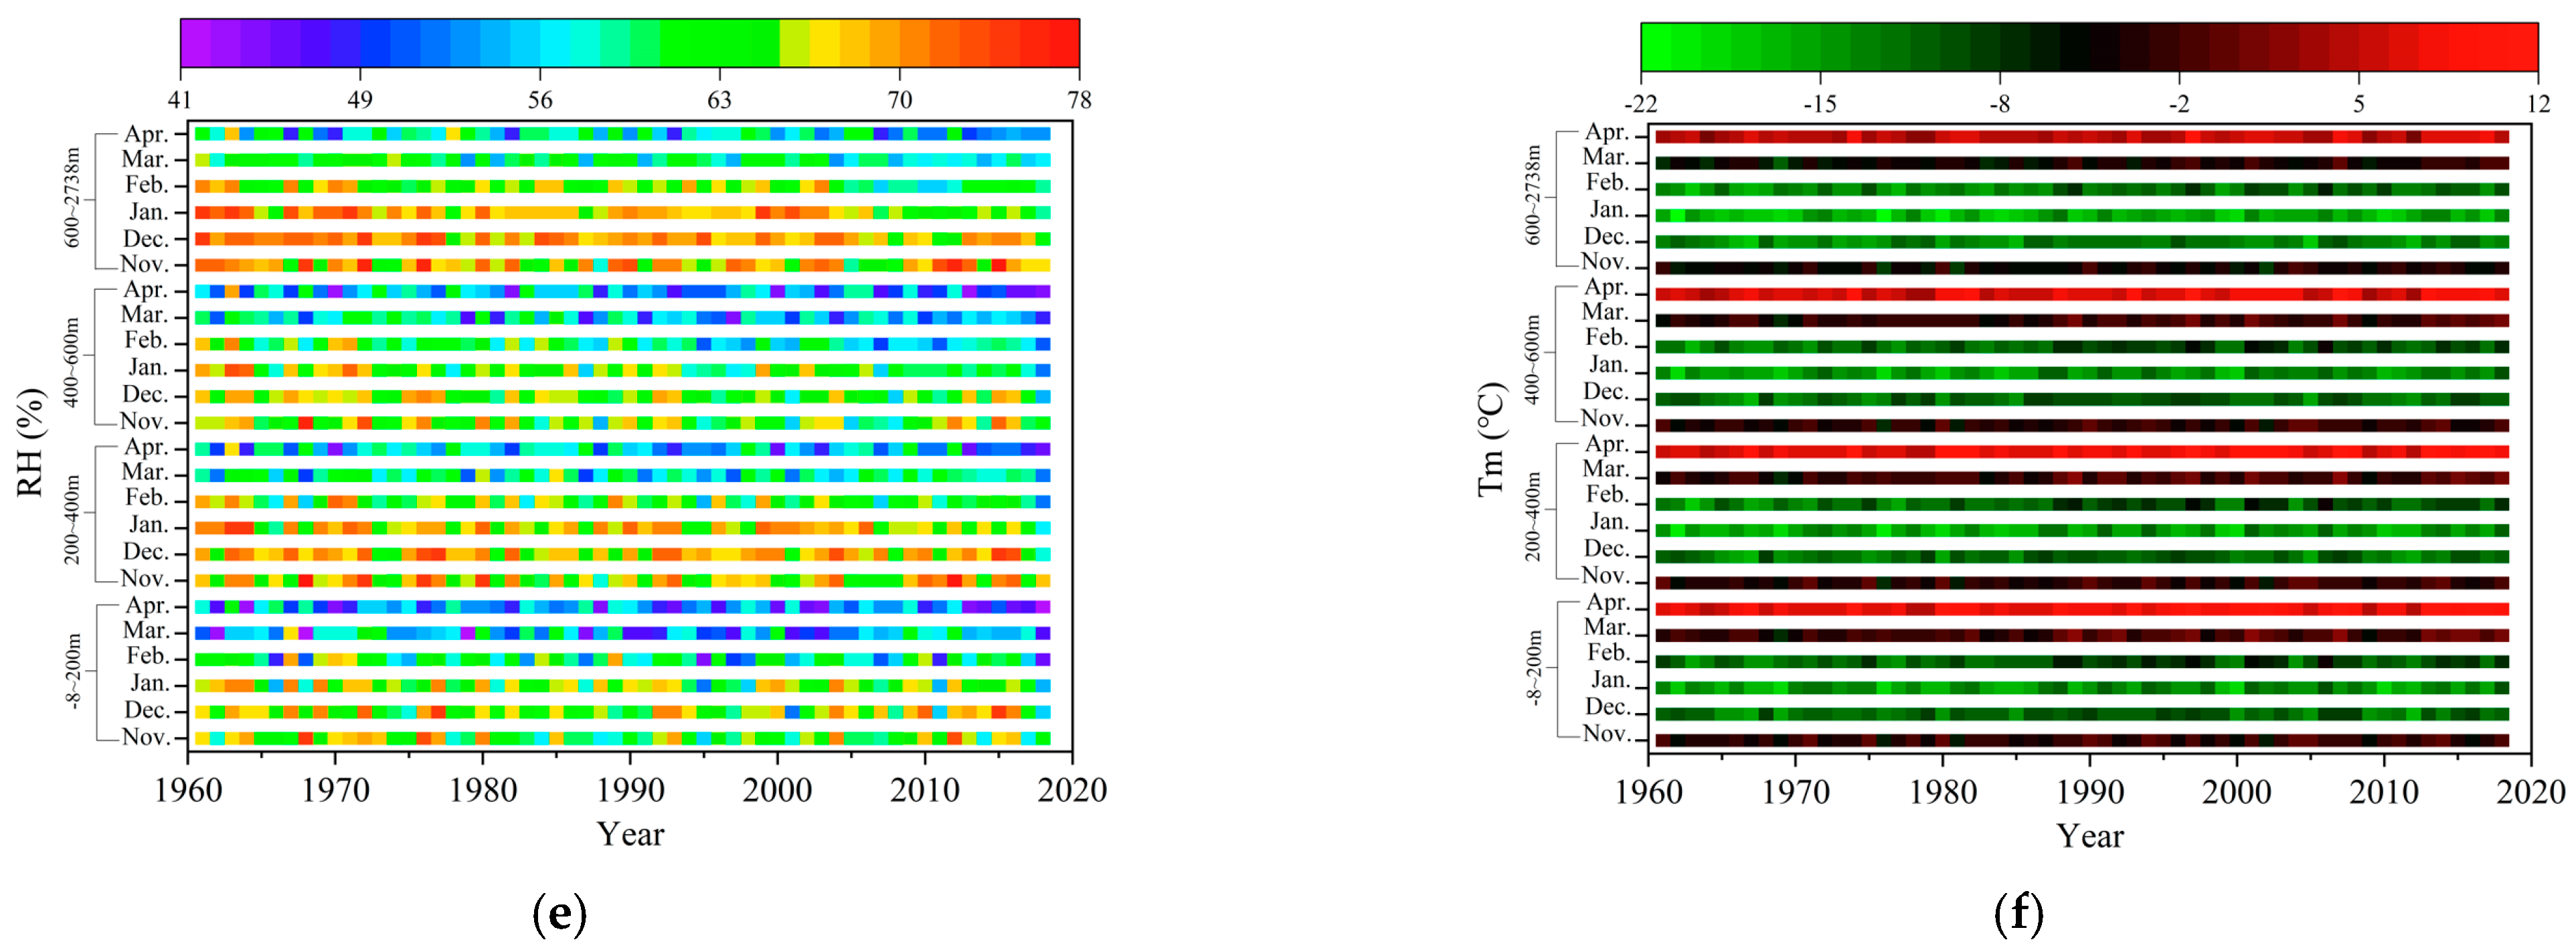
Snowpack variation in low-altitude regions is mainly influenced by ET and relative humidity. However, the mean temperature gradually became an important factor, affecting the snow depth variation with an increase in altitude.

Author Contributions

Y.C. and P.Q. conceived the idea of the study and wrote the manuscript; Z.C., S.X., Y.S. and X.T. carried out data collection and analysis; P.Q., D.L. and Y.C. contributed valuable analysis and manuscript review; all authors approved the final manuscript. All authors have read and agreed to the published version of the manuscript.

Funding

This research was supported by National Key R&D Program of China (2019YFC0409104) and National Natural Science Foundation of China (42001032). In addition, we would like to express our gratitude to both the editors and reviewers for their efforts and suggestions.

Institutional Review Board Statement

The study did not involve humans or animals.

Informed Consent Statement

The study did not involve humans.

Data Availability Statement

The study did not report any data.

Conflicts of Interest

The authors declare no conflict of interest.

References

  1. Immerzeel, W.W.; Lutz, A.F.; Andrade, M.; Bahl, A.; Biemans, H.; Bolch, T.; Hyde, S.; Brumby, S.; Davies, B.J.; Elmore, A.C.; et al. Importance and vulnerability of the world’s water towers. Nature 2020, 577, 364–369. [Google Scholar] [CrossRef]
  2. Viviroli, D.; Dürr, H.H.; Messerli, B.; Meybeck, M.; Weingartner, R. Mountains of the world, water towers for humanity: Typology, mapping, and global significance. Water Resour. Res. 2007, 43, 13–26. [Google Scholar] [CrossRef] [Green Version]
  3. Fontrodona Bach, A.; Van der Schrier, G.; Melsen, L.A.; Klein Tank, A.M.; Teuling, A.J. Widespread and Accelerated Decrease of Observed Mean and Extreme Snow Depth Over Europe. Geophys. Res. Lett. 2018, 45, 312–319. [Google Scholar] [CrossRef] [Green Version]
  4. Musselman, K.N.; Clark, M.P.; Liu, C.; Ikeda, K.; Rasmussen, R. Slower snowmelt in a warmer world. Nat. Clim. Chang. 2017, 7, 214–219. [Google Scholar] [CrossRef]
  5. Kraaijenbrink, P.D.; Stigter, E.E.; Yao, T.; Immerzeel, W.W. Climate change decisive for Asia’s snow meltwater supply. Nat. Clim. Chang. 2021, 11, 591–597. [Google Scholar] [CrossRef]
  6. Diffenbaugh, N.S.; Scherer, M.; Ashfaq, M. Response of snow-dependent hydrologic extremes to continued global warming. Nat. Clim. Chang. 2013, 3, 379–384. [Google Scholar] [CrossRef] [Green Version]
  7. Peng, S.; Piao, S.; Ciais, P.; Fang, J.; Wang, X. Change in winter snow depth and its impacts on vegetation in China. Glob. Chang. Biol. 2010, 16, 3004–3013. [Google Scholar] [CrossRef]
  8. Barnett, T.P.; Adam, J.C.; Lettenmaier, D.P. Potential impacts of a warming climate on water availability in snow-dominated regions. Nature 2005, 438, 303–309. [Google Scholar] [CrossRef]
  9. Clark, M.P.; Hendrikx, J.; Slater, A.G.; Kavetski, D.; Anderson, B.; Cullen, N.J.; Kerr, T.; Örn Hreinsson, E.; Woods, R.A. Representing spatial variability of snow water equivalent in hydrologic and land-surface models: A review. Water Resour. Res. 2011, 47, 1–23. [Google Scholar] [CrossRef] [Green Version]
  10. Musselman, K.N.; Lehner, F.; Ikeda, K.; Clark, M.P.; Prein, A.F.; Liu, C.; Barlage, M.; Rasmussen, R. Projected increases and shifts in rain-on-snow flood risk over western North America. Nat. Clim. Chang. 2018, 8, 808–812. [Google Scholar] [CrossRef]
  11. Biemans, H.; Siderius, C.; Lutz, A.F.; Nepal, S.; Ahmad, B.; Hassan, T.; von Bloh, W.; Wijngaard, R.R.; Wester, P.; Shrestha, A.B.; et al. Importance of snow and glacier meltwater for agriculture on the Indo-Gangetic Plain. Nat. Sustain. 2019, 2, 594–601. [Google Scholar] [CrossRef]
  12. Arheimer, B.; Donnelly, C.; Lindstrom, G. Regulation of snow-fed rivers affects flow regimes more than climate change. Nat. Commun. 2017, 8, 1–9. [Google Scholar] [CrossRef] [Green Version]
  13. Qi, P.; Huang, X.; Xu, Y.J.; Li, F.; Wu, Y.; Chang, Z.; Li, H.; Zhang, W.; Jiang, M.; Zhang, G.; et al. Divergent trends of water bodies and their driving factors in a high-latitude water tower, Changbai Mountain. J. Hydrol. 2021, 603, 127094. [Google Scholar] [CrossRef]
  14. Chi, H.; Sun, G.; Huang, J.; Li, R.; Ren, X.; Ni, W.; Fu, A. Estimation of Forest Aboveground Biomass in Changbai Mountain Region Using ICESat/GLAS and Landsat/TM Data. Remote Sens. 2017, 9, 707. [Google Scholar] [CrossRef] [Green Version]
  15. Wang, L.; Wang, W.J.; Wu, Z.; Du, H.; Zong, S.; Ma, S. Potential Distribution Shifts of Plant Species under Climate Change in Changbai Mountains, China. Forests 2019, 10, 498. [Google Scholar] [CrossRef] [Green Version]
  16. Liu, L.; Dong, Y.; Kong, M.; Zhou, J.; Zhao, H.; Wang, Y.; Zhang, M.; Wang, Z. Towards the comprehensive water quality control in Lake Taihu: Correlating chlorphyll a and water quality parameters with generalized additive model. Sci. Total Environ. 2020, 705, 135993. [Google Scholar] [CrossRef]
  17. Qi, P.; Zhang, G.; Xu, Y.J.; Wu, Y.; Gao, Z. Spatiotemporal changes of reference evapotranspiration in the highest-latitude region of China. Water 2017, 9, 493. [Google Scholar] [CrossRef] [Green Version]
  18. Qi, P.; Xia, Z.; Zhang, G.; Zhang, W.; Chang, Z. Effects of climate change on agricultural water resource carrying capacity in a high-latitude basin. J. Hydrol. 2021, 597, 126328. [Google Scholar] [CrossRef]
  19. Feng, M. Water Conservation Mechanism of Typical Vegetation Types in North Slope of Changbai Mountain; Northwest Normal University: Lanzhou, China, 2021. [Google Scholar]
  20. Li, L.Y.; Ke, C.Q. Analysis of spatiotemporal snow cover variations in Northeast China based on moderate-resolution-imaging spectroradiometer data. J. Appl. Remote Sens. 2014, 8, 1–15. [Google Scholar] [CrossRef]
  21. Zhang, X.; Zang, S.; Sun, L. Spatial-temporal variation characteristics of snow cover days in Northeast China in the past 40 years and their relationship with climatic factors. Adv. Earth Sci. 2018, 33, 958–968. [Google Scholar]
  22. Ding, T.; Gao, H. Relationship between winter snow cover days in Northeast China and rainfall near the Yangtze River basin in the following summer. J. Meteorol. Res. 2015, 29, 400–411. [Google Scholar] [CrossRef]
  23. Han, L.; Tsunekawa, A.; Tsubo, M.; He, C.; Shen, M. Spatial variations in snow cover and seasonally frozen ground over northern China and Mongolia, 1988–2010. Glob. Planet. Chang. 2014, 116, 139–148. [Google Scholar] [CrossRef]
  24. Li, F.P.; Zhang, G.X.; Xu, Y.J. Assessing Climate Change Impacts on Water Resources in the Songhua River Basin. Water 2016, 8, 420. [Google Scholar] [CrossRef] [Green Version]
Figure 1. Study site location. (a) Location of three river basins in Asia: SSR, TR, and YR (b) Indicated are DEM, boundary of three rivers, and meteorological stations.
Water 13 03580 g001
Figure 2. Interdecadal variation of annual mean snow depth (a) 1960′s (b) 1970′s (c) 1980′s (d) 1990′s (e) 2000′s (f) 2010′s.
Water 13 03580 g002aWater 13 03580 g002b
Figure 3. Multi year variation of monthly mean snow depth (a) Nov. (b) Dec. (c) Jan. (d) Feb. (e) Mar. (f) Apr.
Water 13 03580 g003
Figure 4. Interannual variation of snow depth at different altitudes in Changbai Mountain. (The ‘*’ refer to change of snow depth was significant).
Water 13 03580 g004
Figure 5. Annual variation of snow depth at different altitudes in Changbai Mountain. (The gray stripe is to emphasize the change in snowpack during the snowmelt period).
Water 13 03580 g005
Figure 6. Snow cover duration at different altitudes in Changbai Mountain.
Water 13 03580 g006
Figure 7. Interannual evolutionary trends of meteorological factors during the freeze-thaw period at different altitudes in the Changbai Mountain (a) Wind (b) Snowfall (c) ET0 (d) Sunlight hours (e) Relative humidity (f) Mean temperature.
Water 13 03580 g007aWater 13 03580 g007b
Table 1. The detail information of meteorological stations.
IDCodeAltitude (m)IDCodeAltitude (m)IDCodeAltitude (m)
1545904.22154483233.64154263351.2
25449713.82254161236.84254267362.3
35429136.52354290241.14354187366.6
45449472.62454195244.84454374379.7
550954127.52554365245.54554362380.1
650949136.22654164248.14654192384.6
750946139.82754260252.94754363402.9
854293142.82854292257.34854286475.6
950948146.32954349258.94954371520.6
1054065169.13054493260.15054186524.9
1154064170.23154273263.35154276570
1254069173.63254098267.95254285721.4
1354049188.93354076268.15354284774.2
1454072196.53454169271.65454386775
1554063196.83554172290.3
1654156200.43654181295
1754165219.53754274306.7
18542592243854353328.4
1954377225.13954266340.5
2054171229.54054261345.3
Table 2. The drivers of snow depth variability at −8~200 m in Changbai Mountain.
DurationFactorsEdfFPRDeviance Explained
Nov.W1.001.000.320.002.03%
SF8.587.160.000.5757.50%***
ET01.0051.79<2e-16−0.4751.50%***
SH1.0028.940.00−0.3235.10%***
RH1.0034.340.000.3540.60%***
Tm1.695.310.01−0.1724.80%**
Dec.W1.0011.920.00−0.1519.50%***
SF3.507.630.000.4137.10%***
ET01.0082.74<2e-16−0.6264.90%***
SH1.0025.610.00−0.3233.20%***
RH2.8613.990.000.4457.80%***
Tm1.0017.840.00−0.2423.90%***
Jan.W1.0016.080.00−0.1924.70%***
SF1.006.690.010.0812.40%*
ET01.3643.03<2e-16−0.6060.50%***
SH2.408.580.000.3734.80%***
RH1.1917.930.000.2538.00%***
Tm1.0019.770.00−0.2426.20%***
Feb.W5.343.400.01−0.2332.90%**
SF1.000.250.62−0.010.54%
ET01.6223.05<2e-16−0.4550.80%***
SH5.380.750.60−0.0314.70%
RH4.428.310.000.4055.40%***
Tm1.058.470.00−0.1316.80%**
Mar.W4.640.760.61−0.0214.50%
SF1.1672.810.110.047.48%
ET01.1933.83<2e-16−0.4653.70%***
SH5.862.170.05−0.1431.80%.
RH1.0040.39<2e-160.3646.90%***
Tm4.392.950.02−0.1930.40%*
Apr.W3.390.960.46−0.02611.40%
SF4.192.330.050.1328.40%.
ET04.4264.360.00−0.2846.90%**
SH7.761.470.20−0.1030.60%
RH4.447.470.000.4152.70%***
Tm1.698.470.00−0.2339.00%***
Note: ‘***’ refer to p = 0, ‘**’ refer to p < 0.001, ‘*’ refer to p < 0.01, ‘.’ refer to p < 0.05, spaces refer to no significance, ‘Edf’ refer to estimated degrees of freedom.
Table 3. The drivers of snowpack variability at 200~400 m in Changbai Mountain.
DurationFactorsEdfFPRDeviance Explained
Nov.W1.720.560.560.004.27%
SF2.801.200.360.059.74%***
ET01.0040.11<2e-16−0.4546.80%***
SH2.427.300.00−0.2732.60%***
RH1.0050.65<2e-160.5147.60%***
Tm1.373.150.04−0.0813.80%**
Dec.W1.007.080.01−0.0912.20%***
SF1.001.640.210.012.71%***
ET03.4213.91<2e-16−0.5058.30%***
SH1.007.540.01−0.1012.60%***
RH1.7414.660.000.3745.50%***
Tm1.009.720.00−0.1414.80%***
Jan.W1.0010.240.00−0.1416.30%***
SF1.004.160.050.057.08%*
ET01.0029.640.00−0.3538.30%***
SH1.0414.240.00−0.2120.80%***
RH1.0017.360.000.2126.50%***
Tm1.0014.230.00−0.1820.30%***
Feb.W4.870.850.58−0.0512.20%**
SF3.052.900.030.1719.00%
ET01.0034.270.00−0.4142.50%***
SH1.000.610.44−0.011.12%
RH1.9911.310.000.3341.80%***
Tm1.0013.840.00−0.2121.50%**
Mar.W1.000.490.49−0.011.11%
SF2.164.540.010.1921.00%
ET01.0036.600.00−0.3845.90%***
SH7.572.690.01−0.2934.90%.
RH2.706.810.000.2539.60%***
Tm4.793.560.01−0.2733.60%*
Apr.W1.000.170.69−0.020.33%
SF1.610.800.480.014.06%.
ET02.529.580.00−0.3642.90%**
SH1.003.630.06−0.057.04%
RH4.587.930.000.4752.10%***
Tm1.7210.640.00−0.3037.70%***
Note: ‘***’ refer to p = 0, ‘**’ refer to p < 0.001, ‘*’ refer to p < 0.01, ‘.’ refer to p < 0.05, spaces refer to no significance, ‘Edf’ refer to estimated degrees of freedom.
Table 4. The drivers of snowpack variability at 400~600 m in Changbai Mountain.
DurationFactorsEdfFPRDeviance Explained
Nov.W1.001.260.270.002.51%
SF1.001.740.190.023.19%
ET01.0034.830.00−0.3840.80%***
SH2.574.610.01−0.2124.90%**
RH1.0035.73<2e-160.3939.90%***
Tm1.285.300.01−0.1216.80%*
Dec.W1.009.260.00−0.1314.60%**
SF1.000.000.96−0.020.01%
ET01.0021.270.00−0.2429.70%***
SH1.002.970.09−0.035.16%.
RH1.0017.530.000.2426.40%***
Tm1.001.750.19−0.013.27%
Jan.W1.0015.440.00−0.2022.40%***
SF3.232.060.100.1116.20%.
ET01.0016.270.00−0.2125.10%***
SH1.005.920.02−0.089.80%*
RH1.006.510.010.0911.40%*
Tm1.662.350.11−0.069.86%
Feb.W5.592.090.08−0.1325.60%.
SF1.000.560.46−0.011.12%
ET05.034.050.00−0.2940.20%**
SH2.341.000.39−0.037.48%
RH2.954.240.010.2328.00%**
Tm1.007.620.01−0.1214.00%**
Mar.W2.530.650.55−0.016.93%
SF1.771.230.320.036.68%
ET01.0011.520.00−0.1421.70%**
SH7.642.650.02−0.2832.20%*
RH2.083.010.050.0920.30%*
Tm7.862.420.03−0.2237.90%*
Apr.W1.650.930.38−0.025.15%
SF1.002.690.110.034.86%
ET01.0027.870.00−0.3133.30%***
SH1.192.750.07−0.078.11%.
RH5.776.760.000.4349.60%***
Tm1.9516.600.00−0.4046.90%***
Note: ‘***’ refer to p = 0, ‘**’ refer to p < 0.001, ‘*’ refer to p < 0.01, ‘.’ refer to p < 0.05, spaces refer to no significance, ‘Edf’ refer to estimated degrees of freedom.
Table 5. The drivers of snowpack variability at 600~2738 m in Changbai Mountain.
DurationFactorsEdfFPRDeviance Explained
Nov.W1.001.290.26−0.012.40%
SF1.000.230.64−0.010.41%
ET01.0028.890.00−0.3737.00%***
SH1.0014.460.00−0.2022.00%***
RH1.0024.020.000.3131.50%***
Tm1.009.400.00−0.1315.10%**
Dec.W1.003.590.06−0.056.08%.
SF1.660.890.410.014.76%
ET02.002.000.13−0.0711.20%
SH1.034.630.04−0.068.03%*
RH1.006.910.010.1011.70%*
Tm1.000.390.54−0.010.68%
Jan.W1.004.610.04−0.067.87%*
SF1.001.640.210.012.85%
ET01.980.280.70−0.004.05%
SH1.001.460.23−0.012.63%
RH2.920.590.760.005.77%
Tm2.880.810.46−0.038.31%*
Feb.W1.001.230.27−0.002.21%
SF1.000.050.82−0.020.09%
ET01.000.840.36−0.001.54%
SH1.004.510.04−0.067.77%*
RH2.270.810.410.027.21%
Tm1.000.070.80−0.020.12%
Mar.W1.000.580.45−0.011.05%
SF1.002.640.110.034.85%
ET01.0010.580.00−0.1817.20%**
SH1.000.000.96−0.020.01%
RH1.003.500.070.056.33%
Tm4.523.070.02−0.2026.10%*
Apr.W3.141.340.26−0.0713.70%
SF6.413.260.010.3236.00%**
ET01.0046.51<2e−16−0.4650.60%***
SH1.905.270.01−0.2321.90%**
RH1.0018.660.000.2831.40%***
Tm1.0076.32<2e-16−0.6261.40%***
Note: ‘***’ refer to p = 0, ‘**’ refer to p < 0.001, ‘*’ refer to p < 0.01, ‘.’ refer to p < 0.05, spaces refer to no significance, ‘Edf’ refer to estimated degrees of freedom.
Publisher’s Note: MDPI stays neutral with regard to jurisdictional claims in published maps and institutional affiliations.

