Sediment Budgets for Small Salinized Agricultural Catchments in Southwest Australia and Implications for Phosphorus Transport
Abstract
1. Introduction
2. Materials and Methods
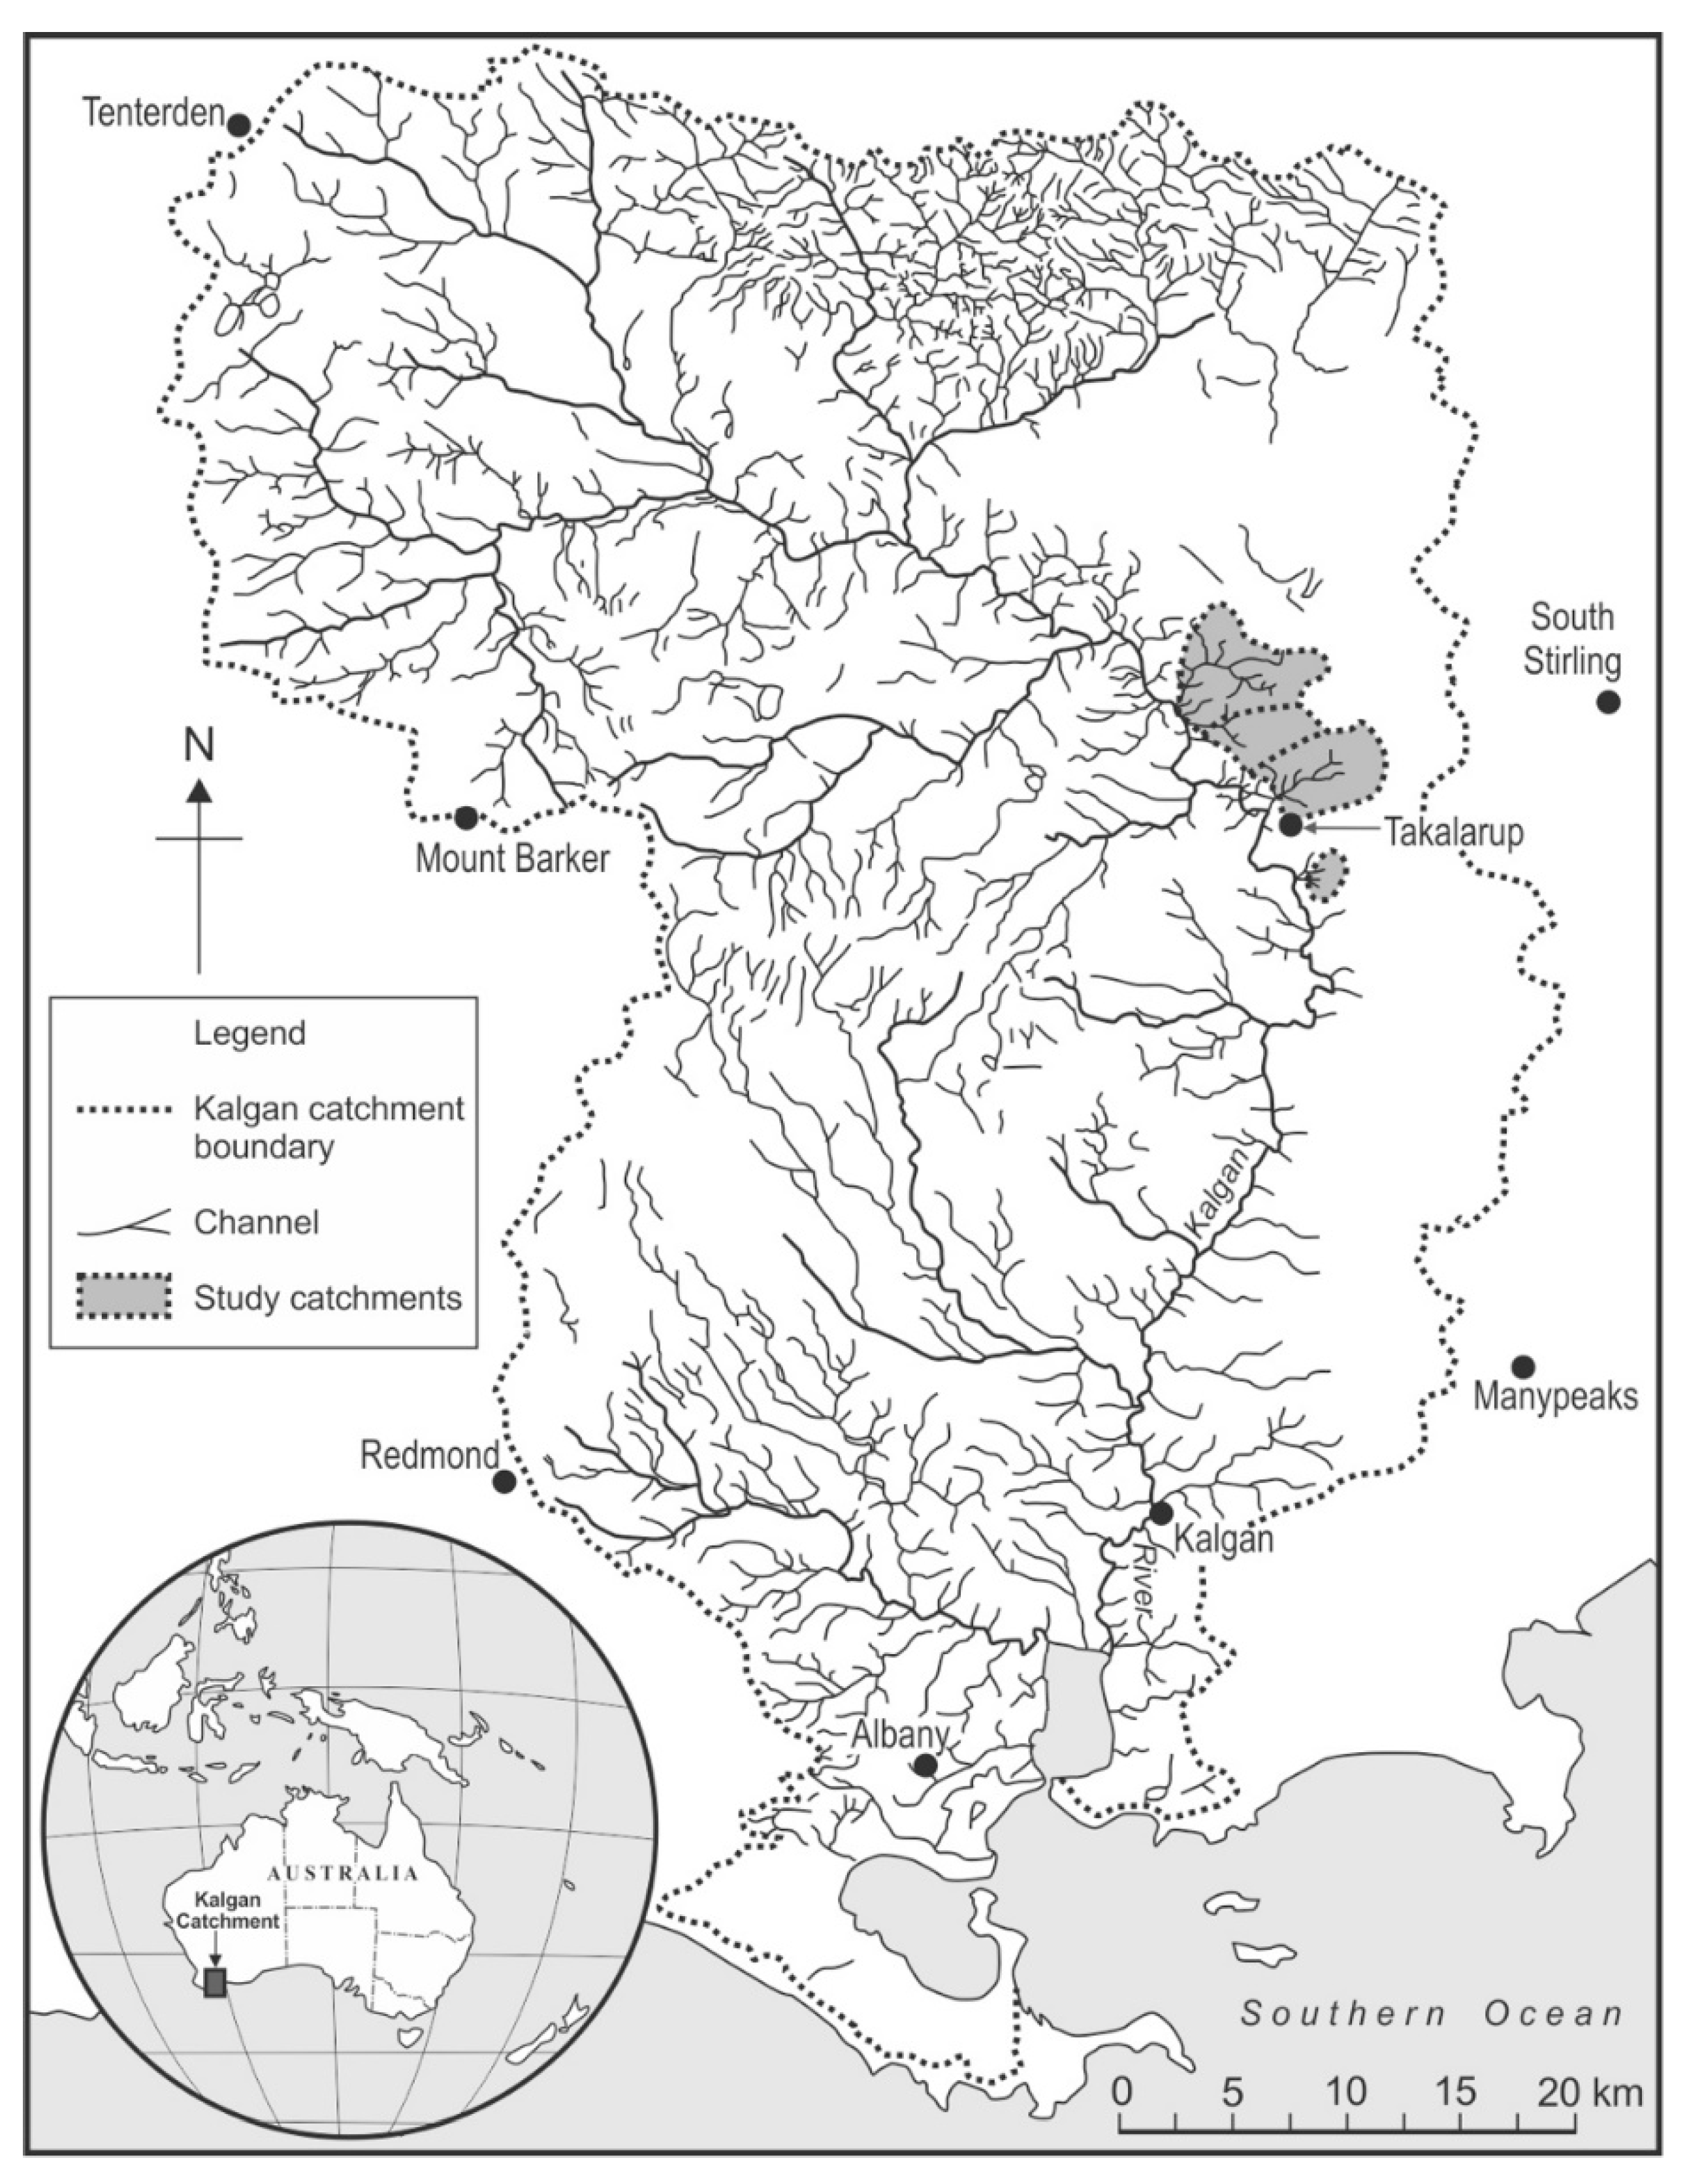
2.1. The Kalgan Catchment Environment
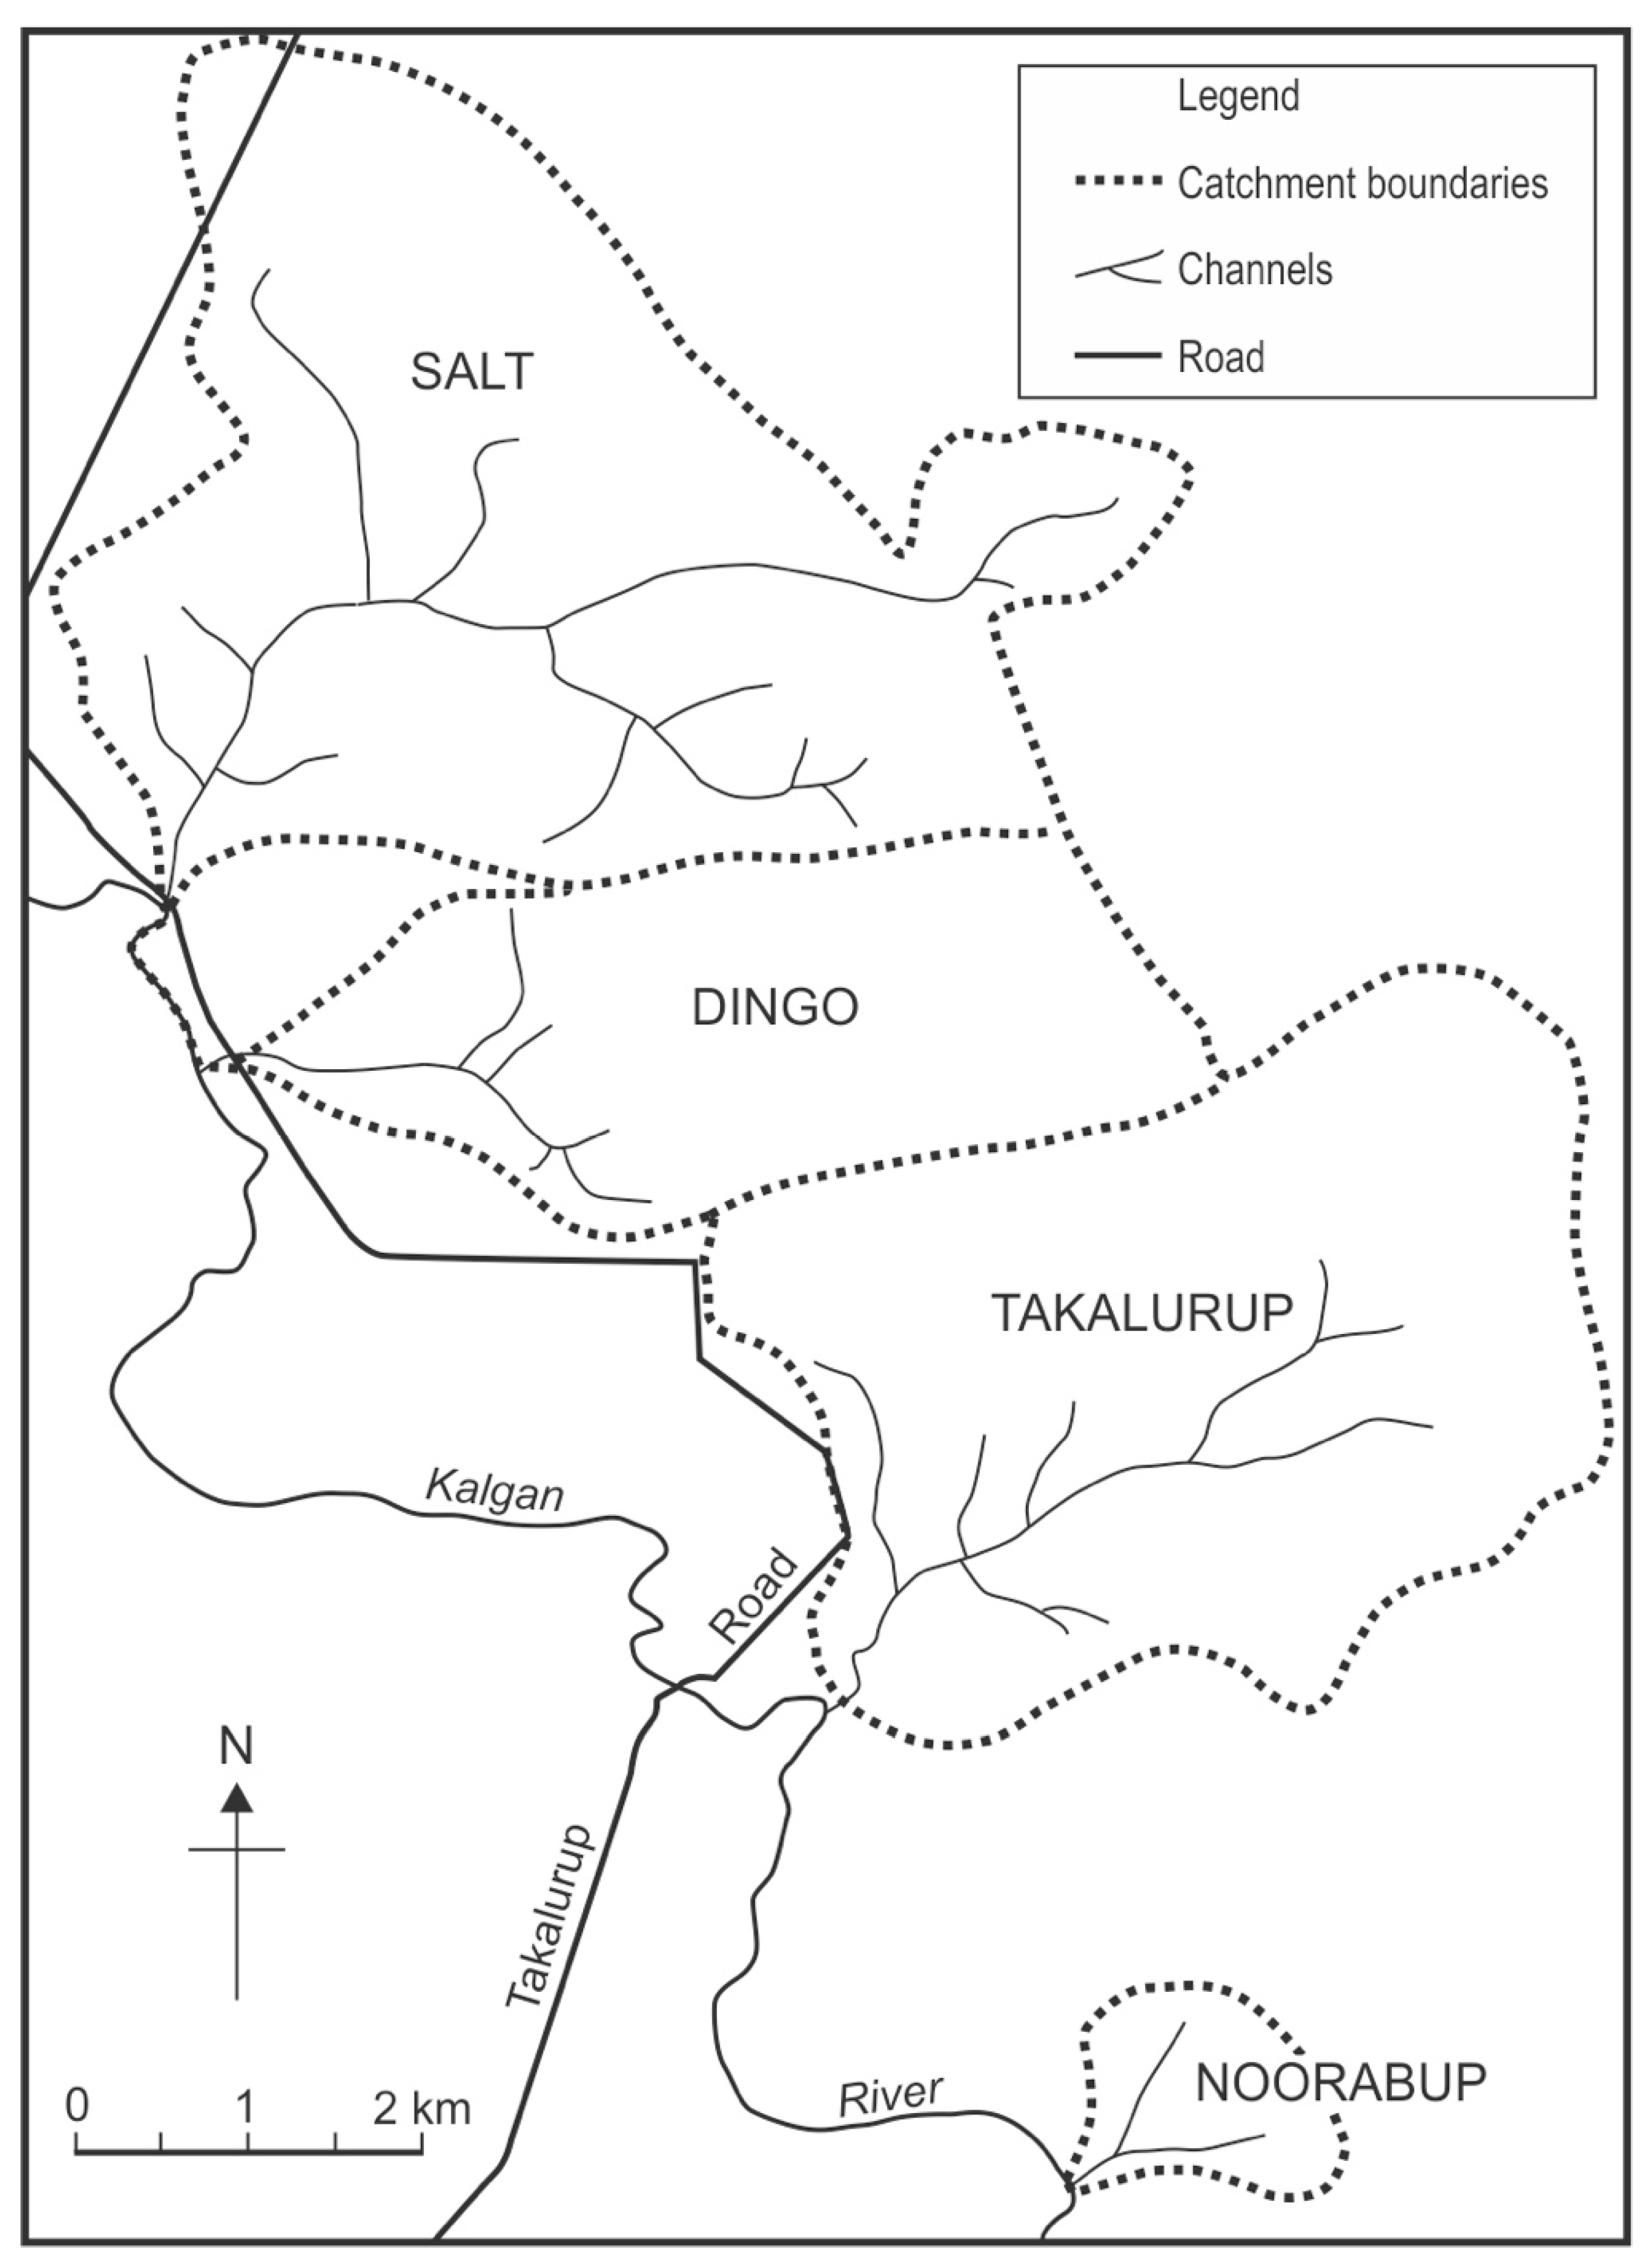
2.2. The study Subcatchments
2.3. Takalarup Creek Catchment—Land Use, Erosion, and Salinization History
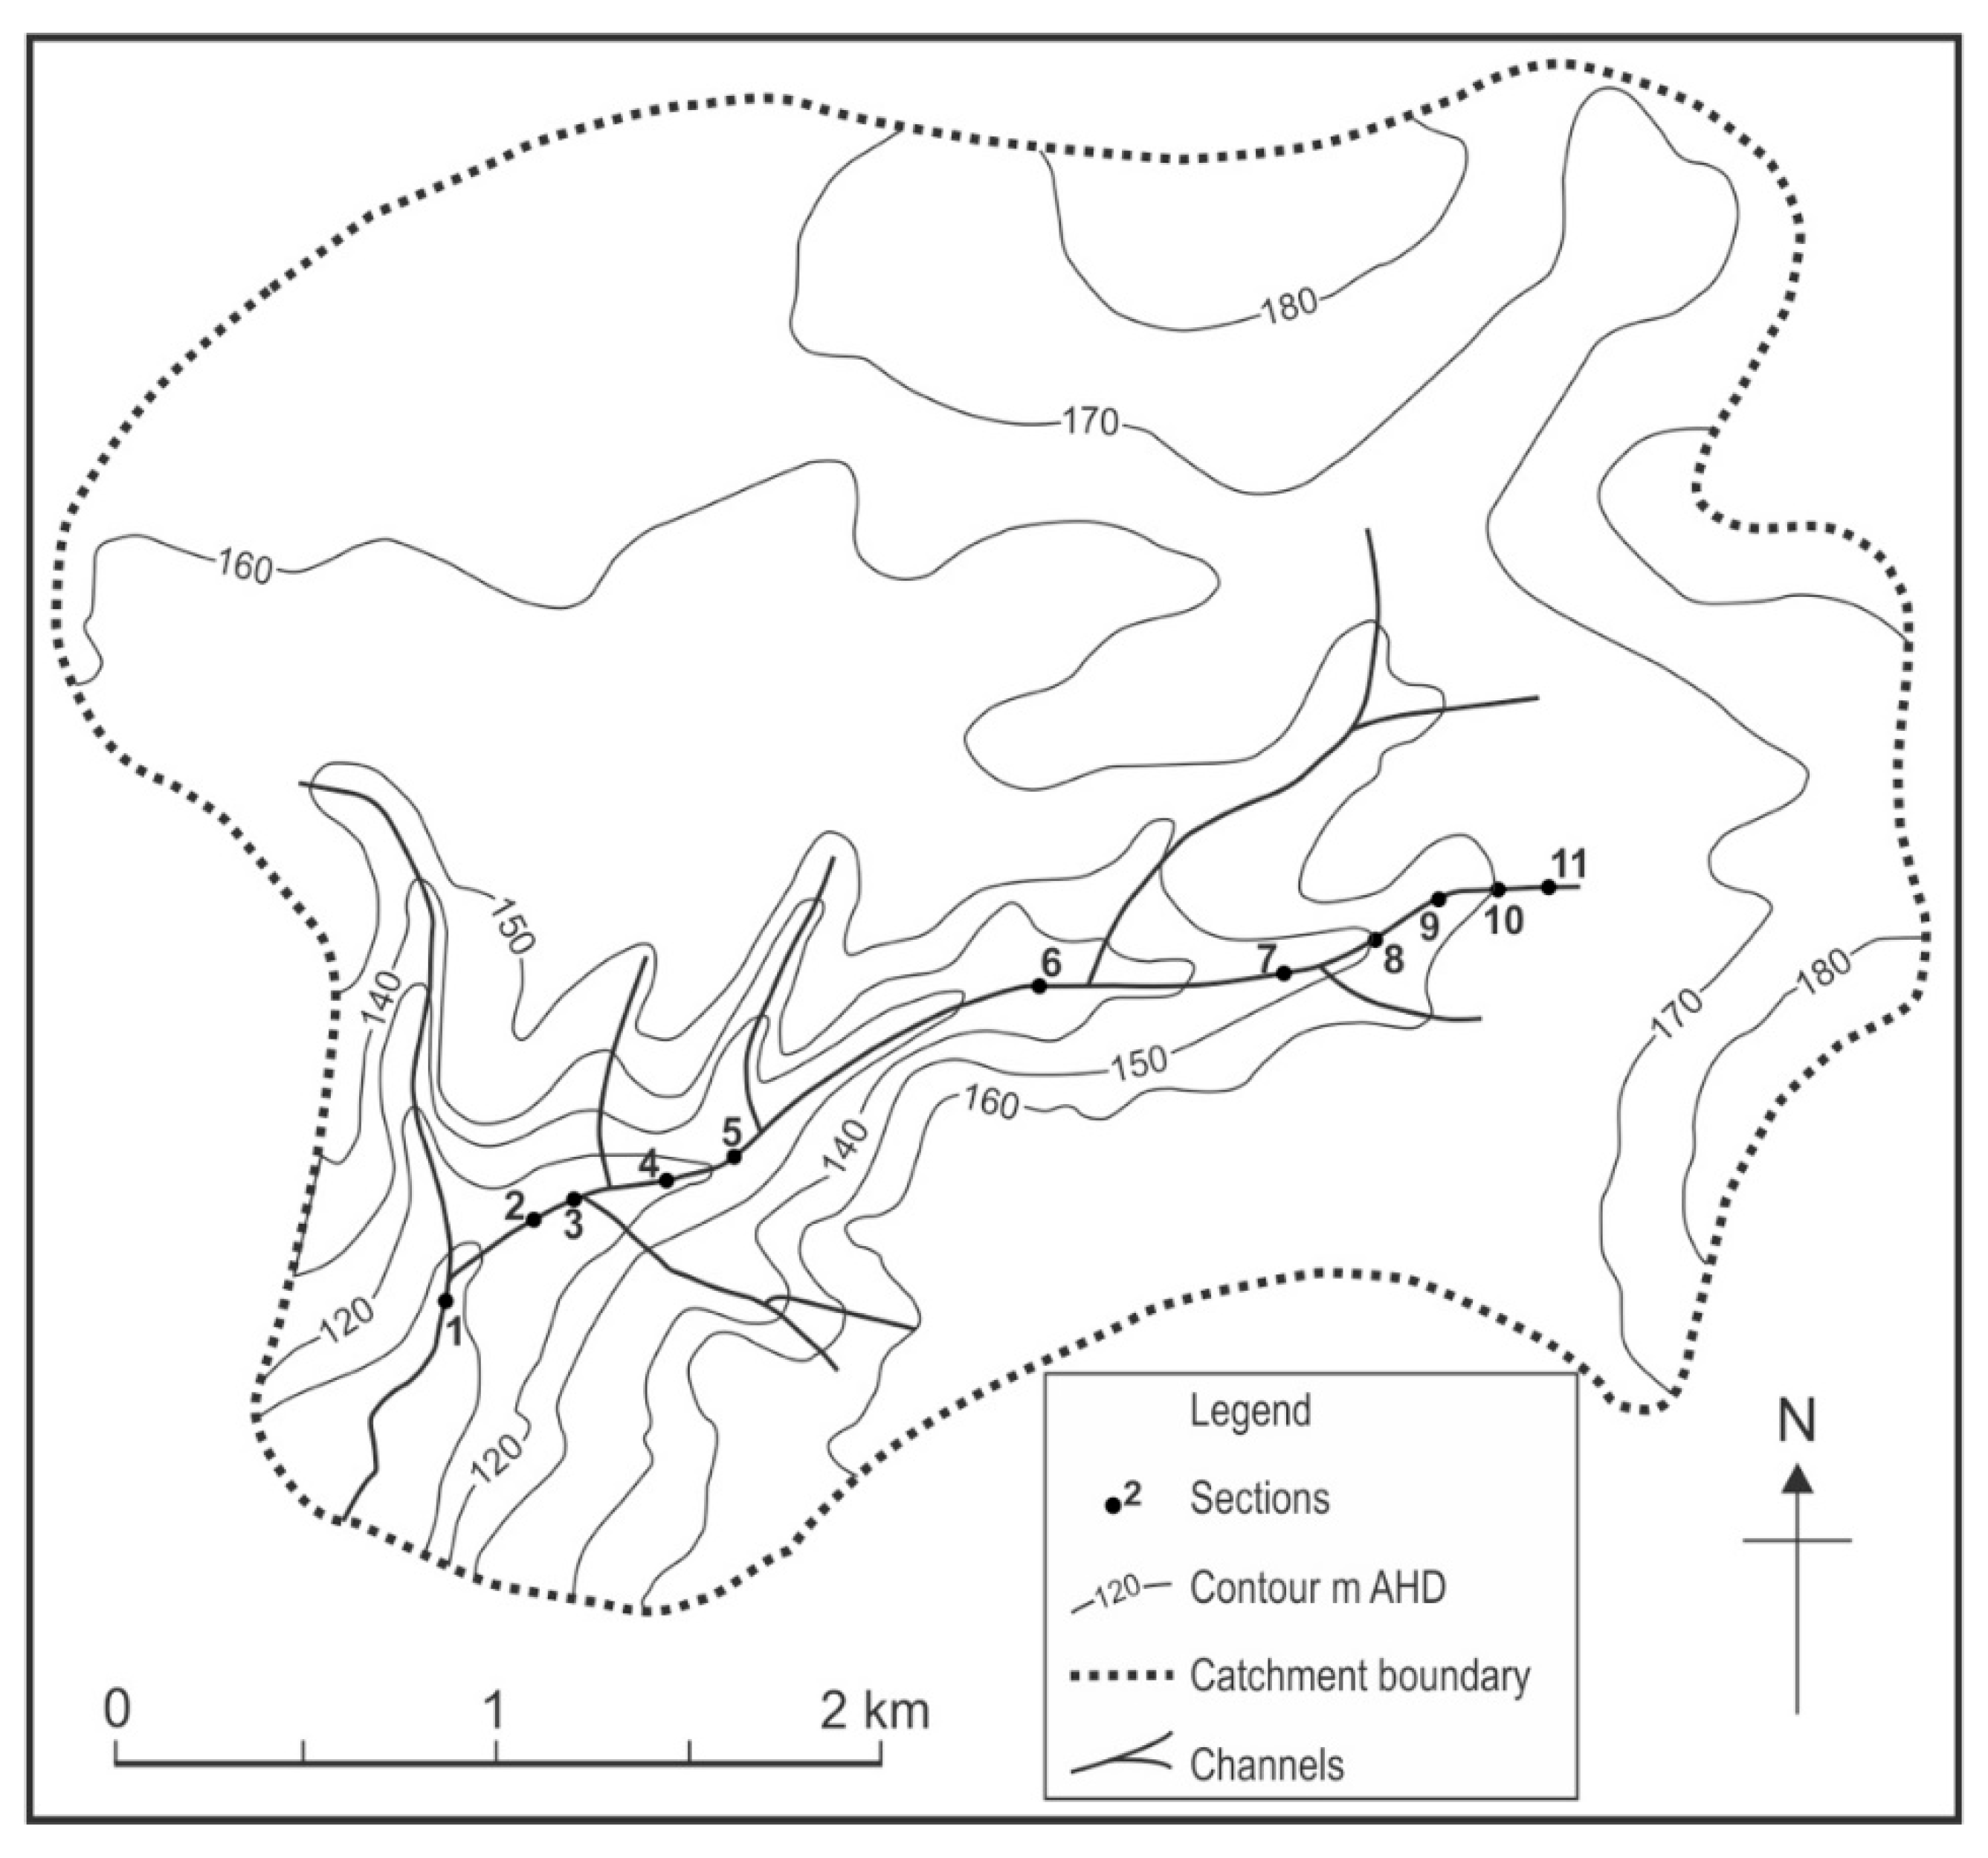
2.4. Takalarup Creek Catchment—Sediment Budget
2.5. Dingo and Salt Creek—Sediment Budgets
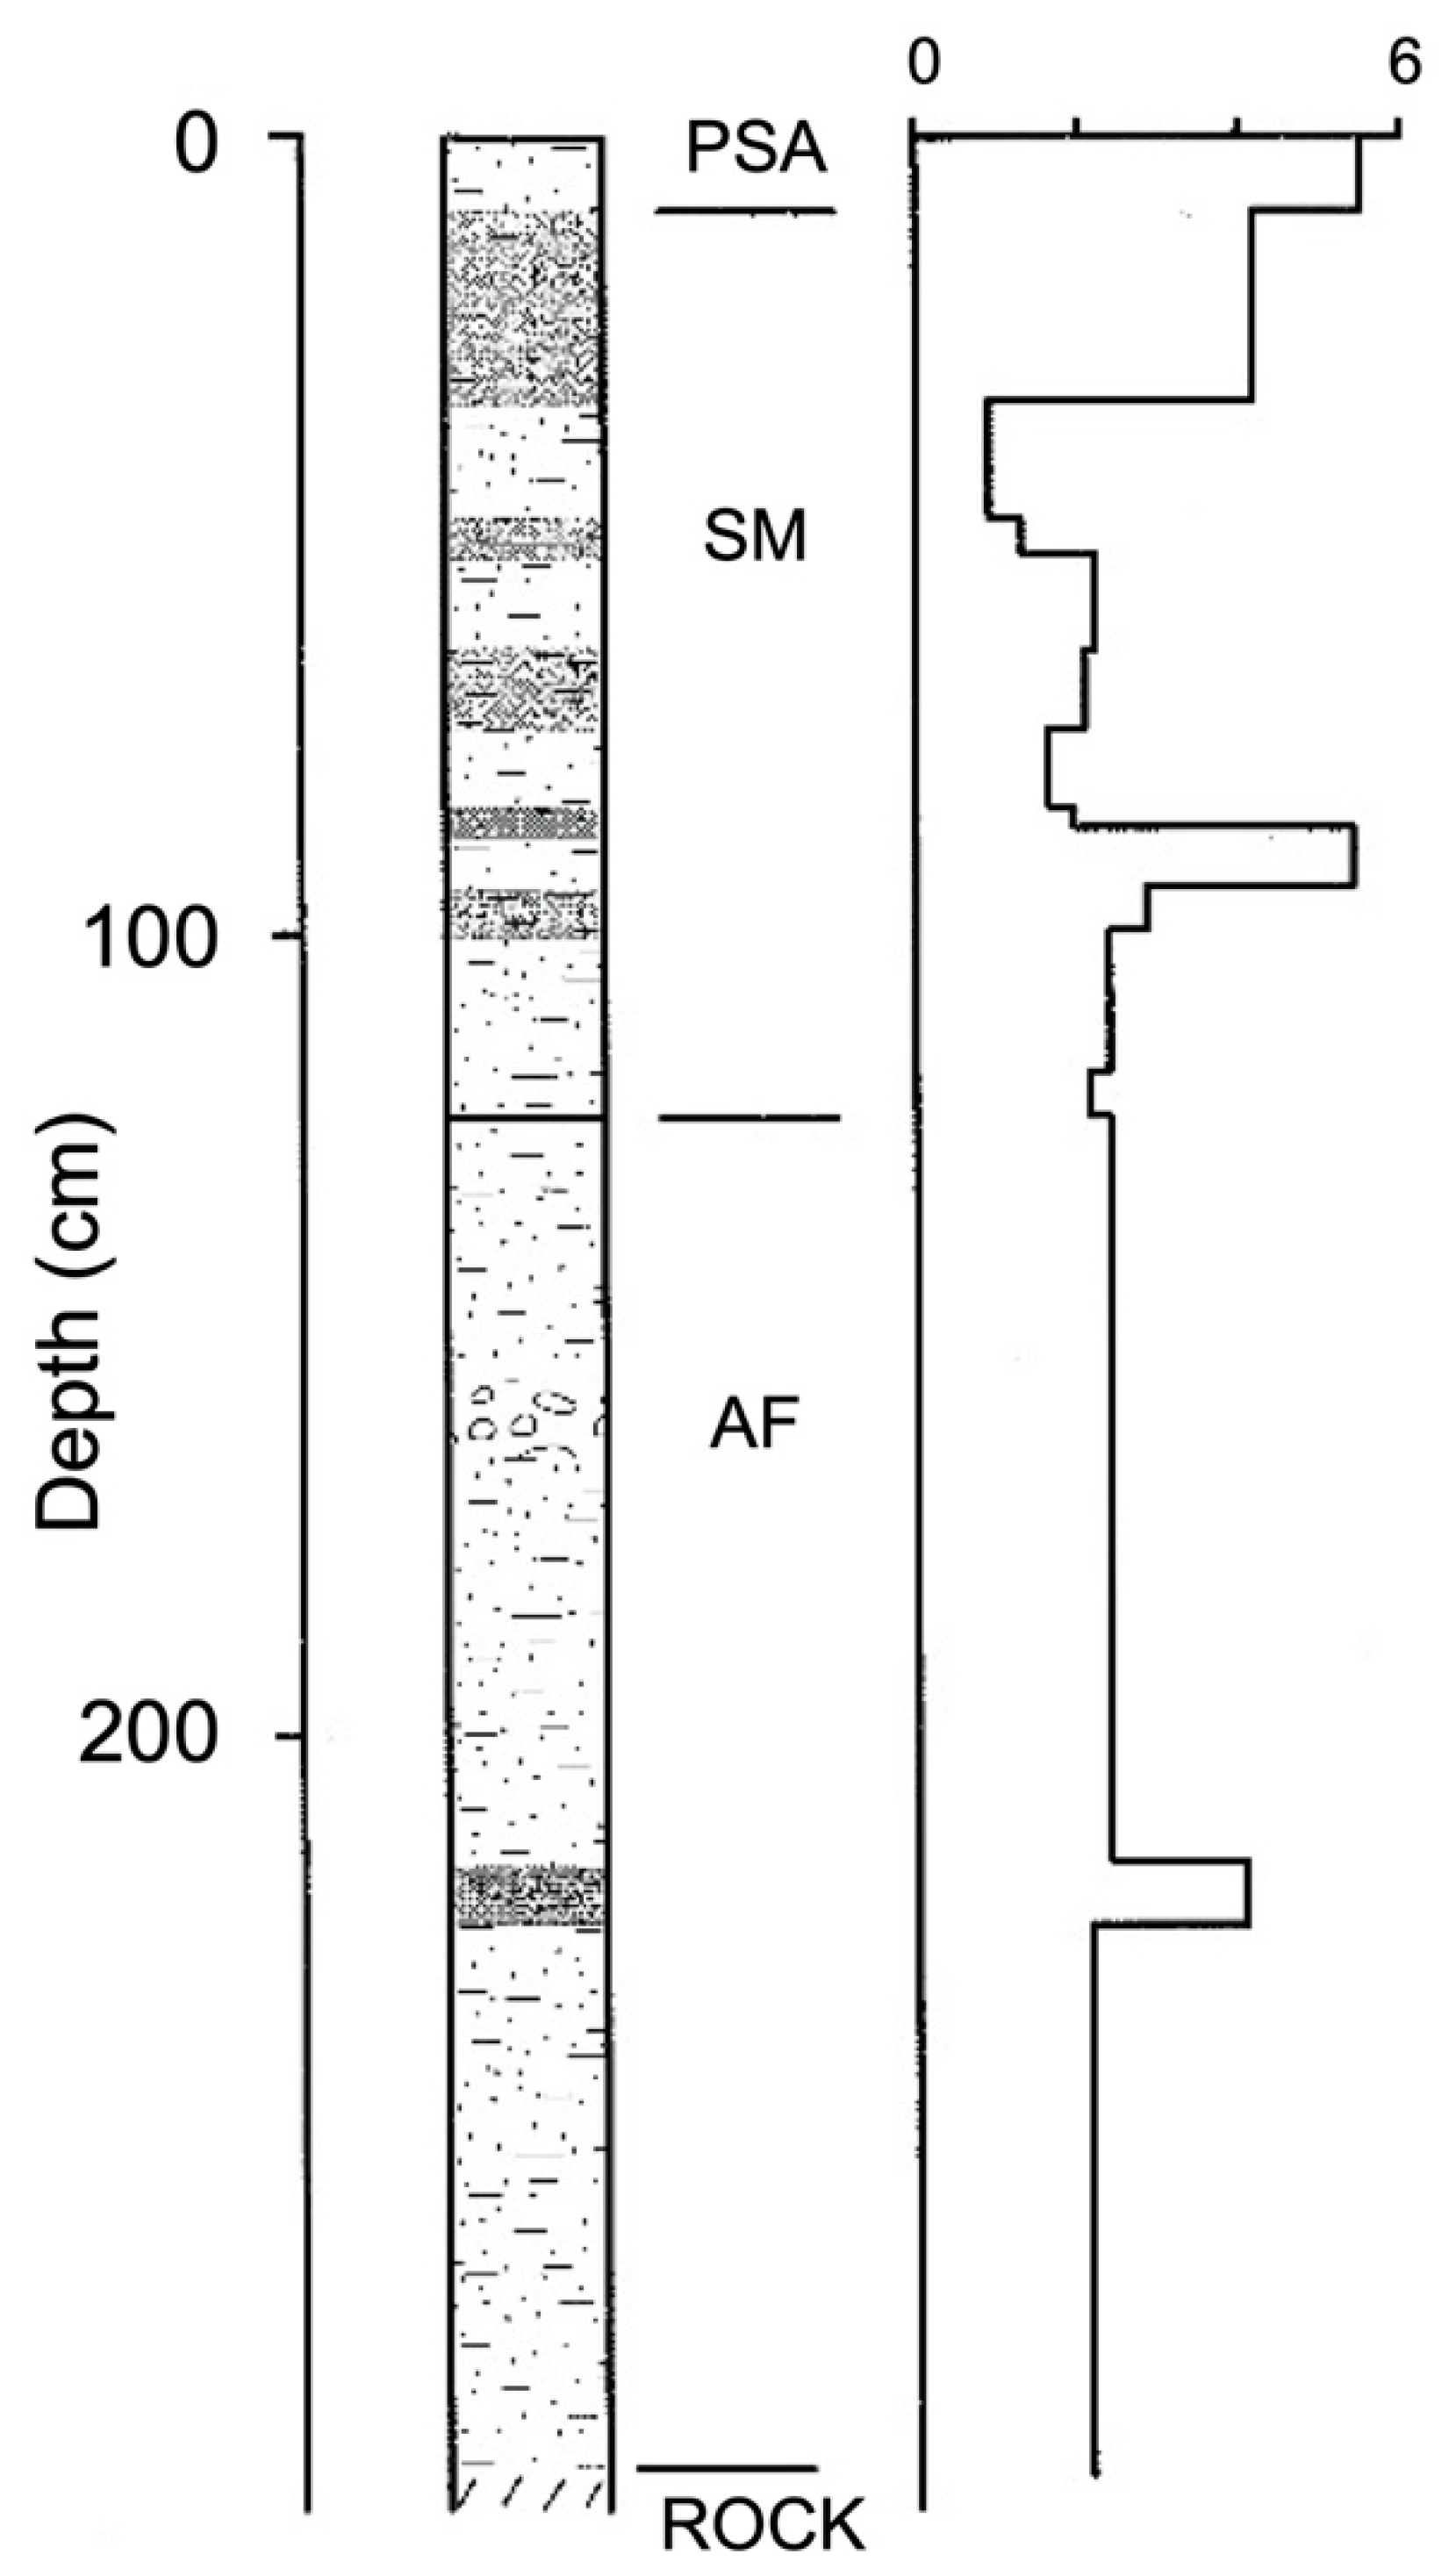
2.6. Takalarup Catchment Phosphorus Loss
3. Results
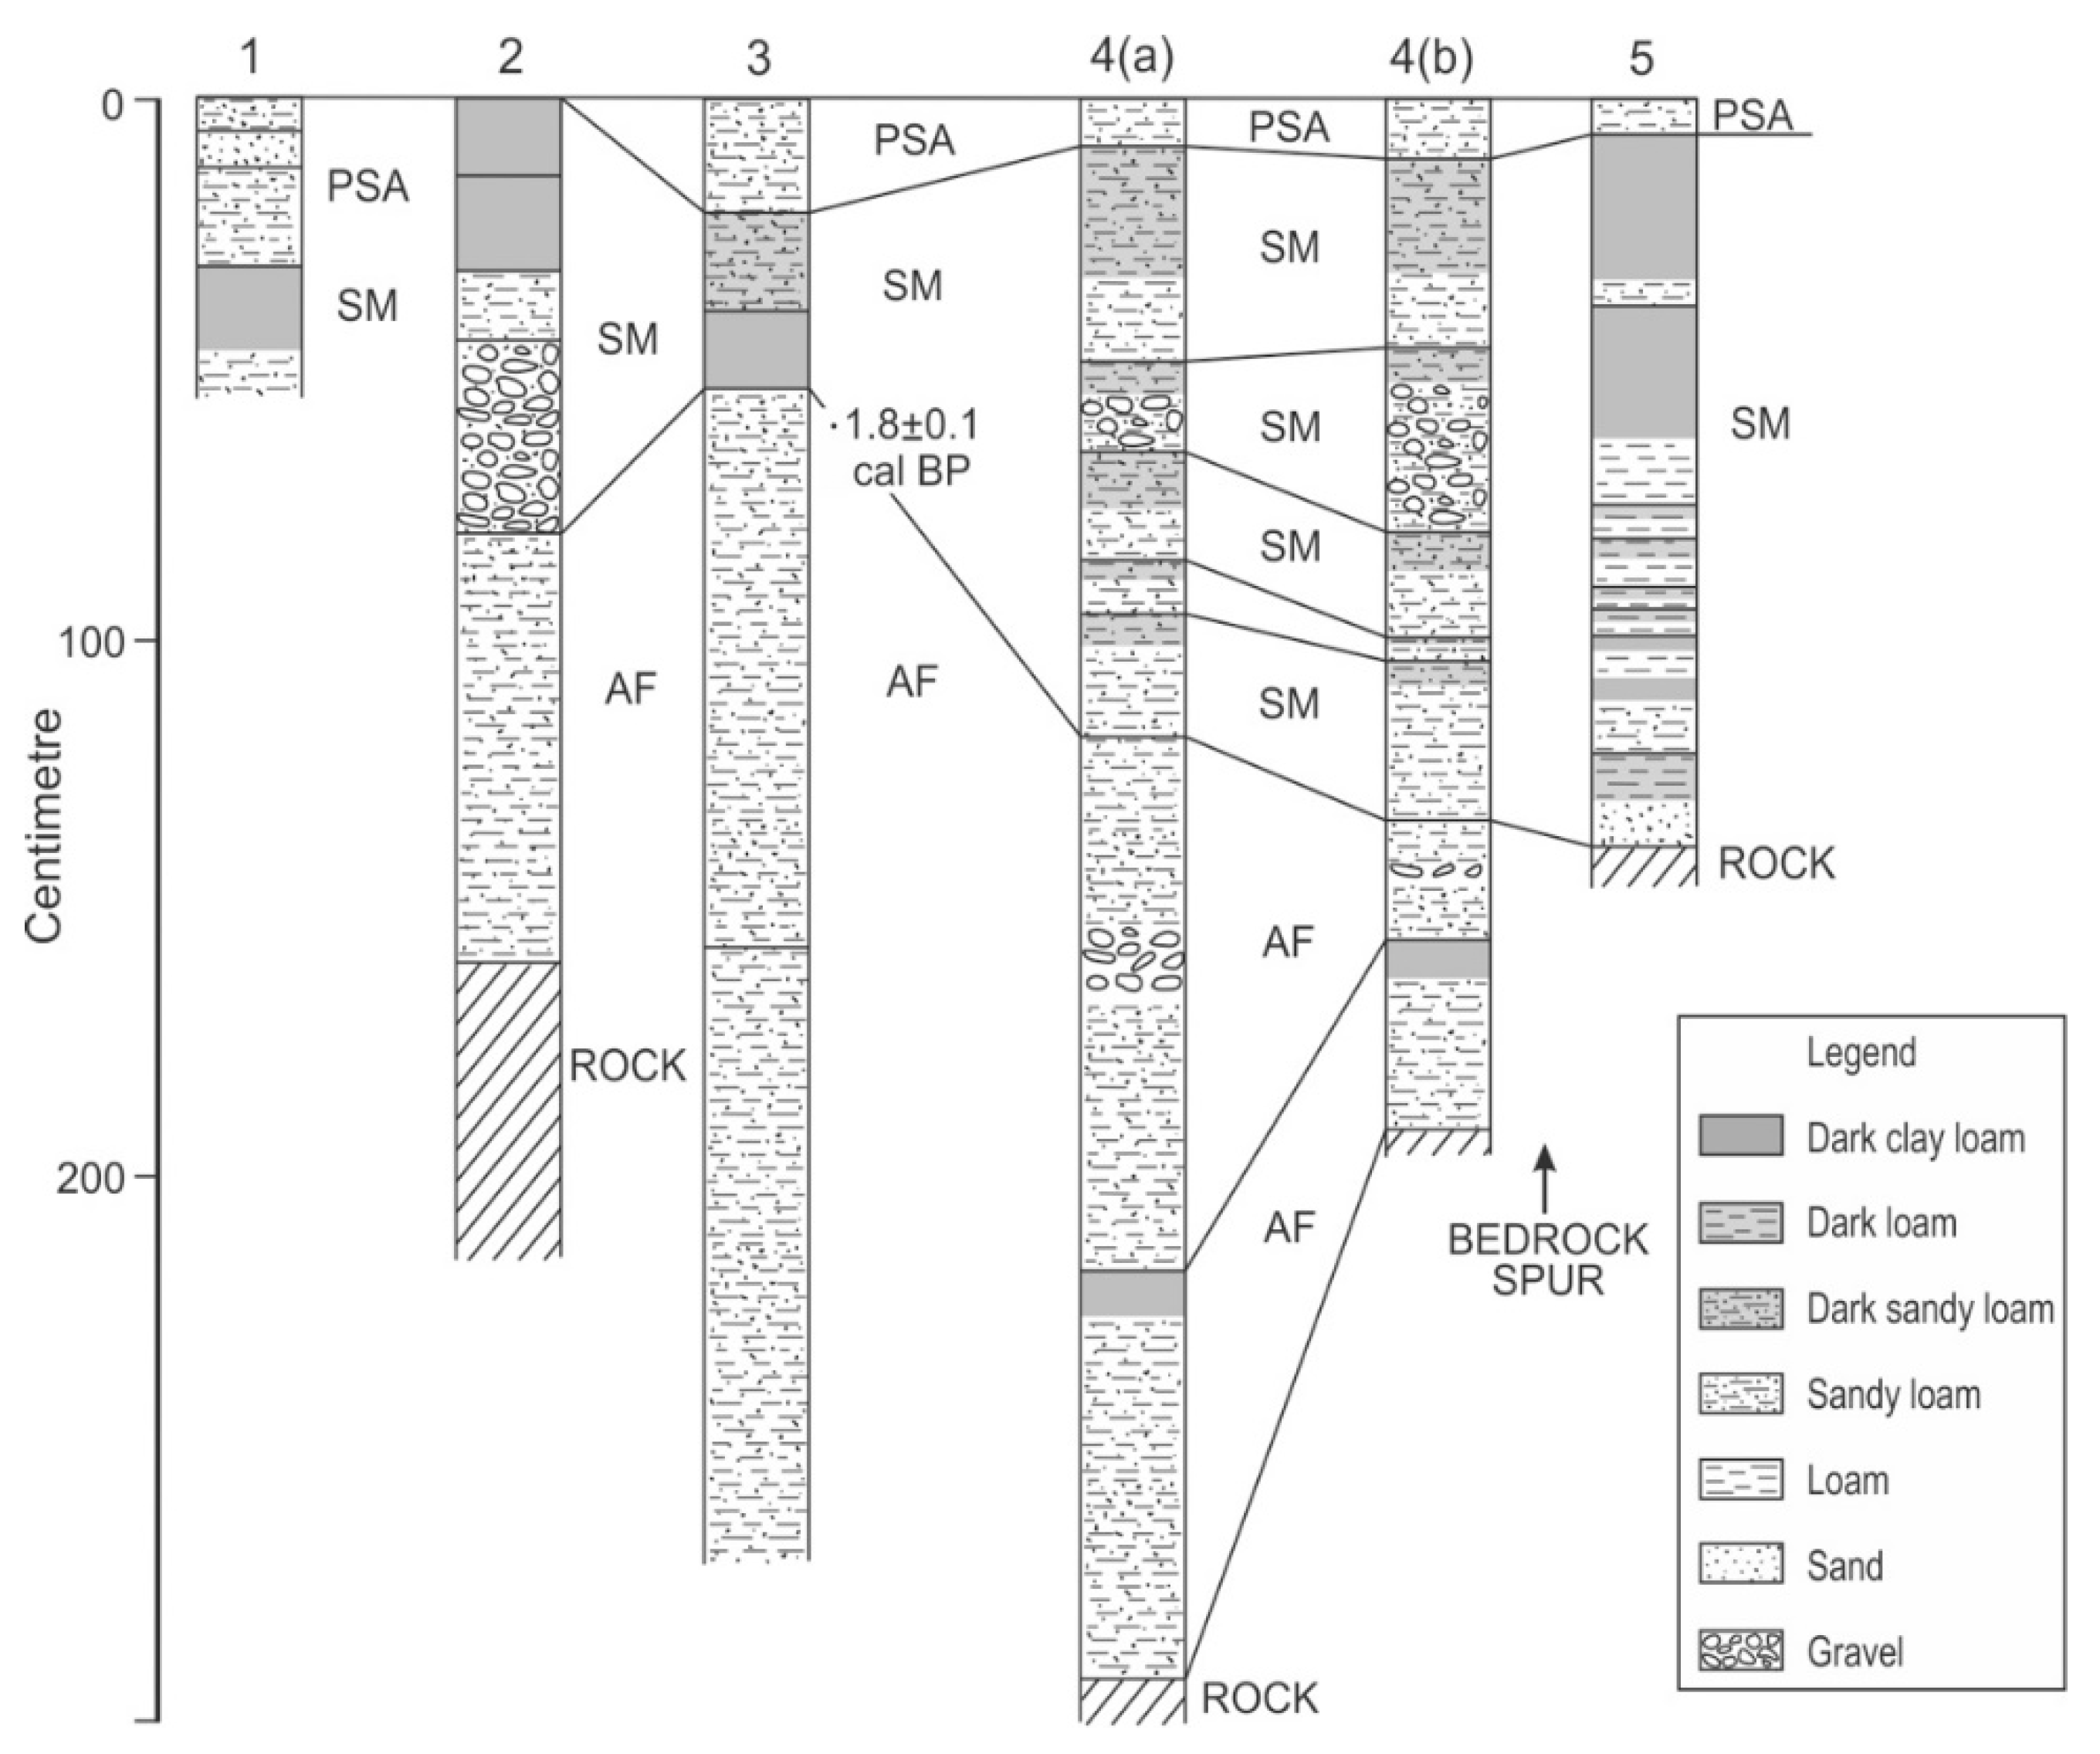
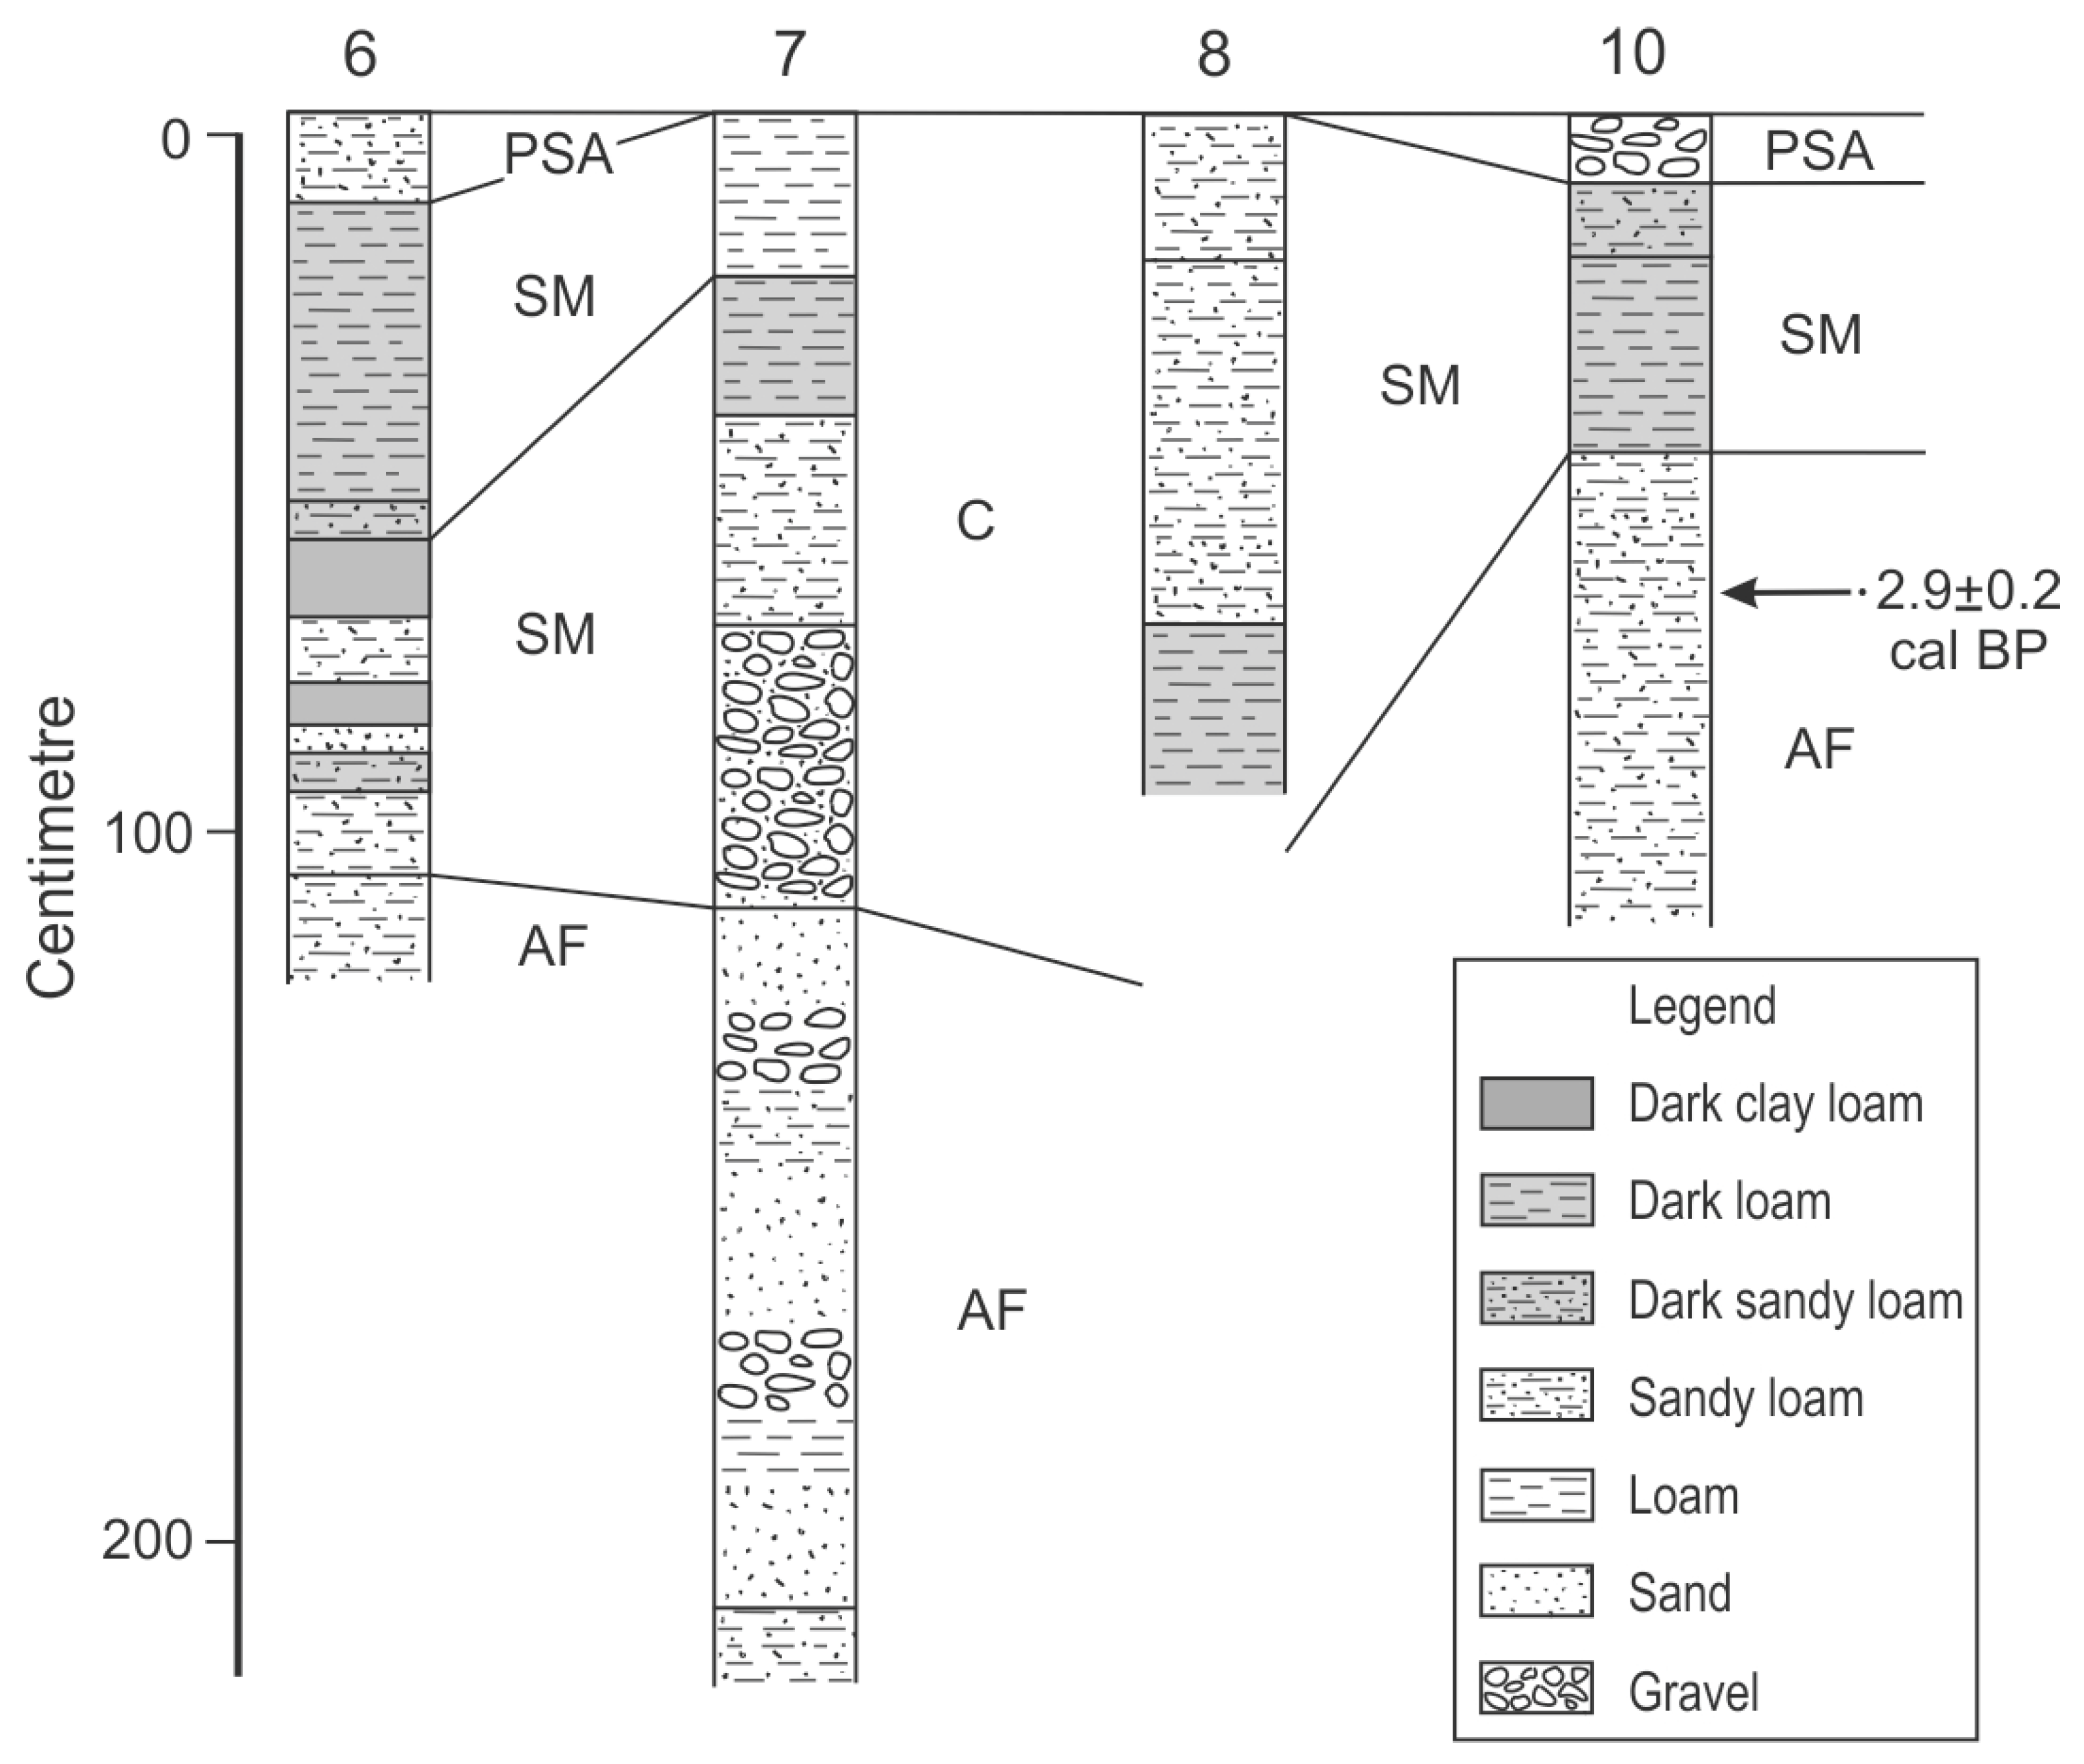
3.1. Takalarup Creek Catchment—Land Use, Erosion, and Salinization History
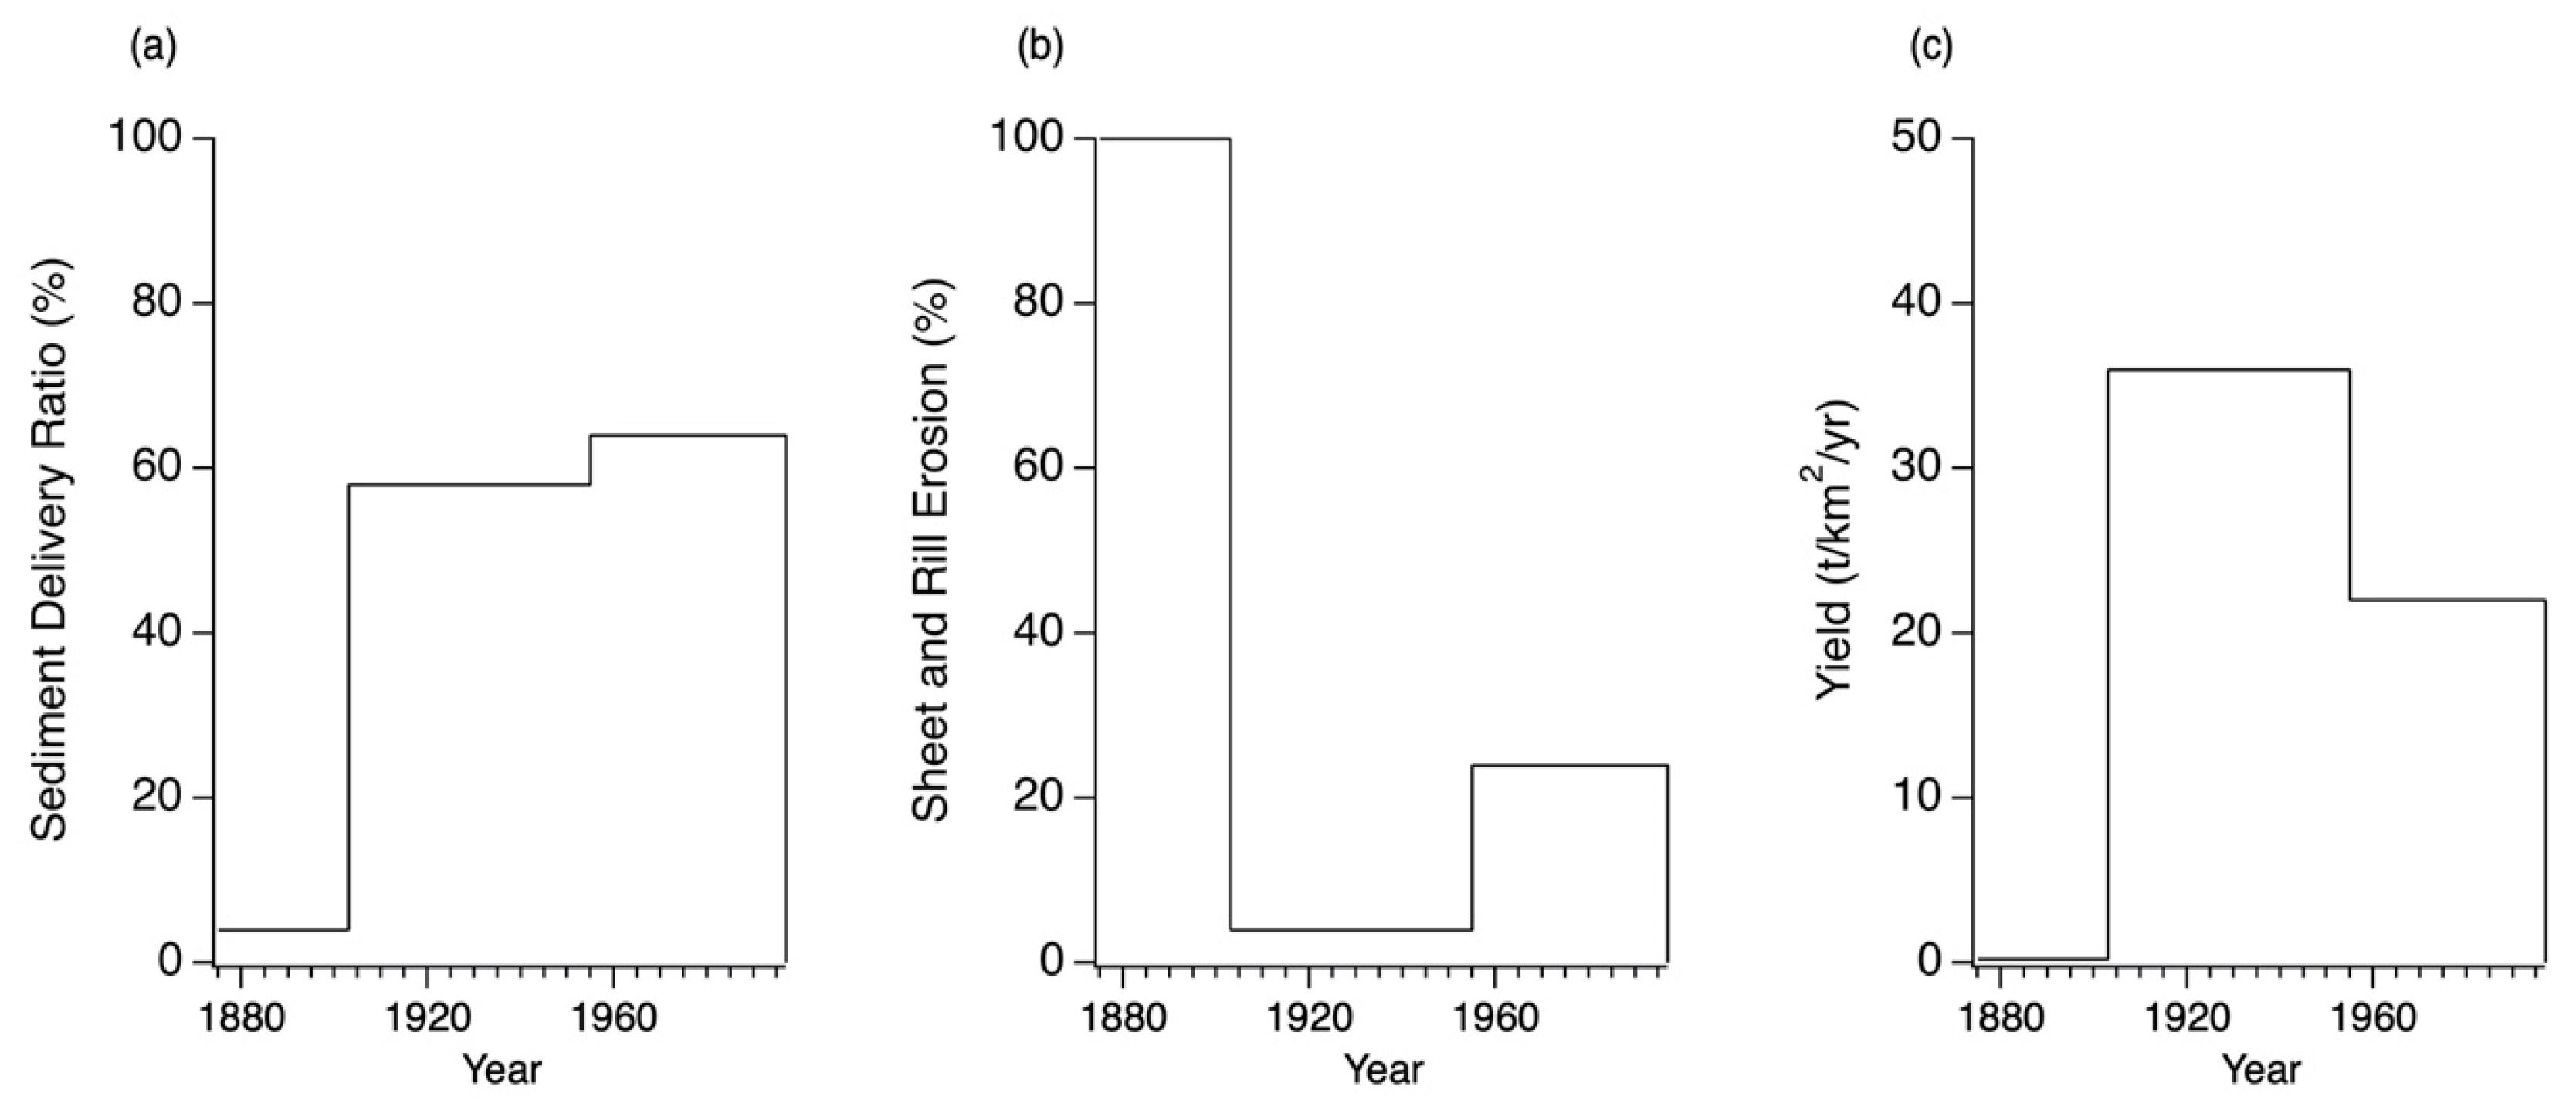
3.2. Takalarup Catchment Sediment Budget
3.3. Takalarup Catchment Phosphorus Loss
3.4. Dingo Creek Catchment Sediment Budget
3.5. Salt Creek Catchment Sediment Budget
4. Discussion
5. Conclusions
- The three small agricultural catchments studied lie between the two end-member sediment budget types identified by [9] but mostly are of Type B where gully and channel erosion dominate.
- The channel and gully erosion proportion of the total erosion appears to be controlled by the depth of alluvial fill and therefore the depth of incision. The incision volume is not a function of drainage density or gradient because the depth (and volume) of incision post-clearing varies between catchments as a result of topographic variation that enabled the thickest Holocene valley fill to accumulate in the Takalarup catchment.
- While this explanation of the proportion of channel and gully erosion is plausible, it is based on little data. Further data collection from other catchments is essential.
- Clearing of only ~9% of the Takalarup catchment along the lower reaches of the main valley and channel after 1903 allowed a storm in 1939 to incise valley fills almost all to bedrock. The time lag between first clearing and incision was 29 years at Takalarup. At Moorialup Creek it was ~23 years. West of Redmond it was 10 years, and at Noorabup only a few years. The smallest lag was at Noorabup, suggesting that decay of organic matter and roots, and destruction of soil structure, can occur within a few years. Any sizeable runoff event thereafter can produce incision.
- Sediment yield and SDR at Takalarup have varied little since 1903 despite major changes of clearing, sheet and rill erosion rates, and storage of sediment. Yield and SDR, in this case, are insensitive to changes of vegetation cover within the catchments, like the case of Coon Creek in the U.S.A., because of adjustments to storage. This adds weight to the argument that sediment yield is sometimes a poor indicator of the state of a catchment, and of the effect of land use.
- Dryland salinization following land clearing has both increased total erosion and connected some hillslopes to channels by scalding. This process increases the SDR of the hillslope to channel a sediment transport system.
- The idea that particulate P yield of Takalarup Creek could be reduced by revegetation of riparian zones is unlikely because of leaching of soluble P through the sandy soils. Riparian management should reduce sediment yield, however.
- The construction of the sediment budgets was made possible by field measurements combined with essential information from local farmers and residents.
Author Contributions
Funding
Institutional Review Board Statement
Informed Consent Statement
Data Availability Statement
Acknowledgments
Conflicts of Interest
References
- Kronvang, B.; Laubel, A.; Grant, R. Suspended sediment and particulate phosphorus transport and delivery pathways in an arable catchment, Gelbaek Stream, Denmark. Hydrol. Process. 1997, 11, 627–642. [Google Scholar] [CrossRef]
- Weaver, D.; Summers, R. Fit-for-purpose phosphorus management do riparian buffers qualify in catchments with sandy soils? Environ. Monit. Assess. 2014, 186, 2867–2884. [Google Scholar] [CrossRef] [PubMed]
- Summers, R.; Weaver, D.; Keipert, N.; Steele, J. Does Riparian Filtration Reduce Nutrient Movement in Sandy Agricultural Catchments? Environ. Nat. Resour. Res. 2014, 4, 155–168. [Google Scholar] [CrossRef][Green Version]
- Sharma, R.; Wong, M.T.F.; Weaver, D.M.; Bell, R.W.; Ding, X.; Wang, K. Runoff and leaching of dissolved phosphorus in streams from a rainfed mixed cropping and grazing catchment under a Mediterranean climate in Australia. Sci. Total Environ. 2021, 771, 145371. [Google Scholar] [CrossRef]
- McKergow, L.; Weaver, D.; Prosser, I.; Grayson, R.; Reed, A. Before and after riparian management sediment and nutrient exports from a small agricultural catchment, Western Australia. J. Hydrol. 2003, 270, 253–272. [Google Scholar] [CrossRef]
- Pen, L. The Condition of the Kalgan River Foreshores 1992/93; Waterways Commission: Perth, WA, USA, 1994; p. 62.
- Western Australian Water Resources Council. The State of the Rivers of the South West, Western Australian Water Resources Council Publication No. WRC 2/92; Western Australian Water Resources Council: Sydney, Australia, 1992; 70p.
- Hodgkin, E.; Hamilton, B. Fertilizers and eutrophication in southwestern Australia setting the scene. Fertil. Res. 1993, 36, 95–103. [Google Scholar] [CrossRef]
- Wasson, R.; Sidorchuk, A.; Yu, A. History for soil conservation and catchment management. In Environmental History and Policy; Dover, S., Ed.; Oxford Universtity Press: Oxford, UK, 2000; pp. 97–117. [Google Scholar]
- Callow, J.N.; Smettem, K.R.J. Channel response to a new hydrological regime in southwestern Australia. Geomorphology 2007, 84, 254–276. [Google Scholar] [CrossRef]
- George, R.; Clarke, J.; English, P. Modern and palaeogeographic trends in the salinisation of the Western Australian wheatbelt: A review. Soil Res. 2008, 46, 751–767. [Google Scholar] [CrossRef]
- Muhling, P.; Brakel, A. Mount Barker, Albany. Sheets S1/50-11, 15, 1250,000 Geological Series–Explanatory Notes. Geological Survey of Western Australia; Geological Survey of Western Australia: Perth, Australia, 1985; 21p.
- Ferdowsian, R.; McFarlane, D.; Ryder, A. Wetlands on Tertiary sandplains need to be managed to reduce secondary salinity. In Proceedings of the 4th National Conference on the Productive Use of Rehabilitation of Saline Lands, Albany, Australia, 25–30 March 1996; pp. 205–218. [Google Scholar]
- Churchward, H.M.; McArthur, W.M.; Sewell, P.L.; Bartle, G.A. Landforms and Soils of the South Coast and Hinterland, Western Australia (Northcliffe to Manypeaks); Divisional Report 88/1; CSIRO, Division of Water Resources: Clayton, Australia, 1988.
- Weaver, D.; Reed, A. Patterns of nutrient status and fertiliser practice on soils of the south coast of Western Australia. Agric. Ecosyst. Environ. 1998, 67, 37–53. [Google Scholar] [CrossRef]
- Seal, C. Albany Waterways Management Programme; Report No. 54; Waterways Commission: Perth, Australia, 1995; 157p.
- Weaver, D.; Prout, A. Changing farm practice to meet environmental objectives of nutrient loss to Oyster Harbour. Fertil. Res. 1993, 36, 171–184. [Google Scholar] [CrossRef]
- Taylor, A.W.; Kunishi, H.M. Phosphate Equilibria on Stream Sediment and Soil in a Watershed Draining an Agricultural Region. J. Agric. Food Chem. 1971, 19, 827–831. [Google Scholar] [CrossRef]
- Froelich, P.N. Kinetic control of dissolved phosphate in natural rivers and estuaries A primer on the phosphate buffer mechanism. Limnol. Oceanogr. 1988, 33, 649–668. [Google Scholar] [CrossRef]
- Weaver, D.M.; Wong, M.T.F. Scope to improve phosphorus (P) management and balance efficiency of crop and pasture soils with contrasting P status and buffering indices. Plant Soil 2011, 349, 37–54. [Google Scholar] [CrossRef]
- Simons, J.; George, R.; Raper, P. ‘Dryland salinity’. In Report Card on Sustainable Natural Resource Use in Agriculture, Department of Agriculture and Food, Western Australia. 2013. Available online: https://researchlibrary.agric.wa.gov.au/cgi/viewcontent.cgi?filename=9&article=1013&context=books&type=additional. (accessed on 15 November 2021).
- Olley, J.; Murray, A.; Mackenzie, D.; Edwards, K. Identifying Sediment Sources in a Gullied Catchment Using Natural and Anthropogenic Radioactivity. Water Resour. Res. 1993, 29, 1037–1043. [Google Scholar] [CrossRef]
- Wasson, R.; Mazari, R.; Starr, B.; Clifton, G. The recent history of erosion and sedimentation on the Southern Tablelands of southeastern Australia sediment flux dominated by channel incision. Geomorphology 1998, 24, 291–308. [Google Scholar] [CrossRef]
- Krause, A.; Franks, S.; Kalma, J.; Loughran, R.; Rowan, J. Multi-parameter fingerprinting of sediment deposition in a small gullied catchment in SE Australia. Catena 2003, 53, 327–348. [Google Scholar] [CrossRef]
- Glover, R. A History of the Shire of Plantagenet Western Australia; University of Western Australian Press, Nedlands: Perth, Australia, 1979. [Google Scholar]
- Throne, J. Estimation of Sediment Yield from Small Agricultural Catchments within Oyster Harbour, Albany; University of Western Australia: Perth, Australia, 1997. [Google Scholar]
- Rosewall, C.J.; Edwards, K. SOILOSS—A Program to Assist in the Selection of Management Practices to Reduce Erosion. Soil Cons Serv of NSW, Tech Handbook; Soil Conservation Service of New South Wales, Dept. of Conservation and Land Management: Gunnedah, Australia, 1988; No.1.
- Parsons, A.J.; Brazier, R.E.; Wainwright, J.; Powell, D.M. Scale relationships in hillslope runoff and erosion. Earth Surf. Process. Landf. 2006, 31, 1384–1393. [Google Scholar] [CrossRef]
- Wallbrink, P.J.; Murray, A.S.; Olley, J.M.; Olive, L.J. Determining sources and transit times of suspended sediment in the Murrumbidgee River, New South Wales, Australia, using fallout 137Cs and 210Pb. Water Resour. Res. 1998, 34, 879–887. [Google Scholar] [CrossRef]
- Fahey, B.D.; Marden, M. Sediment yields from a forested and a pasture catchment, coastal Hawke’s Bay, North Island, New Zealand. J. Hydrol. 2000, 39, 49–63. [Google Scholar]
- Bathurst, J.C.; Iroumé, A. Quantitative generalizations for catchment sediment yield following forest logging. Water Resour. Res. 2014, 50, 8383–8402. [Google Scholar] [CrossRef]
- Rayment, G.; Lyons, D. Soil Chemical Methods—Australasia; CSIRO Publishing: Collingwood, Australia, 2011. [Google Scholar]
- Colwell, J. An automatic procedure for the determination of phosphorus in sodium hydrogen carbonate extracts of soils. Chem. Ind. 1965, 22, 893–895. [Google Scholar]
- Sharpley, A. An Innovative Approach to Estimate Bioavailable Phosphorus in Agricultural Runoff Using Iron Oxide Impregnated Paper. J. Environ. Qual. 1993, 22, 597–601. [Google Scholar] [CrossRef]
- Murphy, J.; Riley, J. A modified single solution method for the determination of phosphate in natural waters. Anal. Chim. Acta 1962, 27, 31–36. [Google Scholar] [CrossRef]
- Wilkinson, B.H.; McElroy, B.J. The impact of humans on continental erosion and sedimentation. GSA Bull. 2007, 119, 140–156. [Google Scholar] [CrossRef]
- Dodson, J.R. Holocene vegetation change in the mediterranean-type climate regions of Australia. Holocene 2001, 11, 673–680. [Google Scholar] [CrossRef]
- McFarlane, D.; Loughran, R.; Elliot, G.; Ryder, A.; George, R.; Van Moort, J. A National Reconnaissance Survey of Soil Erosion in Australia. Western Australia. Report for Australia National Landcare Program, Project Number 1989–90: No. 8was; University of Newcastle: Newcastle, Australia, 1997. [Google Scholar]
- Weaver, D.; Summers, R. Phosphorus status and saturation in soils that drain into the Peel Inlet and Harvey Estuary of Western Australia. Soil Res. 2021. [Google Scholar] [CrossRef]
- Weaver, D.; McCafferty, P.; Reed, A. A phosphorus inventory for Albany Hinterland, south coast of Western Australia. In Proceedings of the International Conference on Diffuse Pollution. “Solutions—Innovations”, Perth, Australia, 16–20 May 1999; Barber, C., Humphries, B., Dixon, J., Eds.; International Association on Water Quality: London, UK, 1999; pp. 105–116. [Google Scholar]
- Sidorchuk, A.Y.; Golosov, V.N. Erosion and sedimentation on the Russian Plain, II: The history of erosion and sedimentation during the period of intensive agriculture. Hydrol. Process. 2003, 17, 3347–3358. [Google Scholar] [CrossRef]
- Matveev, N.P. Small Rivers of the Centre of the Russian Plains, their Usage and Preservation; Academy of Science USSR: Moscow, Russia, 1988; 128p. (In Russian) [Google Scholar]
- Zucker, C.L.; Olsen, C.R.; Larsen, I.L.; Cutshall, N.H. Inventories and sorption-desorption trends of radiocesium and radiocobalt in James River estuary sediments. Environ. Geol. 1984, 6, 171. [Google Scholar] [CrossRef]
- Summers, R.N. The incidence and severity of non-wetting soils on the south coastal sandplain of Western Australia. Master’s Thesis, University of Western Australia, Perth, Australia, 1987. [Google Scholar]
- Schumm, S.A.; Rea, D.K. Sediment yield from disturbed earth systems. Geology 1995, 23, 391–394. [Google Scholar] [CrossRef]
- Trimble, S. Decreased Rates of Alluvial Sediment Storage in the Coon Creek Basin, Wisconsin, 1975–1993. Science 1999, 285, 3. [Google Scholar] [CrossRef]
- Walling, D.; Collins, A. The catchment sediment budget as a management tool. Environ. Sci. Policy 2008, 11, 136–143. [Google Scholar] [CrossRef]
| Name | Area | Relative | Strahler Stream Order | Drainage Density | Average Gradient | |
|---|---|---|---|---|---|---|
| (km2) | Relief (m) | (km/km2) | ||||
| Channelized Part | Whole | |||||
| Takalarup Creek | 15.6 | 70 | 3 | 0.7 | 0.0162 | 0.0170 |
| Dingo Creek | 7.6 | 60 | 2 | 0.6 | 0.0256 | 0.0217 |
| Salt Creek | 14.3 | 60 | 3 | 1.2 | 0.0129 | 0.0124 |
| Period | Category | Sources | Stores and Yield | ||||||
|---|---|---|---|---|---|---|---|---|---|
| Sheet and Rill Erosion (t) | Gullies and Channels (t) | PSA 2 (t) | Fan | Yield | SDR (%) | ||||
| (t) | (t) | t/km2/yr | |||||||
| Connected | Unconnected 1 | ||||||||
| <1903 | 42 | 0 | 0 | 0 | 0.1–0.2 | 4–7 | |||
| 1903–1955 | Uncleared | 200 | 100 | ||||||
| Cleared | 940 | 1500 | |||||||
| Total | 1140 | 1600 | 47,300 | 12,110 | 7300 | 29,000 | 36 | 58 | |
| 1955–1997 | Uncleared | 200 | 100 | ||||||
| Cleared | 2800 | 2260 | 5230 3 | ||||||
| 12,140 4 | |||||||||
| Total | 3000 | 2360 | 17,370 | 2240 | 3650 | 14,500 | 22 | 64 | |
| 1903–1997 | 4140 | 3960 | 64,670 | 14,350 | 10,950 | 43,500 | 30 | 60 | |
| Locations | P (total) | P (HCO3) | P (Bio) | |||
|---|---|---|---|---|---|---|
| (mg/kg) | (mg/kg) | (mg/kg) | ||||
| <75 µm | >75 µm | <75 µm | >75 µm | <75 µm | >75 µm | |
| Profile 4 SM | 130 | 58 | 6 | 2 | 0.04 | 0.04 |
| Profile 4 AF | 140 | 48 | <2 | <2 | 0.04 | 0.04 |
| Tributary Sediment | 360 | 64 | 29 | 7 | 0.07 | 0.04 |
| Main Channel | 330 | 200 | 87 | 44 | 0.15 | 0.12 |
| Dingo Creek | Salt Creek | Takalarup Creek 1 | |
|---|---|---|---|
| (1982–1997) | (1956–1997) | (1903–1997) | |
| SOURCES | |||
| Sheet and rill (connected) (t) | 21 | 830 | 4140 |
| Main channel incision (t) | 16 | 6005 | 61,226 |
| Gullying (t) | 507 | 305 | 3444 |
| Salt scalds (t) | 289 | 201 | 150 |
| Total (t) | 833 | 7341 | 68,960 |
| STORAGES | |||
| PSA (t) | 50 | 6400 | 350 |
| In-channel (t) | 53 | 150 | 340 |
| Fan (t) | 7 | - | 10,950 |
| Total (t) | 110 | 6550 | 25,640 |
| YIELD 2 (t) | 723 | 790 | 43,320 |
| (t/year) | 48 | 19 | 460 |
| (t/km2/year) | 6 | 1.3 | 30 |
Publisher’s Note: MDPI stays neutral with regard to jurisdictional claims in published maps and institutional affiliations. |
© 2021 by the authors. Licensee MDPI, Basel, Switzerland. This article is an open access article distributed under the terms and conditions of the Creative Commons Attribution (CC BY) license (https://creativecommons.org/licenses/by/4.0/).
Share and Cite
Wasson, R.J.; Weaver, D.M. Sediment Budgets for Small Salinized Agricultural Catchments in Southwest Australia and Implications for Phosphorus Transport. Water 2021, 13, 3564. https://doi.org/10.3390/w13243564
Wasson RJ, Weaver DM. Sediment Budgets for Small Salinized Agricultural Catchments in Southwest Australia and Implications for Phosphorus Transport. Water. 2021; 13(24):3564. https://doi.org/10.3390/w13243564
Chicago/Turabian StyleWasson, Robert J., and David M. Weaver. 2021. "Sediment Budgets for Small Salinized Agricultural Catchments in Southwest Australia and Implications for Phosphorus Transport" Water 13, no. 24: 3564. https://doi.org/10.3390/w13243564
APA StyleWasson, R. J., & Weaver, D. M. (2021). Sediment Budgets for Small Salinized Agricultural Catchments in Southwest Australia and Implications for Phosphorus Transport. Water, 13(24), 3564. https://doi.org/10.3390/w13243564


