1. Introduction
Managing international river basins around the world puts emphasis on obtaining and preserving good water quality of water bodies, due to arising economic, agricultural, industrial, technological, and other impacts on natural water resources in modern society [
1,
2]. Water quality assessment is based on the analysis of physical, chemical, and microbiological aspects of water. The state of the aquatic environment is mainly described by oxygen parameters (dissolved oxygen and water saturation with oxygen (OS)), as well as by temperature (T), pH value (pH), and electrical conductivity (EC). In addition, the parameters related to waters loaded with pollutants from anthropogenic sources are equally important. The parameters of the “load” refer to the monitoring of the form of nitrogen (NH4-N) and phosphorus (PO4-P), biological oxygen demand (BOD-5), chemical oxygen demand (COD), solutes, the content of suspended matter (SM), etc. Thus, water quality influenced by various biological, chemical, and physical variables naturally found in water needs to be constantly monitored and evaluated in order to preserve balanced water quality over time [
3,
4]. Within the framework of this paper, the variables that are most often analyzed in the official index methods for evaluating the overall water quality of rivers and lakes are considered.
Anthropogenic factor has a considerable impact on the significant physical, chemical, and biological characteristics of water resources. Consequently, different approaches for sustainable use and management of water resources that take into account the establishment of multidisciplinary strategies in the approach to water quality analysis are needed. Researchers all over the world are using different techniques and methods to evaluate water quality. Numerous multivariate statistical techniques, such as one-way analysis of variance (ANOVA), Pearson’s correlation, hierarchical agglomerative cluster analysis (HCA), and principal component analysis (PCA) are often used to explore the spatial and temporal changes in water quality [
5,
6], as well as to indicate the main pollutant sources [
7,
8,
9]. However, the use of different multivariate statistical techniques requires large sets of data and complicates the interpretation of the results due to numerous iterations and interchangeable comparisons of data sets [
10]. Thus, there is a need for a somewhat easier approach that could easily be introduced to a wider group of interested parties. Visualization tools and techniques provide an accessible way to spot and better understand trends, deviations, and patterns in data [
11]. Therefore, in manipulating a large set of data, visualization backing is substantial for analyzing vast amounts of information and making effective data-based decisions [
12]. Walker et al. [
13] demonstrated that application of multicriteria decision making methods (MCDM) is an imposing way to visually approach the analysis of large data sets. A comprehensive visual approach offered by the MCDM method of PROMETHEE (
Preference Ranking Organization METHod for Enrichment Evaluation) along with its visually interactive module GAIA (
Geometric Analysis for Interactive Assistance) has proven its potential for revealing additional and in-depth information about the characteristics of multiple criteria datasets, where large number of criteria have to be built into the visualization plot [
14]. According to Mareschal and Brans [
15], this method provides the decision-maker with a considerable enrichment for the understanding of the problem by evaluating the importance of each criterion, identifying conflicting criteria almost immediately, exposing incomparability between actions, and selecting best compromise actions.
In this paper, PROMETHEE method, enhanced with visual geometric option method of GAIA, is used to swiftly assess the water quality of the Tisa River Basin in Serbia and provide a wider scheme of interrelations between the multiple characteristics within the existing dataset. The Tisa River is exposed to constant pollution from various sources, such as agriculture, chemical factories, municipal wastewater, and the mining industry. International institutions have recorded as many as 447 potential polluters in the Tisa River Basin as a whole, some of which are very risky and originate from different countries in the Tisa River Basin (Romania, Ukraine, Slovakia, and Hungary) [
16]. According to this report, in Romania anionic-active detergents caused decrease in the Tisa River water quality; in Slovakia total cyanides and zinc were parameters of concern, while in Hungary the problem occurred with pollution by chromium, copper, and zinc. The current and potential pollutants in the Tisa River Basin in Serbia, both those of anthropogenic origin (agriculture, industrial wastewater, municipal wastewater) and those of natural origin (especially climate change and increasingly caused droughts within) should be added to it. Surface waters are most endangered near cities that do not have municipal wastewater treatment plants, as well as near settlements for industrial food processing plants [
17]. Therefore, the need for assessing the water quality of Tisa River Basin in Serbian part arose, and in such a way that would both indicate potential locations of pollution and parameters that cause the pollution.
The application of PROMETHEE and GAIA methods in the evaluation of the quality of the environment [
18,
19,
20] and water resources has yielded significant results [
21,
22,
23]. More recent investigations include the applicability of these methods as a decision support framework for assessing water resources carrying capacity among different regions [
24]; for identifying the linkage between runoff pollutants, land use types, and rainfall intensity [
25]; as a ranking approach to scheduling repairs of water distribution systems [
26] or in making decisions regarding the implementation of water management plans as irrigation system plans [
27], while taking into account the sustainability of decision-making alternatives in resolving a decision problem [
28]. Additionally, Khalil et al. [
29] demonstrated how the application of PROMETHEE and GAIA can contribute to the development of a comprehensive understanding in the case of soil properties, along with the relations between the different physical-chemical characteristics, and therein facilitate a multivariate approach by pointing out to a critical site. Thus, by applying visual methods of PROMETHEE and GAIA in water quality assessment, locations with poor water quality and their causes can be revealed.
Then again, there are numerous authors that proposed other MCDA methods for assessing environmental issues such as the AHP (Analytic Hierarchy Process) method [
30,
31], ANP (Analytic Network Process), TOPSIS (Technique for Order Preference by Similarity to Ideal Solution) [
32,
33], ELECTRE (ÉLimination et Choix Traduisant la REalité, i.e., ELimination Et Choice Translating REality), and others. However, the use of PROMETHEE and GAIA methods in this research instead of other multicriteria methods was chosen because it allows assessing the complexity of water quality evaluation by quantifying quality variables and evaluating the importance of each criterion in the decision process, also enabling the decision maker to visualize the evaluation problem and better understand the interconnections between conflicting criteria, while processing large amounts of data in a more comprehensive manner [
34]. Additionally, unicriterion net flow scores in a form of a spider web graph, that the visual PROMETHEE method offers, were explored afterwards for the most critical locations, in order to strengthen the results. Nevertheless, the multicriteria visual approach in this work uses parameters of the official Serbian water quality index (SWQI) method, to ensure that the assessment includes all of the official influential water quality parameters, as defined by the Laws and Regulations on Watercourses in Serbia [
35].
The originality of this work is reflected in presenting an understandable multicriteria visual approach that is consistent with complex statistical analyses to get a swift, reliable approach to the consideration of the problem of water quality, while at the same time, pointing to locations with poor water quality and the reasons as to why it occurs. The case study of one of the largest and regionally most important catchment areas on the territory of the Republic of Serbia—the Tisa River Basin—was herein used.
This article is therefore structured in five sections, including an introductory section, and then followed by a closer description of the catchment area in
Section 2. Used methodology is presented in
Section 3, while the results are discussed within
Section 4. Finally, concluding observations with implications for further research are given in
Section 5.
2. Catchment Area—The Tisa River Basin
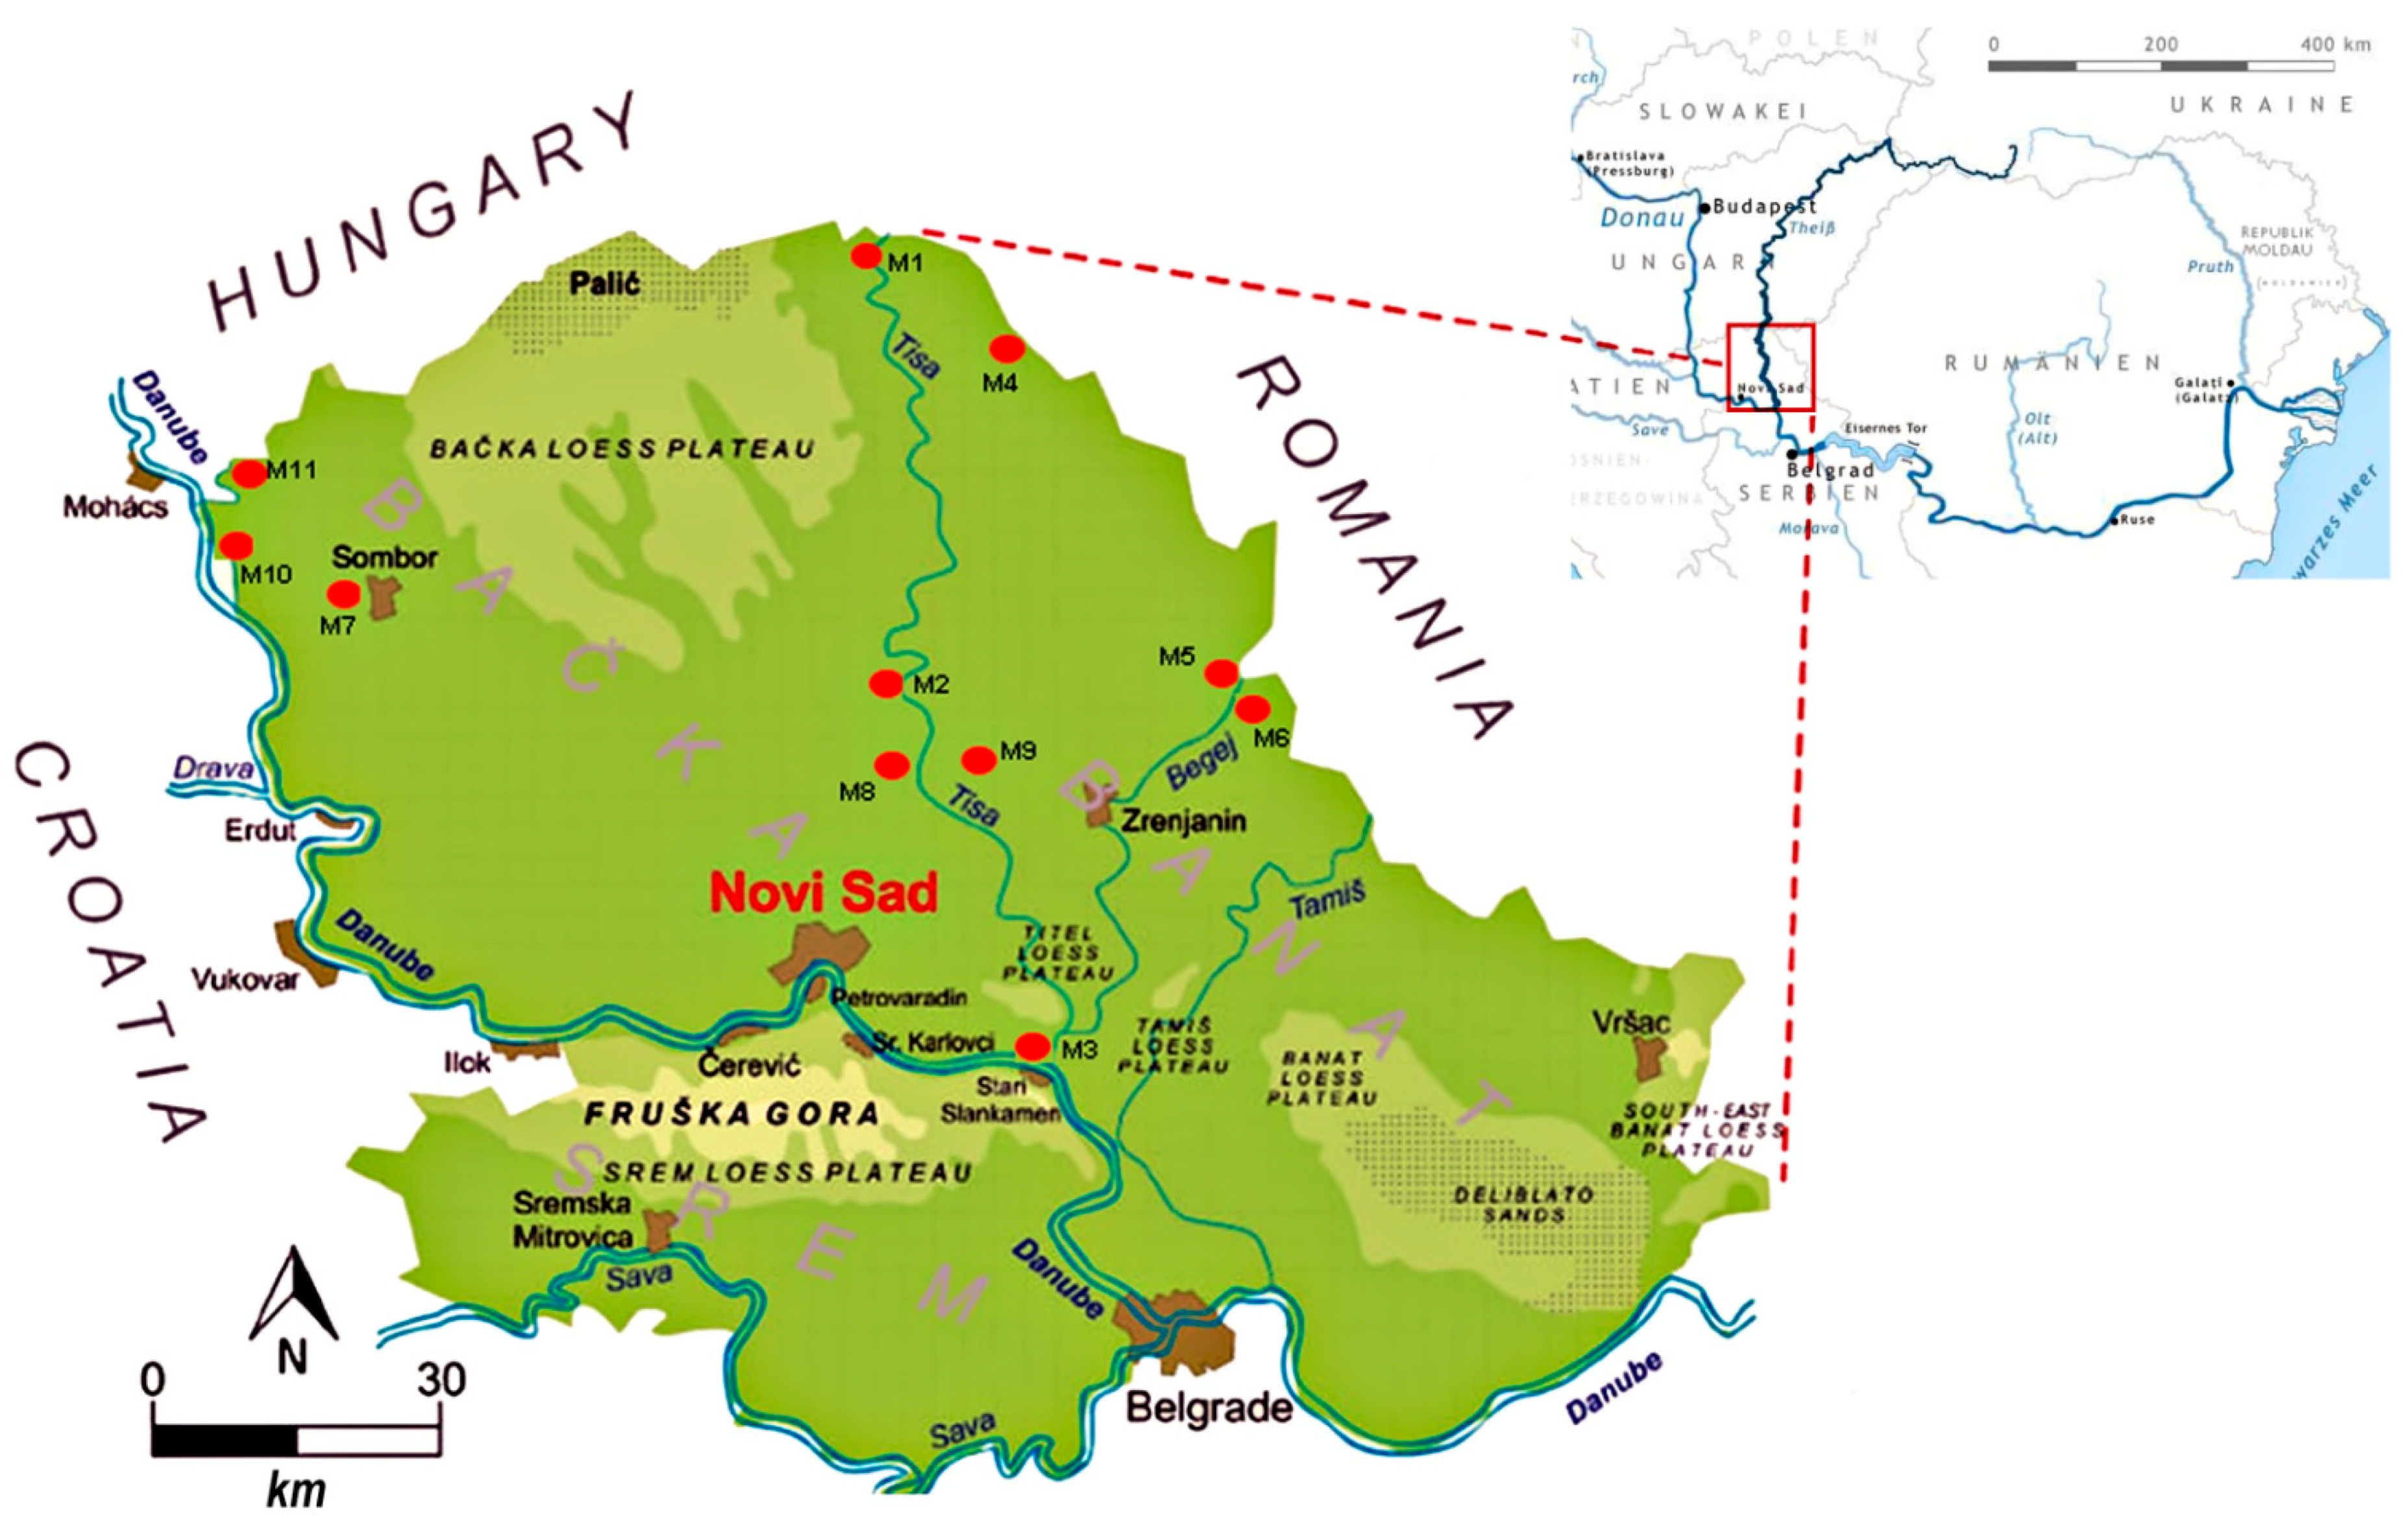
The total of the Tisa catchment area is 157,186 km
2 and its basin is the largest sub-basin of the Danube River Basin. The Tisa River rises in Ukraine, in the Carpathians, from where it collects the waters of the Carpathian Basin’s eastern region in total length of its main branch of 964 km, running through Ukraine, Romania, Slovakia, Hungary and, finally, Serbia, where this river conjuncts with the Danube River near the locations of Stari Slankamen and Titel (
Figure 1).
With regard to geomorphological features of the entire catchment area, there are three main parts of the basin: the Upper Tisa (upstream from the mouth of the river Samos), the Middle Tisa (between the mouths of the rivers Samos and Mures), and the Lower Tisa (downstream from the mouth of the river Mures) to which the Tisa River Basin in Serbia belongs. The Serbian part of the Tisa River Basin covers almost half of Vojvodina, the northern autonomous province of Serbia, dividing it into two regions: Banat in the east and Backa in the west. This Serbian province is the most important area of commercial agriculture since arable land occupies almost four fifths of its territory. It speaks in favor of the fact that the Tisa River has a great role in irrigating this region since water is necessary for agricultural production, but also that there are threats of pollution of this river with artificial fertilizers used in agricultural production. Nevertheless, a number of investigations concluded that concentrated pollutants originating from settlements and industries still have a more significant impact on the quality of surface waters in comparison to agriculture [
36,
37,
38,
39].
The Lower Tisa receives water from the Begej River and other tributaries indirectly through the Danube-Tisa-Danube (DTD) hydrological system. The Begej River originates from Stari Begej and the Begej Canal where both tributaries flow from Romania to Serbia. The Tisa in Vojvodina has tributaries both on the Banat side (Zlatica, Galacka and Begej) and on the Backa side (Keres, Cik and Jegricka) and some are channeled and connected to the DTD system.
Water quality assessment in the Serbian part of the Tisa River Basin was conducted using a set of data obtained from 11 hydrological measuring stations: Martonos (M1), Novi Becej (M2), Titel (M3), Vrbica (M4), Hetin (M5), Srpski Itebej (M6), Sombor (M7), Backo Gradiste (M8), Melenci (M9), Backi Breg 1 (M10), and Backi Breg 2 (M11). Locations M1, M2, and M3 are located on the Tisa River, while locations M7, M8, and M9 belong to the DTD system. Other included locations, such as M4, M5, and M6, belong to the tributaries of the Tisa River (Zlatica, Stari Begej, and Plovni Begej, respectively). The location M10 belongs to the Bajski Canal, while location M11 belongs to the Plazović River (
Kígyós in Hungarian), but both at the Bezdan location flow into the Veliki Backi Canal, which as a part of the DTD system, connects the Danube with the Tisa River. All of the observed locations are significant in terms of possible sources of pollution that may directly or indirectly affect water quality in this very important basin.
Figure 1 shows the locations within the basin. Changes in nine water quality parameters were monitored at these locations, namely, oxygen saturation of water (OS), biological oxygen demand (BOD-5), suspended solids (SM), total oxidized nitrogen (N), orthophosphates (PO4-P), ammonium ion (NH4-N), temperature (T), pH, and electrical conductivity (EC). The average annual values of each of the nine parameters were obtained by calculating the mean value of all the measurements performed each month by the official National Environmental Protection Agency [
40] during the observed one year period. Variations and deviations in terms of the river water quality according to seasonal (thermal) changes, including warm and cold periods during the year, were also observed.
4. Results and Discussion
4.1. Multicriteria Decision-Making Analysis
To rank the locations in the Tisa River Basin according to various water quality parameters, multicriteria decision-making methods of PROMETHEE and GAIA were applied. The average annual values of nine water quality parameters of the Tisa River Basin, as well as periodic mean values, at 11 measuring points (locations) along the river basin, are shown in
Table 1, where the average values for the warm period of the year (WP) included measurements for months of April, May, June, July, August, September, and October, and for the cold period (CP) the remaining months of November, December, January, February, and March were covered.
According to Mladenović-Ranisavljević [
21], the ranking of locations according to the quality of the water sample can be done if the value of the oxygen saturation (OS) criterion is maximized, since the defined criterion contributes to better water quality, while other parameters need to be defined as minimum criterion values to ensure the minimum content in water. Oxygen belongs to the group of the most important parameters of surface water quality, since it maintains the aerobic form of life in aquatic ecosystems, processes biological oxidations, and contributes to increasing ability of natural waters to self-purify. Its content in water can also vary depending on the temperature of water during the warm and cold months of the year, which is why those periods were also observed separately in this investigation.
Bearing in mind the quantitative nature of data used in creating the scenario, a linear function was chosen for the preference function, for all defined criteria. The thresholds of indifference (Q) and preference (P) were determined in absolute values, according to the usual range of 5–30%, respectively, and shown in
Table 1.
Taking into account the weight coefficients of each individual parameter in the overall water quality index [
47], the weights were defined as slightly adjusted to meet the sum of 1, since the parameter of
E.coli is omitted from this analysis due to a lack of its official monitoring data. Weight coefficients are given in
Table 1. PROMETHEE ranking was then performed for the defined scenarios.
Based on the calculated values and defined scenarios, the values of positive (
Phi +), negative (
Phi-), and net (
Phi net) preference flows were obtained, as shown in
Table 2. The results show that the least polluted location, with the best water quality, is M8 (with
Phi net value of 0.3008), while the most polluted location, and with the worst water quality is M11 (with
Phi net value of −0.4474).
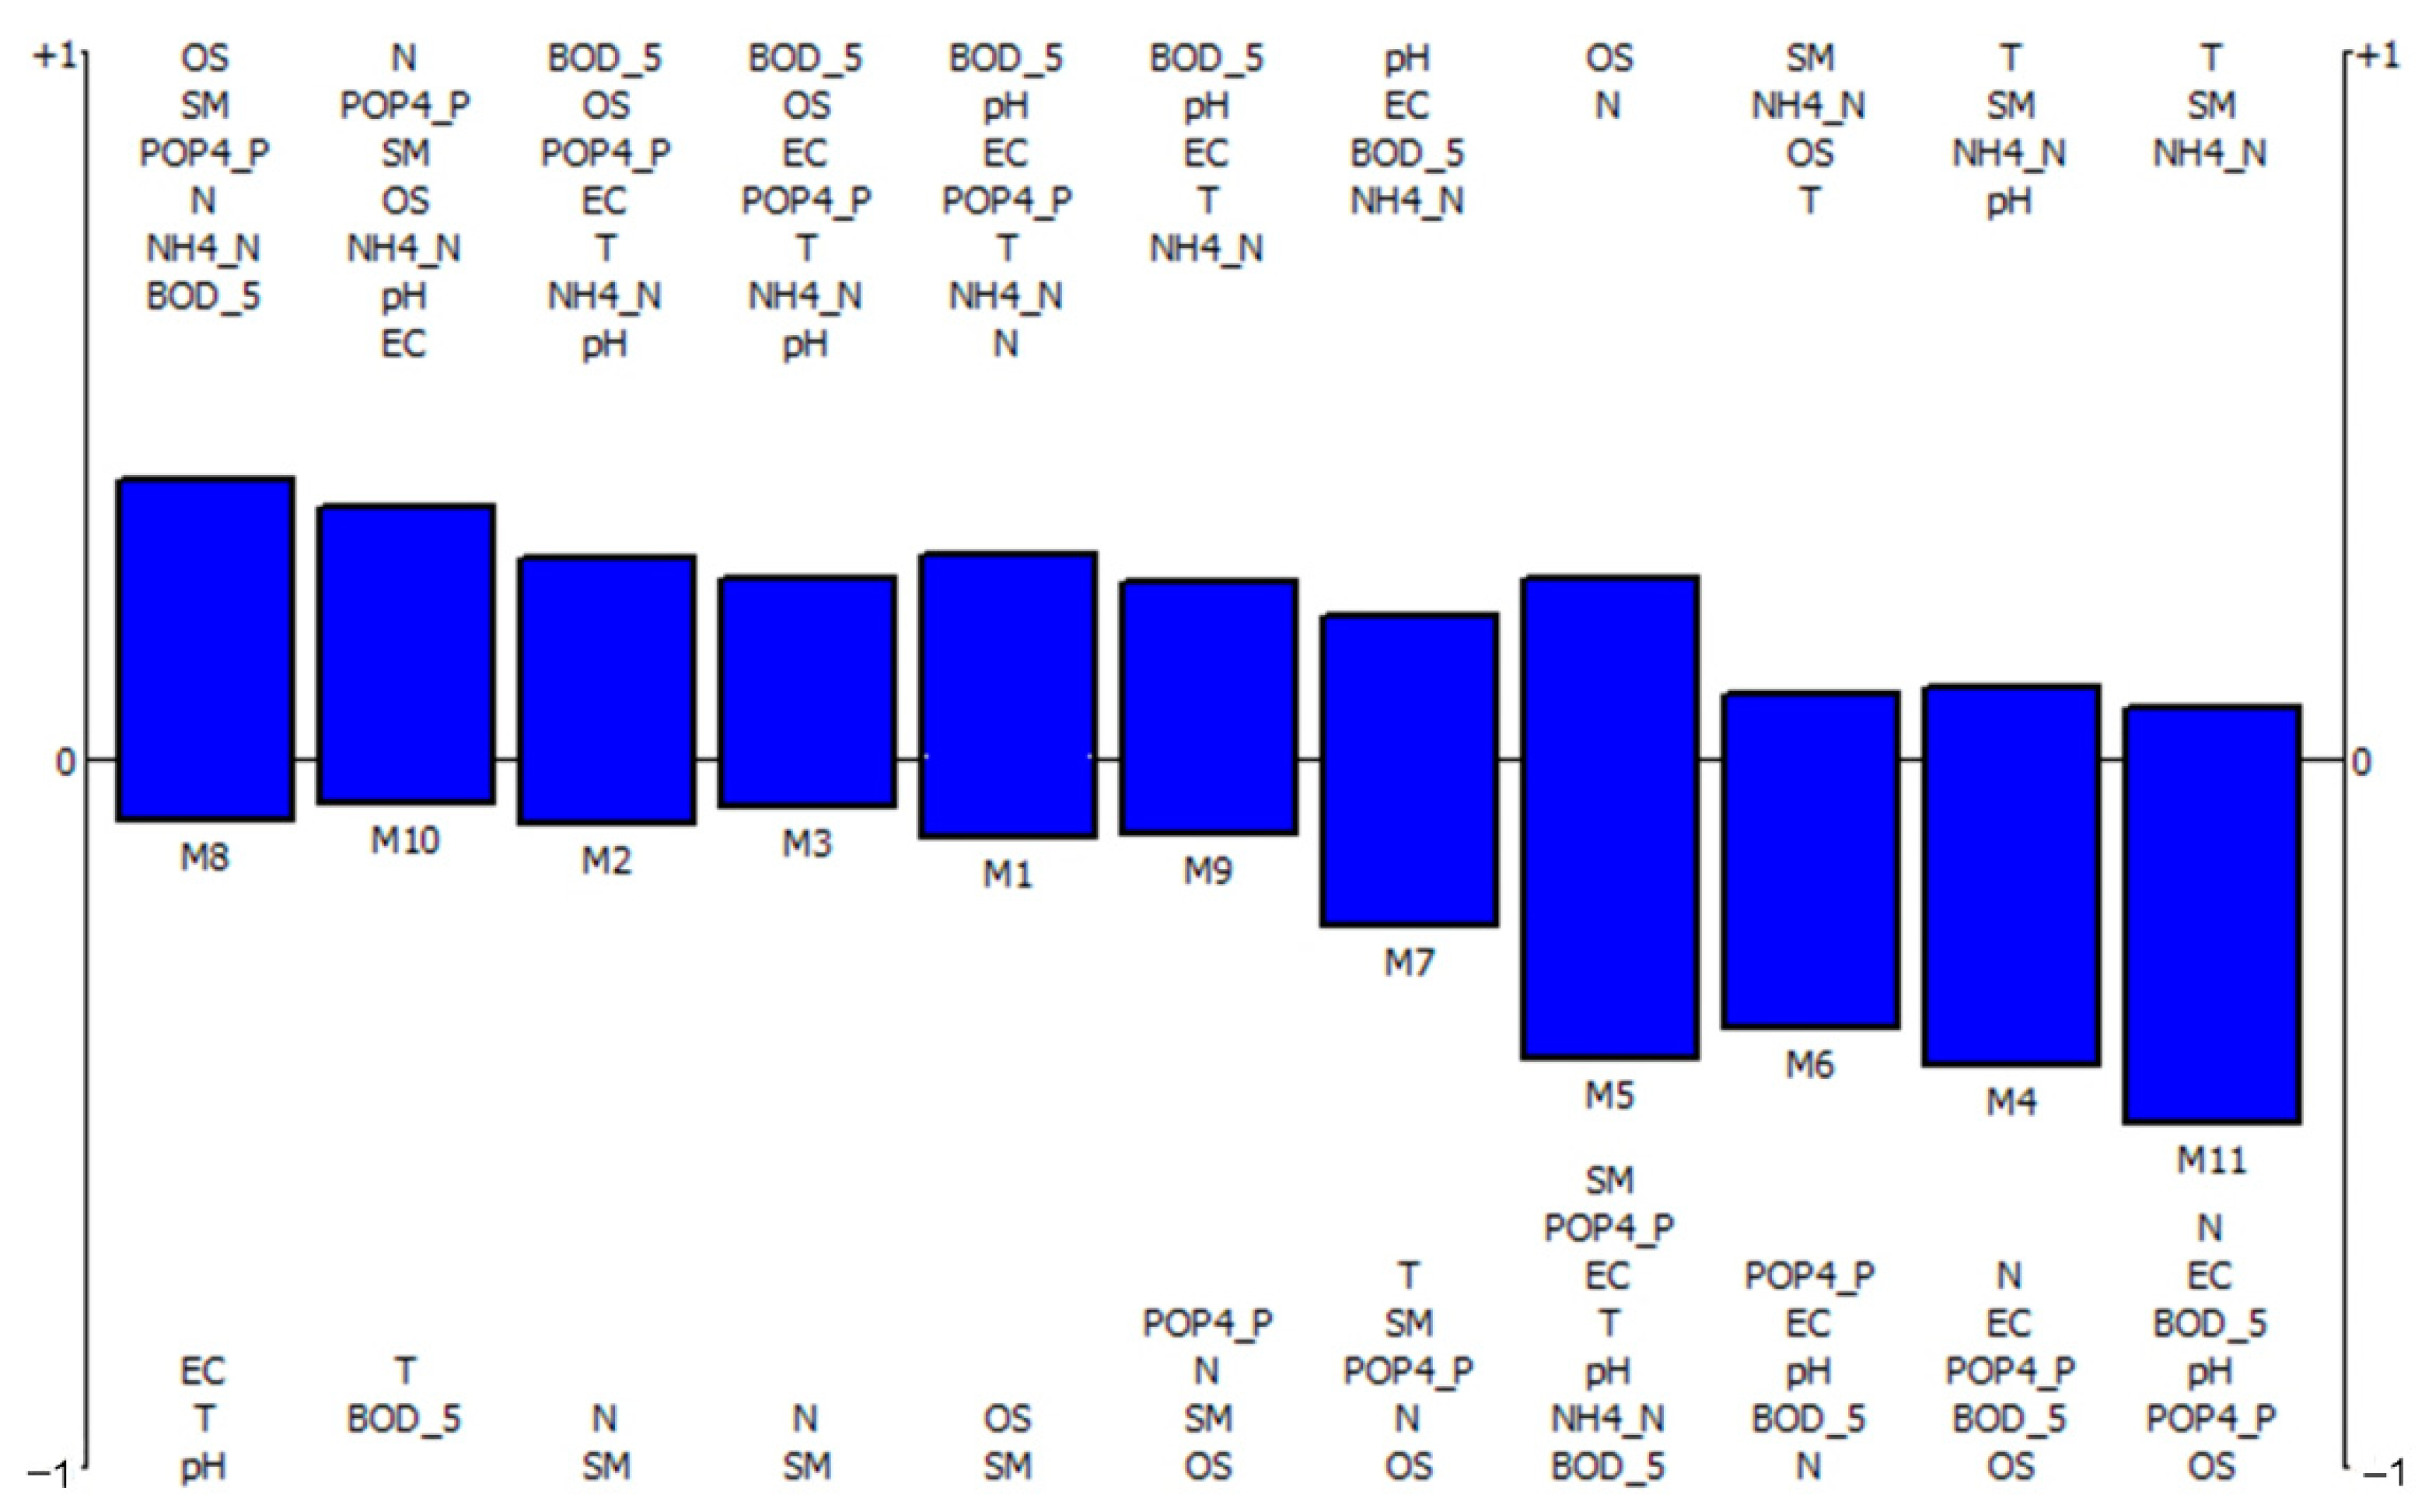
A classified view of the PROMETHEE II ranking, which shows the advantages and disadvantages of individual locations, on the basis of which the complete ranking of variant solutions was carried out, is shown in
Figure 2. It can be seen that the actions (locations) M8, M10, M2, M3, M1, and M9 show a significantly lower presence of water quality parameters that contribute to poor water quality, compared to other locations observed.
Temperature (T) is considered as one of the most important physical properties of water since it affects the speed of other physical, chemical, and biochemical processes in aquatic ecosystems, and is also a factor that determines the saturation of water with oxygen (OS) and other gases dissolved in water. In order to gain more detailed information on the interdependence between water quality parameters and locations depending on seasonal, i.e., temperature variations, the periods of warm and cold months were observed separately, thus two more scenarios for PROMETHEE ranking were created.
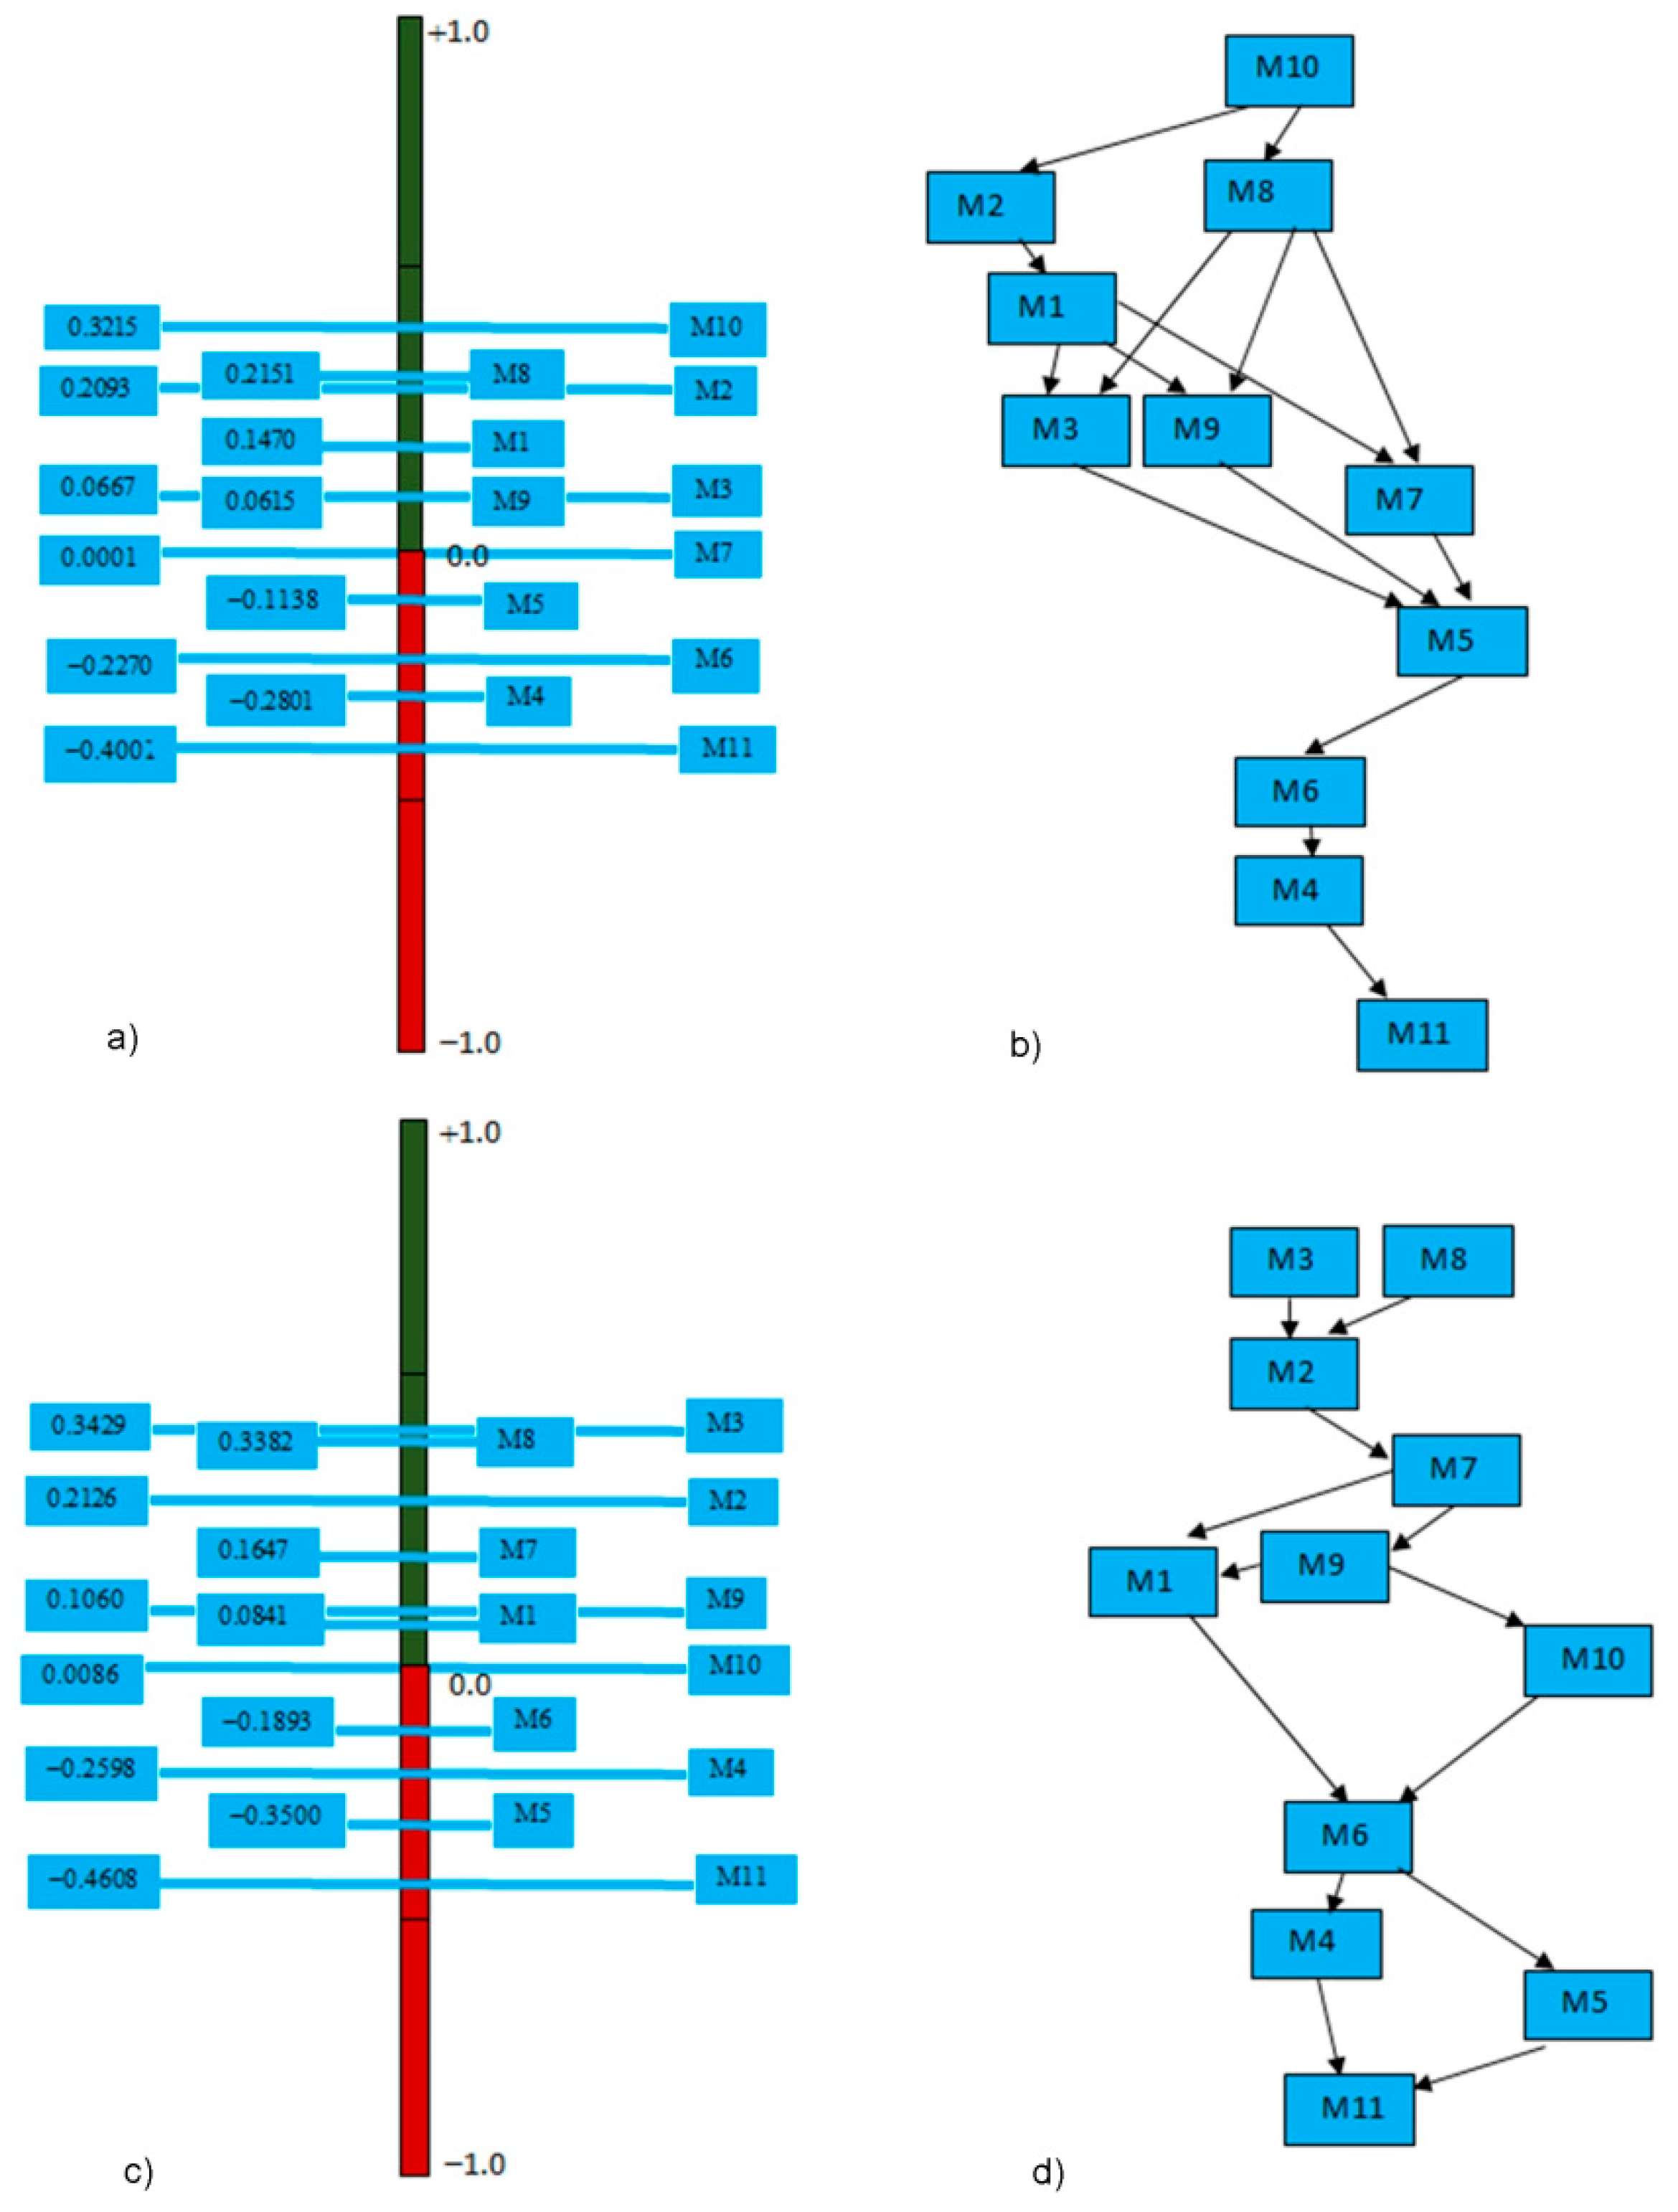
Based on the calculated values for the WP presented in
Table 1, complete ranking was performed and shown in
Figure 3a along with partial ranking shown in
Figure 3b. The least polluted location observed in the warm period of the year, with the best water quality is M10 (with
Phi net value of 0.3215), while the most polluted measuring point, with the worst water quality is M11 (
Phi net value is −0.4001).
Figure 3b shows PROMETHEE I partial ranking for the warm period (WP) where preferences between actions are represented by arrows. Actions are located in relative positions corresponding to the PROMETHEE II complete ranking so that the proximities between flow values appear clearly. It is quite obvious that location M10 is preferred to all the other actions, while the dense connection of the arrows indicates that there is no particularly important incomparability between locations.
PROMETHEE II ranking results for the cold period (
Figure 3c) show that the least polluted measuring point in the observed period, with the best water quality is M3 (
Phi net value is 0.3429), while the most polluted location, with the worst water quality is M11 (with
Phi net value of −0.4608). Moreover, PROMETHEE I partial ranking (
Figure 3d) indicates a certain level of incomparability between locations M3 and M8, and the reason for that should be sought in the fact that one is better than the other on several criteria while the other is better on other criteria.
Figure 4 displays pairwise comparison of all three scenarios (CP, WP, and AV) together. Water temperature is a very variable property; it usually varies in the range from 0 to 30 °C. The rate of many reactions in natural waters doubles with increasing temperature by 10 °C [
48]. Higher water temperatures, compared to the usual ones, favor the reproduction of a large number of microorganisms that cause diseases, and parasitic organisms that endanger life forms in the aquatic environment. As a consequence, there is an increase in water turbidity as well as excessive growth of algae in the circumstances of increased nutrient intake. During the summer months, increased biological activity causes a considerable decrease in values of oxygen saturation (OS) (see
Table 1). Moreover, the ranking of water quality differs depending on the warm and cold period during the year, so the locations with better water quality vary accordingly, observing the warm (M10), cold (M3), and average annual (M8) period (
Figure 4). However, in all of the cases, the PROMETHEE ranking singled out M11 location as the place with the worst water quality.
Table 1.
Evaluation scenario with the average annual and periodic values of the water quality parameters at the observed locations.
Table 1.
Evaluation scenario with the average annual and periodic values of the water quality parameters at the observed locations.
| Parameter | OS | BOD-5 | SM | N | PO4-P | NH4-N | T | pH | EC |
|---|
| Unit | % | mg/L | mg/L | mg/L | mg/L | mg/L | °C | - | µS/cm |
| Weight | 0.18 | 0.15 | 0.10 | 0.10 | 0.10 | 0.15 | 0.06 | 0.09 | 0.07 |
| Preference Function | Linear | Linear | Linear | Linear | Linear | Linear | Linear | Linear | Linear |
| Thresholds | Absolute | Absolute | Absolute | Absolute | Absolute | Absolute | Absolute | Absolute | Absolute |
| Q | 1.055 | 0.05 | 0.55 | 0.048 | 0.003 | 0.05 | 0.030 | 0.015 | 2.002 |
| P | 6.330 | 0.28 | 3.28 | 0.286 | 0.017 | 0.30 | 1.800 | 0.090 | 12.090 |
| Location and period | |
| M1 | WP | 88 | 1.5 | 47.90 | 0.753 | 0.055 | 0.04 | 19.5 | 7.9 | 424 |
| CP | 87.2 | 2.7 | 195.20 | 1.346 | 0.051 | 0.12 | 4.6 | 7.9 | 353.2 |
| AV | 87.7 | 2 | 109.20 | 1 | 0.053 | 0.08 | 13.3 | 7.9 | 394.5 |
| M2 | WP | 92.3 | 1.6 | 22.30 | 0.801 | 0.054 | 0.05 | 20.2 | 7.9 | 440 |
| CP | 92 | 2.2 | 99.20 | 1.389 | 0.048 | 0.13 | 4.1 | 8 | 431.6 |
| AV | 92.2 | 1.9 | 54.30 | 1.046 | 0.052 | 0.08 | 13.5 | 8 | 436.5 |
| M3 | WP | 90.4 | 2.2 | 27.90 | 0.767 | 0.063 | 0.06 | 20.1 | 7.9 | 426.7 |
| CP | 91.6 | 1.6 | 40.80 | 1.397 | 0.055 | 0.12 | 4 | 8 | 406.8 |
| AV | 90.9 | 2 | 33.20 | 1.029 | 0.060 | 0.08 | 13.4 | 8 | 418.4 |
| M4 | WP | 51.7 | 3.9 | 17.30 | 0.507 | 0.476 | 0.07 | 19 | 7.9 | 1028.8 |
| CP | 84 | 2.6 | 16.60 | 1.859 | 0.176 | 0.04 | 5.4 | 8.1 | 1006.8 |
| AV | 66.4 | 3.3 | 17 | 1.121 | 0.340 | 0.06 | 12.8 | 8 | 1018.8 |
| M5 | WP | 113.6 | 4.4 | 31.10 | 0.330 | 0.050 | 0.23 | 20.7 | 8.1 | 523.7 |
| CP | 88.5 | 4.8 | 5.50 | 1.556 | 0.122 | 0.45 | 5.6 | 8.2 | 765 |
| AV | 104.5 | 4.5 | 21.80 | 0.776 | 0.076 | 0.31 | 15.2 | 8.2 | 611.5 |
| M6 | WP | 80.6 | 3 | 14.30 | 0.374 | 0.424 | 0.10 | 19.7 | 8.1 | 1495.4 |
| CP | 99.8 | 3.3 | 10.20 | 2.785 | 0.173 | 0.07 | 5.5 | 8.3 | 1451.6 |
| AV | 88.6 | 3.1 | 12.60 | 1.379 | 0.319 | 0.09 | 13.8 | 8.2 | 1477.2 |
| M7 | WP | 78.6 | 2.3 | 15.60 | 1.072 | 0.119 | 0.11 | 19.2 | 7.6 | 344 |
| CP | 93.2 | 2.1 | 49.50 | 1.455 | 0.127 | 0.12 | 6.7 | 7.7 | 408.2 |
| AV | 83.9 | 2.2 | 27.90 | 1.211 | 0.122 | 0.11 | 14.7 | 7.6 | 367.4 |
| M8 | WP | 92.4 | 2 | 9.30 | 0.608 | 0.027 | 0.03 | 21.6 | 8 | 530 |
| CP | 99.6 | 2.7 | 9.40 | 1.112 | 0.025 | 0.05 | 5.3 | 8.2 | 594.6 |
| AV | 95.4 | 2.3 | 9.30 | 0.818 | 0.026 | 0.04 | 14.8 | 8.1 | 556.9 |
| M9 | WP | 82.9 | 1.4 | 22.90 | 0.771 | 0.074 | 0.08 | 20 | 7.9 | 446.6 |
| CP | 87 | 1.9 | 23.40 | 1.500 | 0.079 | 0.17 | 4.6 | 8 | 480 |
| AV | 84.6 | 1.6 | 23.10 | 1.075 | 0.076 | 0.12 | 13.6 | 7.9 | 460.5 |
| M10 | WP | 97.3 | 2.4 | 8.90 | 0.412 | 0.014 | 0.03 | 20.9 | 8 | 503 |
| CP | 79.4 | 3.2 | 8.80 | 0.274 | 0.010 | 0.03 | 5.9 | 8.1 | 562 |
| AV | 89.8 | 2.7 | 8.80 | 0.355 | 0.012 | 0.03 | 14.6 | 8 | 527.6 |
| M11 | WP | 57.1 | 2.7 | 23.40 | 0.545 | 1.043 | 0.06 | 18.6 | 8.2 | 1285.3 |
| CP | 85.4 | 3.4 | 12.80 | 2.186 | 0.562 | 0.10 | 5 | 8.3 | 1278.2 |
| AV | 68.9 | 3 | 19.00 | 1.228 | 0.842 | 0.08 | 13.1 | 8.2 | 1282.3 |
| | Limit values according to Serbian Regulations [49] | | |
| Class I | 90–110 | 2 | 25 | 1 | 0.02 | 0.1 | - | 6.5–8.5 | <1000 |
| Class II | 70–90 | 5 | 25 | 2 | 0.1 | 0.3 | - | 6.5–8.5 | 1000 |
| Class III | 50–70 | 7 | - | 8 | 0.2 | 0.6 | - | 6.5–8.5 | 1500 |
| Class IV | 30–50 | 25 | - | 15 | 0.5 | 1.5 | - | 6.5–8.5 | 3000 |
| Class V | <30 | >25 | - | >15 | >0.5 | >1.5 | - | <6.5 or <8.5 | >3000 |
Table 2.
Preference flows.
Table 2.
Preference flows.
| | CP | WP | AV |
|---|
| Location | Phi+ | Phi- | Phi Net | Phi+ | Phi- | Phi Net | Phi+ | Phi- | Phi Net |
|---|
| M1 | 0.3814 | 0.2972 | 0.0841 | 0.4057 | 0.2587 | 0.1470 | 0.4130 | 0.2383 | 0.1747 |
| M2 | 0.4592 | 0.2466 | 0.2126 | 0.4271 | 0.2178 | 0.2093 | 0.4197 | 0.2296 | 0.1901 |
| M3 | 0.5251 | 0.1822 | 0.3429 | 0.3615 | 0.2948 | 0.0667 | 0.4100 | 0.2253 | 0.1847 |
| M4 | 0.2439 | 0.5037 | −0.2598 | 0.2321 | 0.5123 | −0.2801 | 0.2126 | 0.5259 | −0.3333 |
| M5 | 0.2442 | 0.5942 | −0.3500 | 0.3598 | 0.4736 | −0.1138 | 0.3591 | 0.5329 | −0.1738 |
| M6 | 0.2822 | 0.4714 | −0.1893 | 0.2584 | 0.4853 | −0.2270 | 0.2171 | 0.4886 | −0.2715 |
| M7 | 0.4549 | 0.2875 | 0.1674 | 0.3859 | 0.3858 | 0.0001 | 0.3203 | 0.4171 | −0.0968 |
| M8 | 0.5492 | 0.2111 | 0.3382 | 0.4742 | 0.2592 | 0.2151 | 0.5389 | 0.2381 | 0.3008 |
| M9 | 0.4092 | 0.3032 | 0.1060 | 0.3690 | 0.3075 | 0.0615 | 0.4233 | 0.2829 | 0.1404 |
| M10 | 0.4058 | 0.3972 | 0.0086 | 0.5379 | 0.2165 | 0.3215 | 0.5111 | 0.2190 | 0.2921 |
| M11 | 0.1406 | 0.6014 | −0.4608 | 0.1877 | 0.5878 | −0.4001 | 0.1573 | 0.5847 | −0.4474 |
4.2. GAIA Analysis
The GAIA plane for the overall AV scenario is shown in
Figure 5. The alternatives (M1-M11) are represented in the figure by separate light blue squares, while the ranking criteria are connected to the fictitious coordinate start and are represented by dark blue rhombuses. The quality of the information displayed within the obtained GAIA plane is 76.8% (which is above the average 70%) so it is considered to be valid for further analysis.
The analysis of GAIA plane identifies the most important criteria that affect the quality of water. Criteria located very close to the beginning of the GAIA coordinate plane, such as NH4-N criterion, have a small impact on the ranking results. According to GAIA analysis, locations that are closer to the orientation of the axis of each individual criterion are better than others according to that criterion. Decision stick (presented as red pointer in the GAIA plane) points to a compromising solution. Those locations closer to the decision stick are good by most criteria so based on the results (
Figure 5) those locations are M3, M2, M1, M9, and M7, which classifies them as better-ranked locations than others according to the criteria of EC, BOD-5, pH, NH4-N, and T. On the other hand, GAIA analysis identified the same locations as the ones with increased SM parameter content, which reduces water quality at these locations and is likely to lead to a number of adverse effects on aquatic ecosystems, as well as a decline in water self-purification capacity. A higher presence of SM parameter is usually registered after heavy rainfall, floods, as well as after the discharge of untreated wastewater directly into the river, so that should be further explored. Locations M5, M8, and M10 are positioned towards SM criterion line, pointing to lower concentrations of this parameter and thus better water quality. It can be noticed that these locations are also better than others in terms of N, OS, and PO4-P criteria, while locations M4 and M11, conversely, as being located opposite to these three criteria in GAIA plane, are worse than others in regard to the given parameters.
Locations M6, M4, and M11 are placed opposite to the decision stick, which clearly indicates that these locations are the worst ranked locations according to most of the given criteria. Further analysis on identified critical locations using the GAIA web graphs should reveal more precise information about the linkage between the criteria and their possible conflicts.
4.3. GAIA Web
In order to reveal more information on critical actions (locations M6, M4, and M11), they were further explored within GAIA web visual presentation. GAIA web shows the position of the decision stick (marked as PI), as well as a dotted circle corresponding to the multicriteria net flow score of the actions (it is green when Phi net is positive and red otherwise). Different criteria are also connected with a drawn polygon.
GAIA web for location M6 (see
Figure 6) clearly indicates that the parameters of N, PO4-P, pH, and EC are criteria of concern, meaning that these parameters influence the overall AV quality of water to decrease at this location and accordingly rank location M6 worse than other locations. When WP period is observed, it can be seen that parameter N has a very good preference score, meaning that the content of N in water at this location is significantly lower compared to CP and AV periods. On the other hand, GAIA web for the CP period at the same location (M6), points to a very good preference score for OS parameter, indicating a higher content of OS in the water at this location.
GAIA web for the location M4 (see
Figure 6) shows that parameter T is with the strongest preference score in the overall AV period, ranking it better than other locations according to this parameter solely. However, afterwards, observing WP and CP separately at this location, it appears clear that parameter OS is the reason why previous GAIA analysis singled out this location among others as the weak one. Namely, the content of OS in water at this location is very low, so it contributes to poor water quality at this location.
Parameters of PO4-P and pH are criteria of concern at location M11, meaning that these parameters influence the overall AV quality of water to decrease at this location. Observing WP and CP in addition (see
Figure 6), parameter of OS stands out as a weak one in CP and criteria of concern. Nevertheless, all three scenarios for the location M11 expose the weak preference scores at this location, which consequently puts M11 location into an undesirable position to all other locations, thus ranking it as the worst one.
4.4. Results of Physical-Chemical Analyses and Comparison with Limit Values of Water Quality Parameters
The results of performed physical-chemical analyses of water samples in Tisa Basin in Serbia, i.e., the calculated values of parameters for the WP, CP, and AV periods, are compared with the limit values of quality classes prescribed by the Regulation on limit values of pollutants in surface and groundwater and sediment [
49] (see
Table 1). Deviations are discussed below, for each parameter used in turn.
During the warm period of the year (WP), increased biological activity causes a significant decrease in concentrations of oxygen dissolved in water (OS), which puts water quality into lower classes (II and III) on most locations observed.
Total inorganic nitrogen represents the sum of nitrites and nitrates expressed in mg/L. Increased values of nitrate concentrations in water indicate wastewater as a source of pollution. Increased nitrite concentrations, on the other hand, are a clear indicator of intense mineralization and hypoxia. Elevated nitrate contents, as well as higher concentrations of ammonia (NH4-N), are usually taken as an indicator of fecal contamination. Exceeding in content of N parameter is noticed at almost every location in both WP and especially CP period of the year (except location M10), classifying water quality into classes II and III along the Tisa Basin. Ammonia (NH4-N) concentrations have a better trend, placing water quality in classes I and II, while only into class III at location M5.
Suspended solids (SM) reach the water from the soil rinse or by the erosive action of water in watercourses. Their content in the water primarily depends on the average sunny days of the year. The harmful effect of SM depends on their chemical composition, that is why it is only indicative to what extent they represent harmful sources of pollution. Generally, calculated values of this indicator put water quality into classes II to V, along the observed basin.
Concentrations of biological oxygen consumption (BOD-5) in rivers provide a measure of surface water status in terms of biodegradable organic load. It is the basic indicator of surface water pollution by organic matter. Exceedance of class I regarding this indicator is evident at all observed locations (except M9) which clearly indicate organic pollution source.
Electrolytic conductivity of water (EC) indicates the degree of mineralization of water. Any deviation from the usual values raises the suspicion of pollution. Locations M4, M6, and M11 are thus shown critical with evident exceeding, putting water quality into lower class of water quality (class III) at these locations.
Concentration of orthophosphates (PO4-P) in rivers enables the assessment of the state of surface waters in terms of nutrient concentration. It is used to show the spatial and temporal variation of nutrients. The most significant source of orthophosphates pollution comes from municipal and industrial wastewater. According to the official report of the Environmental Protection Agency of the Republic of Serbia for the given year [
50], the overall quality of river waters in the Republic of Serbia, in terms of orthophosphates, does not meet the prescribed limit values at 14 measuring points in Serbia (which represents 25% of total water bodies), where the worst situation is observed in the basin of the Tisa River, especially emphasizing the location M11 with an unfavorable (growing) trend. This is in complete agreement with the results obtained using GAIA analysis in this paper, especially GAIA web graphs, which verifies the application of the proposed approach. Nevertheless, calculated values for PO4-P in WP, CP, and AV period (
Table 1) at location M11 are 1.043, 0.562, and 0.842 mg/L, respectively, which clearly puts water quality into class V as very poor water quality class according to Serbian Regulations [
49], indicating that immediate measures for remediation should take place.
The results of the analysis indicate seasonal deviations from the prescribed limit values for the majority of the observed parameters, thus putting water quality into lower classes (II–V) at almost every location in the basin. Evident exceeding of class I of EC, OS, total N, and PO4-P parameters, especially at locations M4, M6, and M11, suggest that diffuse sources of pollution of anthropogenic origin (agriculture, artificial fertilizers, and wastewater discharges) significantly affect changes in water quality of the Tisa River Basin in Serbia.
4.5. Discussion
Based on the presented results, it can be stated that the water quality in the Tisa River Basin is endangered mainly by:
- -
relatively low concentrations of dissolved oxygen (especially during the warm period);
- -
high BOD-5 values;
- -
high content of suspended solids;
- -
large amounts of nutrients (primarily orthophosphates).
The results presented in this study show that variations in water quality occur mainly under the influence of dissolved salts (from natural sources) and organic substances and nutrients from various anthropogenic sources, primarily agricultural production, wastewater discharges, and similar. Therefore, it is necessary to reduce the scope of intensified agricultural activity or introduce so-called “precision agriculture” which could in some way control the deterioration of water quality in the basin.
Apparently, the entire basin is also very sensitive to pollution due to urbanization, industrialization, and the largest DTD canal network in the basin, which is a significant source of indirect pollution of the Tisa River. Both PROMETHEE and GAIA analyses singled out location M11 as the most polluted location in the Basin, where this location is a part of the DTD system, and thus an indirect source of the Tisa River’s pollution. This leads to a clear conclusion that more attention needs to be paid to small watercourses (tributaries) that flow into the waters of the Tisa River in the basin.
Nevertheless, in order to maintain the water quality of the entire Tisa River Basin on the territory of Serbia at the required level, according to the requirements arising from the current regulations, it is necessary to constantly improve the monitoring system, identify both the main pollutants and sources of pollution, and respond in a timely manner.
5. Conclusions
Visual approach presented in this paper, using multicriteria PROMETHEE and GAIA methods, provided a detailed analysis of locations in the Tisa River Basin based on important parameters that are otherwise used to inform the public about the state of water resources quality. The analysis of water quality included scenarios for warm (summer), cold (winter), and average annual period. The obtained results are in accordance with the results of physical-chemical analyses regularly conducted by the official institutions [
40,
50] and complement them in a way that the Tisa River Basin in Serbia is comprehensively viewed with all significant tributaries and locations in one analysis, including both warm and cold period analyses, during the year. Such an approach provides official reports on the state of the watercourses and environment with additional important information.
The obtained results are significant from a practical standpoint for various purposes:
- -
using the PROMETHEE method, partial and complete ranking of locations can be performed;
- -
GAIA plane analysis expands the ranking by pointing to critical locations where water quality is out of balance for some reason;
- -
The possible reasons for the impaired water quality on such locations can be investigated in a more detail way using GAIA web graphs that reveal water quality variables of concern.
Results of the presented approach can be used for remediation of identified pollutants of the Tisa River Basin in Serbia. Various stakeholders, institutions, and policy makers interested in appropriate management of the Tisa River basin, not only in Serbia but also in all other countries of the basin, can benefit from it. Nevertheless, the applied approach can serve as a reliable basis for establishing future multidisciplinary strategies in water quality management.
Within the proposed approach, the critical locations with reduced/endangered water quality, as well as the specific parameters (causes) that affect the reduction of water quality at such locations can easily be identified, enabling the appropriate institutions to quickly take corrective action. This is a good way to contribute to the overall improvement of the quality of water resources, which is of great importance for the sustainable development of water resources as one of the most important natural resources on earth.


