
Hydraulic Numerical Simulations of La Sabana River Floodplain, Mexico, as a Tool for a Flood Terrain Response Analysis


Abstract
:1. Introduction
2. Materials and Methods
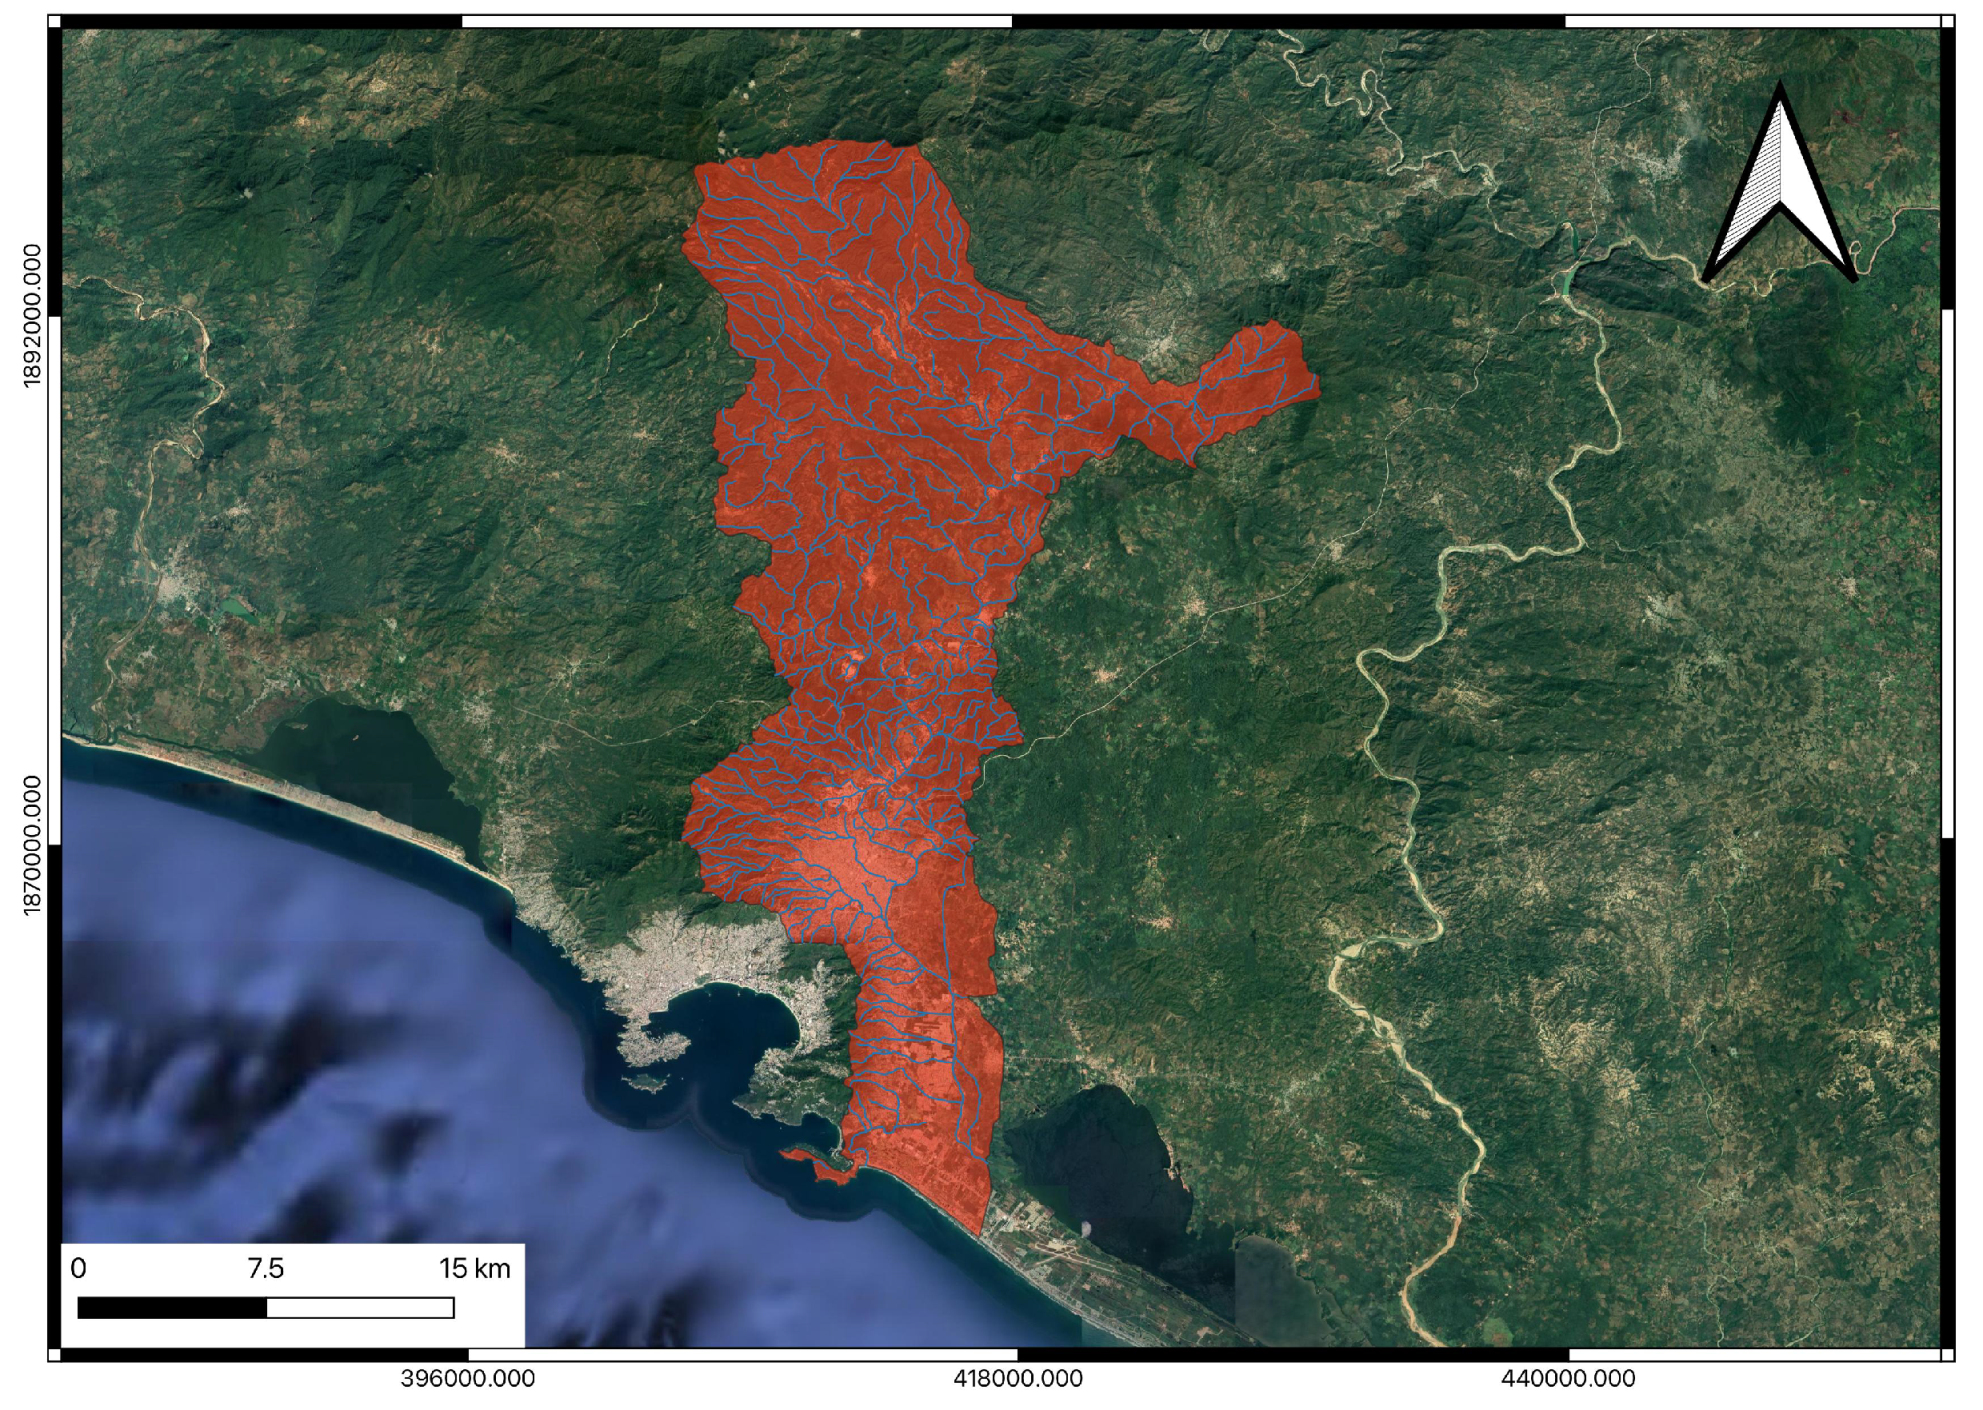
2.1. Study Area
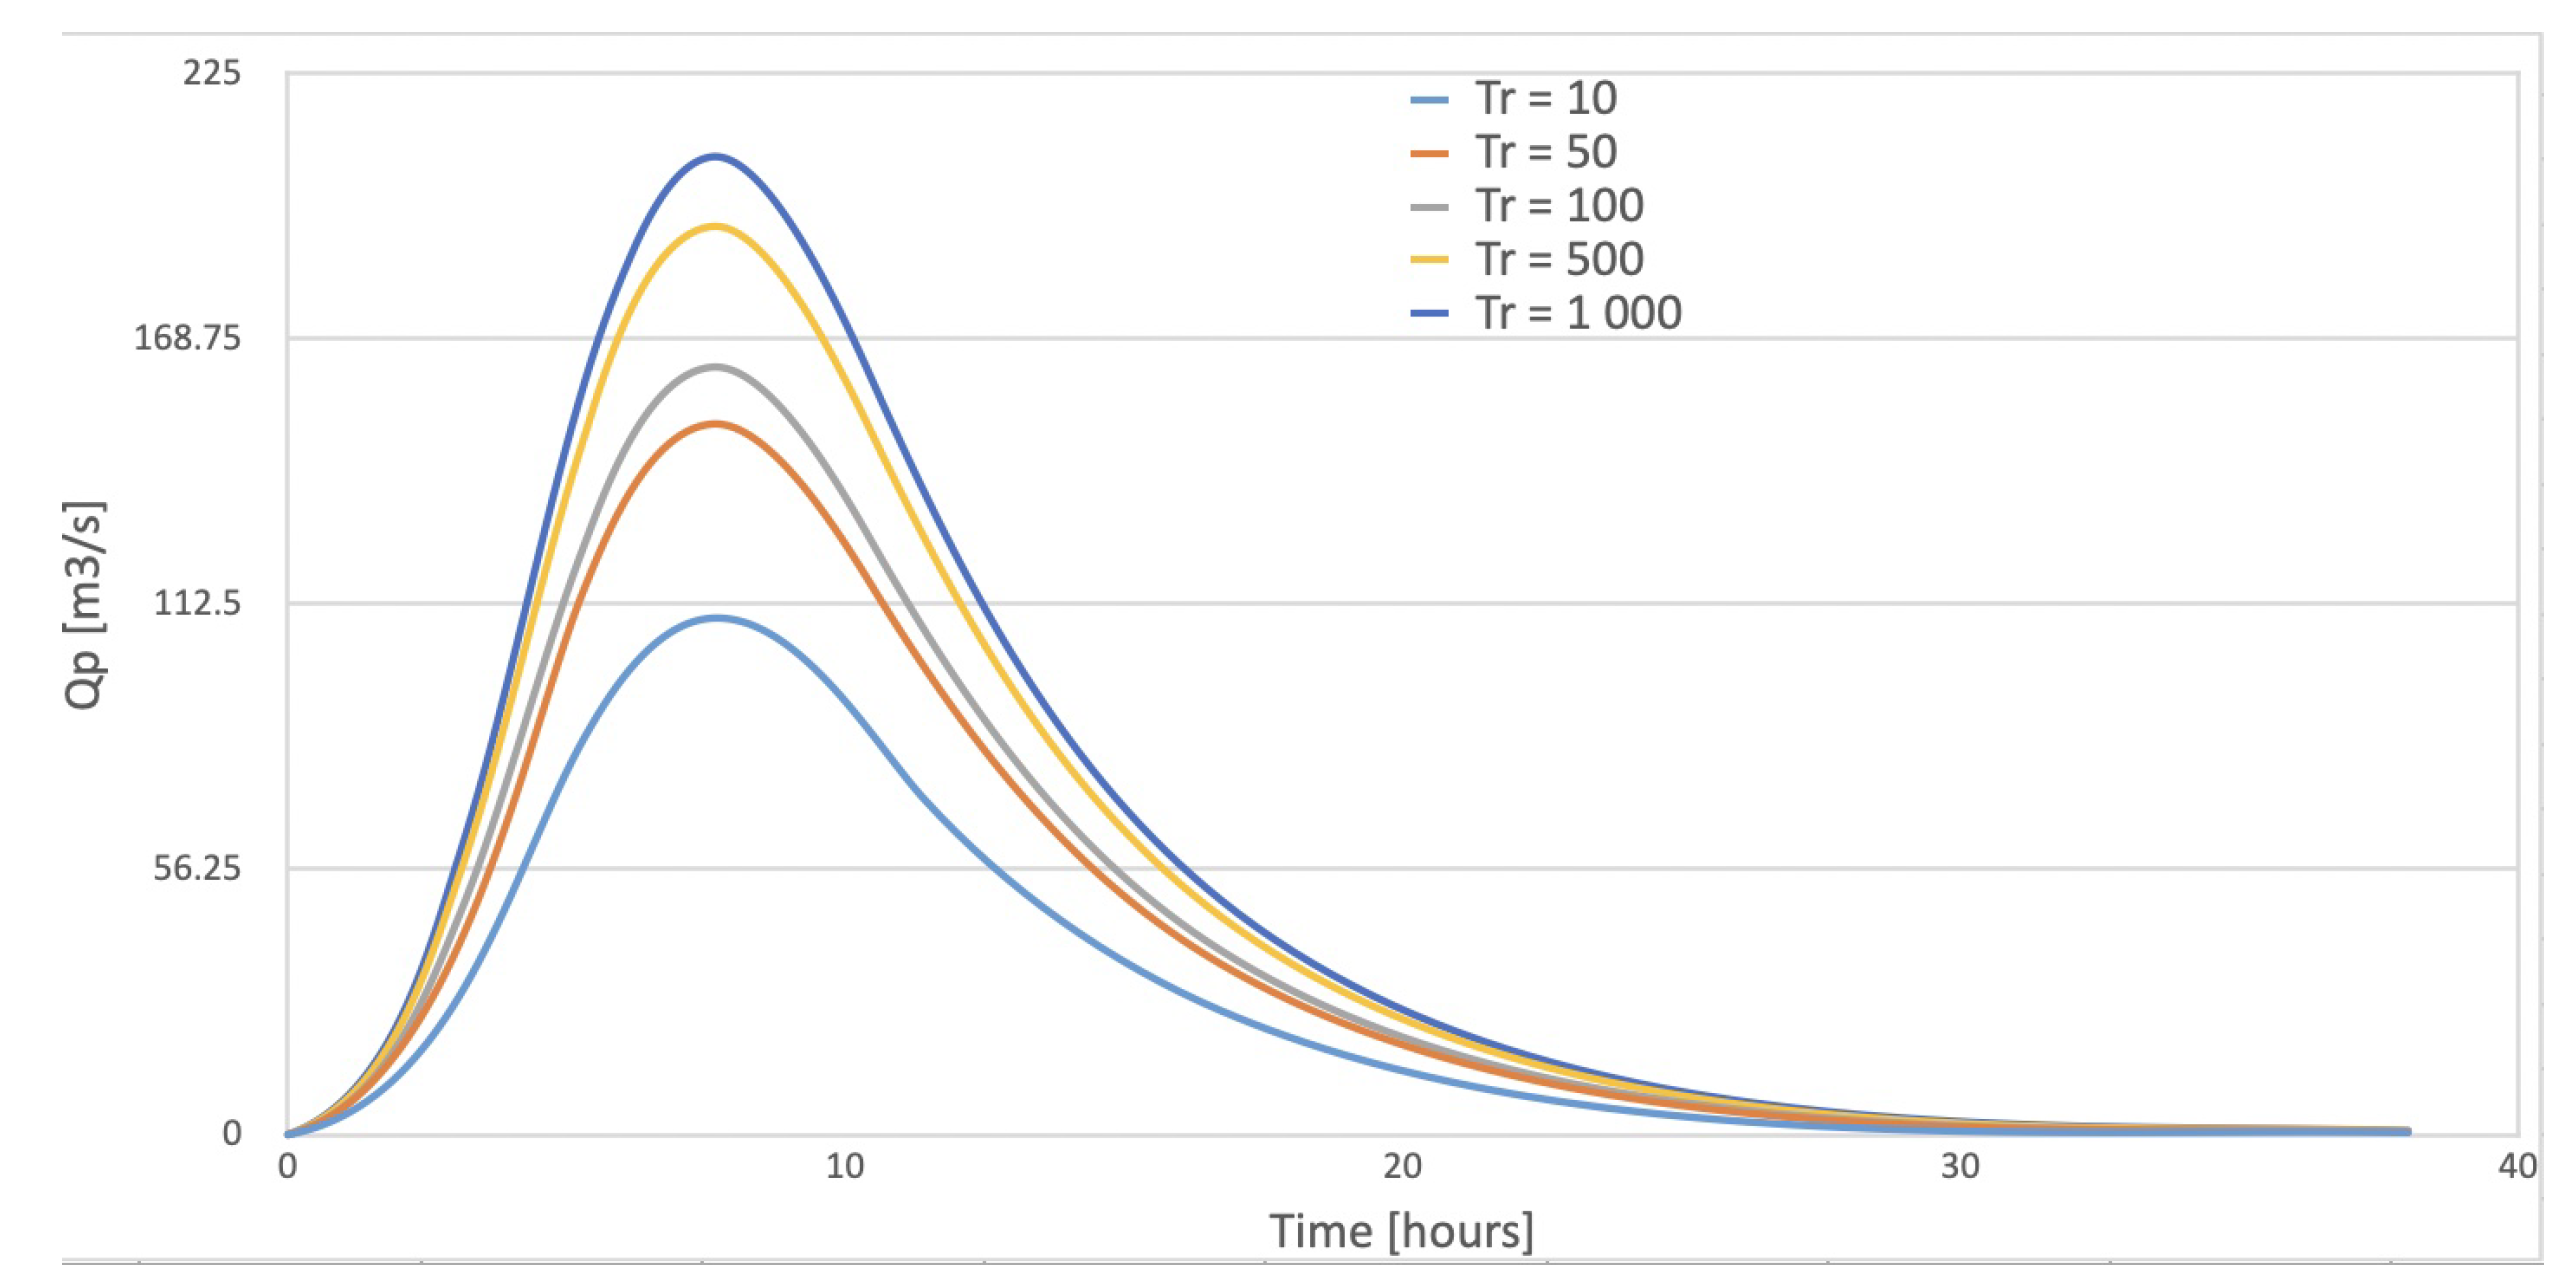
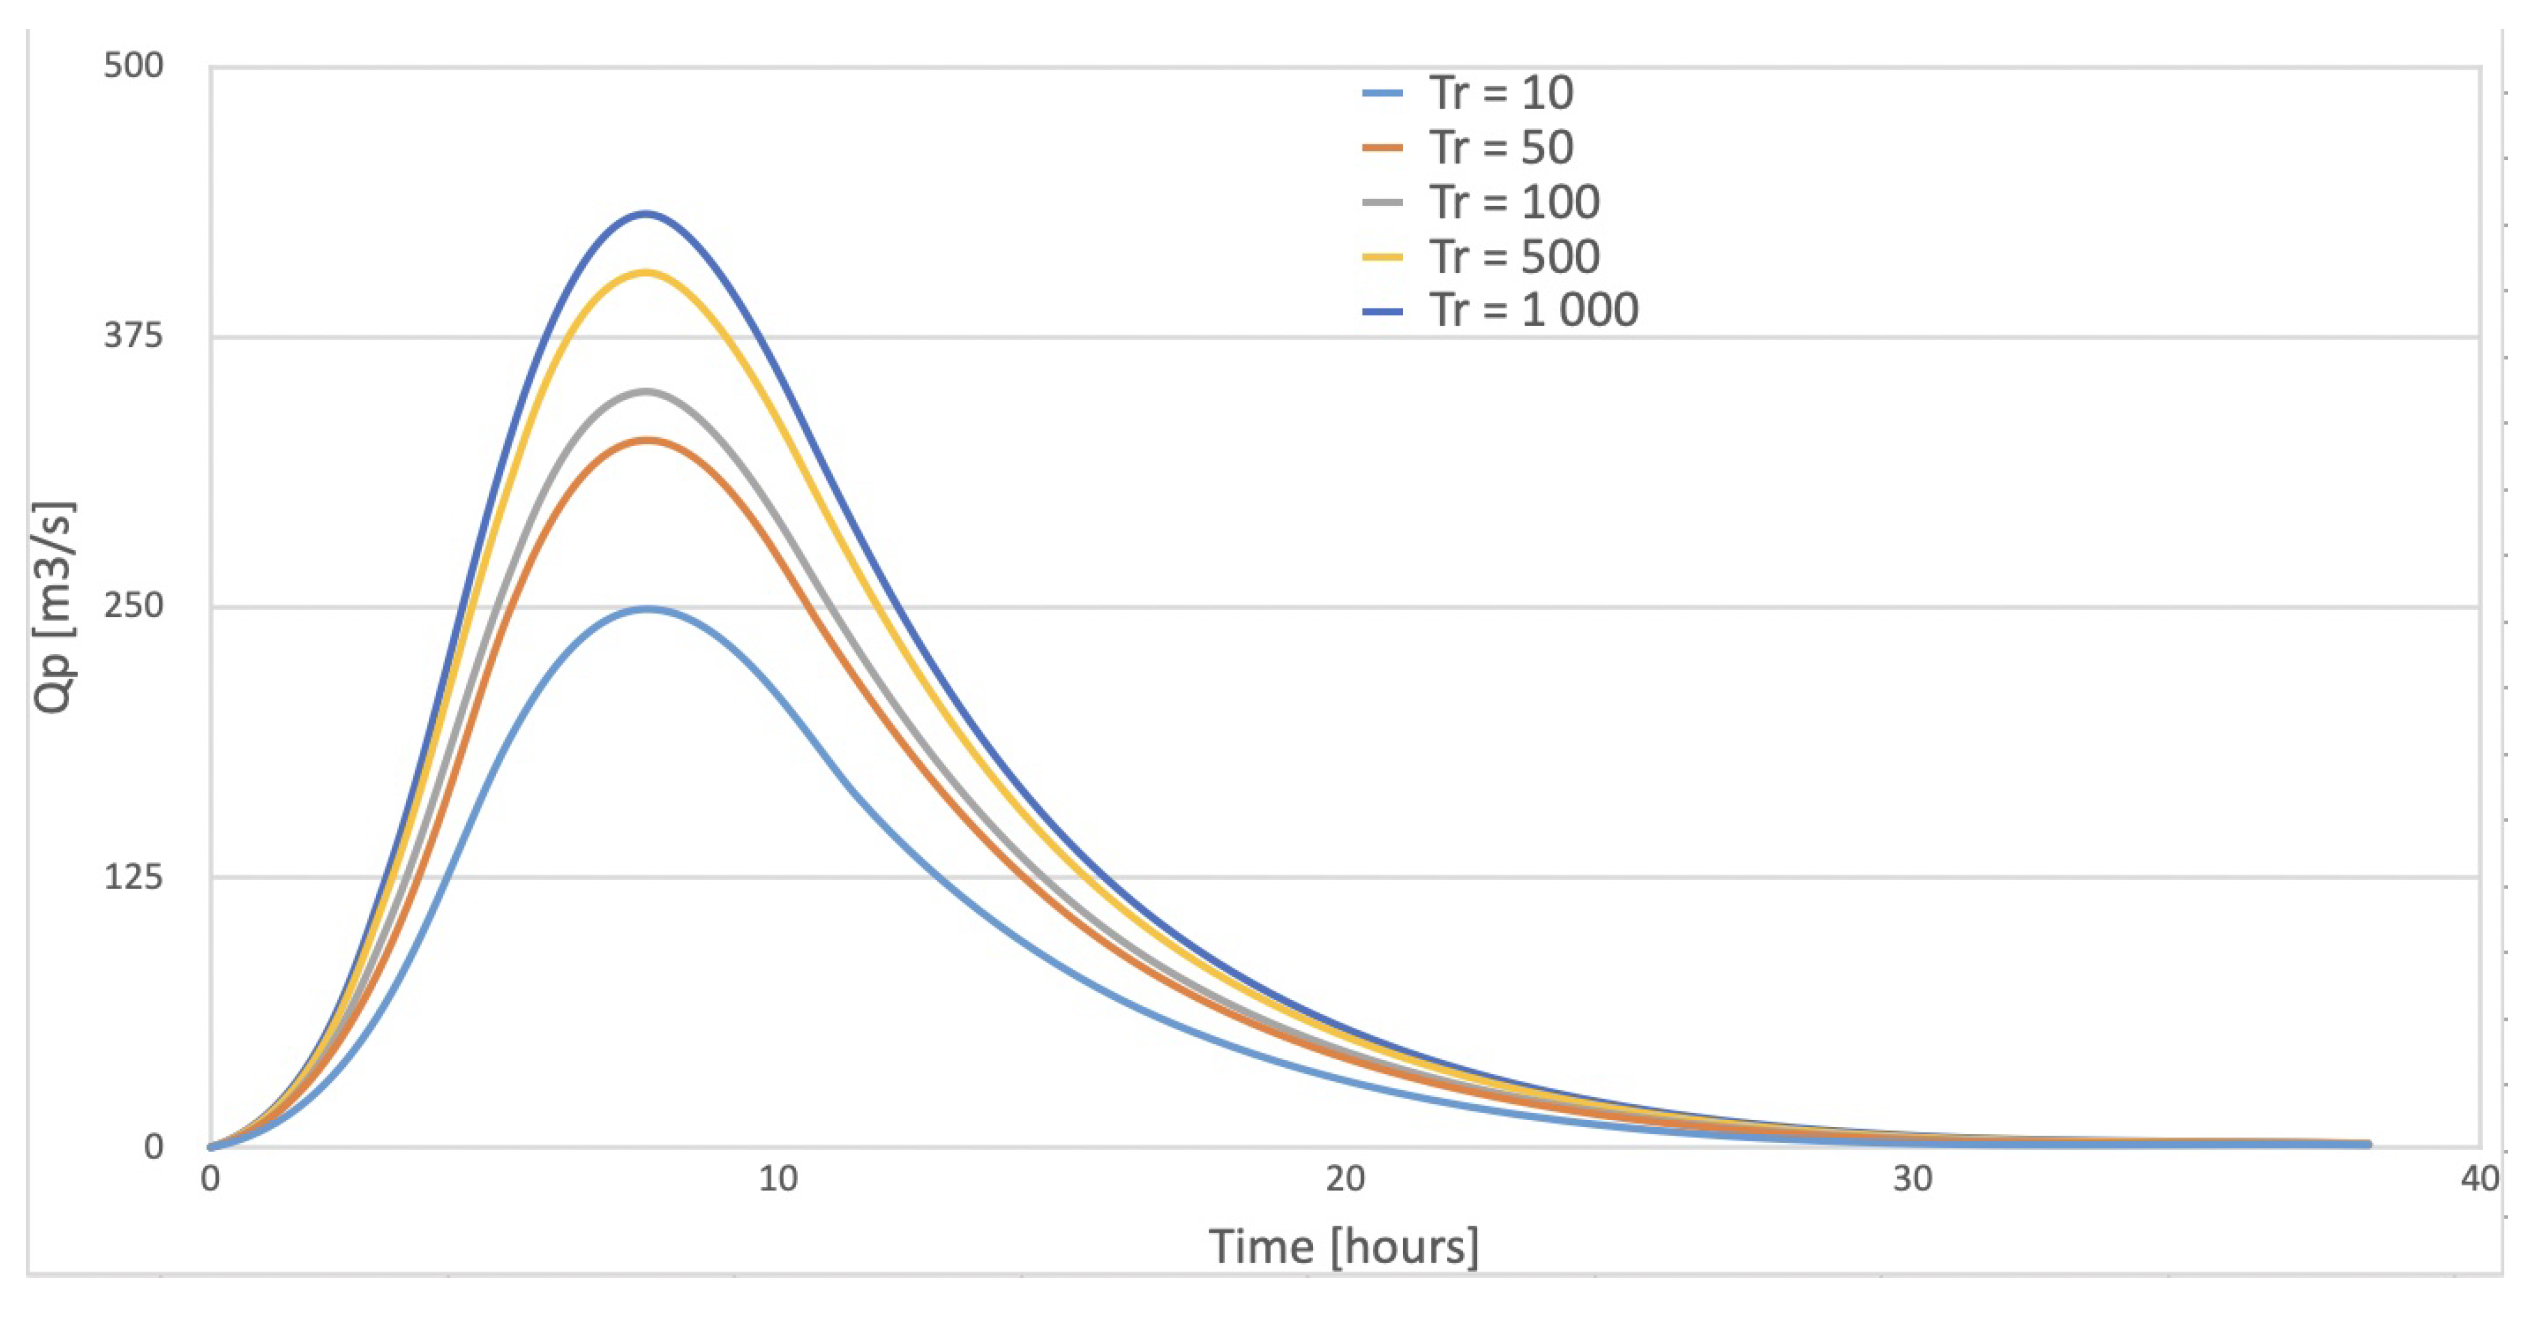
2.2. Estimation of Flood Discharges of La Sabana Catchment
2.3. Numerical Simulations of Inundation Scenarios
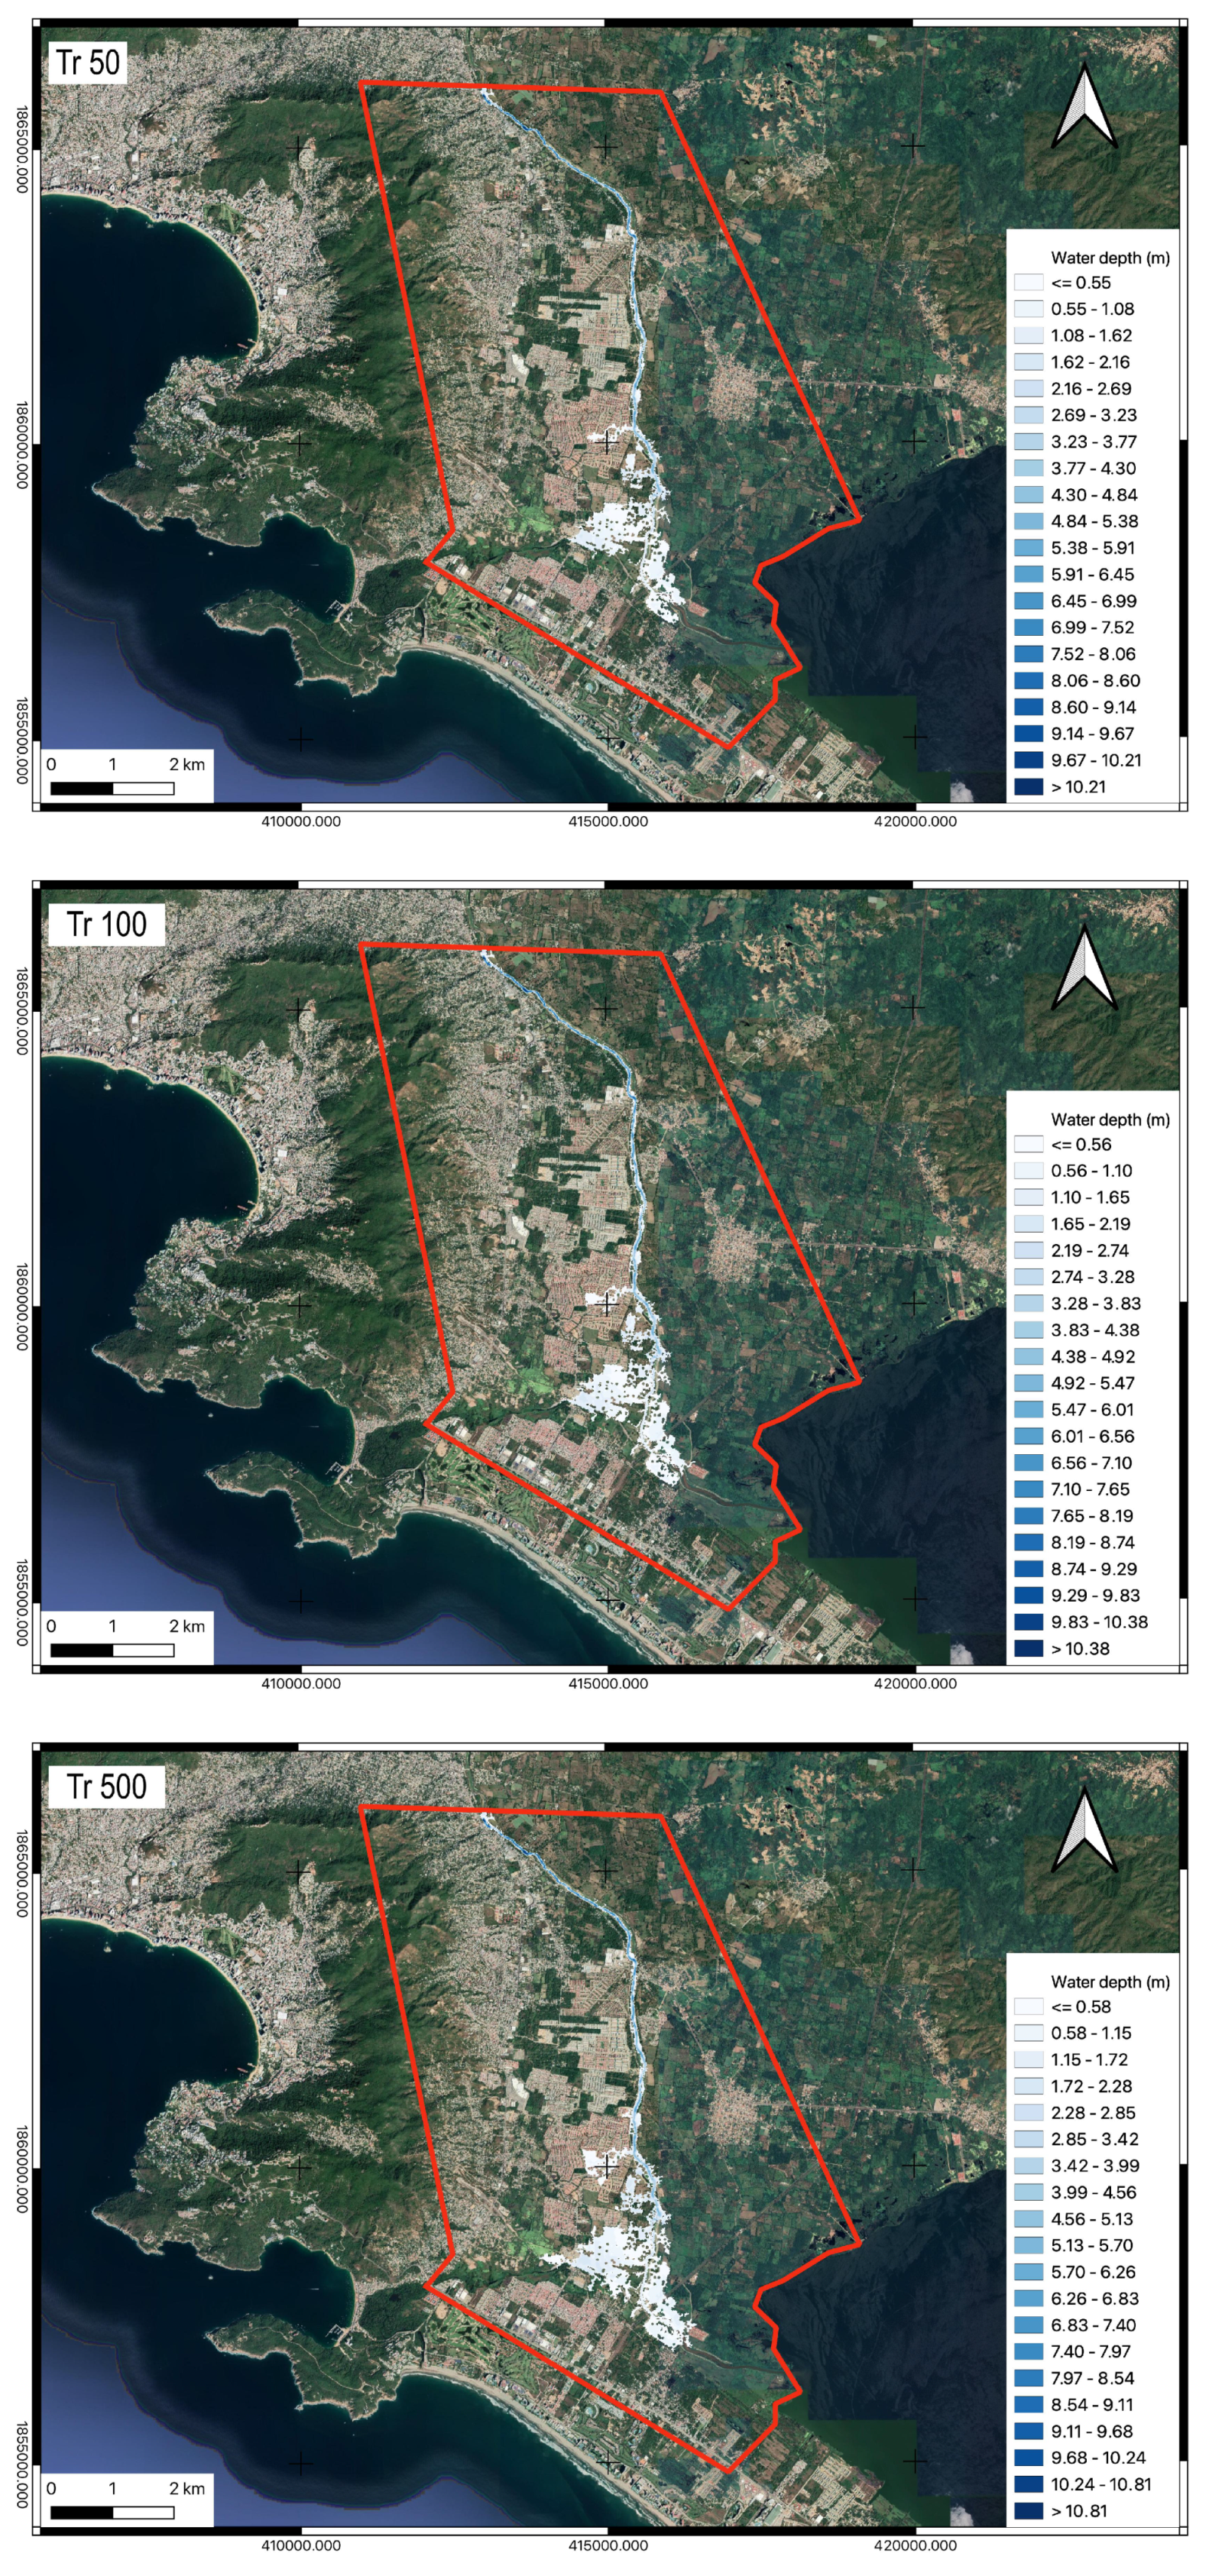
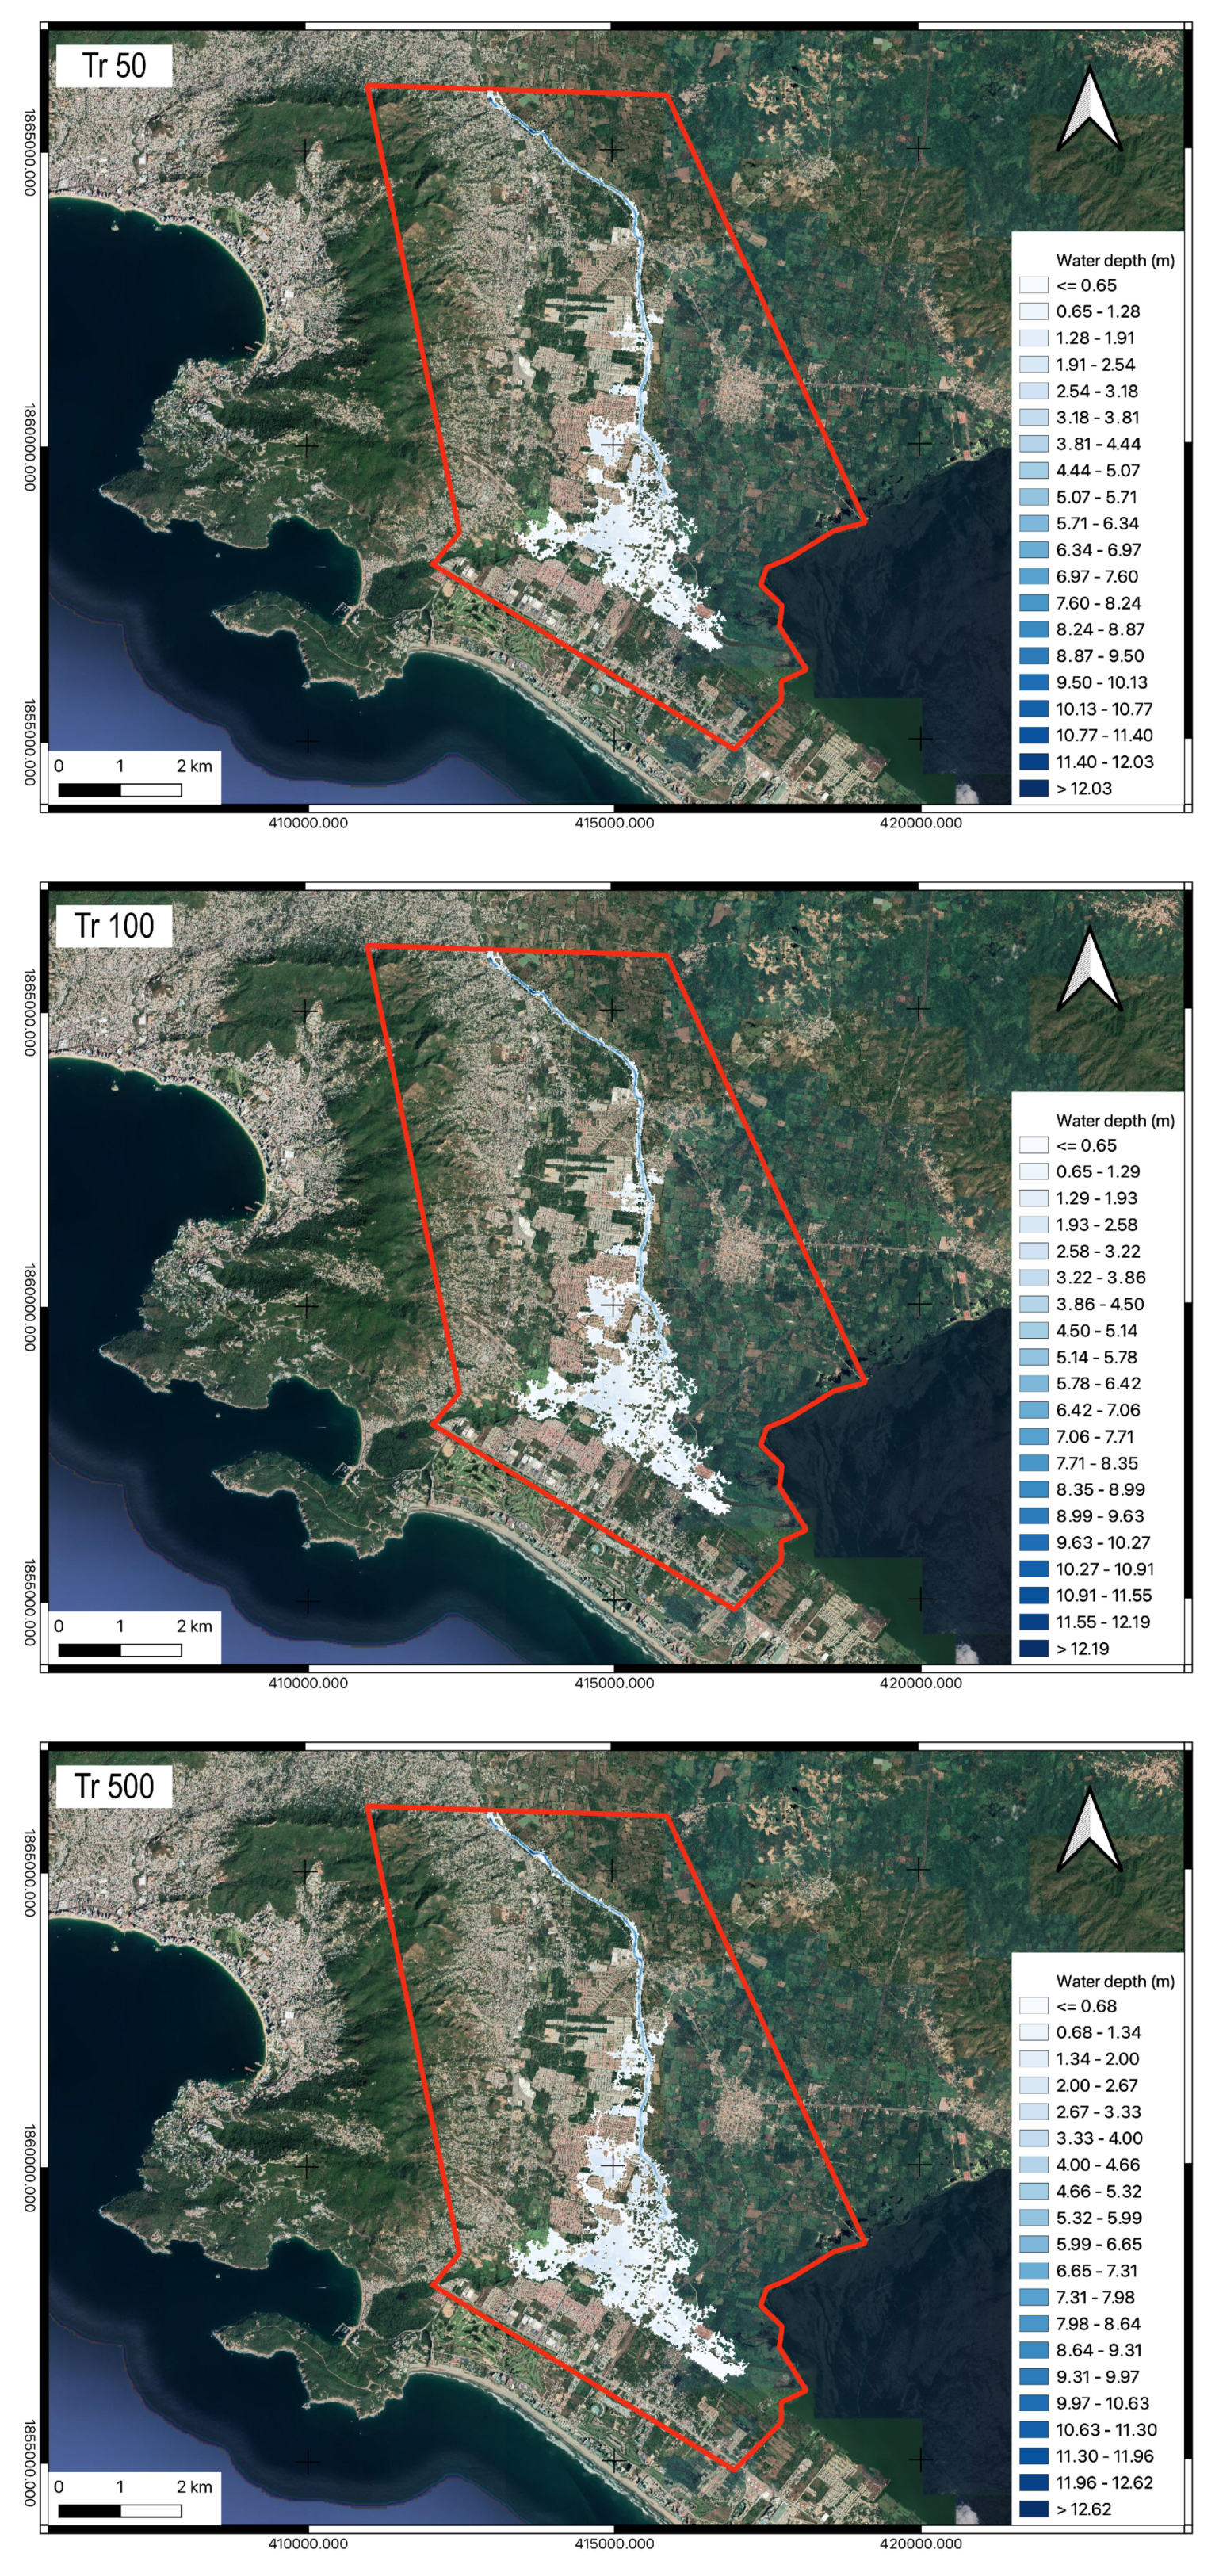
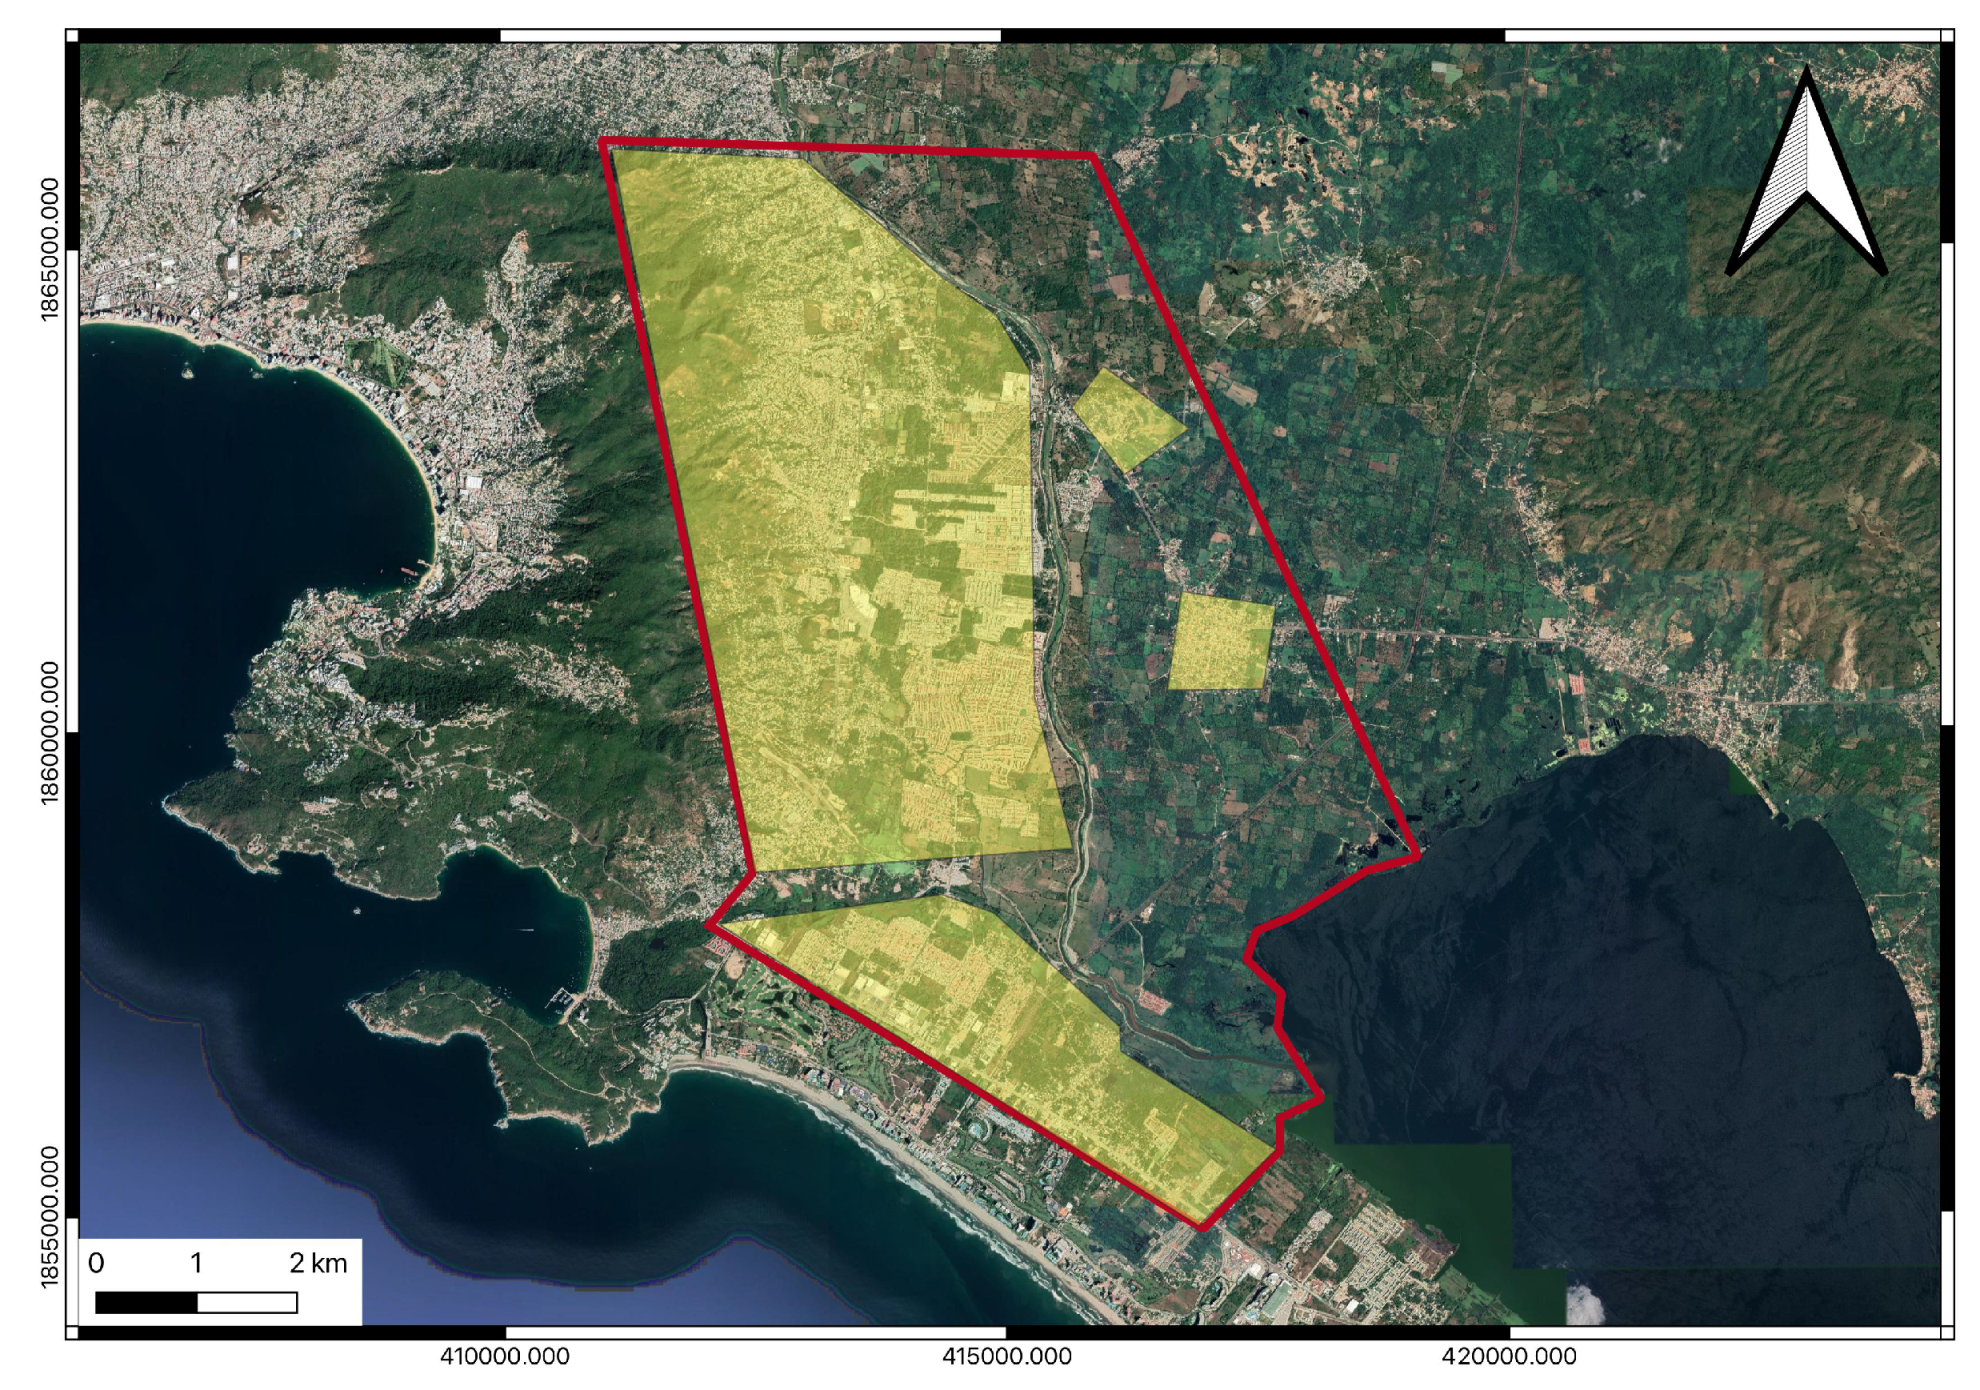
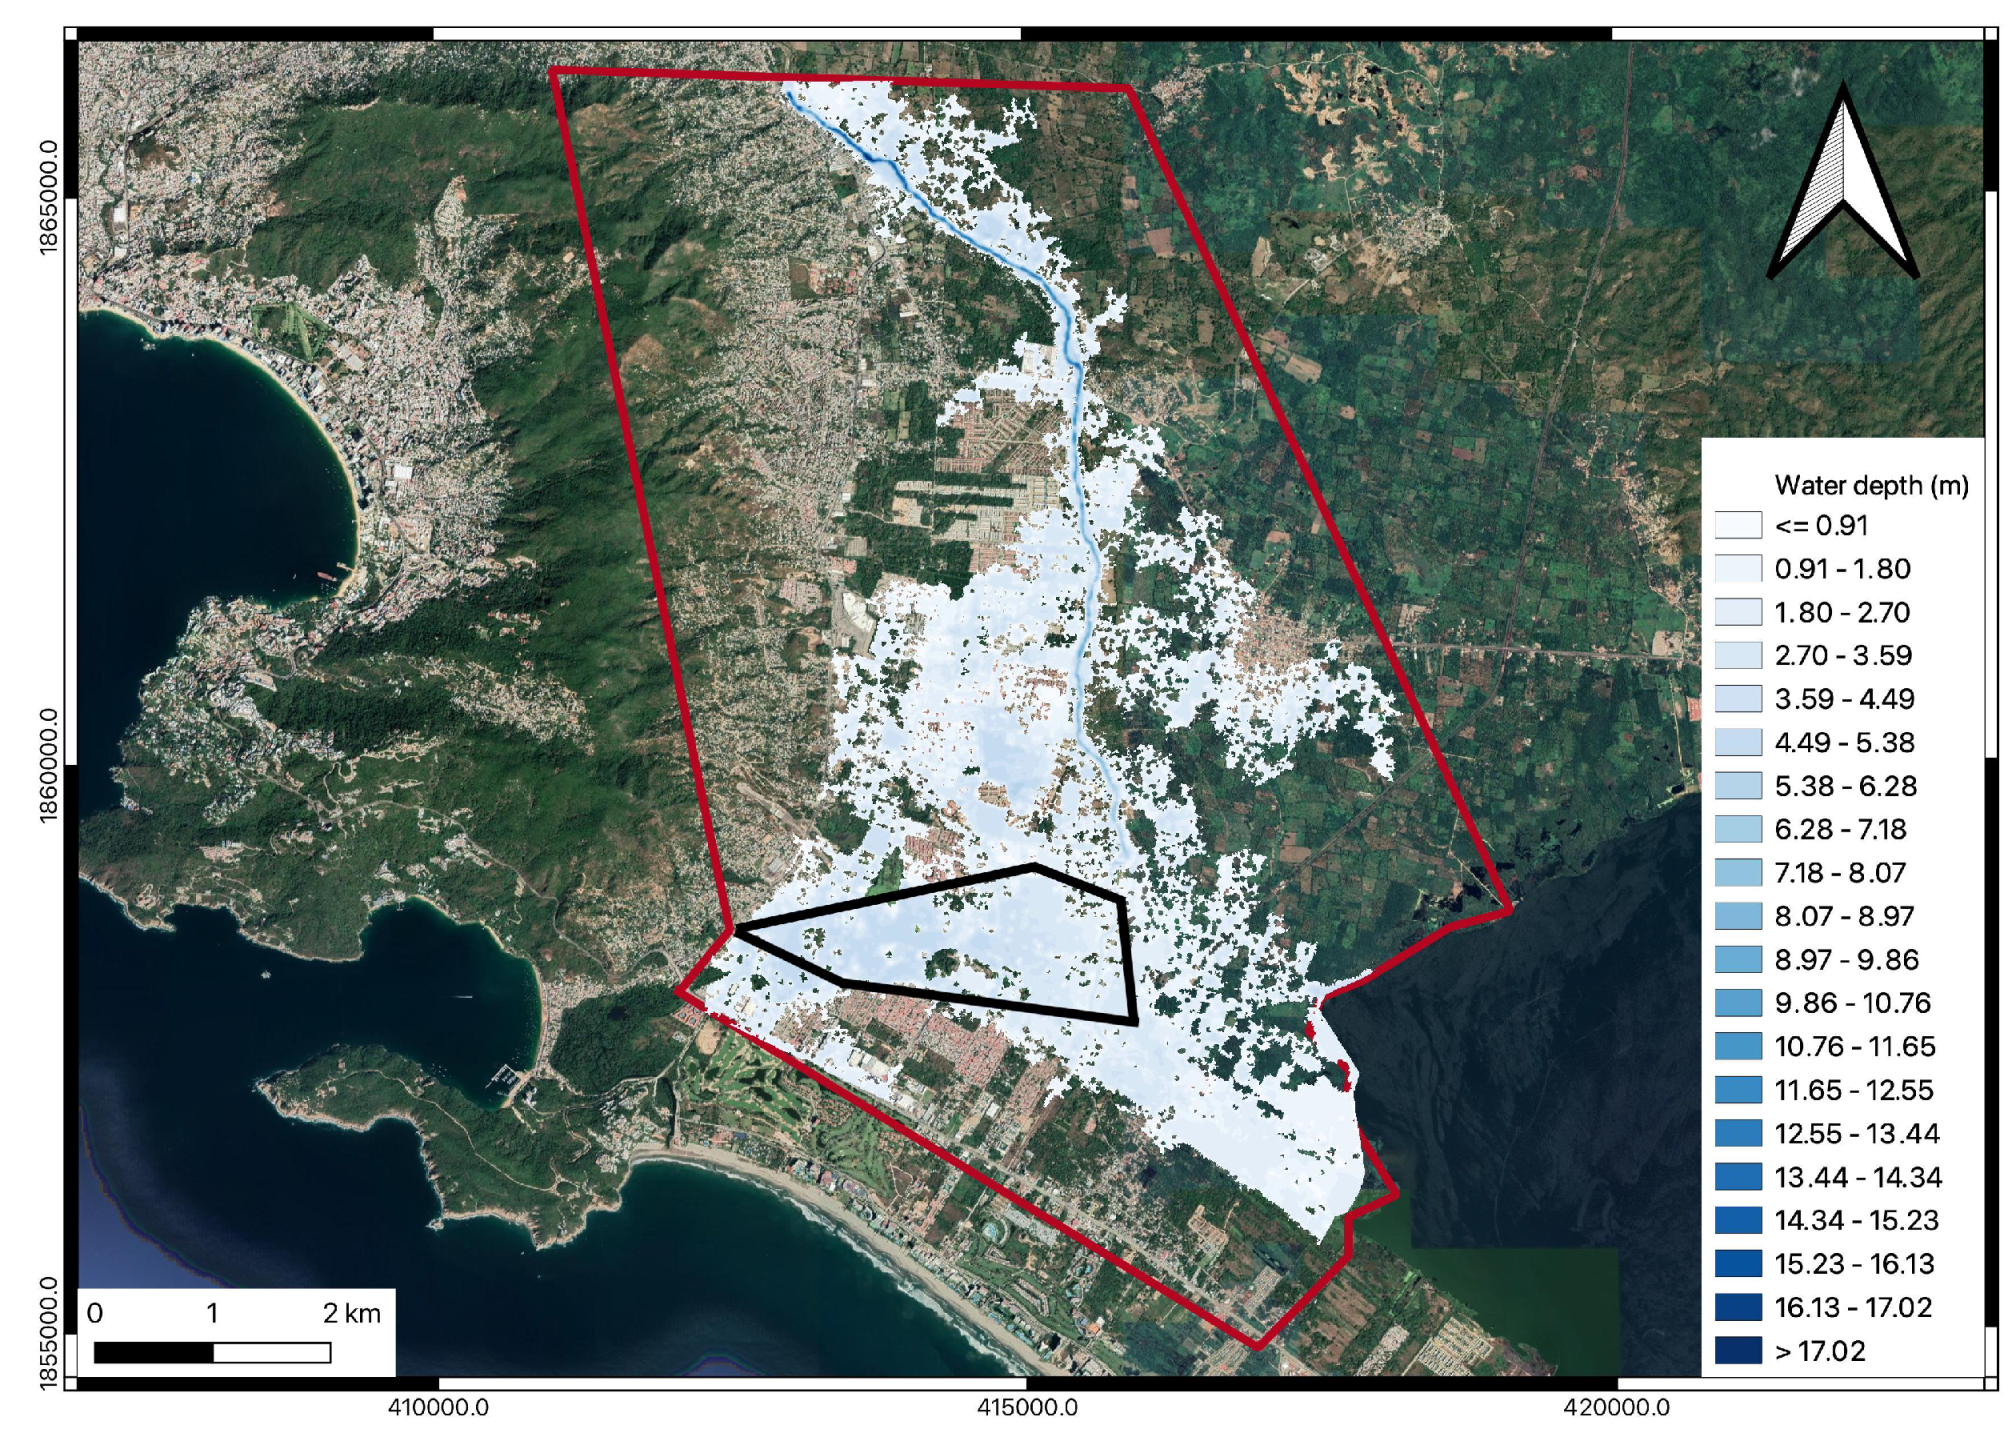
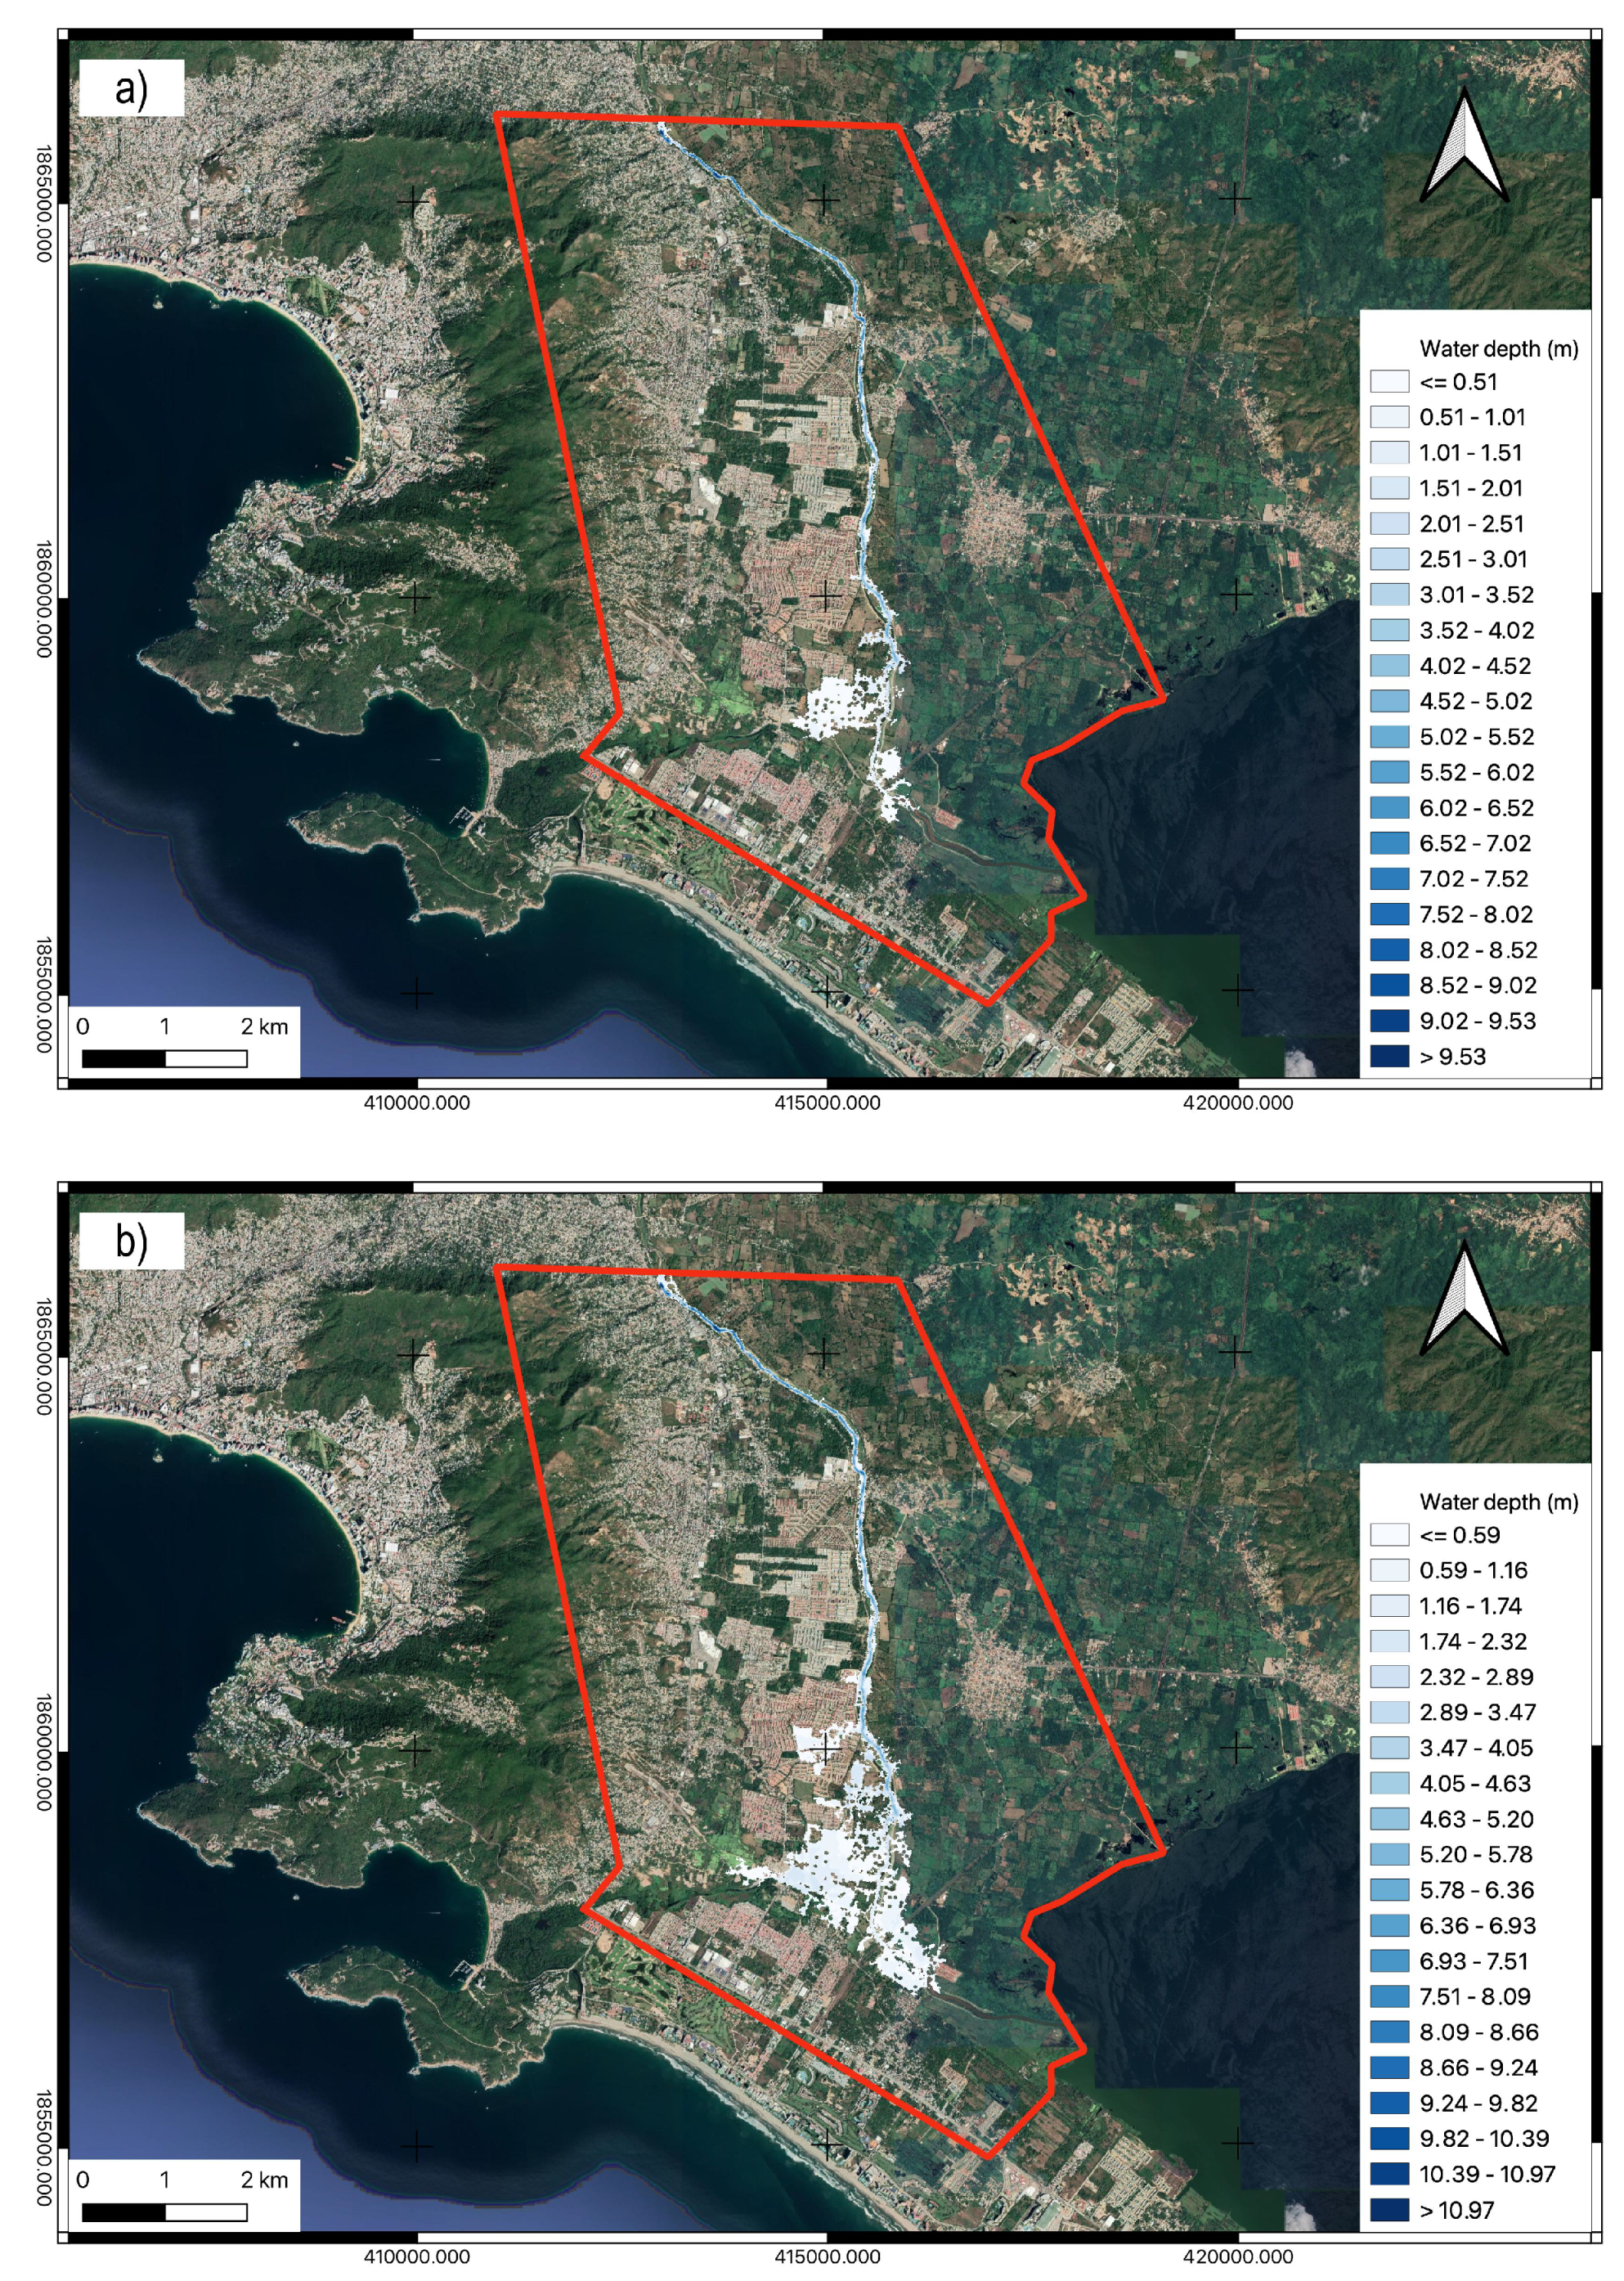
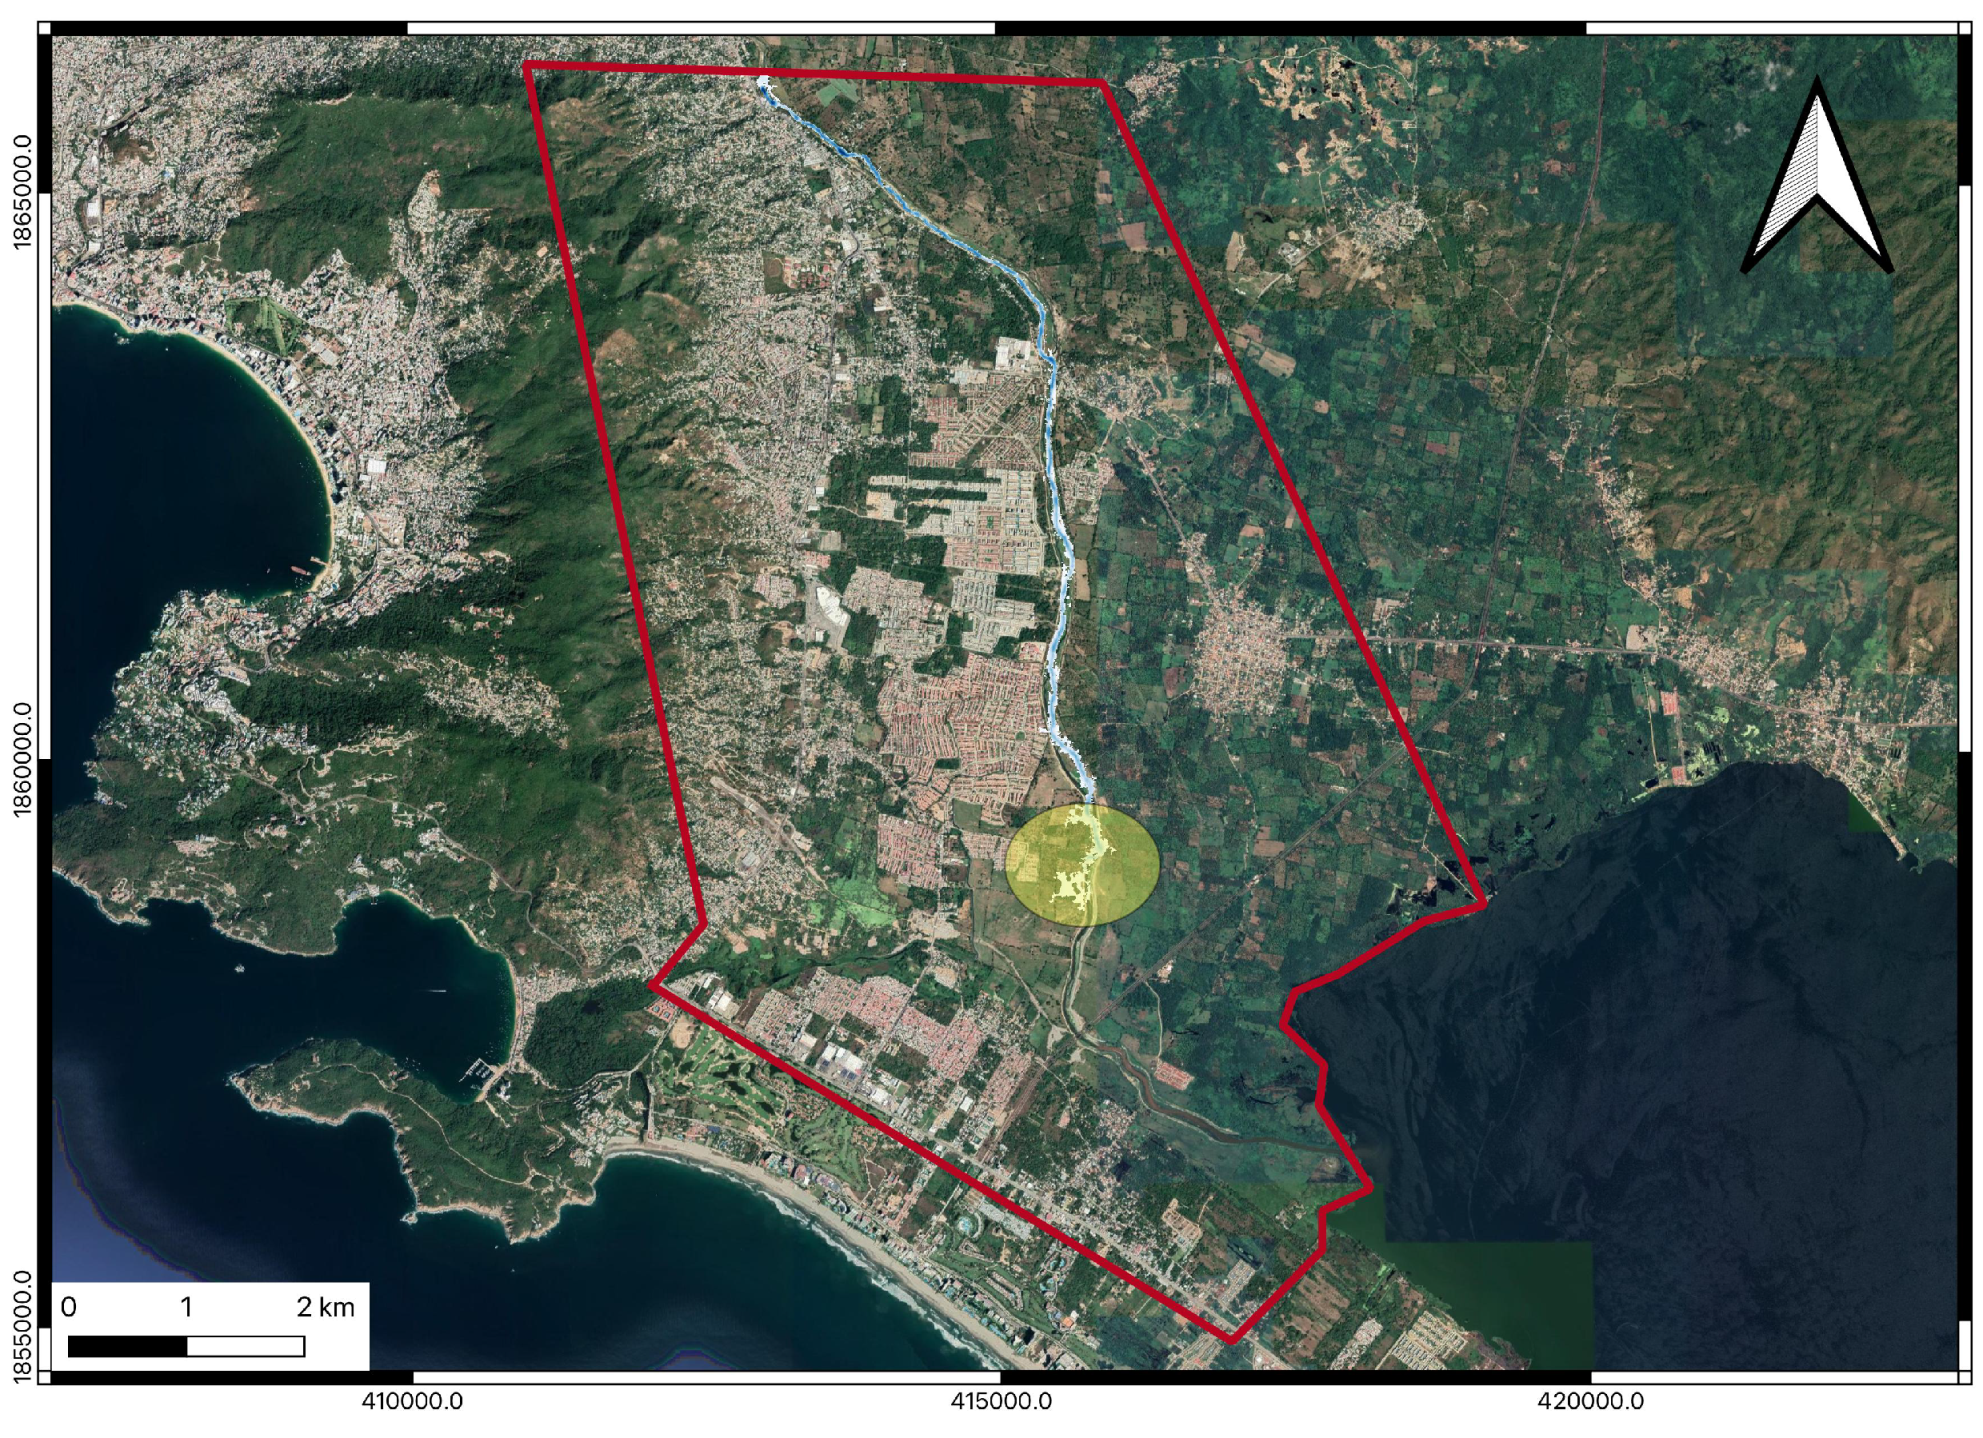
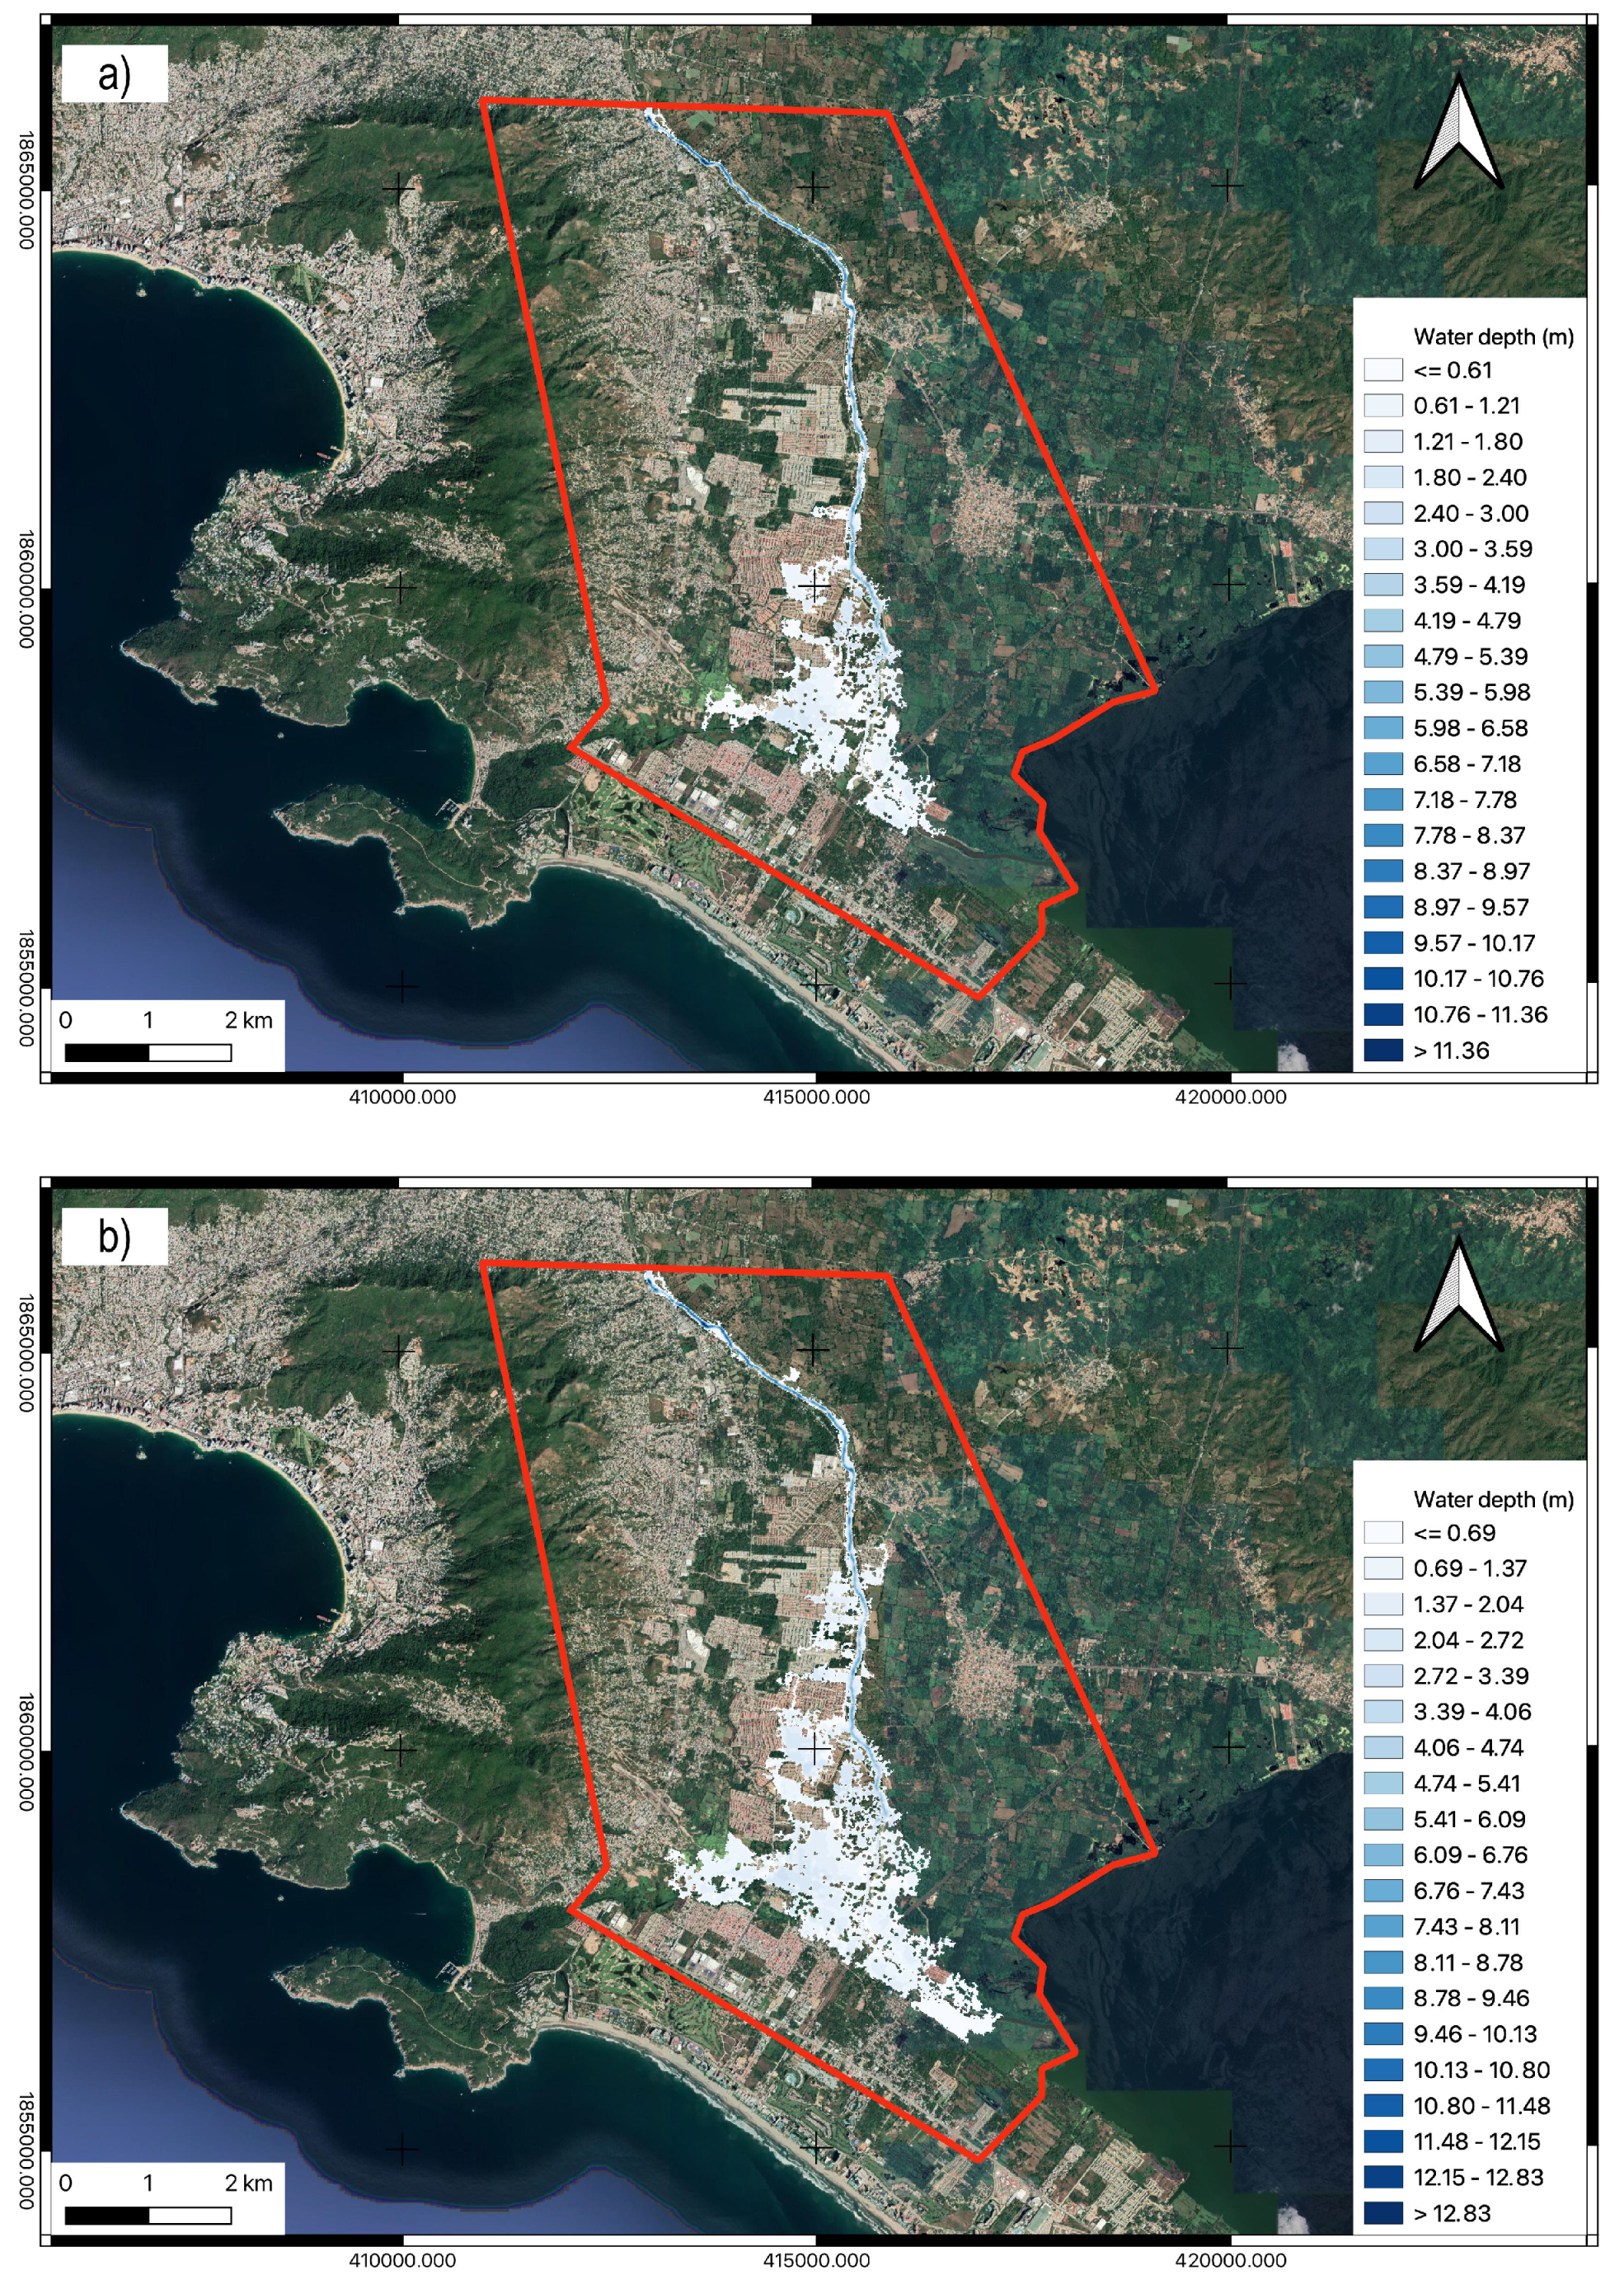
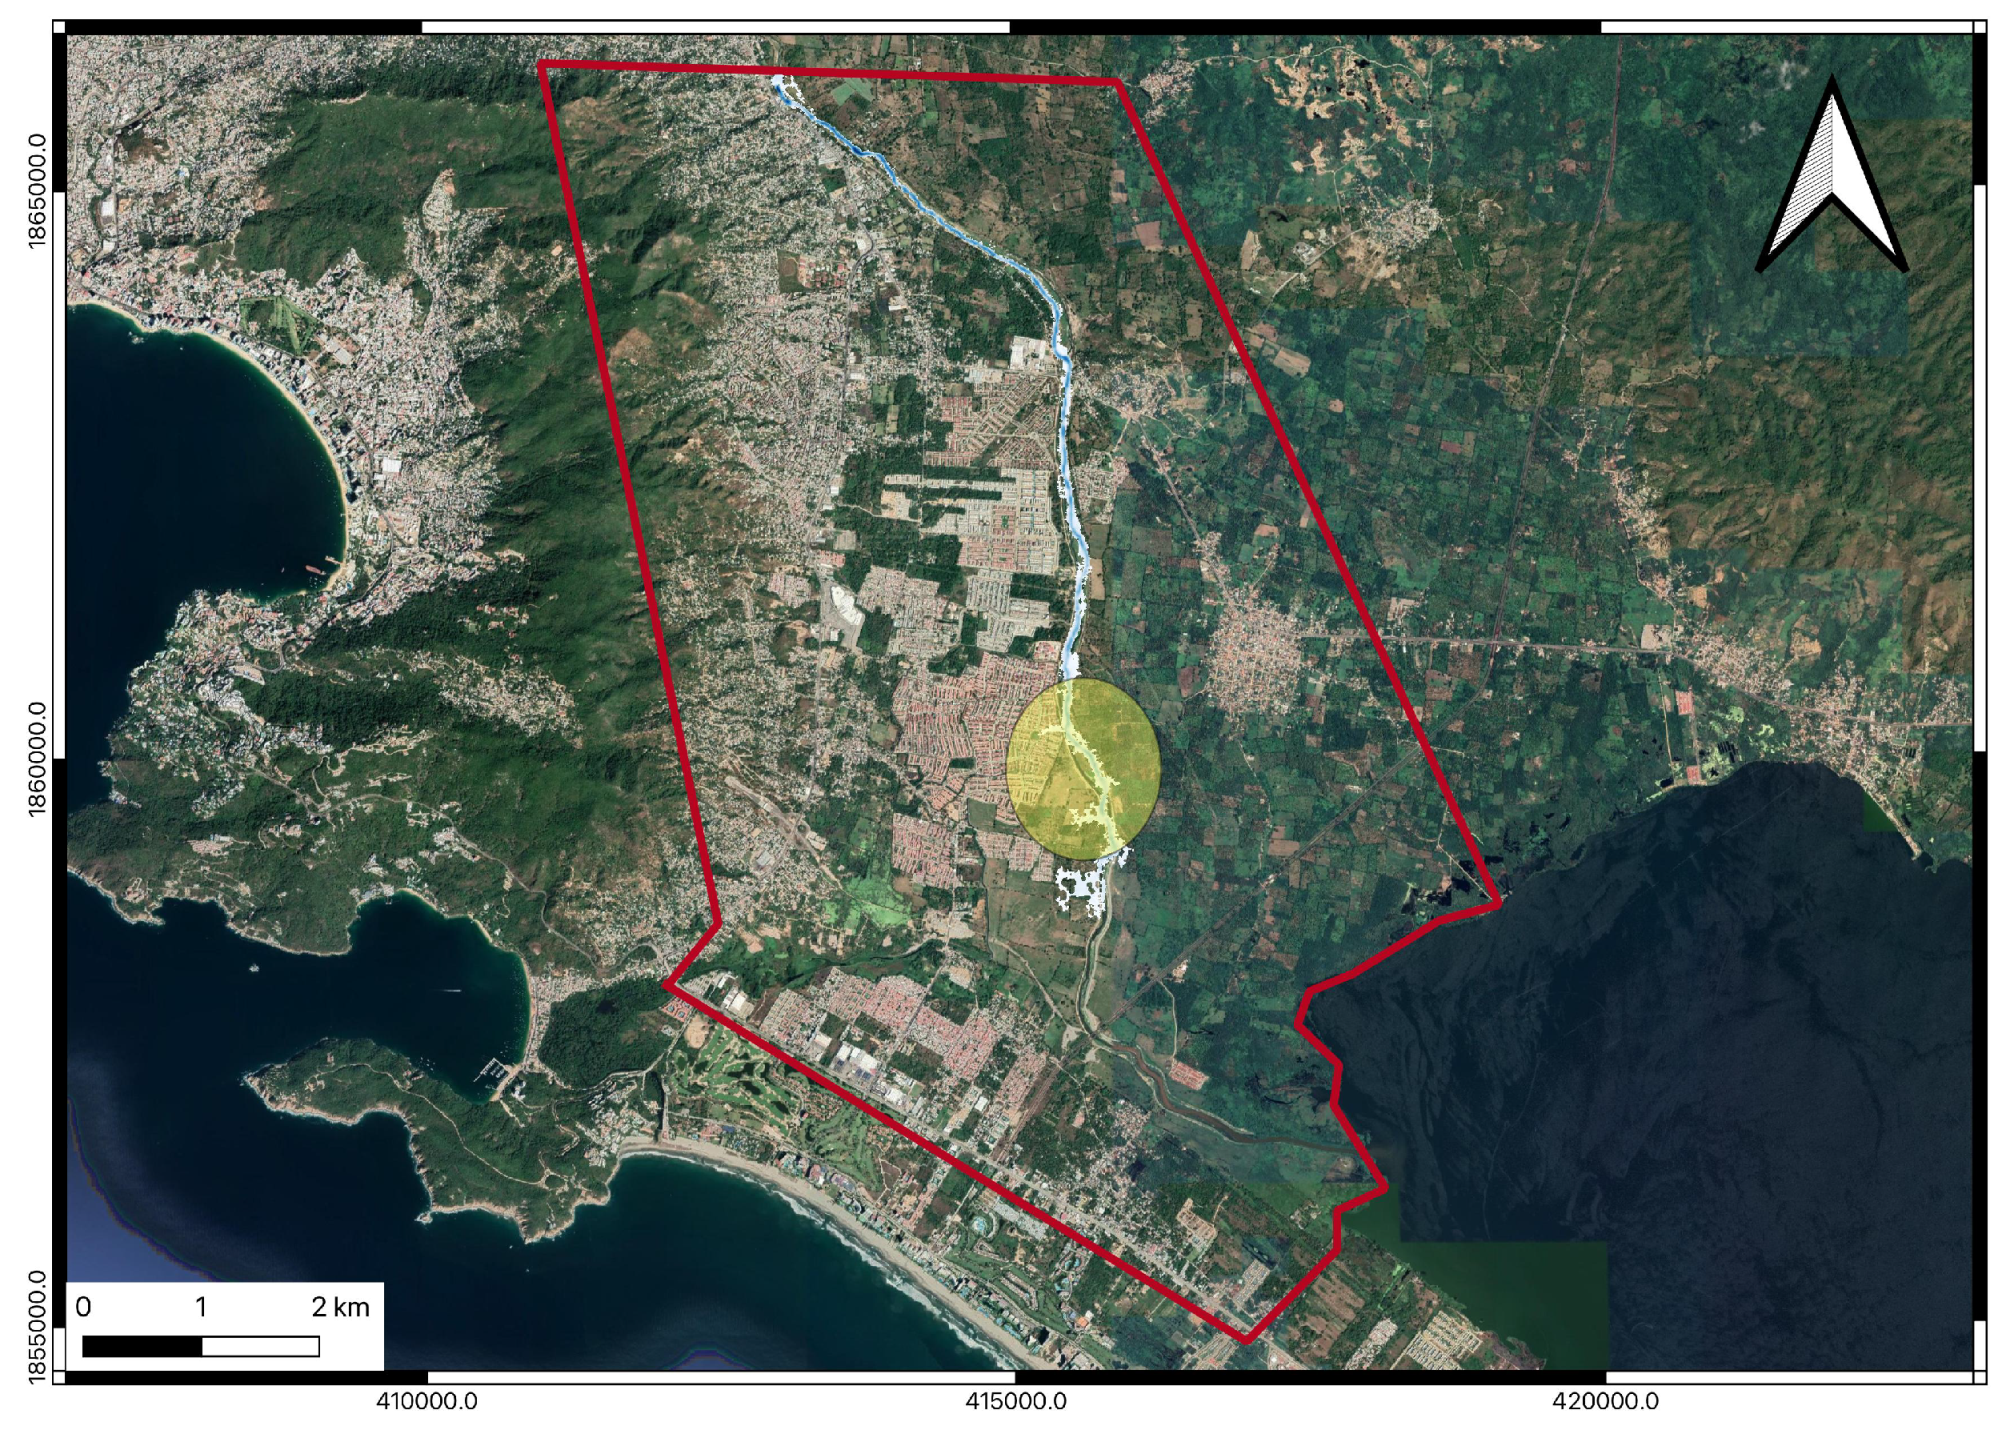
3. Results
4. Discussion
5. Conclusions
Author Contributions
Funding
Institutional Review Board Statement
Informed Consent Statement
Data Availability Statement
Conflicts of Interest
Appendix A
References
- Zuñiga Tovar, M.; Magaña Rueda, V.O. Vulnerability and risk to intense rainfall in Mexico: The effect to land use cover change. Investig. Geogr. 2018, 95. [Google Scholar] [CrossRef]
- Mas, J.F.; Velázquez, A.; Díaz-Gallegos, J.R.; Mayorga Saucedo, R.; Alcántara, C.; Bocco, G.; Pérez-Vega, A. Assessing land use/cover changes: A nationwide multidate spatial database for Mexico. Int. J. Appl. Earth Obs. Geoinf. 1998, 37, 7–19. [Google Scholar] [CrossRef]
- Porter-Bolland, L.; Ellis, E.A.; Gholz, H.L. Land use dynamics and landscape history in La Montaña, Campeche, México. Landsc. Urban Plan. 2007, 82, 198–207. [Google Scholar] [CrossRef]
- Matías Ramírez, L.G. Algunos efectos de la precipitación del huracán Paulina en Acapulco, Guerrero. Investig. Geogr. 1998, 37, 7–19. [Google Scholar] [CrossRef]
- Base de datos de Ciclones Tropicales que Impactaron a México, 1970–2011, México: Comisión Nacional del Agua, Coordinación General del Servicio Meteorológico Nacional, Subgerencia de Pronóstico Meteorológico. Available online: http://smn.cna.gob.mx/ciclones/historia/ciclones1970-2011.pdf (accessed on 19 October 2021).
- Temporada de Ciclones 2015. México: Comisión Nacional del Agua, Servicio Meteorológico Nacional. Available online: http://smn.cna.gob.mx/index.php?option=com_content&view=article&id=276&Itemid=45 (accessed on 19 October 2021).
- Villegas-Romero, I.; Oropeza-Mota, J.L.; Martínez-Ménes, M.; Mejía-Sáenz, E. Path and relation rain-runoff caused by hurricane Pauline in the Sabana river, Guerrero, Mexico. Agrociencia 2009, 43, 345–356. [Google Scholar]
- WMO Statement on the Status of the Global Climate in 2013. Available online: https://library.wmo.int/index.php?lvl=notice_display&id=15957#.YW_gidlIAq0 (accessed on 20 October 2021).
- Mejía Estrada, P.I. Caracterización del Evento Hidrometeorológico Extremo en Acapulco, Guerrero, en Septiembre de 2013. Master’ Thesis, Universidad Nacional Autónoma de México, Mexico City, Mexico, June 2014. [Google Scholar]
- Emanuel, K.A. Downscaling CMIP5 climate models shows increased tropical cyclone activity over the 21st century. Proc. Natl. Acad. Sci. USA 2013, 110, 12219–12224. [Google Scholar] [CrossRef] [Green Version]
- Hong, C.; Tsou, C.; Hsu, P.; Chen, K.; Liang, H.; Hsu, H.; Tu, C.; Kitoh, A. Future Changes in Tropical Cyclone Intensity and Frequency over the Western North Pacific Based on 20-km HiRAM and MRI Models. J. Clim. 2021, 34, 2235–2251. [Google Scholar] [CrossRef]
- Shamir, E.; Tapia-Villaseñor, E.M.; Cruz-Ayala, M.B.; Megdal, S.B. A Review of Climate Change Impacts on the USA-Mexico Transboundary Santa Cruz River Basin. Water 2021, 13, 1390. [Google Scholar] [CrossRef]
- Trenberth, K.E.; Cheng, L.; Jacobs, P.; Zhang, Y.; Fasullo, J. Hurricane Harvey links to ocean heat content and climate change adaptation. Earth’s Future 2018, 6, 730–744. [Google Scholar] [CrossRef]
- Jan van Oldenborgh, G.; van der Wiel1, K.; Sebastian, A.; Singh, R.; Arrighi, J.; Otto, F.; Haustein, K.; Li, S.; Vecchi, G.; Cullen, H. Attribution of extreme rainfall from Hurricane Harvey, August 2017. Environ. Res. Lett. 2017, 12, 124009. [Google Scholar] [CrossRef]
- Knutson, T.R.; Sirutis, J.J.; Zhao, M.; Tuleya, R.E.; Bender, M.; Vecchi, G.A.; Villarini, G.; Chavas, D. Global Projections of Intense Tropical Cyclone Activity for the Late Twenty-First Century from Dynamical Downscaling of CMIP5/RCP4.5 Scenarios. J. Clim. 2015, 28, 7203–7224. [Google Scholar] [CrossRef] [Green Version]
- Bonasia, R.; Lucatello, S. Linking Flood Susceptibility Mapping and Governance in Mexico for Flood Mitigation: A Participatory Approach Model. Atmosphere 2019, 10, 424. [Google Scholar] [CrossRef] [Green Version]
- Lineamientos Para la Elaboración de Mapas de Peligro por Inundación. Available online: https://www.gob.mx/cms/uploads/attachment/file/469330/Lineamientos__para_la_elaboraci_n_de_mapas_de_peligro_por_inundaci_n.pdf (accessed on 21 October 2021).
- Portal de Sistemas de Información del Agua. Available online: https://app.conagua.gob.mx/sistemasdeagua/ (accessed on 21 October 2021).
- Dransch, D.; Rotzol, H.; Poser, K. The contribution of maps to the challenges of risk communication to the public. Int. J. Dig. Earth. 2010, 3, 292–311. [Google Scholar] [CrossRef]
- Mosavi, A.; Ozturk, P.; Chau, K.W. Flood prediction using machine learning models: Literature review. Water 2018, 10, 1536. [Google Scholar] [CrossRef] [Green Version]
- Choubin, B.; Moradi, E.; Golshan, M.; Adamowski, J.; Sajedi-Hosseini, F.; Mosavi, A. An ensemble prediction of flood susceptibility using multivariate discriminant analysis, classification and regression trees, and support vector machines. Sci. Total Environ. 2019, 651, 2087–2096. [Google Scholar] [CrossRef] [PubMed]
- Forestieri, A.; Caracciolo, D.; Arnone, E.; Noto, L.V. Derivation of rainfall thresholds for flash flood warning in a Sicilian basin using a hydrological model. Procedia Eng. 2016, 154, 818–825. [Google Scholar] [CrossRef] [Green Version]
- Reed, S.; Schaake, J.; Zhang, Z. A distributed hydrologic model and threshold frequency-based method for flash flood forecasting at ungauged locations. J. Hydrol. 2007, 337, 402–420. [Google Scholar] [CrossRef]
- Norbiato, D.; Borga, M.; Degli Esposti, S.; Gaume, E.; Anquetin, S. Flash flood warning based on rainfall thresholds and soil moisture conditions: An assessment for gauged and ungauged basins. J. Hydrol. 2008, 362, 274–290. [Google Scholar] [CrossRef]
- Mai, D.T.; De Smedt, F. A Combined Hydrological and Hydraulic Model for Flood Prediction in Vietnam Applied to the Huong River Basin as a Test Case Study. Water 2017, 9, 879. [Google Scholar] [CrossRef] [Green Version]
- Dullo, T.T.; Gangrade, S.; Morales-Hernández, M.; Sharif, M.B.; Kao, S.C.; Kal-yanapu, A.J.; Ghafoor, S.; Evans, K.J. Simulation of Hurricane Harvey flood event through coupled hydrologic-hydraulic models: Challenges and next steps. J. Flood Risk Manag. 2021, 14, e12716. [Google Scholar] [CrossRef]
- Warren, I.R.; Bach, H.K. MIKE 21: A modelling system for estuaries, coastal waters and seas. Environ. Softw. 1991, 7, 229–240. [Google Scholar] [CrossRef]
- Gerstner, N.; Belzner, F.; Thorenz, C. Simulation of Flood Scenarios with Combined 2D/3D Numerical Models. In ICHE 2014, Proceedings of the 11th International Conference on Hydroscience & Engineering 2014, Hamburg, Germany, 28 September–2 October 2014; Rainer, L., Rebekka, K., Eds.; Bundesanstalt für Wasserbau: Karlsruhe, Germany, 2014; pp. 975–981. [Google Scholar]
- Lyubimova, T.; Lepikhin, A.; Parshakova, Y.; Tiunov, A.; Konovalov, V.; Shumilova, N. Numerical modelling of admixture transport in a turbulent flow at river confluence. Models. J. Phys. Conf. Ser. 2013, 416, 012028. [Google Scholar] [CrossRef] [Green Version]
- Vázquez-Cendón, M.E. Improved treatment of source terms in upwinds chemes for the shallow water equations in channels with irregular geometry. J. Comput. Phys. 1999, 148, 497–526. [Google Scholar] [CrossRef]
- Bladé, E.; Cea, L.; Corestein, G.; Escolano, E.; Puertas, J.; Vázquez-Cendón, J.; Dolz, J.; Coll, A. IBER: Herramienta de simulación numérica de flujo en ríos. Rev. Int. Métodos Numer. Para Cálc. Diseño Ing. 2014, 30, 1–10. [Google Scholar] [CrossRef] [Green Version]
- Galán Castro, E.A.; Rodríguez Herrera, A.L.; Rosas-Acevedo, J.L. Gobernanza hídrica como securitización socioambiental en la subcuenca La Sabana–Tres Palos, Acapulco. Reg. Cohes. 2021, 11, 24. [Google Scholar] [CrossRef]
- Actualización de la Disponibilidad Media Anual de agua en el Acuífero La Sabana (1227) Estado de Guerrero. Available online: https://sigagis.conagua.gob.mx/gas1/Edos_Acuiferos_18/guerrero/DR_1227.pdf (accessed on 25 October 2021).
- Sistema Nacional de Información sobre Biodiversidad. Available online: http://www.conabio.gob.mx/informacion/gis/ (accessed on 25 October 2021).
- Base de Datos Climatológica Nacional (Sistema Clicom). Available online: http://clicom-mex.cicese.mx/ (accessed on 15 January 2021).
- Chen, C.I. Rainfall intensity-duration-frequency formulas. J. Hydraul. Eng. 1983, 109, 1603. [Google Scholar] [CrossRef]
- Bell, F.C. Generalized Rainfall-Duration-Frequency Relationships. J. Hydraul. Div. 1969, 95, 311–328. [Google Scholar] [CrossRef]
- Bladé, E.; Cea, L.; Corestein, G. Modelización numérica de inundaciones fluviales. Ing. Del Agua 2014, 16, 68. [Google Scholar]
- Cea, L.; Bladé, E.; Corestein, G. A simple and efficient unstructured finite volume scheme for solving the shallow water equations in overland flow applications. Water Resour. Res. 2015, 51, 5464–5486. [Google Scholar] [CrossRef] [Green Version]
- García-Feal, O.; González-Cao, J.; Gómez-Gesteira, M.; Cea, L.; Domínguez, J.; Formella, A. An accelerated tool for flood Modelling based on Iber. Water 2018, 10, 1459. [Google Scholar] [CrossRef] [Green Version]
- Bates, P.D.; Horritt, M.S.; Fewtrell, T.J. A simple inertial formulation of the shallow water equations for efficient two-dimensional flood inundation modelling. J. Hydrol. 2010, 387, 33–45. [Google Scholar] [CrossRef]
- Ghimire, B.; Chen, A.S.; Guidolin, M.; Keedwell, E.C.; Djordjeviç, S.; Savic, D.A. Simulation of a fast 2D urban pluvial flood model using a cellular automata approach. J. Hydroinf. 2012, 15, 676–686. [Google Scholar] [CrossRef] [Green Version]
- Skilodimou, H.D.; Bathrellos, G.D.; Alexakis, D.E. Flood Hazard Assessment Mapping in Burned and Urban Areas. Sustainability 2021, 13, 4455. [Google Scholar] [CrossRef]
- Areu-Rangel, O.S.; Cea, L.; Bonasia, R.; Espinosa-Echavarria, V.J. Impact of Urban Growth and Changes in Land Use on River Flood Hazard in Villahermosa, Tabasco (Mexico). Water 2019, 11, 304. [Google Scholar] [CrossRef] [Green Version]


| Basin area (km2) | 446.05 |
| Length of the main channel (m) | 72,720 |
| Average slope of the main channel (%) | 2.10 |
| Concentration time (h) | 7.97 |
| Peak time (h) | 7.60 |
| Peak flow rate (m3/s/mm) | 12.20 |
| Precipitation Duration | Return Period (Years) | P (mm) | (mm) | (m3/s) |
|---|---|---|---|---|
| 10 min | 10 | 14.104 | 6.734 | 109.440 |
| 50 | 17.170 | 9.266 | 150.598 | |
| 100 | 18.041 | 10.008 | 162.647 | |
| 500 | 20.154 | 11.841 | 192.449 | |
| 1000 | 21.184 | 12.751 | 207.222 | |
| 30 min | 10 | 20.045 | 15.317 | 248.922 |
| 50 | 29.274 | 20.123 | 327.021 | |
| 100 | 30.758 | 21.508 | 349.532 | |
| 500 | 34.360 | 24.899 | 404.633 | |
| 1000 | 36.116 | 26.565 | 431.708 |
Publisher’s Note: MDPI stays neutral with regard to jurisdictional claims in published maps and institutional affiliations. |
© 2021 by the authors. Licensee MDPI, Basel, Switzerland. This article is an open access article distributed under the terms and conditions of the Creative Commons Attribution (CC BY) license (https://creativecommons.org/licenses/by/4.0/).
Share and Cite
Bonasia, R.; Ceragene, M. Hydraulic Numerical Simulations of La Sabana River Floodplain, Mexico, as a Tool for a Flood Terrain Response Analysis. Water 2021, 13, 3516. https://doi.org/10.3390/w13243516
Bonasia R, Ceragene M. Hydraulic Numerical Simulations of La Sabana River Floodplain, Mexico, as a Tool for a Flood Terrain Response Analysis. Water. 2021; 13(24):3516. https://doi.org/10.3390/w13243516
Chicago/Turabian StyleBonasia, Rosanna, and Mackendy Ceragene. 2021. "Hydraulic Numerical Simulations of La Sabana River Floodplain, Mexico, as a Tool for a Flood Terrain Response Analysis" Water 13, no. 24: 3516. https://doi.org/10.3390/w13243516
APA StyleBonasia, R., & Ceragene, M. (2021). Hydraulic Numerical Simulations of La Sabana River Floodplain, Mexico, as a Tool for a Flood Terrain Response Analysis. Water, 13(24), 3516. https://doi.org/10.3390/w13243516