1. Introduction
Seawater intrusion is one of the most concerning issues for groundwater resources management within coastal aquifers. Using hydraulic head observations to infer groundwater flow directions is a basic procedure in seawater intrusion studies [
1,
2,
3]. Organizations such as the USGS, The Geological Survey of Denmark and Greenland (GEUS), and the Taiwan Water Resources Agency collect long-term hydraulic head (water-level) data and maintain observation well nets (
Table 1). A hydraulic head is obtained by measuring water level in an observation well where level refers to mean sea level.
Numerical models such as SEAWAT are used to simulate variable-density transient groundwater flow in porous media, using freshwater as a reference fluid [
4]. SEAWAT is a public domain computer program. The source code and software are distributed free of charge by the U.S. Geological Survey (USGS). However, no density information data for observed hydraulic heads (or water levels) is available within databases.
Table 1 provides case studies using unknown density observed hydraulic heads for calibrating (or evaluating) flow models [
5,
6,
7,
8,
9,
10,
11,
12,
13]. Errors arising from the use of observed hydraulic head data of unknown density are, therefore, likely one of the most overlooked issues in flow simulations of seawater intrusion [
14,
15,
16].
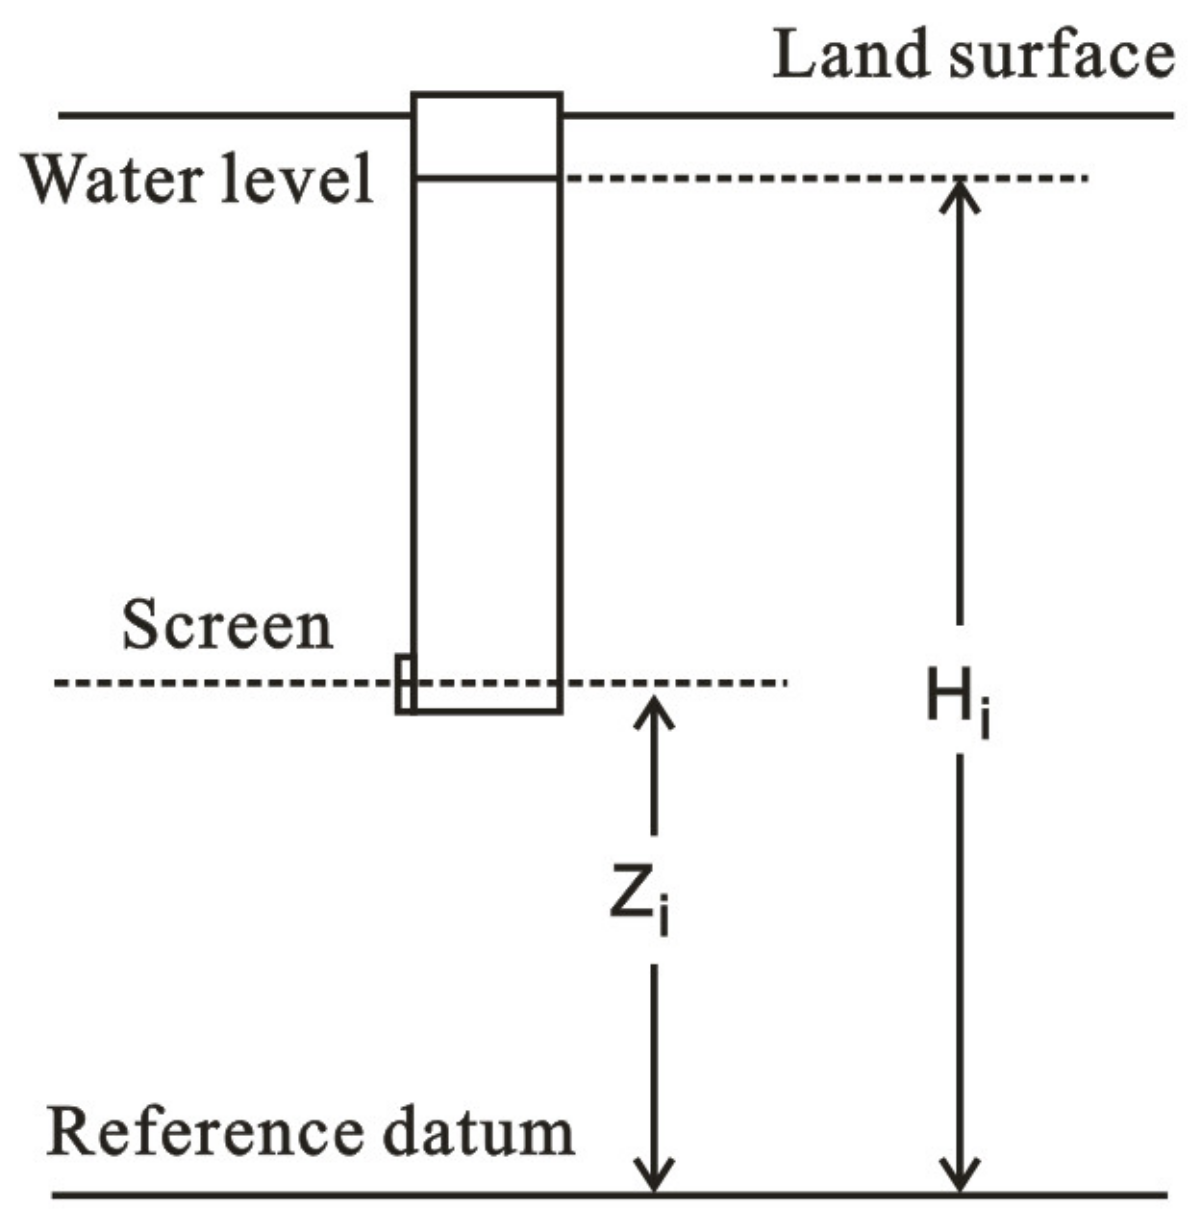
As an alternative to the hydraulic head (H
i), previous studies have suggested using an equivalent freshwater head (H
fi) for analyzing flow components within a variable-density groundwater aquifer. A freshwater head (H
fi) can be calculated from point water head measurements using the following formula [
17,
18,
19] (
Figure 1):
where H
i is the hydraulic head, D
i is the density of water within the observation well, D
f is the freshwater density, and Z
i of the elevation head represents the mean level of the well screen.
Here, we present a case study for using the “equivalent freshwater head (Hfi)” instead of an “observed hydraulic head” for analyzing the flow paths of saline groundwater within the coastal Pingtung Plain, Taiwan. We also provide recommendations for water level data collection from a saline groundwater area.
2. Study Area and Hydrogeology
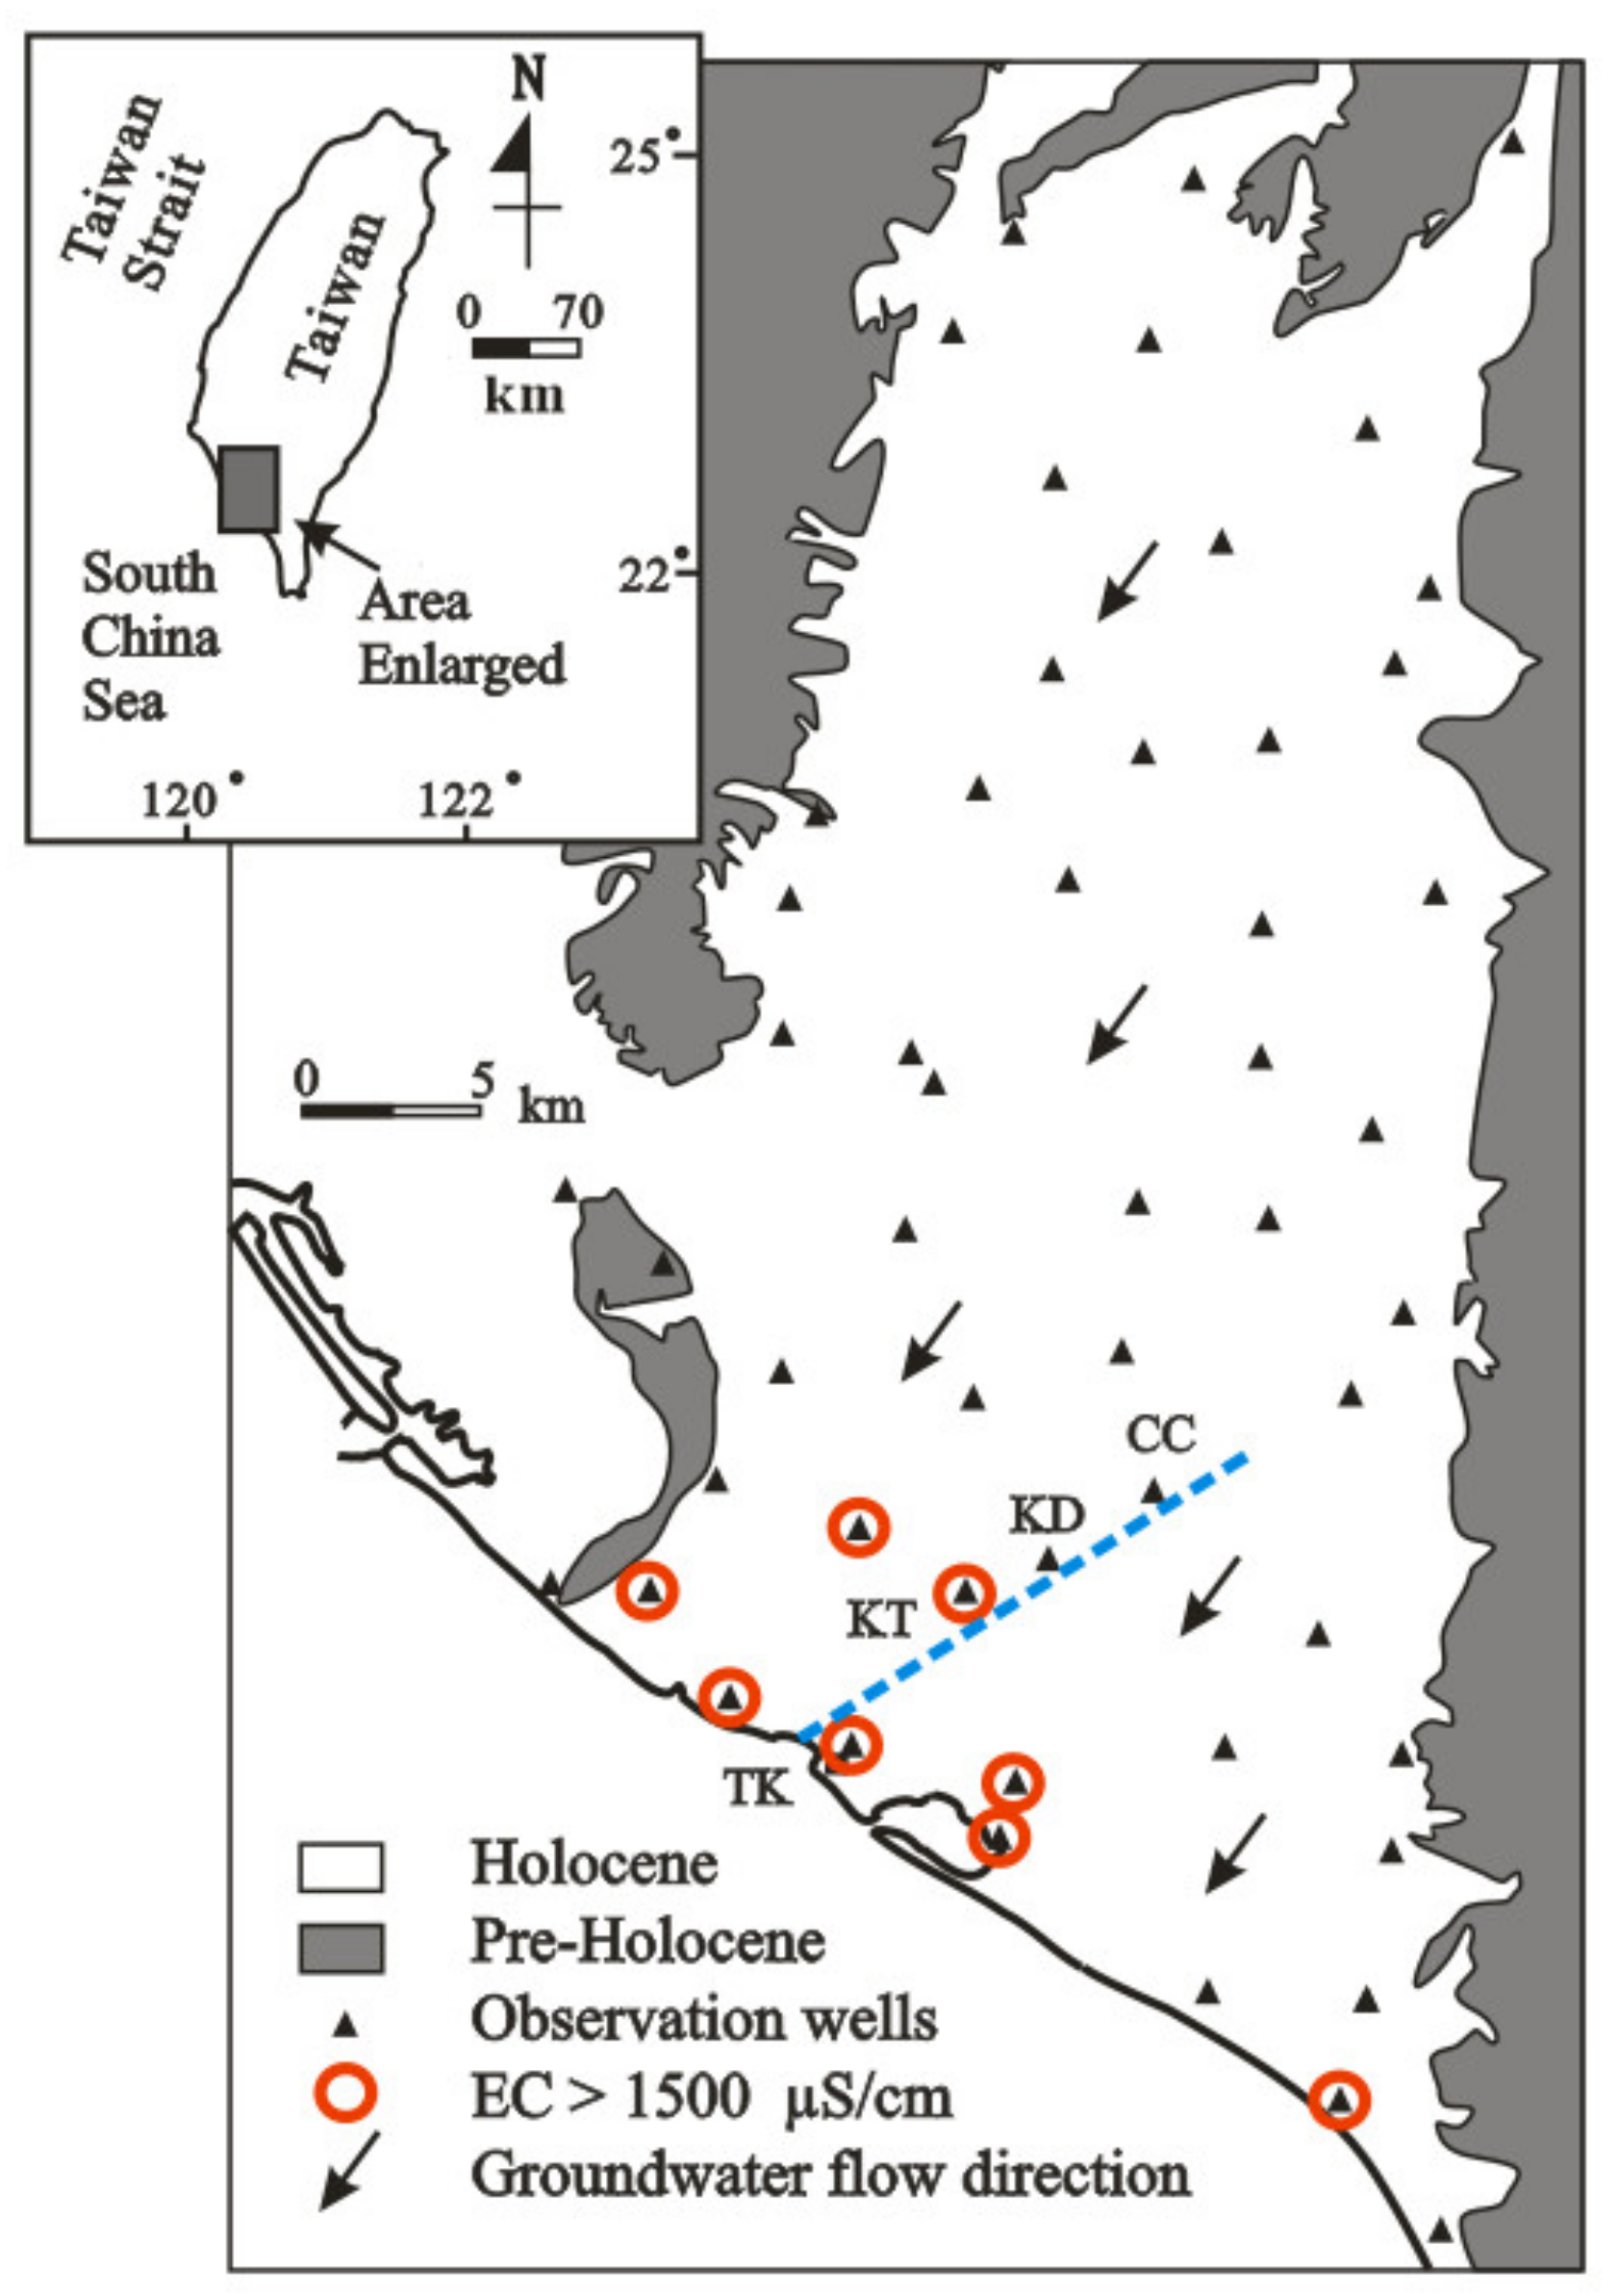
The Pingtung Plain is located in southwestern Taiwan, where the southern border is in contact with the South China Sea (
Figure 2). Geologically, the Pingtung Plain consists of rivers, deltas, and estuary of unconsolidated deposits surrounded by mountains and hills composed of pre-Holocene rock [
20,
21]. From 1995–1998, a total of 134 new observation wells were constructed by the Taiwan Water Resources Agency (WRA). The staff of WRA maintains and collects water level data, and offers data through its website [
22,
23,
24]. Water level data are automatically recoded at one-hour intervals using a pressure transducer within the observation well. However, groundwater chemistry data, including Electric Conductivity (EC), are only collected once a year by water purging and sampling with a pump.
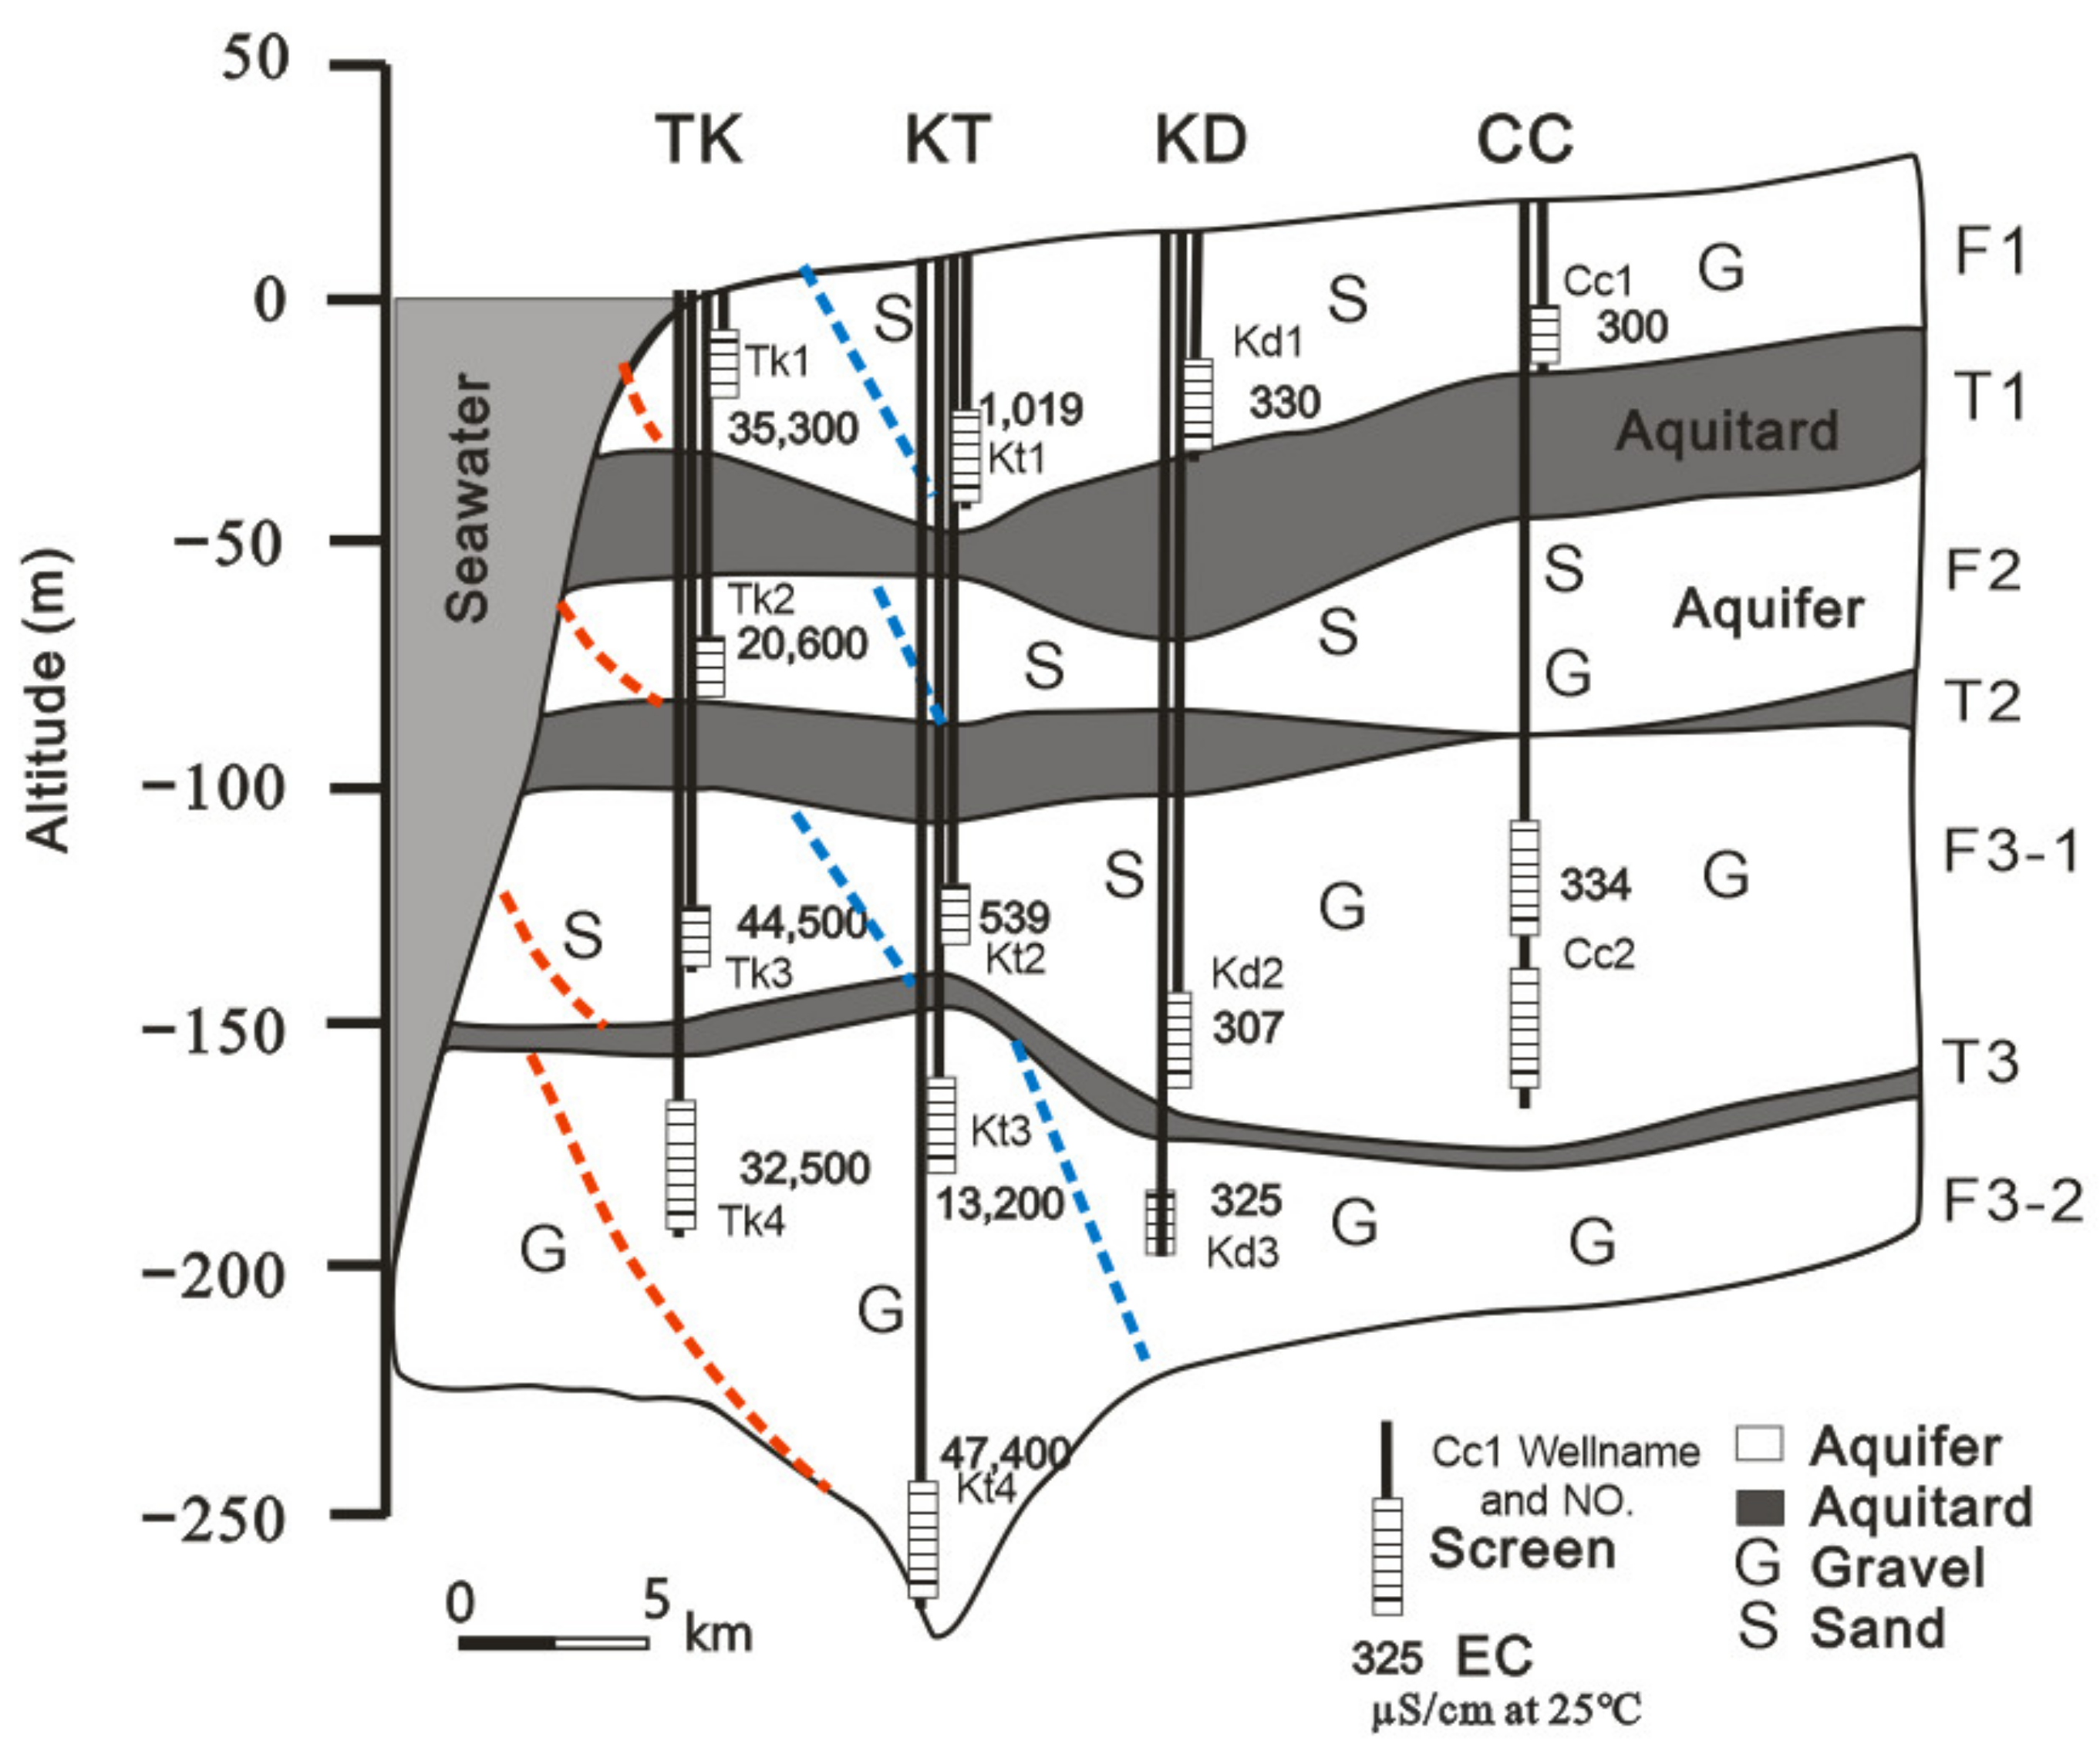
Four aquifers (F1 to F3-2), down to 300 m in depth, were identified and, at most, four observation wells were installed at one site (
Figure 3). Lengths of screens, ranging from 12 to 30 m, were placed on the bottom of observation wells. Aquifers in the area are composed of gravel and sand, and are separated by fine-grain, clay-rich aquitards (T1 to T3). A total of eight sites, all at the coastal location, presenting saline groundwaters with EC’s higher than 1500 μS/cm (at 25 °C), were first noted in WRA reports during investigations conducted from 1995–1998.
3. Distribution of Saline Groundwater
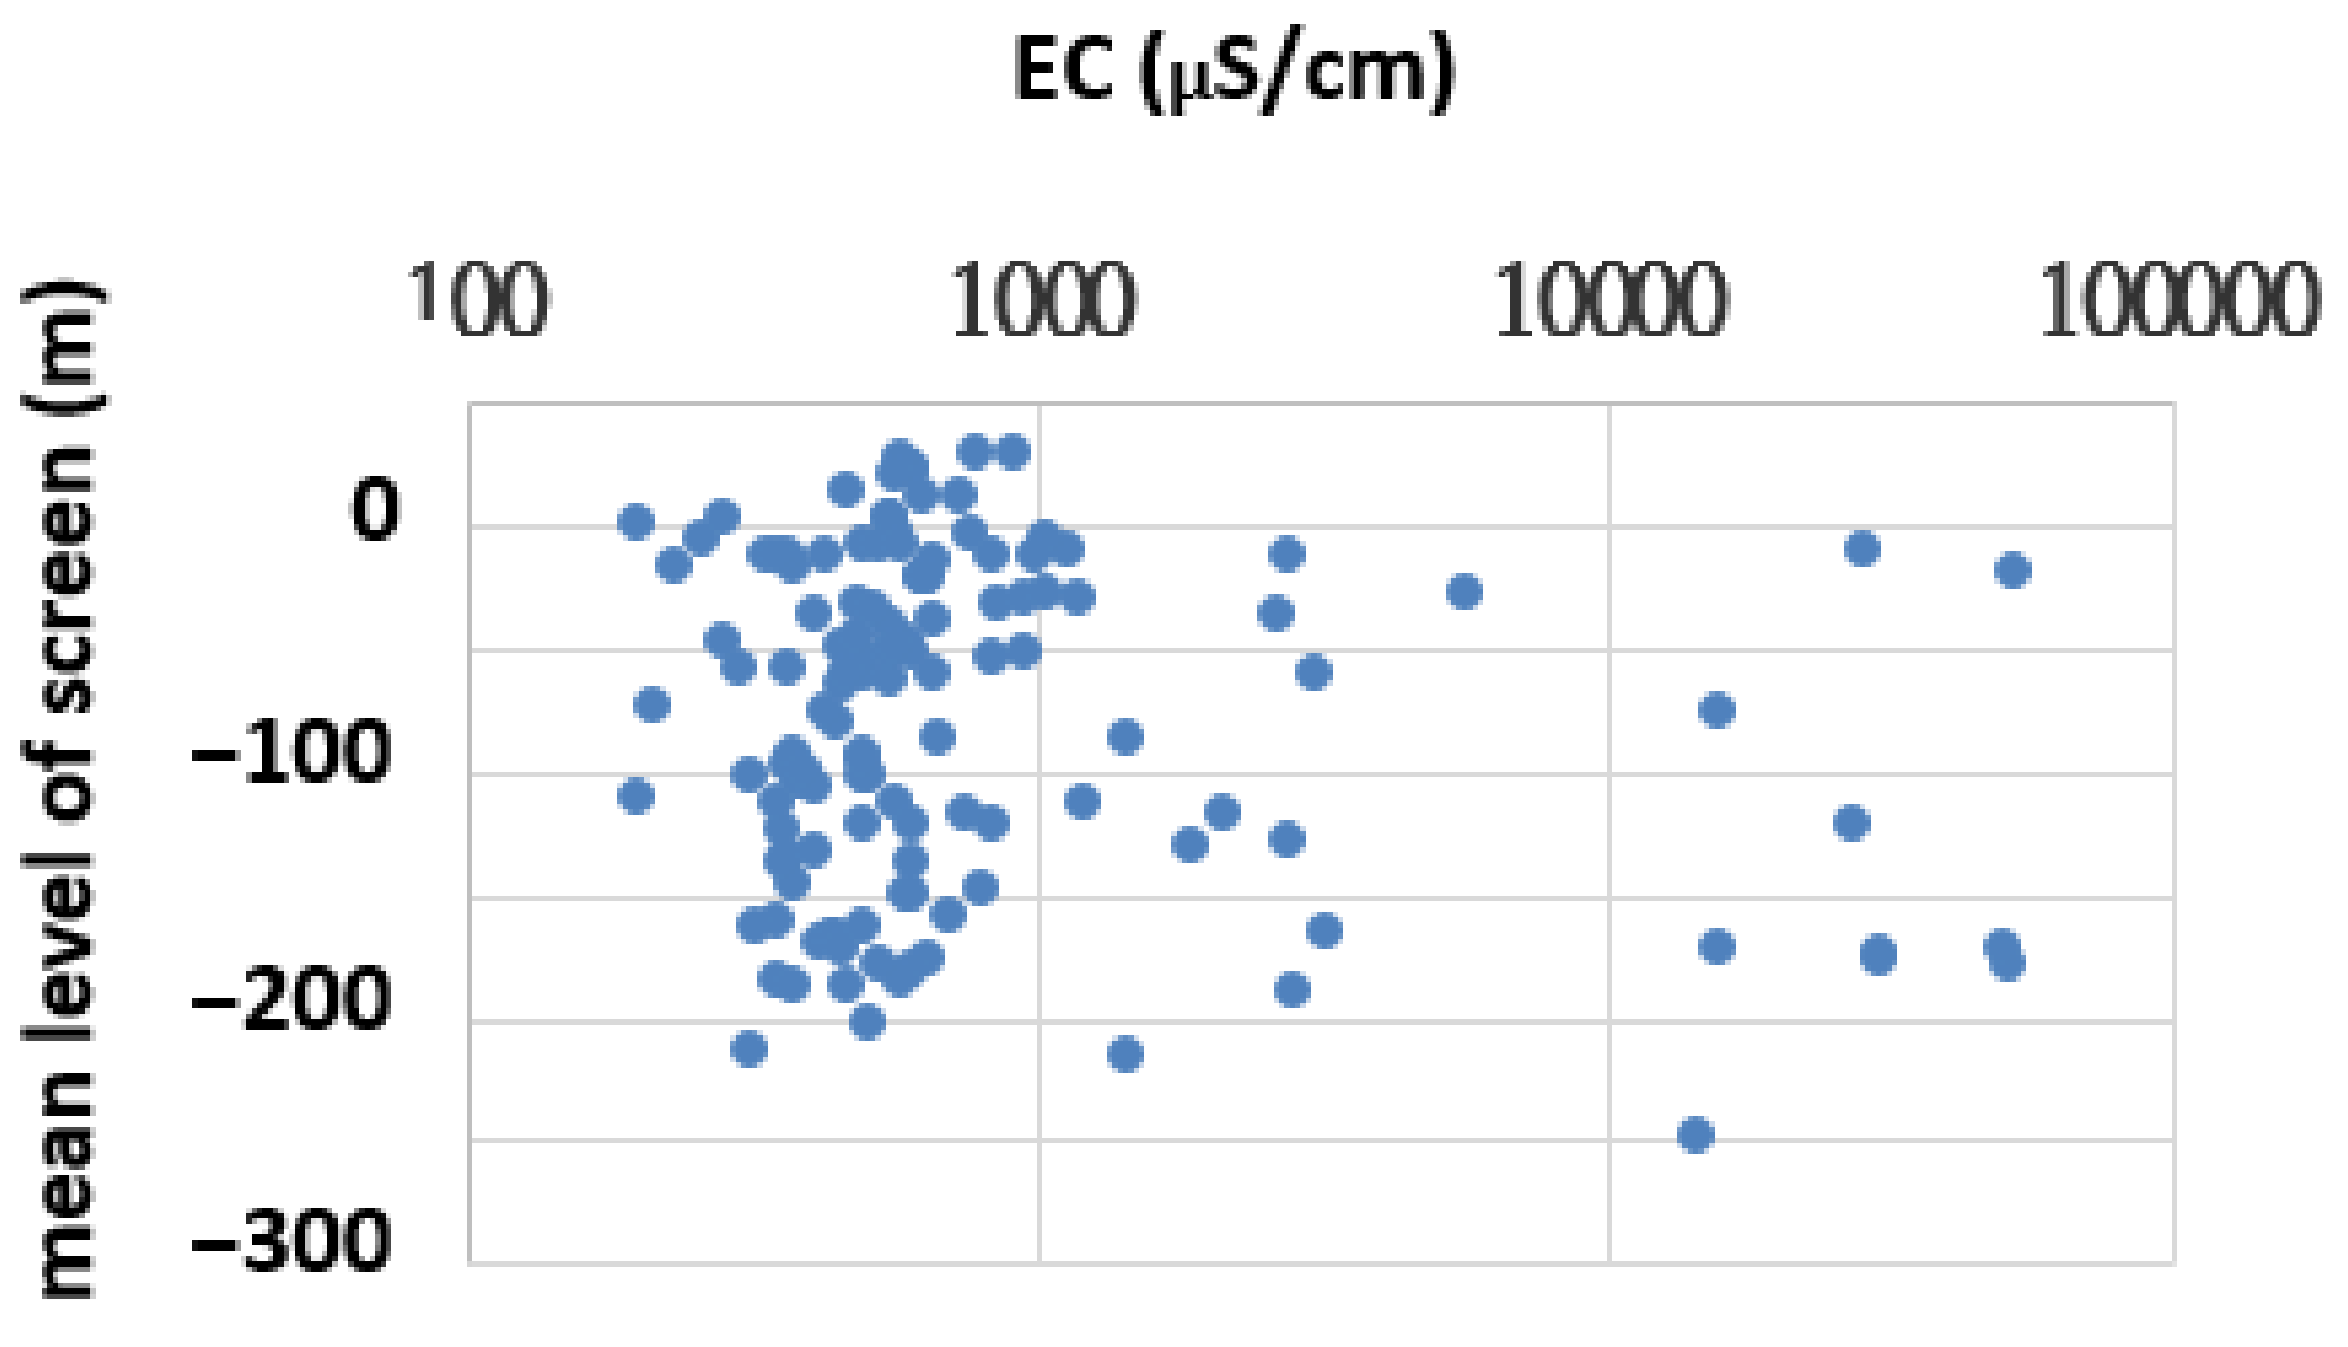
Groundwater EC and the mean level of the screen (the elevation head) for the 134 observation wells are provided in
Figure 4. In 2012, 19 observation wells displayed EC’s higher than 1500 μS/cm (
Table 2). An EC of seawater of 52,000 μS/cm, with a density of 1026 kg/m
3, and a density of freshwater (EC < 1500 μS/cm) of 1000 kg/m
3 can be assumed. The densities of saline water (D
i) within observation wells can be calculated using the following formula [
25]:
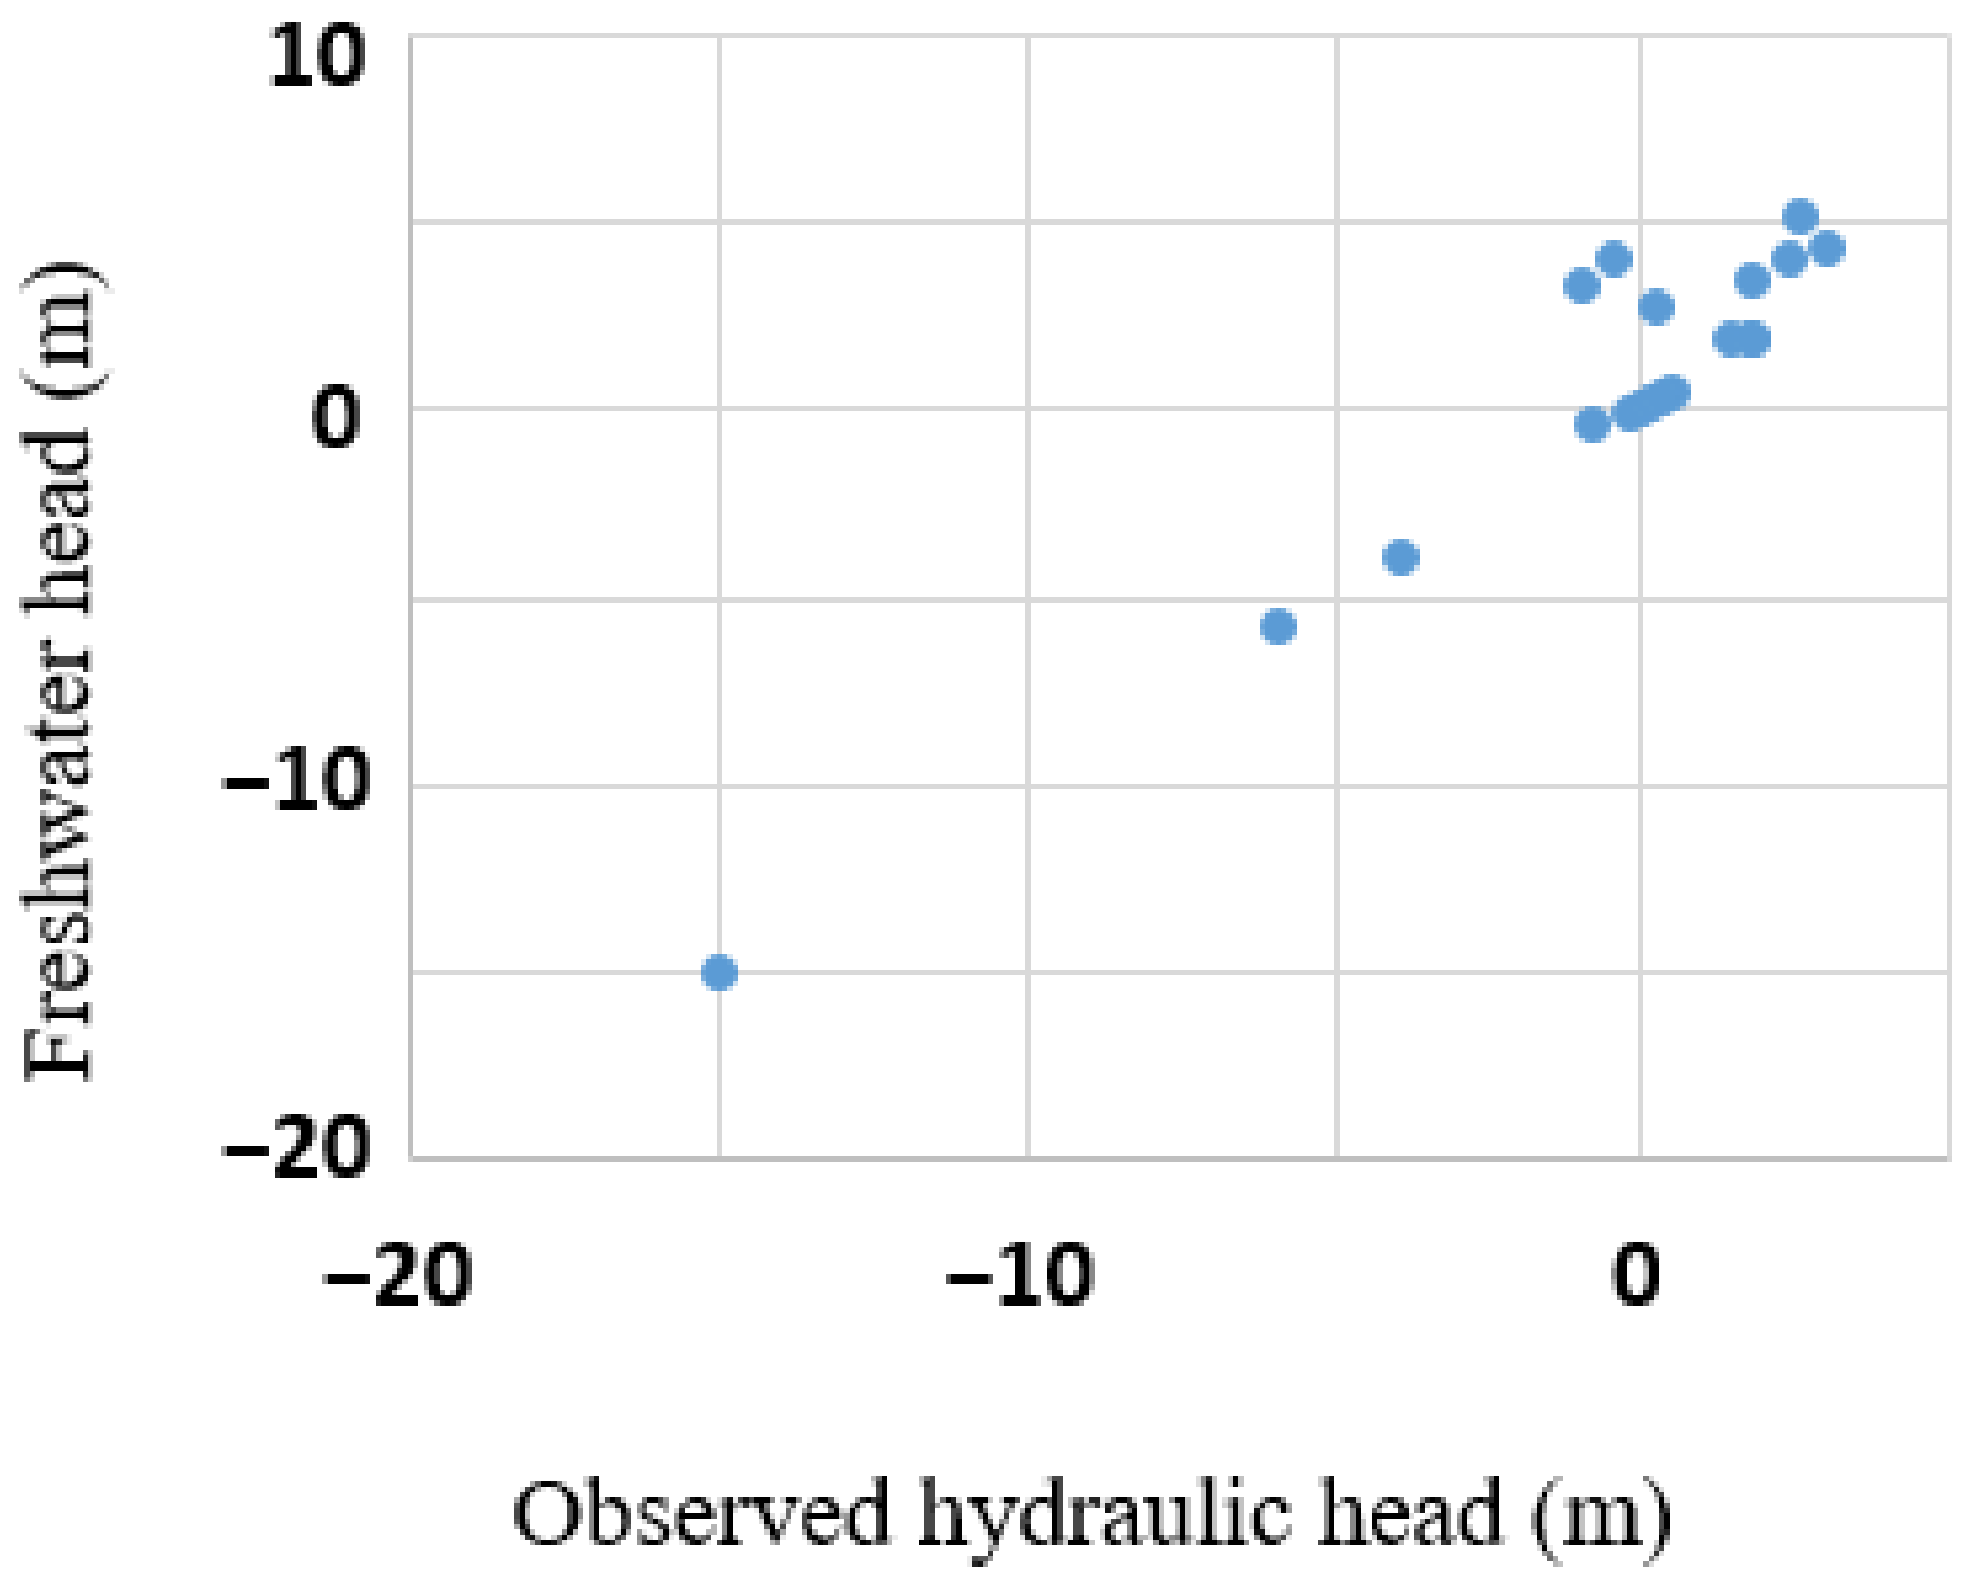
Density is known, as well as the mean level of a screen. Therefore, by using Equation (1); freshwater heads can be determined as shown in
Table 2 and
Figure 5. A difference in the head by as much as 4.5 m occurred for well TK4, a freshwater head at 4.07 m, while the observed annual hydraulic head was only −0.43 m. According to Equation (1), differences between an observed hydraulic head and a freshwater head increase with increasing depth within a water column and the density within an observation well. Within the TK4 well, the mean level of the screen was −177 m, and the density of water was 1025 kg/m
3.
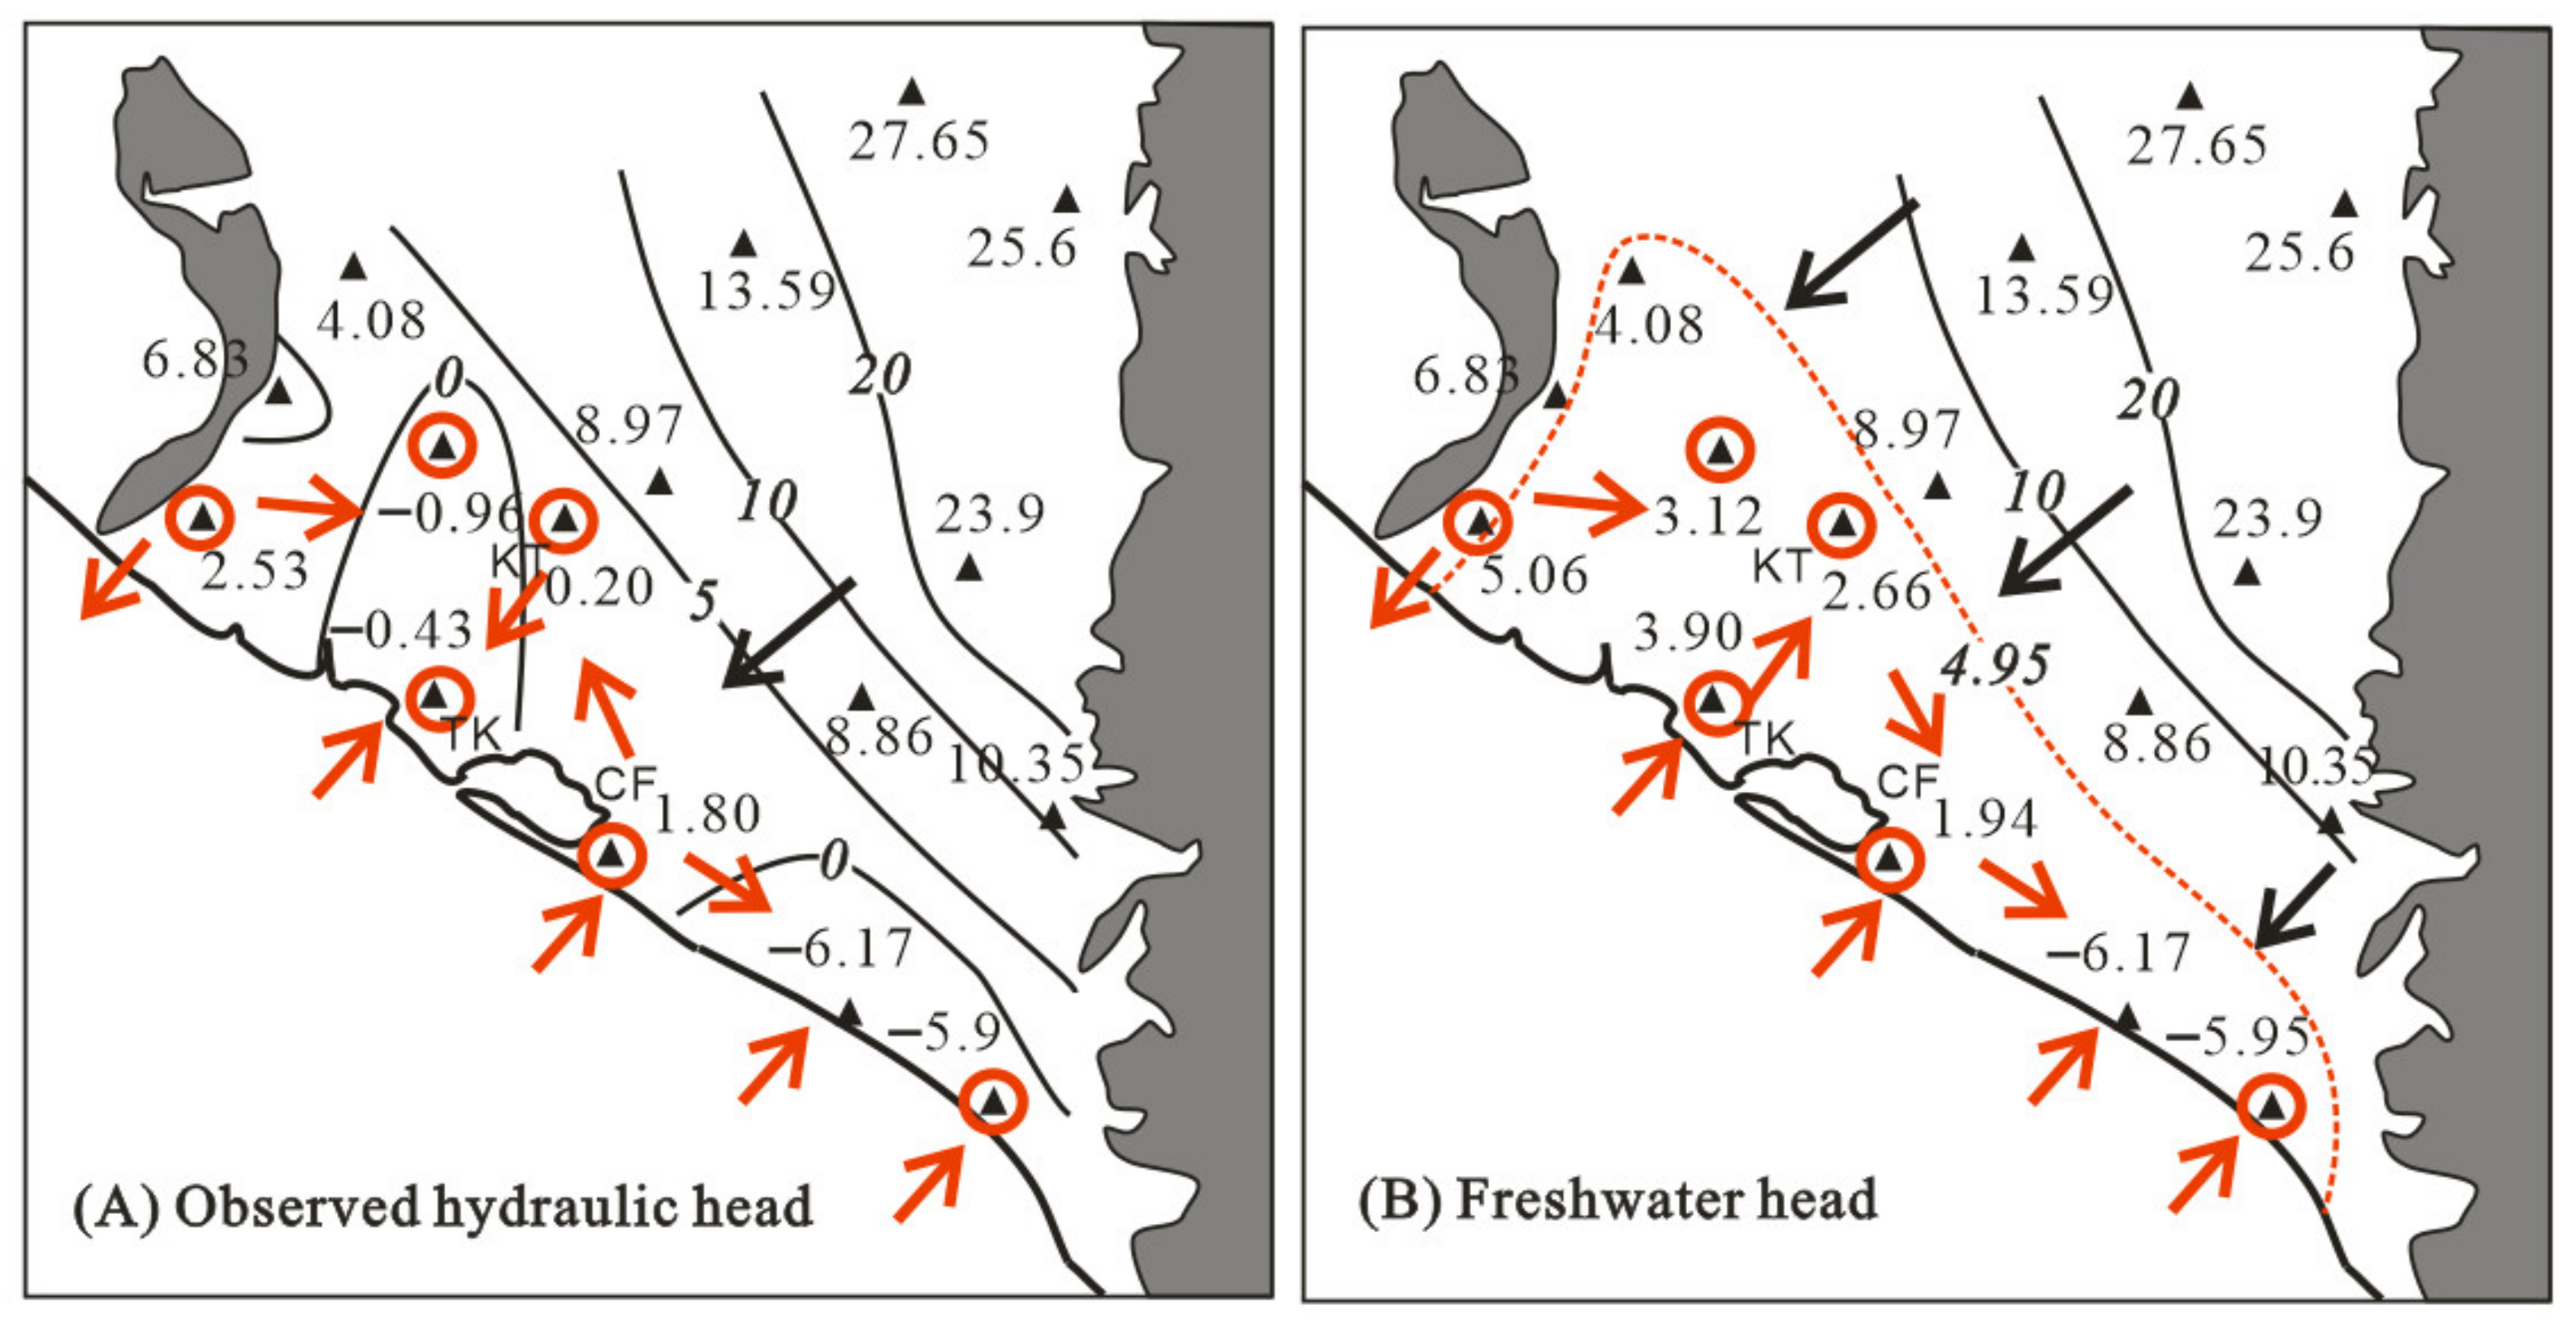
The misuse of observed hydraulic heads causes a misinterpretation of the flow direction of saline groundwater [
2,
26]. For example,
Figure 6A displays the distributions of observed hydraulic heads (m) within aquifer F3-2 during 2012. The direction of groundwater flow was from the KT site to the TK site, from land to sea, according to the observed hydraulic heads. However, according to the freshwater heads (
Figure 6B), the flow direction should be the opposite (from sea to land).
A potential area of seawater intrusion may also be indicated by the equivalent freshwater head of seawater. The depths of aquifer F3-2 were 150–230 m, with an average of 190 m. The freshwater head of seawater at a depth of 190 m was approximately 4.95 m. The coastal portion of aquifer F3-2, with a freshwater head less than 4.95 m, was potentially impacted by seawater intrusion (the red dashed line in
Figure 6B).
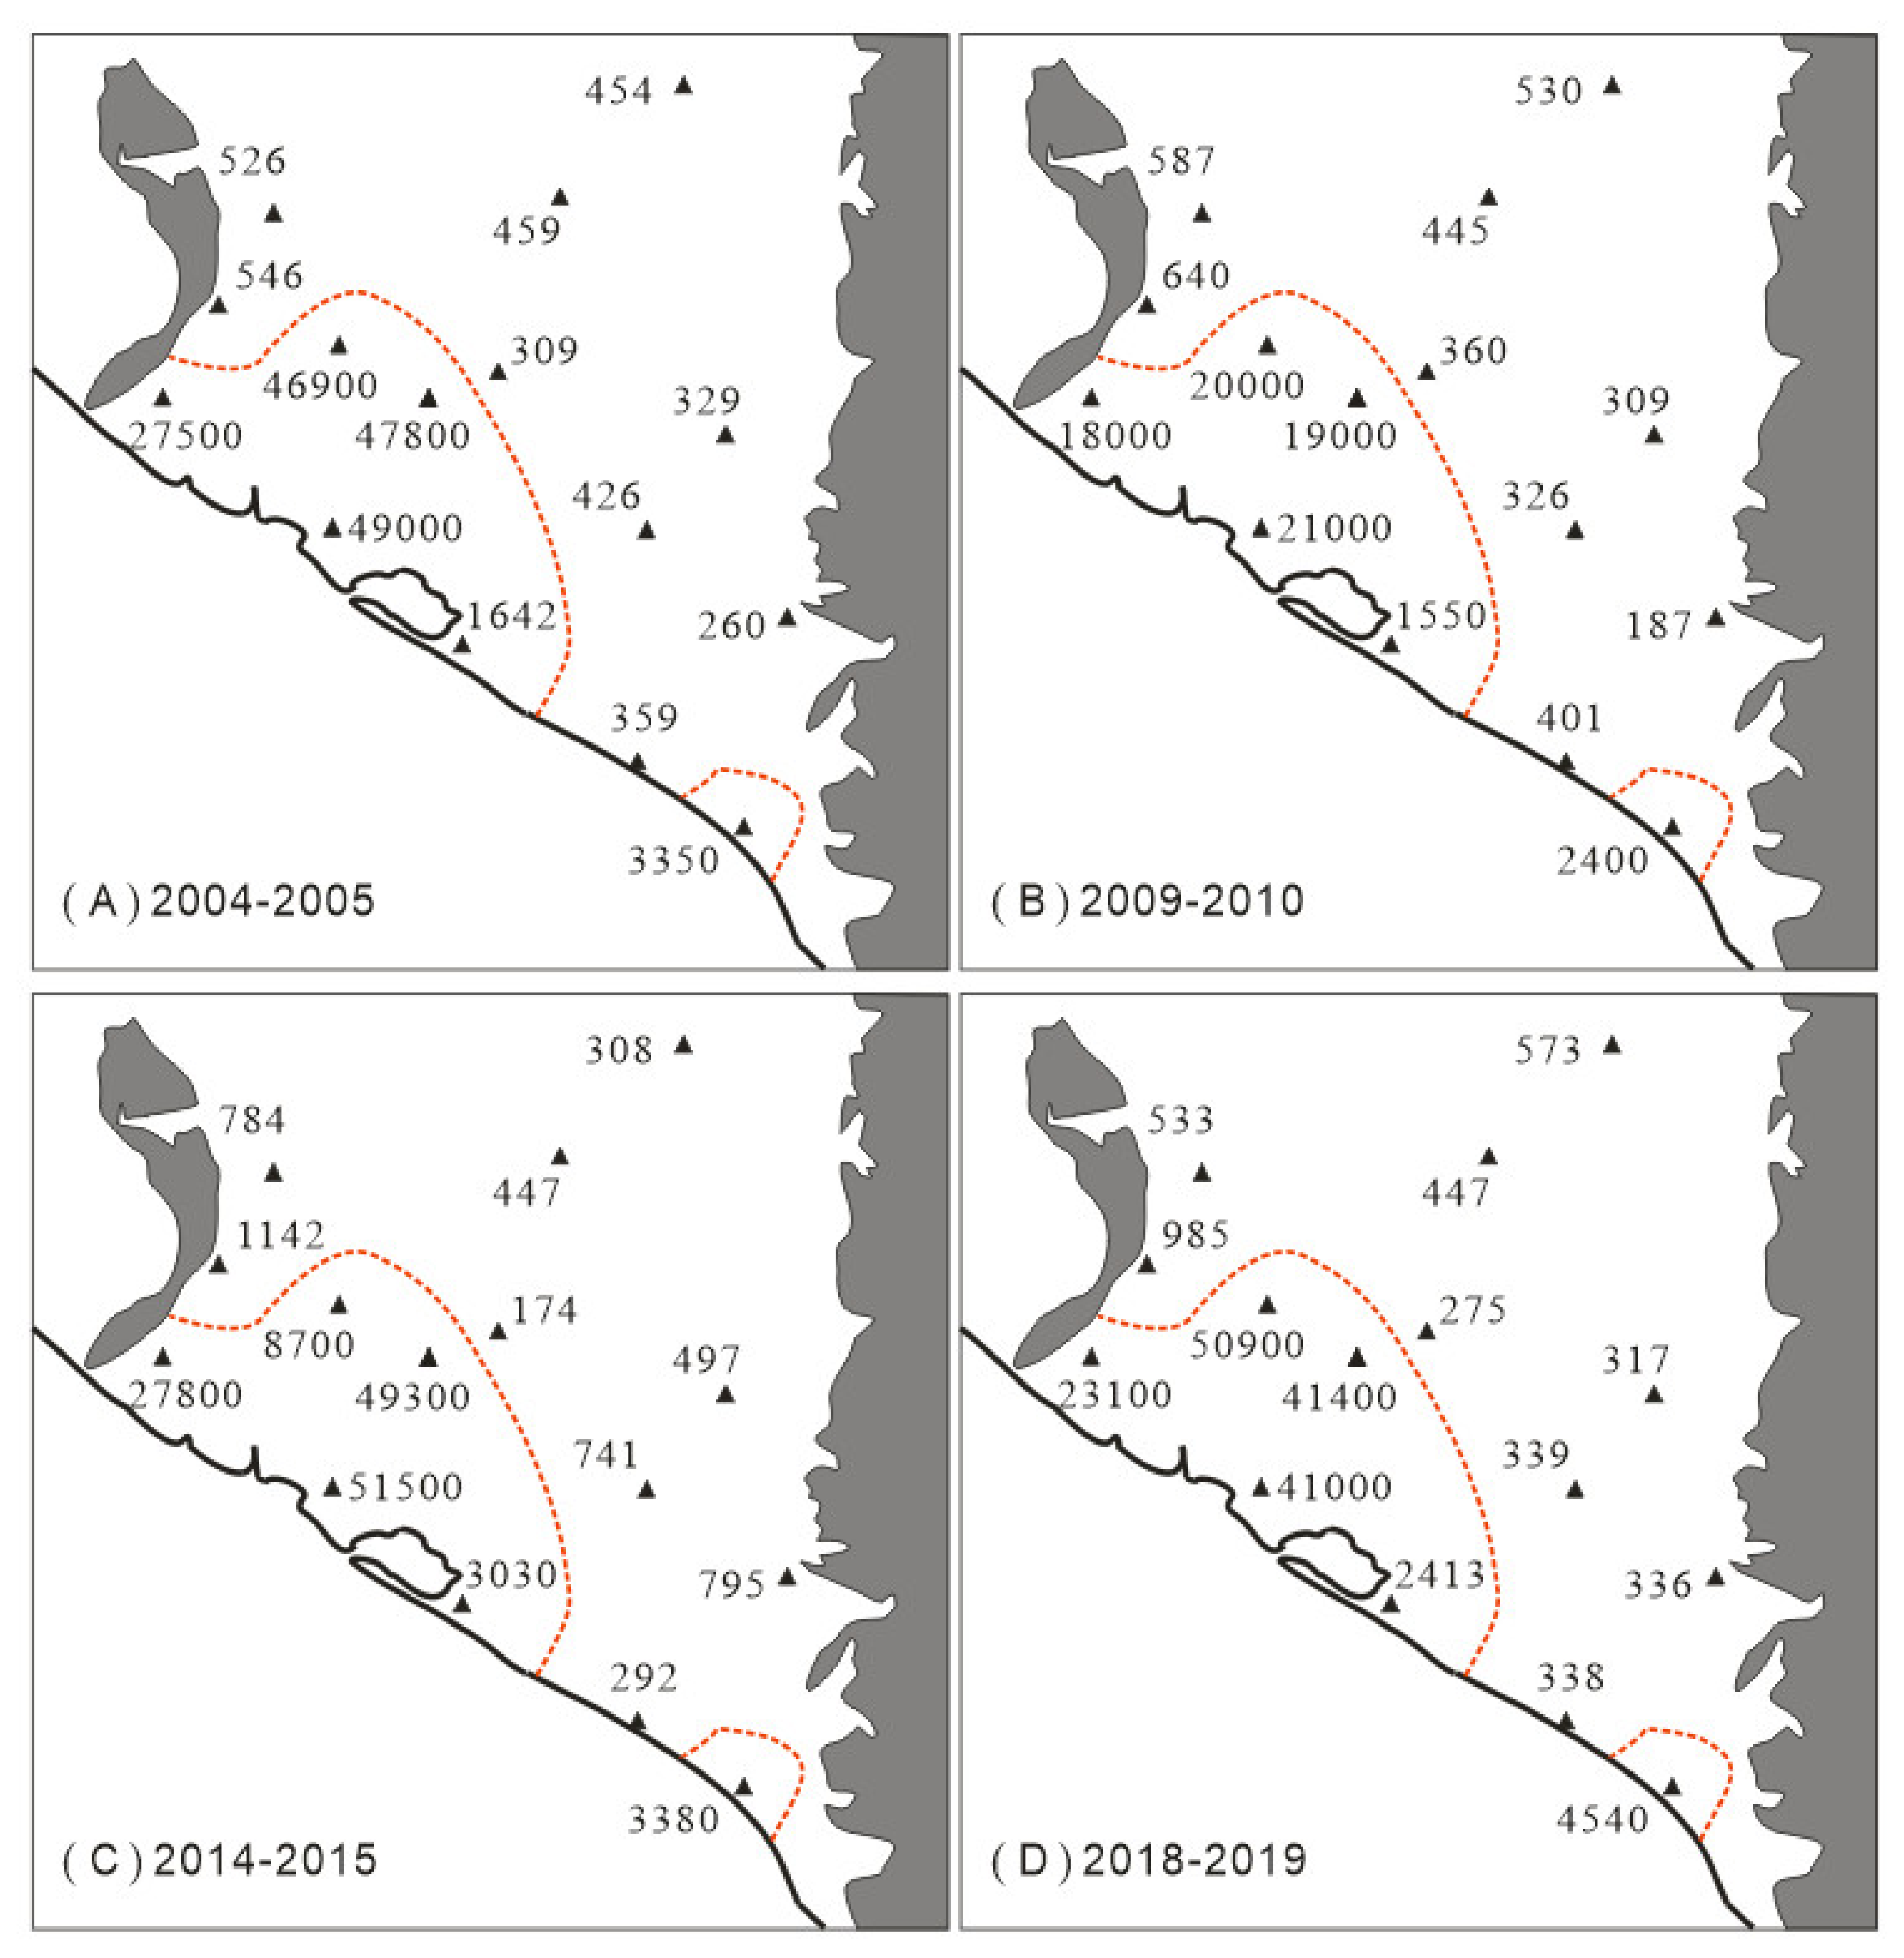
Figure 7 shows groundwater EC in the F3-2 aquifer during 2004–2019. The saline groundwater area in which ECs were > 1500 μS/cm is consistent with the potential seawater intrusion area in
Figure 6B.
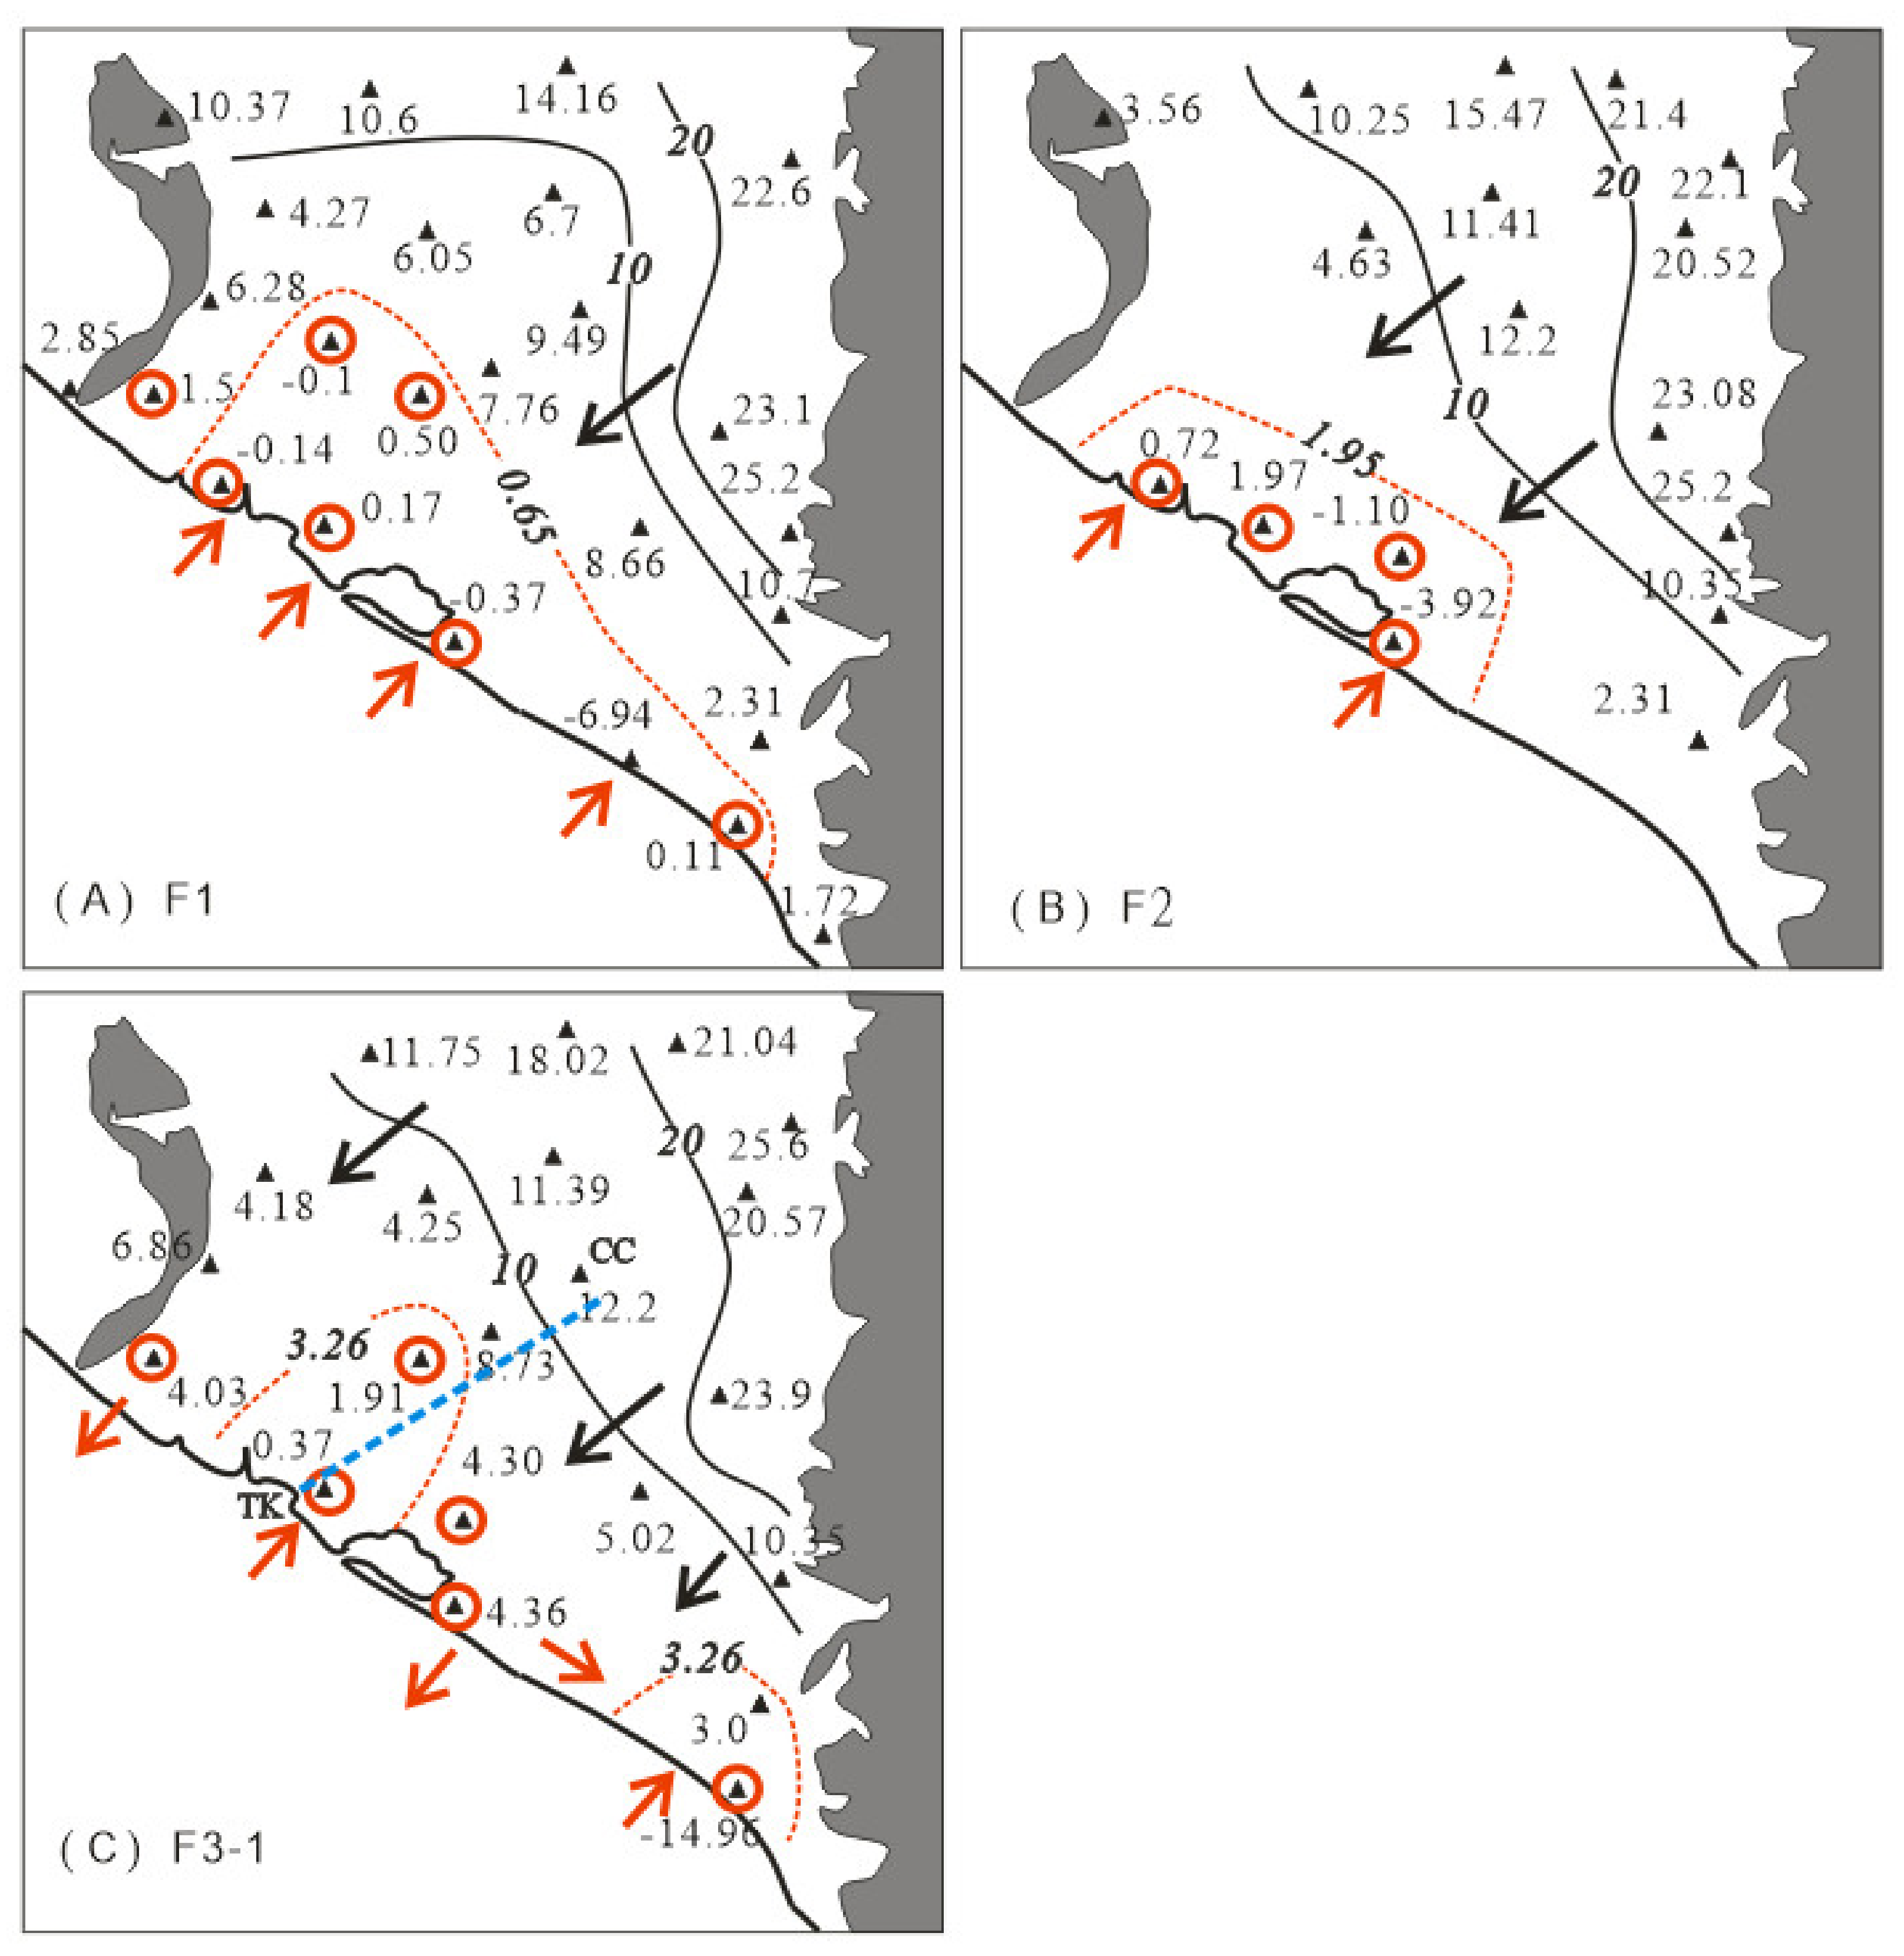
Figure 6 and
Figure 8 show freshwater heads and the flow directions of groundwater from the four aquifers within the Pingtung Plain during 2012. The depth of aquifer F1 ranged from 0 to 50 m in depth below the land surface, with an average of 25 m. The freshwater head of seawater, at an average depth of 25 m, was 0.65 m. In
Figure 8, the potential seawater intrusion area for aquifer F1 is marked by a red dashed line where freshwater heads were <0.65 m.
Averaged depths were 75, 125, and 190 m, and the freshwater heads of seawater at those depths were 1.95, 3.26, and 4.95 m for aquifers F2, F3-1, and F3-2, respectively. In
Figure 6 and
Figure 8, potential seawater intrusion areas are shown with red dashed lines. The deepest aquifer, F3-2, displayed the largest area of potential seawater intrusion, approximately 7 km towards land.
4. Flow History along the Profile TK–CC
We used a flow path along profile TK–CC to represent the flow history of aquifer F3-1 from 1999–2018 (
Figure 8C). EC values of groundwater for the four observation wells within aquifer F3-1 along the TK–CC profile are provided in
Table 3. Annual observed hydraulic heads and freshwater heads of those wells are shown in
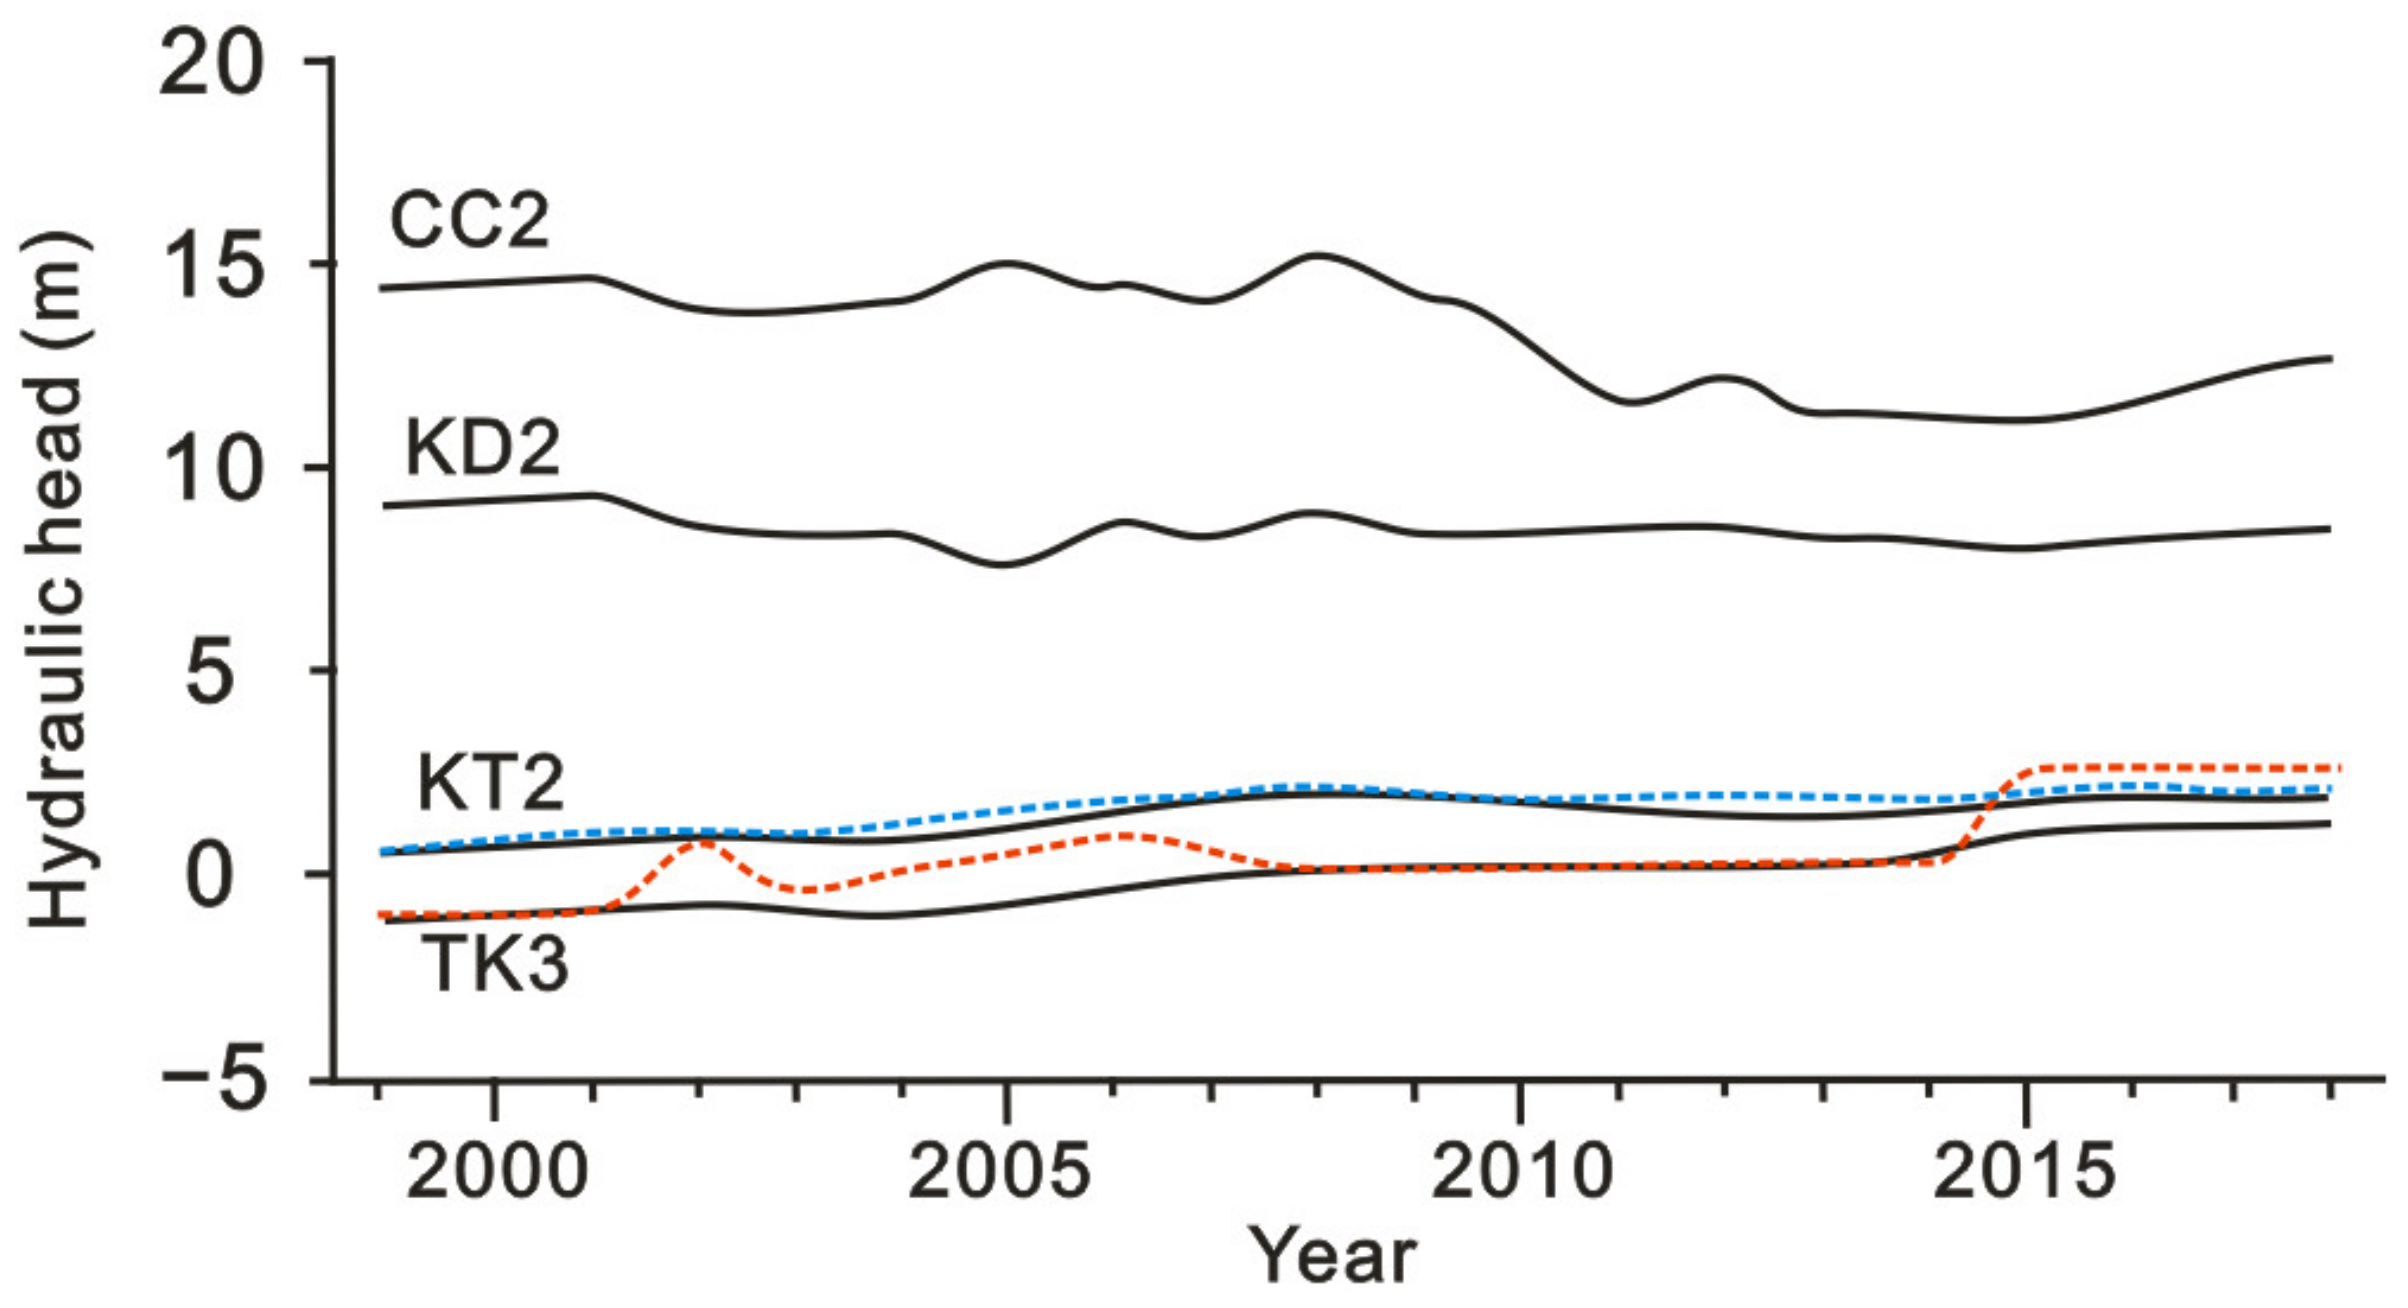
Figure 9.
During the period from 1999–2018, the flow direction was from CC2 to TK3, that is, from land to coast, according to the observed hydraulic heads. However, after 2015, a completely different explanation is explained by the freshwater heads of saline water within observation wells TK3 and KT2. According to the freshwater heads (
Figure 9), the flow direction between TK3 and KT2 changed in 2015 (i.e., from coast to land).
Due to saline water flow to the landside since 2015, freshwater heads for July 2020 were 3.07 m and 1.79 m for wells TK3 and KT2, respectively. We predict that the EC in wells TK3 and KT2 will increase. Water sampling on 19 July 2020 indicated that EC within TK3 increased to 42,600 μS/cm from 21,700 μS/cm (2018), and increased to 9545 μS/cm from 3280 μS/cm within KT2.
5. EC Values within Observation Wells
The determination of a freshwater head requires density information within the observation well. Compared to water-level data, density information is not easy to obtain. Water density is not directly routinely measured by the Taiwan Water Resources Agency (WRA). Density-related measurements such as EC and TDS (total dissolved solids) are only determined once per year. The WRA’s current measurement method, which is regulated by the Taiwan Environmental Protection Agency (NIEA W103.56B) for water sampling, consists of purging and sampling. However, the purging and sampling method is quite time-consuming, labor-intensive, and expensive. The method may also result in the mixing of different layers of groundwater from outside an observation well.
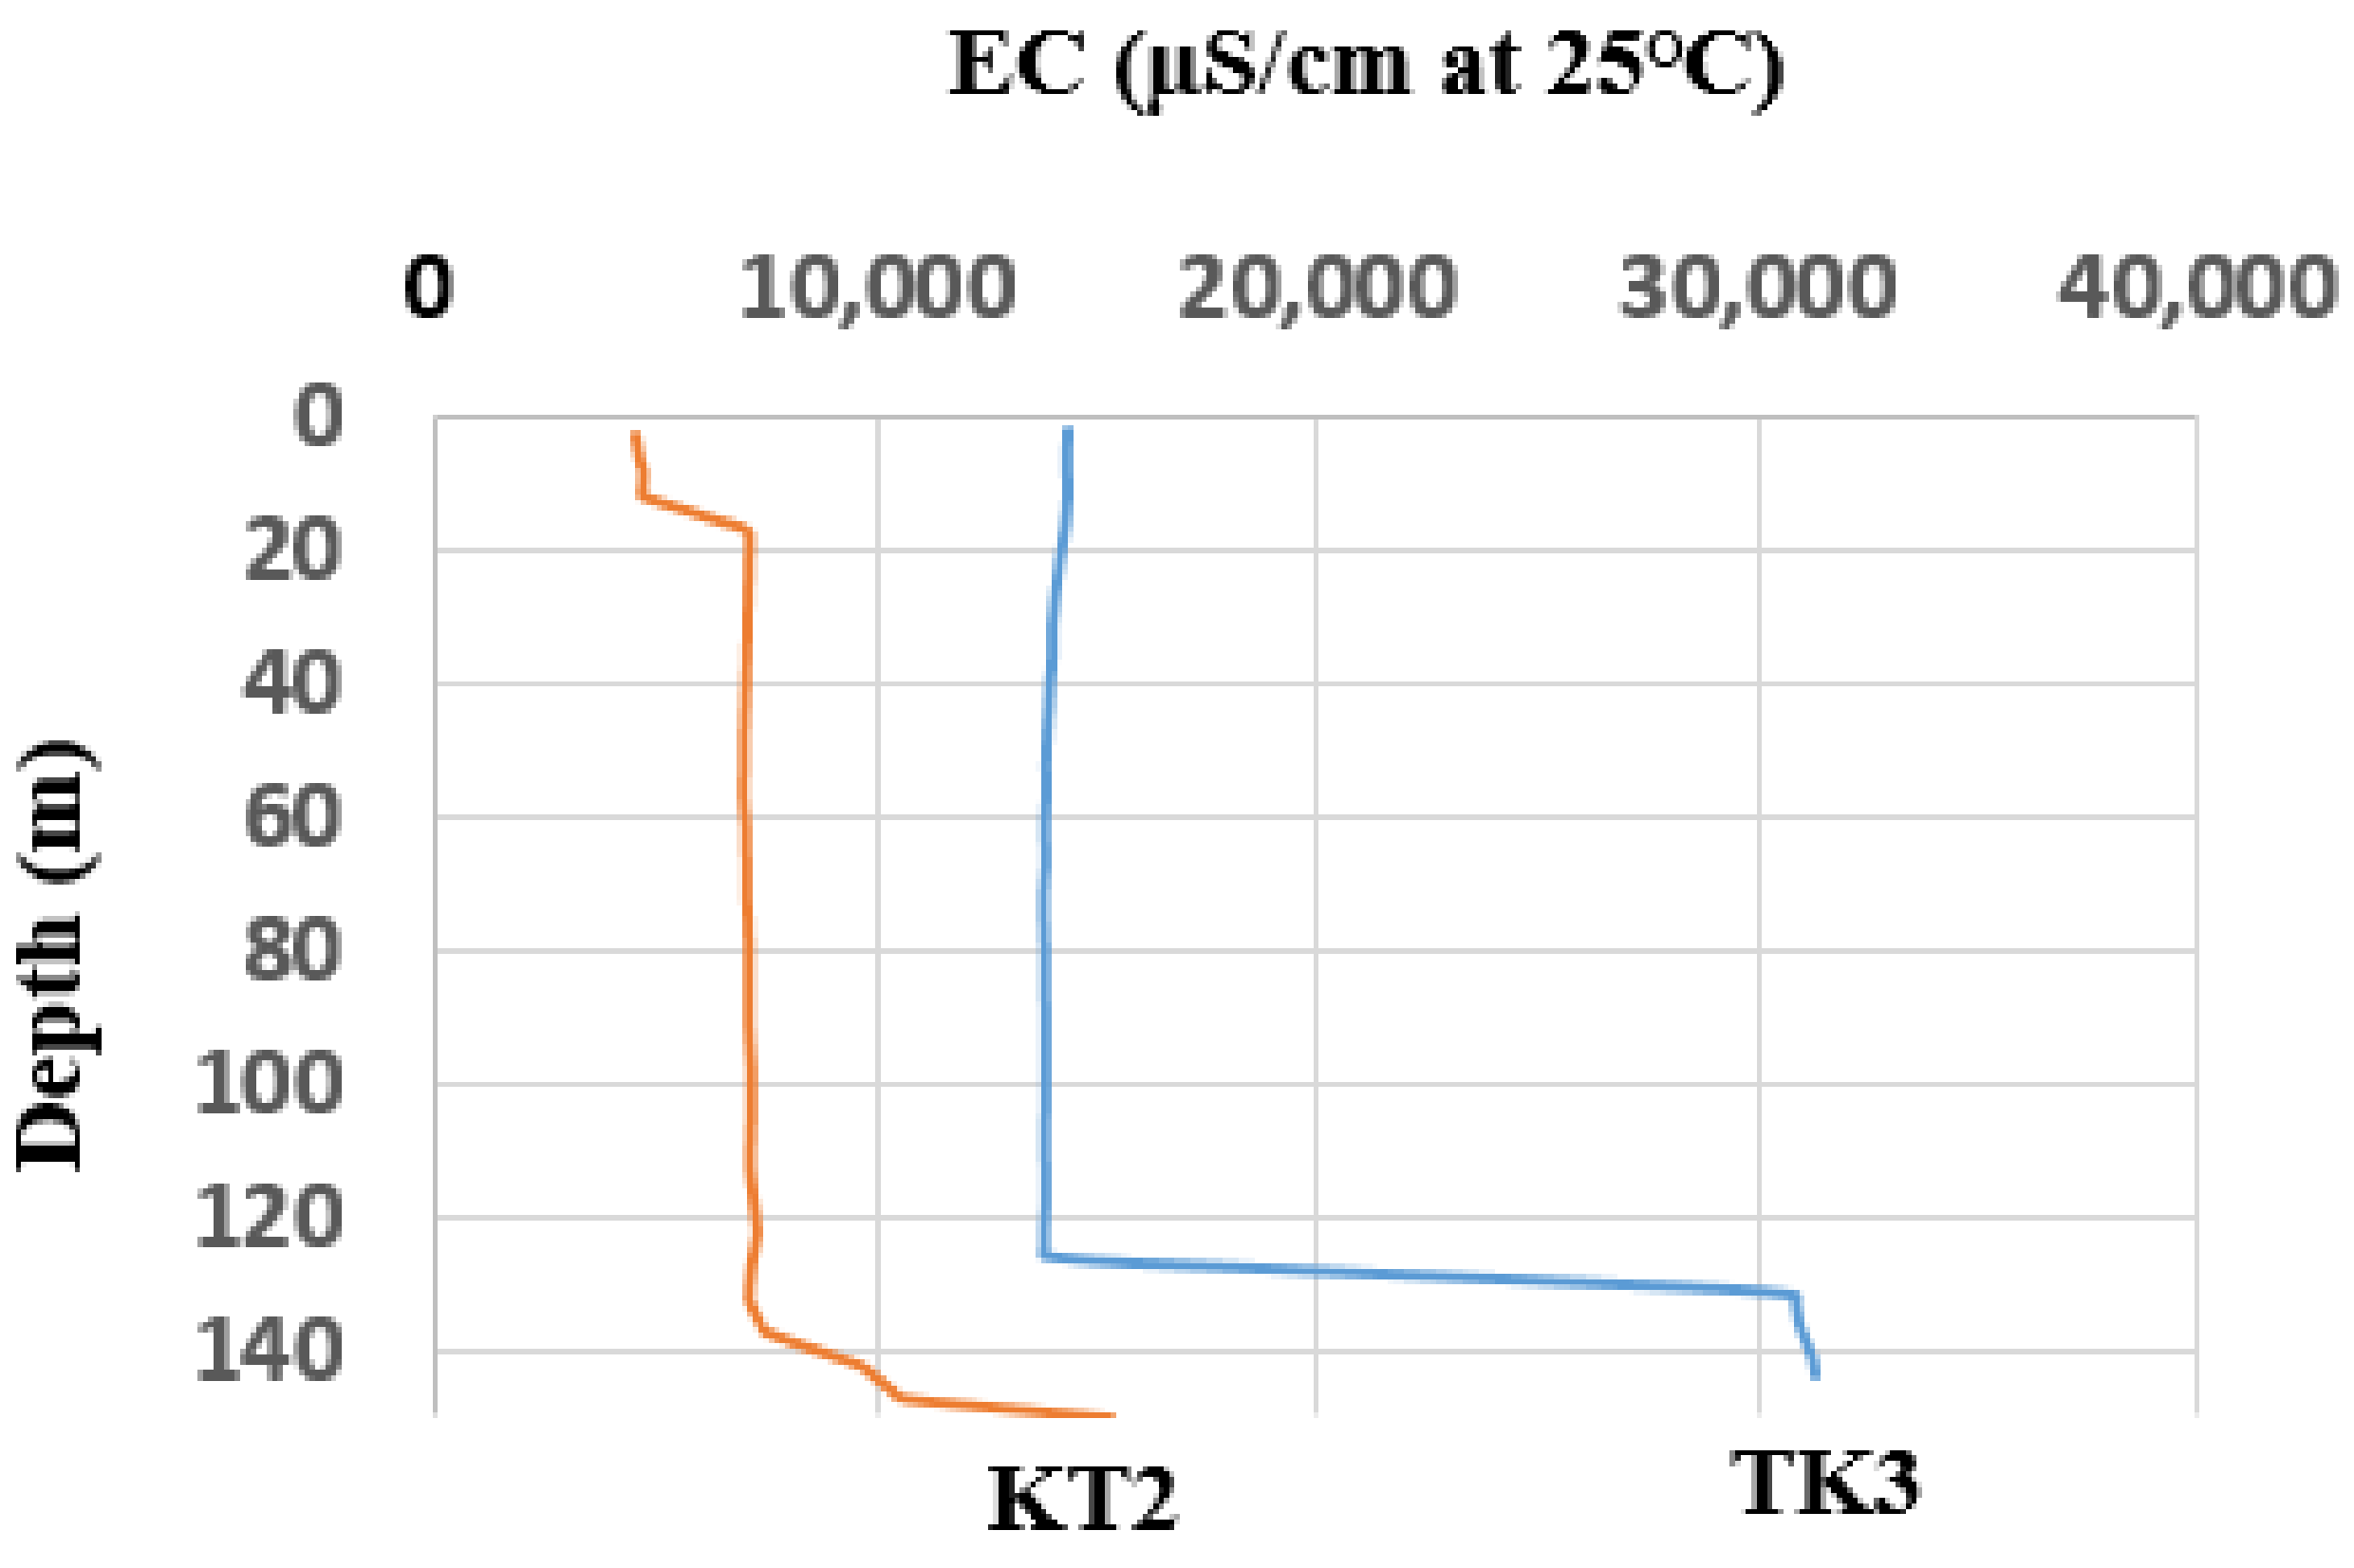
We suggest that EC logging is a robust and inexpensive method for collecting density information for the water column within an observation well. New EC logging data are generally vertically varied within observation wells for saline aquifers of the Pingtung Plain. On 19 July 2021 (
Figure 10), vertical EC values by logging ranged from 4452 to 15,319 μS/cm and 14,346 to 31,341 μS/cm within wells KT2 and TK3, respectively. Calculations for the density of the water column should use an average value rather than just one value at any depth.
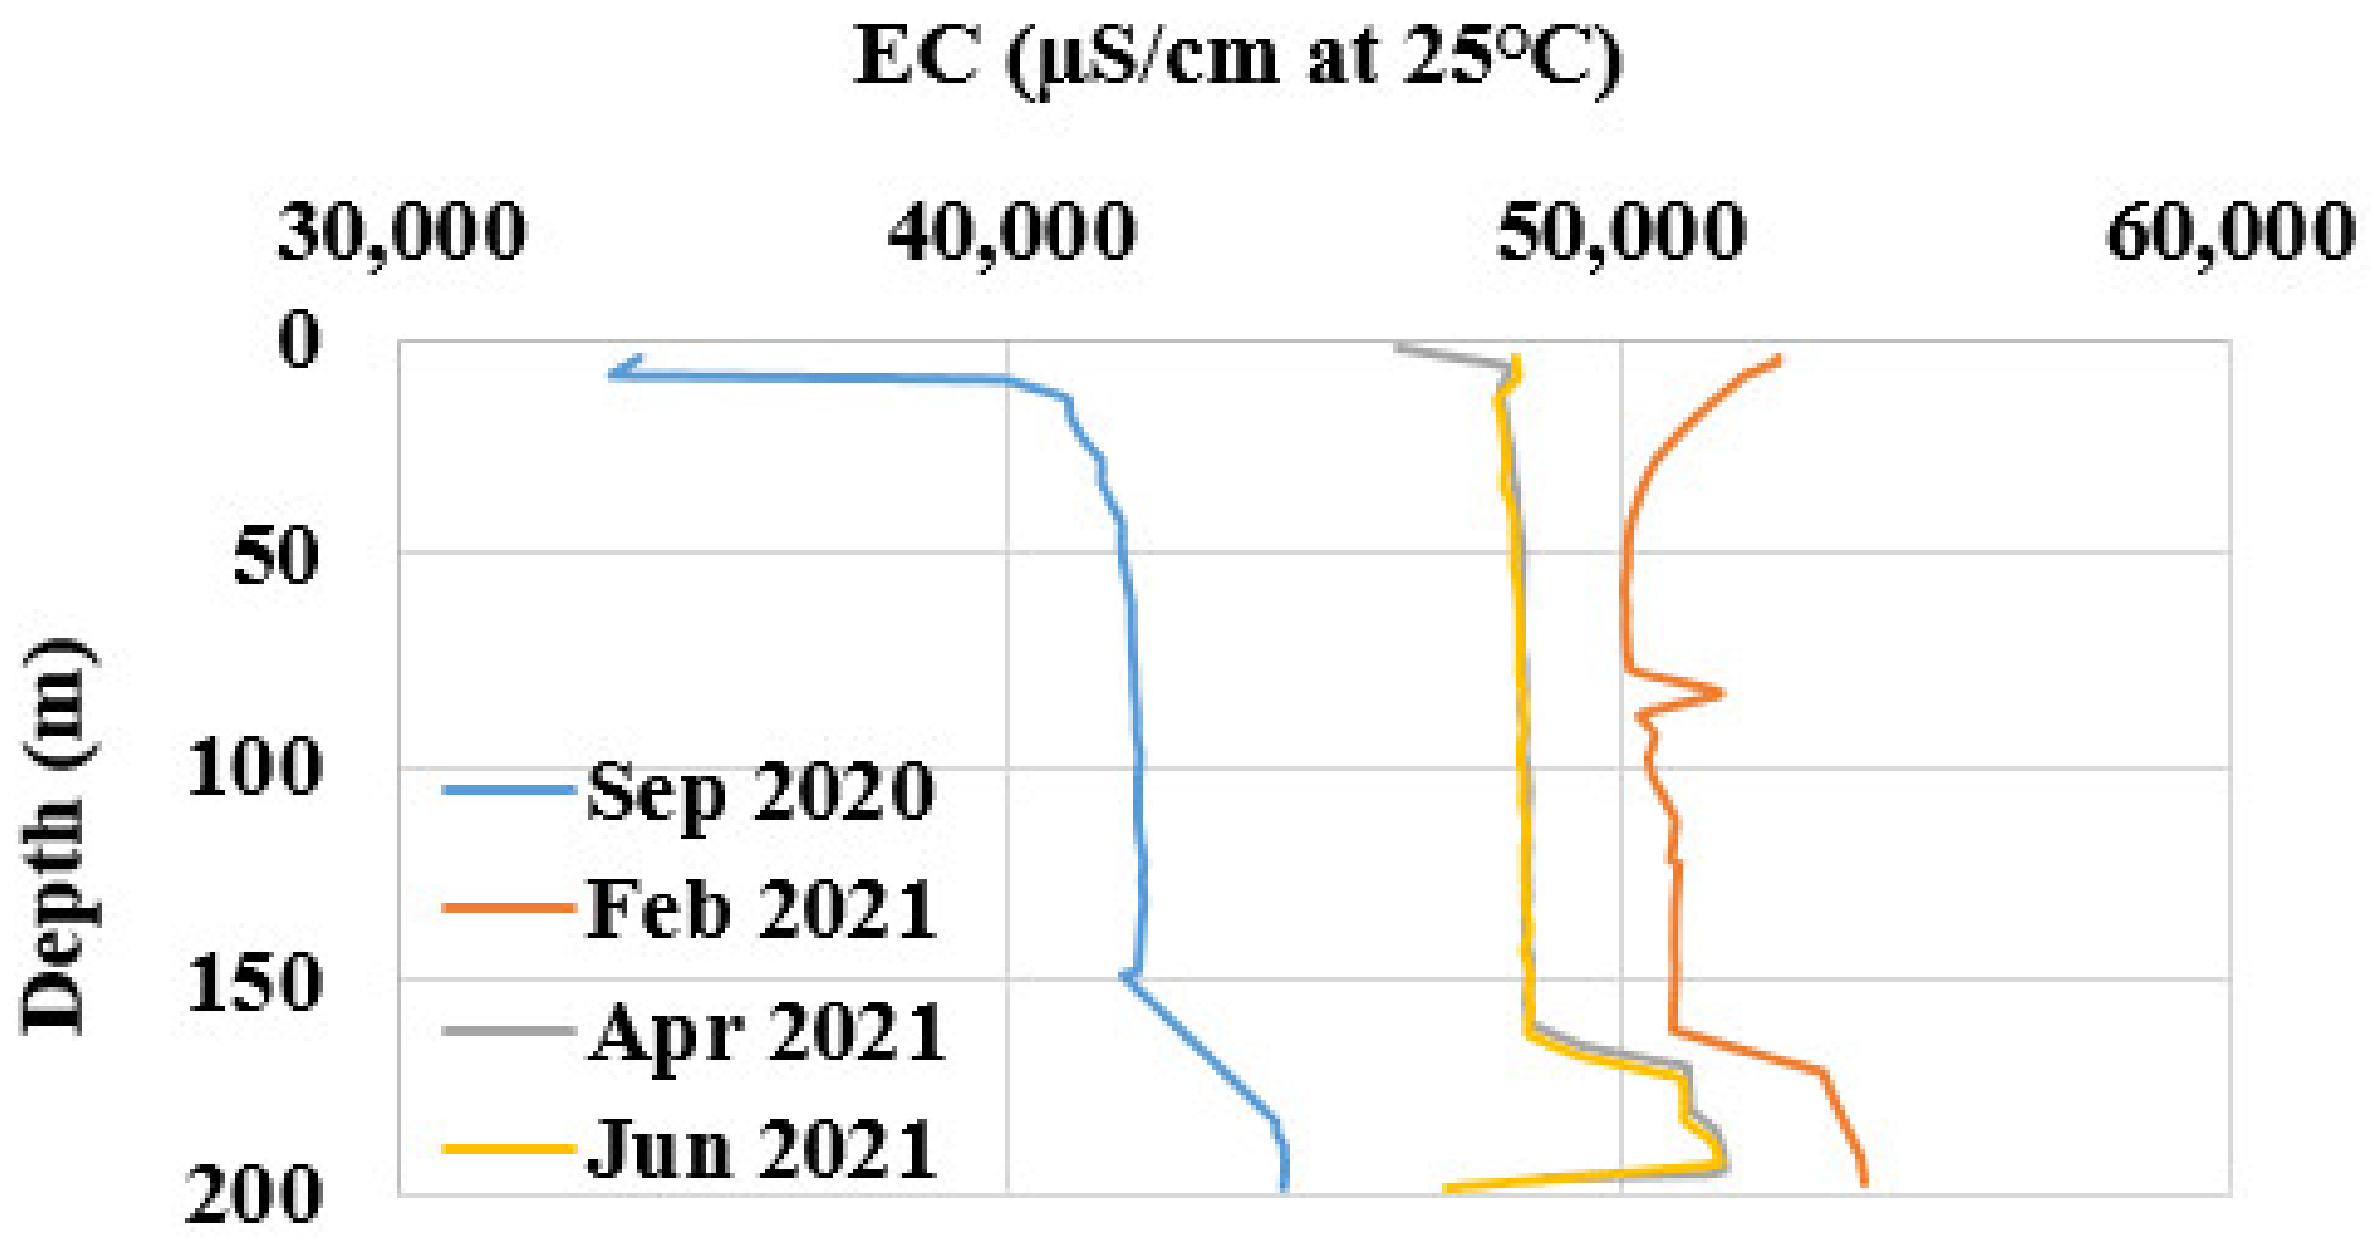
EC logging values within an observation well were not only vertically varied but also varied with season.
Figure 11 shows vertical EC logging values within well TK4 from 2020–2021. EC values ranged from 35,000 to 55,000 μS/cm. Values were higher during the dry season (February 2021) and lowered during the rainy season (September 2020). In summary, for collecting density information within observation wells in saline aquifers, we recommend EC logging using a monthly sampling interval instead of the purging and sampling method.
6. Conclusions
Instead of an observed hydraulic head, we used an equivalent freshwater head to analyze flow components in variable-density groundwater aquifers within the Pingtung Plain, Taiwan. Out of the total 134 observation wells, during 2012, 19 wells were saline with EC values higher than 1500 μS/cm. The misuse of observed hydraulic heads causes a misinterpretation of the flow direction of saline groundwater.
For saline aquifers, the determination of a freshwater head requires density information within the observation well. We recommend using EC logging with a month measurement interval instead of the purging and sampling method. Our research indicates that EC values within an observation well within saline aquifers vary not only vertically but also by season.
Author Contributions
Conceptualization and methodology, Y.-C.C. and W.C.; investigation, resources, and data curation, C.-H.C. and Y.-T.C.; writing—original draft preparation, W.C.; writing—review and editing, Y.-C.C. All authors have read and agreed to the published version of the manuscript.
Funding
We thank the Ministry of Science and Technology of Taiwan, the Central Geological Survey, and the Water Resources Agency for research funding and support.
Institutional Review Board Statement
Not applicable.
Informed Consent Statement
Not applicable.
Data Availability Statement
The data presented in this study is available on request from the corresponding author.
Conflicts of Interest
The authors declare no conflict of interest.
References
- Post, V.; Abarca, E. Preface: Saltwater and freshwater interactions in coastal aquifers. Hydrogeol. J. 2009, 18, 1–4. [Google Scholar] [CrossRef] [Green Version]
- Chiang, C.J. Seawater intrusion in the Pingtung plain. Bull. Cent. Geol. Surv. MOEA 2000, 13, 25–50. (In Chinese) [Google Scholar]
- Taylor, C.J.; Alley, W.M. Ground-Water-Level Monitoring and the Importance of Long-Term Water-Level Data; US Geological Survey: Denver, CO, USA, 2017.
- Guo, W.; Langevin, C.D. User’s guide to SEAWAT—A computer program for simulation of three-dimensional variable-density ground-water flow. Geol. Surv. Open-File Rep. 2002, 1–434, 77. [Google Scholar]
- Schaefer, F.; Walker, R.L. Saltwater intrusion into the Old Bridge aquifer in the Keyport-Union Beach area of Monmouth County, New Jersey. U.S. Geol. Surv. Water Supply Pap. 1981, 2184, 21. [Google Scholar] [CrossRef]
- Fennema, R.J.; Newton, V.P. Ground water resources of the Eastern Shore of Virginia. Va. State Water Control. Board Plan. Bull. 1982, 332, 74. [Google Scholar]
- Sanford, W.E.; Pope, J.P.; Nelms, D.L. Simulation of Groundwater-Level and Salinity Changes in the Eastern Shore, Virginia. Sci. Investig. Rep. 2009, 5006. [Google Scholar] [CrossRef]
- Thorling, L.; Langtofte, C. Measurement of Groundwater Levels—A Field Guide; Technical Guideline; Geological Survey of Denmark and Greenland: Copenhagen, Denmark, 2012; ISBN 978-87-7871-352-0. [Google Scholar]
- Rasmussen, P.; Sonnenborg, T.O.; Goncear, G.; Hinsby, K. Assessing impacts of climate change, sea level rise, and drainage canals on saltwater intrusion to coastal aquifer. Hydrol. Earth Syst. Sci. 2013, 17, 421–443. [Google Scholar] [CrossRef] [Green Version]
- Huang, P.-S.; Chiu, Y.-C. A Simulation-Optimization Model for Seawater Intrusion Management at Pingtung Coastal Area, Taiwan. Water 2018, 10, 251. [Google Scholar] [CrossRef] [Green Version]
- Meyer, R.; Engesgaard, P.; Høyer, A.-S.; Jørgensen, F.; Vignoli, G.; Sonnenborg, T.O. Regional flow in a complex coastal aquifer system: Combining voxel geological modelling with regularized calibration. J. Hydrol. 2018, 562, 544–563. [Google Scholar] [CrossRef]
- Meyer, R.; Engesgaard, P.; Sonnenborg, T.O. Origin and dynamics of saltwater intrusion in a regional aquifer: Combining 3-d saltwater modeling with geophysical and geochemical data. Water Resour. Res. 2019, 55, 1792–1813. [Google Scholar] [CrossRef] [Green Version]
- Dibaj, M.; Javadi, A.A.; Akrami, M.; Ke, K.-Y.; Farmani, R.; Tan, Y.-C.; Chen, A.S. Modelling seawater intrusion in the Pingtung coastal aquifer in Taiwan, under the influence of sea-level rise and changing abstraction regime. Hydrogeol. J. 2020, 28, 2085–2103. [Google Scholar] [CrossRef]
- Post, V.; Asmuth, J.R. Review: Hydraulic head measurements—New technologies, classic pitfalls. Hydrogeol. J. 2013, 21, 737–750. [Google Scholar] [CrossRef] [Green Version]
- Post, V.E.A.; Banks, E.; Brunke, M. Groundwater flow in the transition zone between freshwater and saltwater: A field-based study and analysis of measurement errors. Hydrogeol. J. 2018, 26, 1821–1838. [Google Scholar] [CrossRef]
- Rau, G.C.; Post, V.E.A.; Shanafield, M.; Krekeler, T.; Banks, E.W.; Blum, P. Error in hydraulic head and gradient time-series measurements: A quantitative appraisal. Hydrol. Earth Syst. Sci. 2019, 23, 3603–3629. [Google Scholar] [CrossRef] [Green Version]
- Lusczynski, N.J. Head and flow of ground water of variable density. J. Geophys. Res. Space Phys. 1961, 66, 4247–4256. [Google Scholar] [CrossRef]
- Post, V.; Kooi, H.; Simmons, C.T. Using hydraulic head measurements in variable-density ground water flow analyses. Ground Water 2007, 45, 664–671. [Google Scholar] [CrossRef] [PubMed]
- Simmons, C.T. Variable density groundwater flow: From current challenges to future possibilities. Hydrogeol. J. 2005, 13, 116–119. [Google Scholar] [CrossRef]
- Chen, W.; Sung, S.; Wu, L.; Hsu, H.; Yang, H. Shoreline changes in the coastal plain of Taiwan since last glacial epoch. J. Archaeol. Anthropol. 2004, 62, 40–55. (In Chinese) [Google Scholar]
- Chen, W.; Chen, J.; Lu, W.; Huang, C.; Wang, Y. The relationships of electrical conductivities of surface water and groundwater in the upper fans in Pingtung, southern Taiwan. Spec. Publ. Cent. Geol. Surv. MOEA. 2014, 27, 85–104. (In Chinese) [Google Scholar]
- WRA. Introduction to Groundwater in Pingtung Plain by Taiwan Groundwater Monitoring Net; Taiwan Water Resource Agency: Taichung, Taiwan, 1998; p. 152.
- WRA. Proceedings of conference on groundwater and hydrogeology of Pingtung Plain, Taiwan. Taiwan Water Resource Agency: Taichung, Taiwan, 1998. (In Chinese) [Google Scholar]
- WRA. Introduction to groundwater data quality assurance and control. ePaper Water Resour. Agency Taiwan 2013, 42, 1–2. (In Chinese) [Google Scholar]
- Post, V.E.A. Electrical Conductivity as a Proxy for Groundwater Density in Coastal Aquifers. Ground Water 2012, 50, 785–792. [Google Scholar] [CrossRef] [PubMed]
- Chan, Y.C.; Lin, Y.P.; Tan, Y.C. Evaluation and estimation of groundwater salinization trend in Pingtung plain. J. Chin. Agric. Eng. 2002, 48, 10–18. (In Chinese) [Google Scholar]
Figure 1.
A schematic representation of a hydraulic head (Hi) and an elevation head (Zi). Definitions are provided in Equation (1).
Figure 1.
A schematic representation of a hydraulic head (Hi) and an elevation head (Zi). Definitions are provided in Equation (1).
Figure 2.
The locations of saline groundwater having an EC > 1500 μS/cm (at 25 °C), as well as observation wells within the Pingtung Plain, Taiwan. Hydrogeological profiles are marked with a blue dashed line (Please see
Figure 3).
Figure 2.
The locations of saline groundwater having an EC > 1500 μS/cm (at 25 °C), as well as observation wells within the Pingtung Plain, Taiwan. Hydrogeological profiles are marked with a blue dashed line (Please see
Figure 3).
Figure 3.
Hydrogeological profile and EC values of groundwater during 1999 along the TK–CC wells. The four aquifers are marked as F1 to F3-2, while aquitards are marked as T1 to T3. Blue dashed lines indicate boundaries between freshwater and saline water, while red dashed lines indicate boundaries between saline water and seawater. Two to four observation wells are located at a single site.
Figure 4.
Groundwater EC and the mean level of the screen (elevation head) for the 134 total observation wells within the Pingtung Plain (2012 data from [
21]).
Figure 4.
Groundwater EC and the mean level of the screen (elevation head) for the 134 total observation wells within the Pingtung Plain (2012 data from [
21]).
Figure 5.
Freshwater heads and observed hydraulic heads for saline groundwaters during 2012.
Figure 5.
Freshwater heads and observed hydraulic heads for saline groundwaters during 2012.
Figure 6.
(A) Observed annual hydraulic heads (m) within aquifer F3-2 during 2012. (B) Freshwater heads were calculated based on observed annual hydraulic heads, EC, and mean screen level. Observation wells marked with a red circle were saline groundwaters with an EC > 1500 μS/cm, which represent a potential seawater intrusion area. Black arrows indicate the flow directions of fresh groundwater, while the flow directions of saline groundwater are marked by red arrows. The depth of aquifer F3-2 is approximately 150–230 m, with an average depth of 190 m. The freshwater head of seawater at a depth of 190 m is approximately 4.95 m (red dashed line).
Figure 7.
The groundwater EC (μS/cm at 25 °C) in the F3-2 during 2004–2019. The area marked by a red dashed line represents a saline area in which ECs were > 1500 μS/cm. (A) 2004–2005; (B) 2009–2010; (C) 2014–2015; (D) 2018–2019.
Figure 7.
The groundwater EC (μS/cm at 25 °C) in the F3-2 during 2004–2019. The area marked by a red dashed line represents a saline area in which ECs were > 1500 μS/cm. (A) 2004–2005; (B) 2009–2010; (C) 2014–2015; (D) 2018–2019.
Figure 8.
(A) The freshwater heads and flow directions of groundwater for the four aquifers within the Pingtung Plain during 2012. (A) The depth of aquifer F1 ranges from 0 to 50 m below the land surface, with an average depth of 25 m. The fresh head is 0.65 m, with an average depth of 25 m of seawater. The area marked by a red dashed line represents a potential seawater intrusion area in which freshwater heads were <0.65 m. (B) Aquifer F2 is 50–100 m in depth, with an average of 75 m. The freshwater head for 75 m seawater depth is 1.95 m. (C) Aquifer F3-1 is 100–150 m in depth, with an average of 125 m.
Figure 9.
The annual observed hydraulic heads (black lines) of the four observation wells that screen aquifer F3-1 along the TK–CC profile. The freshwater heads (dash lines) of observation wells TK3 (red) and KT2 (blue). The flow direction between TK3 and KT2 changed during 2015, according to the freshwater heads, while an interpretation of no change was found when using the observed hydraulic heads.
Figure 10.
Vertical EC logging values within wells KT2 and TK3 on 19 July 2021.
Figure 10.
Vertical EC logging values within wells KT2 and TK3 on 19 July 2021.
Figure 11.
Vertical EC logging values within well TK4 during 2020–2021.
Figure 11.
Vertical EC logging values within well TK4 during 2020–2021.
Table 1.
Studies on the simulation of groundwater-level within saline aquifers.
Table 1.
Studies on the simulation of groundwater-level within saline aquifers.
| | Case 1 | Case 2 | Case 3 |
|---|
| Location | Eastern Shore, Virginia, USA | Danish–German border | Pingtung, Taiwan |
| Number of observation wells | 51 | 22 | 134 |
| Well depth (m below the land surface) | 6–113 | 18–345 | 18–270 |
| Electrical conductivity (μS/cm) | 104–7906 | 334–13,590 | 195–51,900 |
| Sources of observed groundwater levels | Virginia observation-well network | Danish national database | Taiwan Water Resources Agency |
| Numerical Model | SEAWAT | SEAWAT | SEAWAT FEFLOW |
| References | [6,7] | [8,11,12] | [10,13] |
Table 2.
The freshwater heads of observation wells with EC >1500 μS/cm during 2012.
Table 2.
The freshwater heads of observation wells with EC >1500 μS/cm during 2012.
Observation
Well | EC
(μS/cm) | Density
(kg/m3) | Mean Level
of Screen
(m) | Annual Hydraulic
Head in 2012
(m) | Freshwater
Head in 2012
(m) | Difference
in Head
(m) |
|---|
| 1. CF1 | 51,900 | 1026.0 | −16.53 | −0.78 | −0.37 | 0.41 |
| 2. TK4 | 50,900 | 1025.5 | −177 | −0.43 | 4.07 | 4.50 |
| 3. SY2 | 49,800 | 1024.9 | −171.02 | −0.96 | 3.28 | 4.24 |
| 4. KT3 | 30,300 | 1014.9 | −172.63 | 0.2 | 2.77 | 2.57 |
| 5. LY3 | 30,000 | 1014.7 | −174.96 | 2.53 | 5.14 | 2.61 |
| 6. DS1 | 28,100 | 1013.7 | −8.42 | −0.01 | 0.11 | 0.12 |
| 7. LY2 | 26,900 | 1013.1 | −120.96 | 2.41 | 4.03 | 1.62 |
| 8. TK2 | 15,800 | 1007.4 | −75 | 1.4 | 1.97 | 0.57 |
| 9. DT2 | 15,500 | 1007.3 | −171.08 | 3.04 | 4.30 | 1.26 |
| 10. KT4 | 14,200 | 1006.6 | −247.63 | 1.8 | 3.44 | 1.64 |
| 11. SH1 | 5610 | 1002.2 | −25.51 | −0.19 | −0.14 | 0.05 |
| 12. DS3 | 3210 | 1000.9 | −164.42 | −5.91 | −5.76 | 0.15 |
| 13. CF2 | 3050 | 1000.8 | −58.03 | −3.97 | −3.92 | 0.05 |
| 14. CF4 | 2780 | 1000.7 | −188.03 | 1.8 | 1.93 | 0.13 |
| 15. KT2 | 2720 | 1000.7 | −127.63 | 1.82 | 1.91 | 0.09 |
| 16. TK1 | 2700 | 1000.7 | −10.5 | 0.16 | 0.17 | 0.01 |
| 17. KT1 | 2620 | 1000.6 | −34.63 | 0.48 | 0.50 | 0.02 |
| 18. DS2 | 2111 | 1000.4 | −114.92 | −15 | −14.96 | 0.04 |
| 19. TK3 | 1860 | 1000.2 | −129 | 0.34 | 0.37 | 0.03 |
Table 3.
The EC (μS/cm at 25 °C) of four wells within aquifer F3-1 along the TK–CC profile from 1999–2018.
Table 3.
The EC (μS/cm at 25 °C) of four wells within aquifer F3-1 along the TK–CC profile from 1999–2018.
| Year | TK3 | KT2 | KD2 | CC2 |
|---|
| 1999 | 44,500 | 539 | 307 | 334 |
| 2000 | 1114 | 1003 | 305 | 330 |
| 2001 | 1041 | 1336 | 341 | 353 |
| 2002 | 27,328 | 2520 | 378 | 418 |
| 2003 | 11,140 | 3080 | 309 | 341 |
| 2004 | 18,300 | 3410 | 317 | 347 |
| 2005 | 18,870 | 2190 | 322 | 347 |
| 2006 | 19,200 | 2430 | 309 | 341 |
| 2007 | 11,960 | 1801 | 311 | 364 |
| 2008 | 1534 | 2660 | 320 | 346 |
| 2009 | - | - | - | - |
| 2010 | 1334 | 2000 | 386 | - |
| 2011 | - | - | - | - |
| 2012 | 1860 | 2720 | 369 | 360 |
| 2013 | - | - | - | - |
| 2014 | 756 | 593 | 785 | 321 |
| 2015 | 23,700 | 4820 | - | - |
| 2016 | 24,500 | 3570 | - | - |
| 2017 | 23,300 | 3840 | - | - |
| 2018 | 21,700 | 3280 | 292 | 375 |
| Publisher’s Note: MDPI stays neutral with regard to jurisdictional claims in published maps and institutional affiliations. |
© 2021 by the authors. Licensee MDPI, Basel, Switzerland. This article is an open access article distributed under the terms and conditions of the Creative Commons Attribution (CC BY) license (https://creativecommons.org/licenses/by/4.0/).


