Article

The Use of Phytoplankton in the Assessment of Water Quality in the Lower Section of Poland’s Largest River

by
Ewa Anna Dembowska
Department of Microbiology and Immunobiology, Faculty of Biological Sciences, Kazimierz Wielki University, Powstańców Wielkopolskich 10, 85-090 Bydgoszcz, Poland
Water 2021, 13(23), 3471; https://doi.org/10.3390/w13233471
Submission received: 26 October 2021 / Revised: 28 November 2021 / Accepted: 3 December 2021 / Published: 6 December 2021
(This article belongs to the Special Issue Water Quality Assessment and Ecological Monitoring in Aquatic System)

Abstract

:
Phytoplankton studies were carried out in the lower course of Poland’s largest river, the Vistula. This section of the Vistula has changed much since the 19th century due to regulation of the bed and limitation of its flood banks. In the years 1994–2020, hydrobiological studies of physical and chemical parameters and phytoplankton were carried out. On the basis of these studies, this research investigated the water quality of the river. Since 2000, a gradual improvement in water quality in the river has been observed, as manifested by decreasing phytoplankton biomass (from over 15 mg/L in 1994 and 2003 to less than 10 mg/L in the 2000s) and lower chlorophyll a concentrations (from 48 µg/L in 1998 to 12.5 µg/L in 2020). The river’s ecological potential index, calculated on the basis of indicator species of phytoplankton and chlorophyll a concentration, also indicates a progressive improvement. In the 1990s, the ecological potential was poor; at the turn of the century, it was moderate; and in the following years, the phytoplankton studies showed an ecological potential that was good or moderate (slightly below the lower threshold of good potential).

1. Introduction

Phytoplankton plays a very important role in aquatic ecosystems, where—as a group of principal primary producers—it integrates mineral chemicals into the biological cycle. Phytoplankton research focuses mainly on the functioning of this community in stagnant waters. For many years, river plankton (potamoplankton) has not been given sufficient attention [1] because it was believed that phytoplankton can only grow in stagnant waters. Potamoplankton studies are still rare and account for no more than 15% of published papers [2].
In flowing waters, phytoplankton only develops under slow-flow conditions, such as in large rivers or manmade reservoirs. However, in recent decades, observations have brought many new findings [3]. The authors of most studies emphasise the importance of river current velocity and retention time as factors regulating the development of this assemblage [4,5,6]. Hydrological factors are often indicated as key to the development of phytoplankton, with availability of nutrients and water pollution being seen as being of lesser importance [7].
In the research of European waters, the beginning of the 21st century can be described as the era of the Water Framework Directive. Constantly progressing eutrophication of surface waters, and thus the deteriorating quality and availability of water in Europe, forced the European Parliament to establish the Water Framework Directive (WFD) (2000/60/EC).
Numerous activities were undertaken to harmonise the assessment of the ecological status of natural waters and the ecological potential of heavily changed waters and manmade reservoirs. This directive required the Member States to achieve at least “good ecological status” and “good chemical status” of surface waters by 2015 [8]. However, due to the complexity of the problems related to the unification of water quality assessment in different parts of Europe, this goal was unachievable in such a short time. The European Commission has set a new deadline of 2027 [9]. Due to the long-term verification of the developed methods and inter-calibration exercises between the EU countries, work is still ongoing to update and verify surface water bodies in Poland, as well as to verify boundaries for water quality classes.
The assessment of ecological status/potential in rivers is mainly based on assessing biological elements such as phytoplankton, phytobenthos (mainly diatomaceous), macrophytes, zoobenthos, and ichthyofauna. Among these organisms, benthic invertebrates and diatoms are the most common indicators for assessing river quality in Europe [10]. Phytoplankton is studied in only 4% of EU river waters, and in only 16 EU member states [11]. This is probably because some countries lack sufficiently large rivers for such studies to be required: phytoplankton communities develop in large, free-flowing rivers with long water retention times. Phytoplankton, as the first link in the trophic chain, responds fastest to changes in the aquatic environment, and for this reason is an excellent indicator of water quality [12].
The aim of the research was to assess changes in the ecological potential of the Lower Vistula waters over the last 26 years. The economic crisis in Poland in the 1990s and the intensification of environmental protection efforts at the turn of the 21st century should have a visible positive impact on the water’s quality and, thus, its ecological potential. The trends in the dynamics of phytoplankton development in the waters of the Vistula were traced in the years 1994–2020.

2. Materials and Methods

With a length of 1068 km, the Vistula is the longest river in Poland, and it has a catchment area of 194,000 km2 and a slope of around 0.18 ‰. It has all the characteristics of a lowland river over most of its course. The section of the Vistula between km 718 and km 941 is highly regulated, with an almost completely deforested valley and flood embankments built in the 19th century [13]. Ecological potential is assessed in the lower section of the Vistula, due to the far-reaching modification of the riverbed and valley there. The Lower Vistula covers the section between km 550 and km 941 of its course (between the mouth of the Bug and Narew, and the estuary to the Baltic Sea) and has a long-term average flow in the range of 900–1050 m3/s [14,15], but the flow rate in the study period ranged from 228 m3/s in 2015 to 6190 m3/s in 2010. For biological evaluation, the studied section should be included in the R-01 category (very large rivers) [16], which in Poland are called “great lowland rivers” [12]. These rivers are characterised by catchment areas of >10,000 km2.
Long-term observations of phytoplankton were carried out in the lower section of the Vistula at sites located in Toruń (Figure 1) between km 727 and km 744 of its course. The research covered a section of 17 km, for which the environmental conditions were assumed not to have significantly changed. This section of the river flows through the urban and suburban areas of Toruń. In this section, the river is heavily regulated and embanked, has no tributaries, and is characterised by a low flow velocity (0.3–0.9 m/s). With such a slow flow of water, the phytoplankton travels the studied distance in between 5 and fewer than 16 h. Therefore, this time is too short for any significant changes to occur in the phytoplankton structure.
Water samples were collected at different frequencies (4–8 times per growing season (Apr–Oct)) in the years 1994, 1997, 1998, 2003, 2007, 2008, 2009, 2013, 2017, and 2020.
The following variables were measured in situ using a portable probe (WTW MultiLine P4): water temperature (WT; °C), pH, dissolved oxygen concentration (DO; mg/L), and electrical conductivity (EC; μS/cm). Water was collected for analysis of chlorophyll a concentrations (Chl-a; µg/L) with each phytoplankton sampling. In 1994, 1998, 2008, 2009, and 2017, water was also taken for nutrient analysis (TP, P-PO4, TN, and Nmin.). River flow rate information for the Vistula was obtained from the Institute of Meteorology and Water Management, National Research Institute (IMGW-PIB). Vistula flow rates were measured at the gauging station in Toruń, situated at km 734.7.
For qualitative analysis (species composition), phytoplankton was collected from the water column with a plankton net of 10 µm mesh size and fixed with 4% formaldehyde. The species composition of phytoplankton was examined under LM. Diatoms were determined after their prior cleaning with ≈30% H2O2 and heated, then rinsed with distilled water, treated with the addition of 10% HCl, and washed again with distilled water. The diatom material was mounted in Naphrax® Brunel Microscopies Ltd., Chippenham, UK. synthetic resin with refractive index 1.74. The taxonomical identification of algae was performed according to available keys and publications [17,18,19,20,21,22,23,24,25,26,27,28,29,30,31,32,33,34,35,36,37].
For quantitative analysis, 100 mL of non-concentrated water was collected from a depth of around 0.5–1.0 m (euphotic zone) and fixed with J in KJ (Lugol solution). Quantitative assessment of phytoplankton was prepared according to the Utermöhl method [38] (i.e., in an inverted microscope), and algal cells, colonies, or coenobia were counted from a volume of 1–20 mL of water. Phytoplankton biovolume was calculated by volumetric method [39,40,41]. Biovolume is presented as biomass (wet weight) per litre (B, mg/L). It was assumed that 1 mm3 of algae is equal to 1 mg [42,43]. Chlorophyll a concentration was determined in ethanol extract according to the Nush method [44]. For chlorophyll a analyses, water was filtered through Whatman GF/C glass fibre filter and extracted in 90% ethanol for 24 h. Absorbance was measured using a Jasco UV/VIS V-530 spectrophotometer. Nutrient analysis (TP, P-PO4, TN, and Nmin.) was carried out using standard methods.
The ecological status or ecological potential of Polish flowing waters are determined using the IFPL multimetric phytoplankton index for rivers [45]. This index is the arithmetic mean of the trophic index calculated on the basis of the biomass of phytoplankton indicator species and an index based on the concentration of chlorophyll a in water.
The ecological status/ecological potential calculated on the basis of the IFPL index corresponds to the ecological quality index (EQR = observed/reference) and takes one of five classes with scale status (high, good, moderate, poor, and bad), depending on the scale of deviation from the reference conditions, where 0 corresponds to the maximum deviation (i.e., bad) and 1 corresponds to no deviation (i.e., high) [46]. The final classification is made using standards developed for various types of flowing water in Poland (Table 1). These standards are published as an ordinance of the relevant ministry and updated every few years [47].
By graphically presenting the results of species richness (S), Shannon–Wienner diversity index (H’), phytoplankton biomass (B), ecological potential index (IFPL), and physical and chemical parameters, this study was also able to plot trend lines (regression lines) as functions of time. These lines illustrate trends in data series and are commonly used when creating forecast charts. Linear regression is based on the least square method. For linear regression, the response variable (y) is linearly correlated with the independent variable (x):
y = α x + β
where α is the linear slope and β the intercept.
Linear regression was calculated using Excel.

3. Results

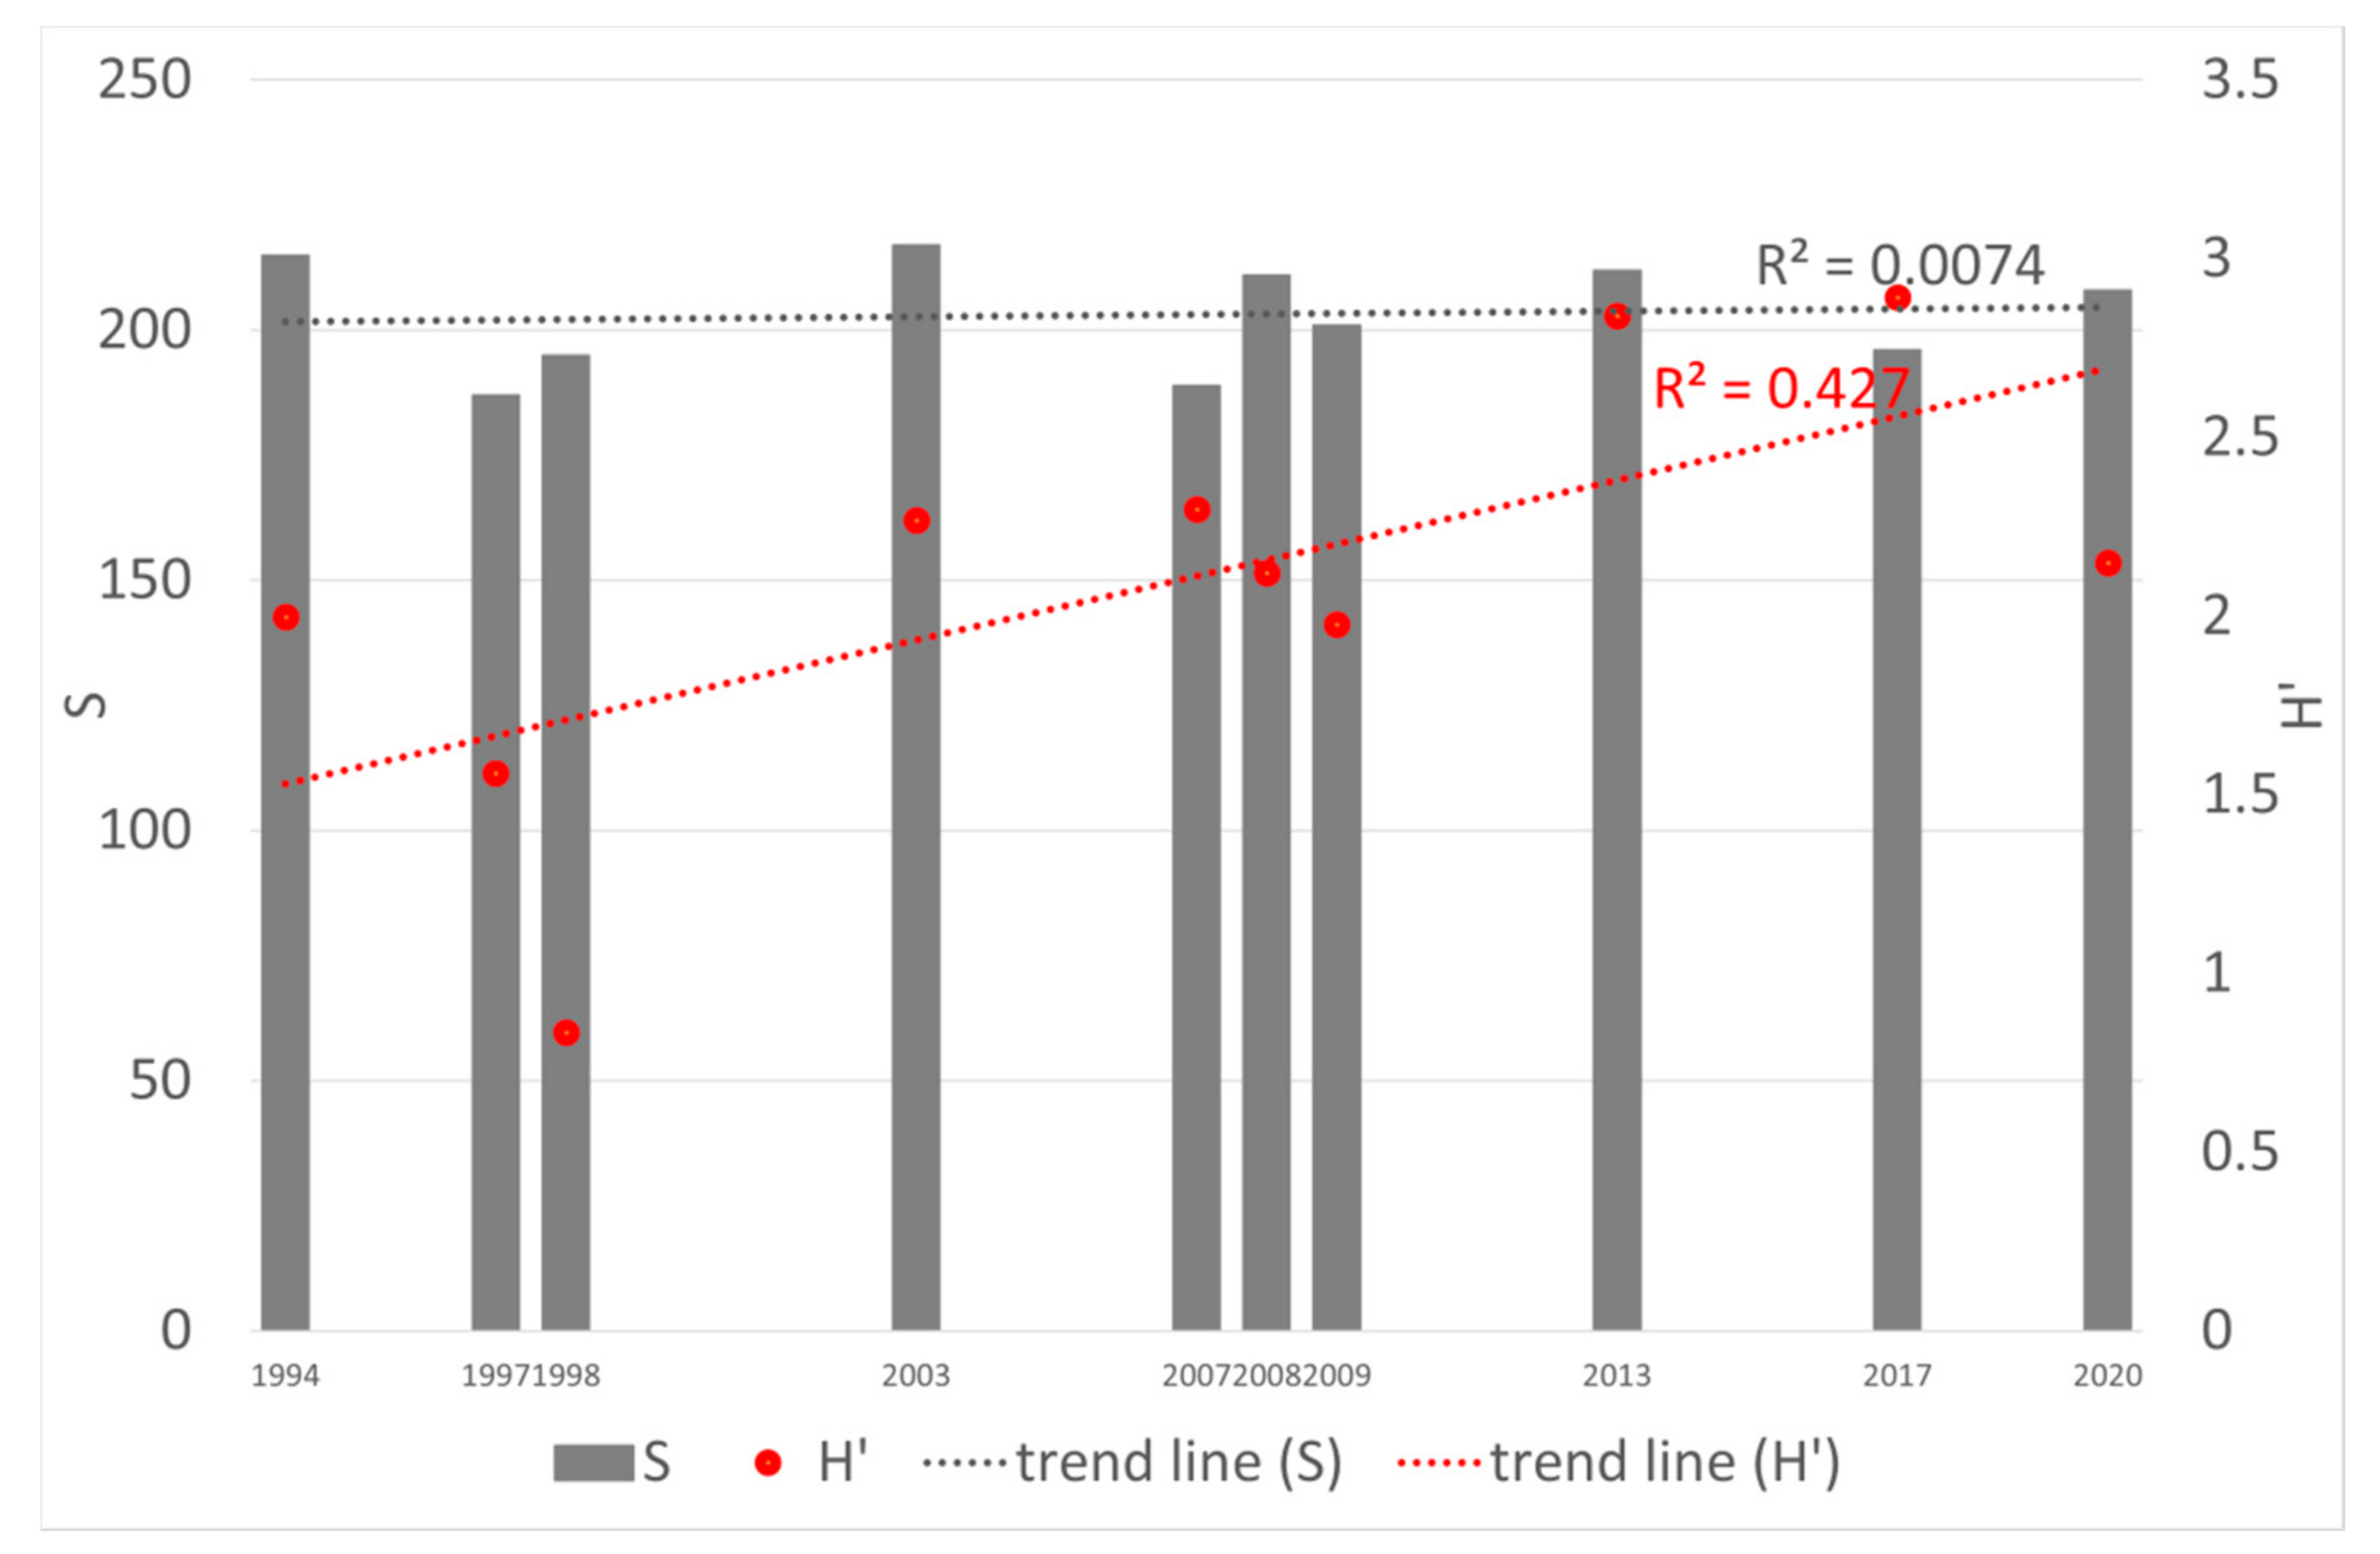
Altogether, 465 phytoplankton taxa were recorded in the entire material, most of which were Bacillariophyceae (228 taxa) and Chlorophyta (mainly Chlorococcales) (157 taxa). Most of the diatom species found in the Vistula belonged to benthic forms. About 200 phytoplankton species were found in each year of the study (Figure 2). During the study period, the number of species was almost constant. The Shannon−Wiener diversity index calculated on the basis of phytoplankton biomass showed a distinct upward trend (R2 = 0.43).
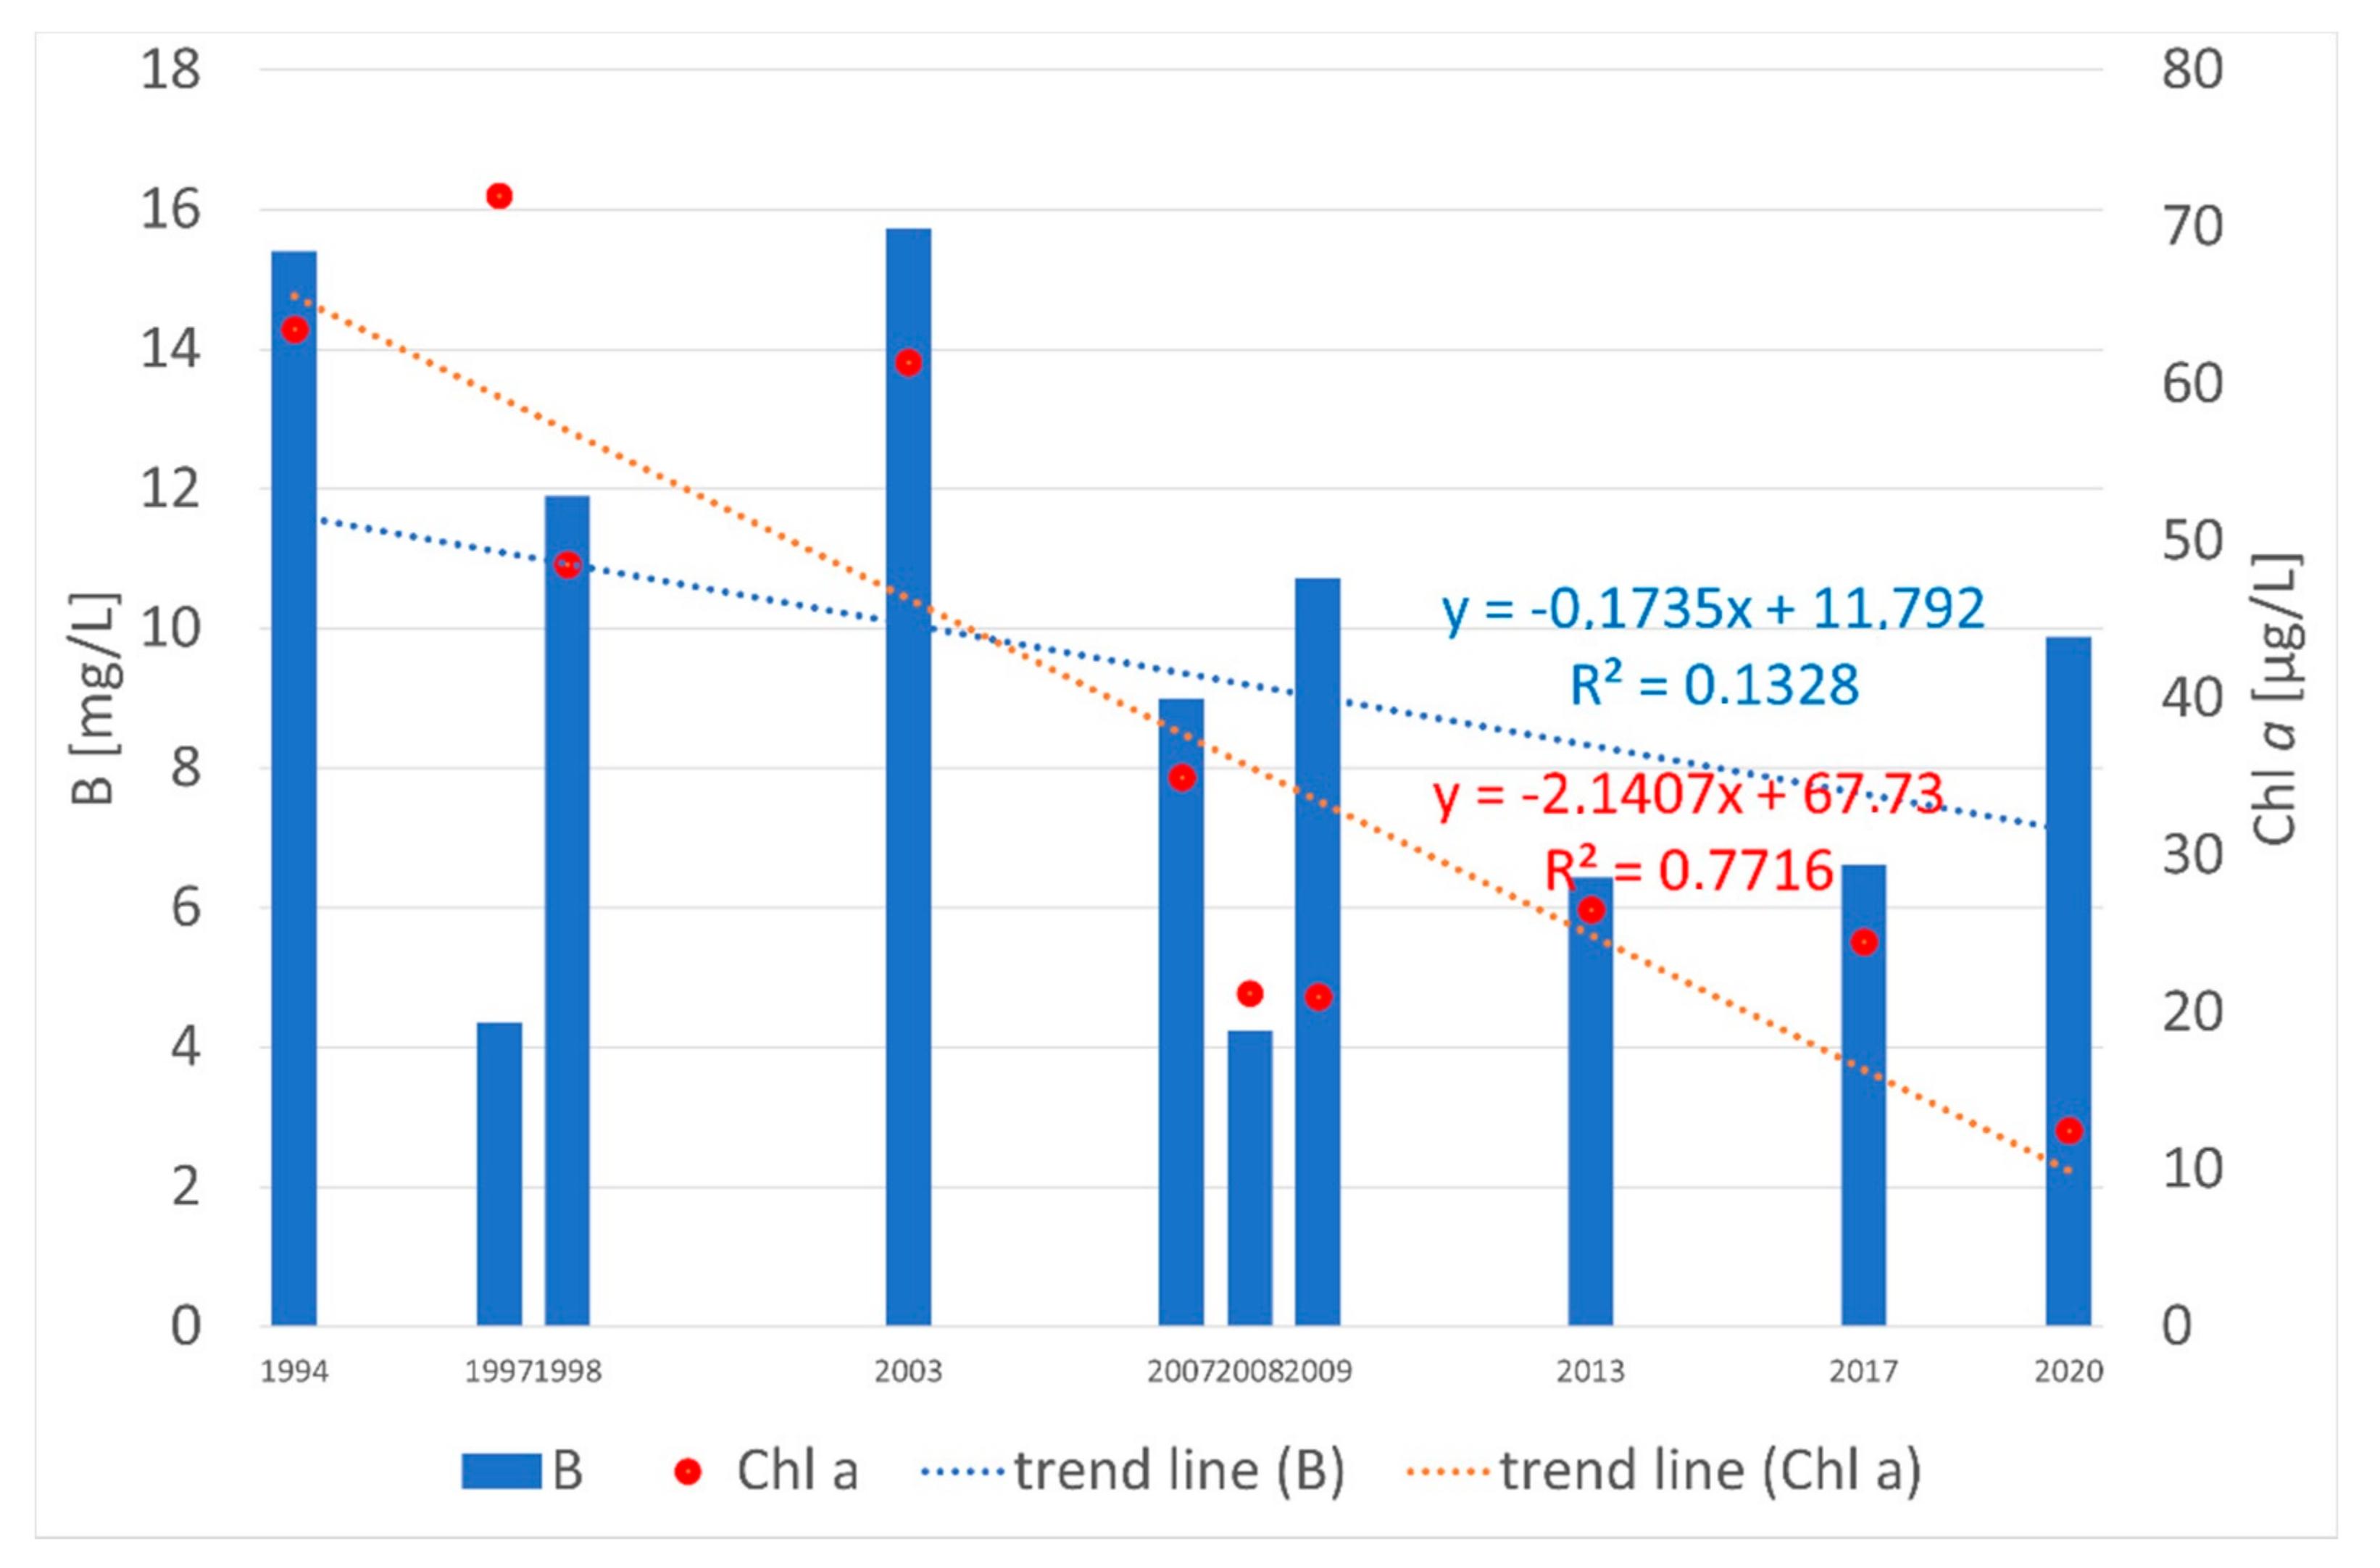
Phytoplankton biomass was greatest in 2003 (15.73 mg/L) (Figure 3) and least in 2008 (4.24 mg/L). The trend line shows a gradual but weak (R2 = 0.13) reduction in phytoplankton biomass, as well as a strong reduction of chlorophyll a concentrations (R2 = 0.77) in the period from 1994 to 2020.
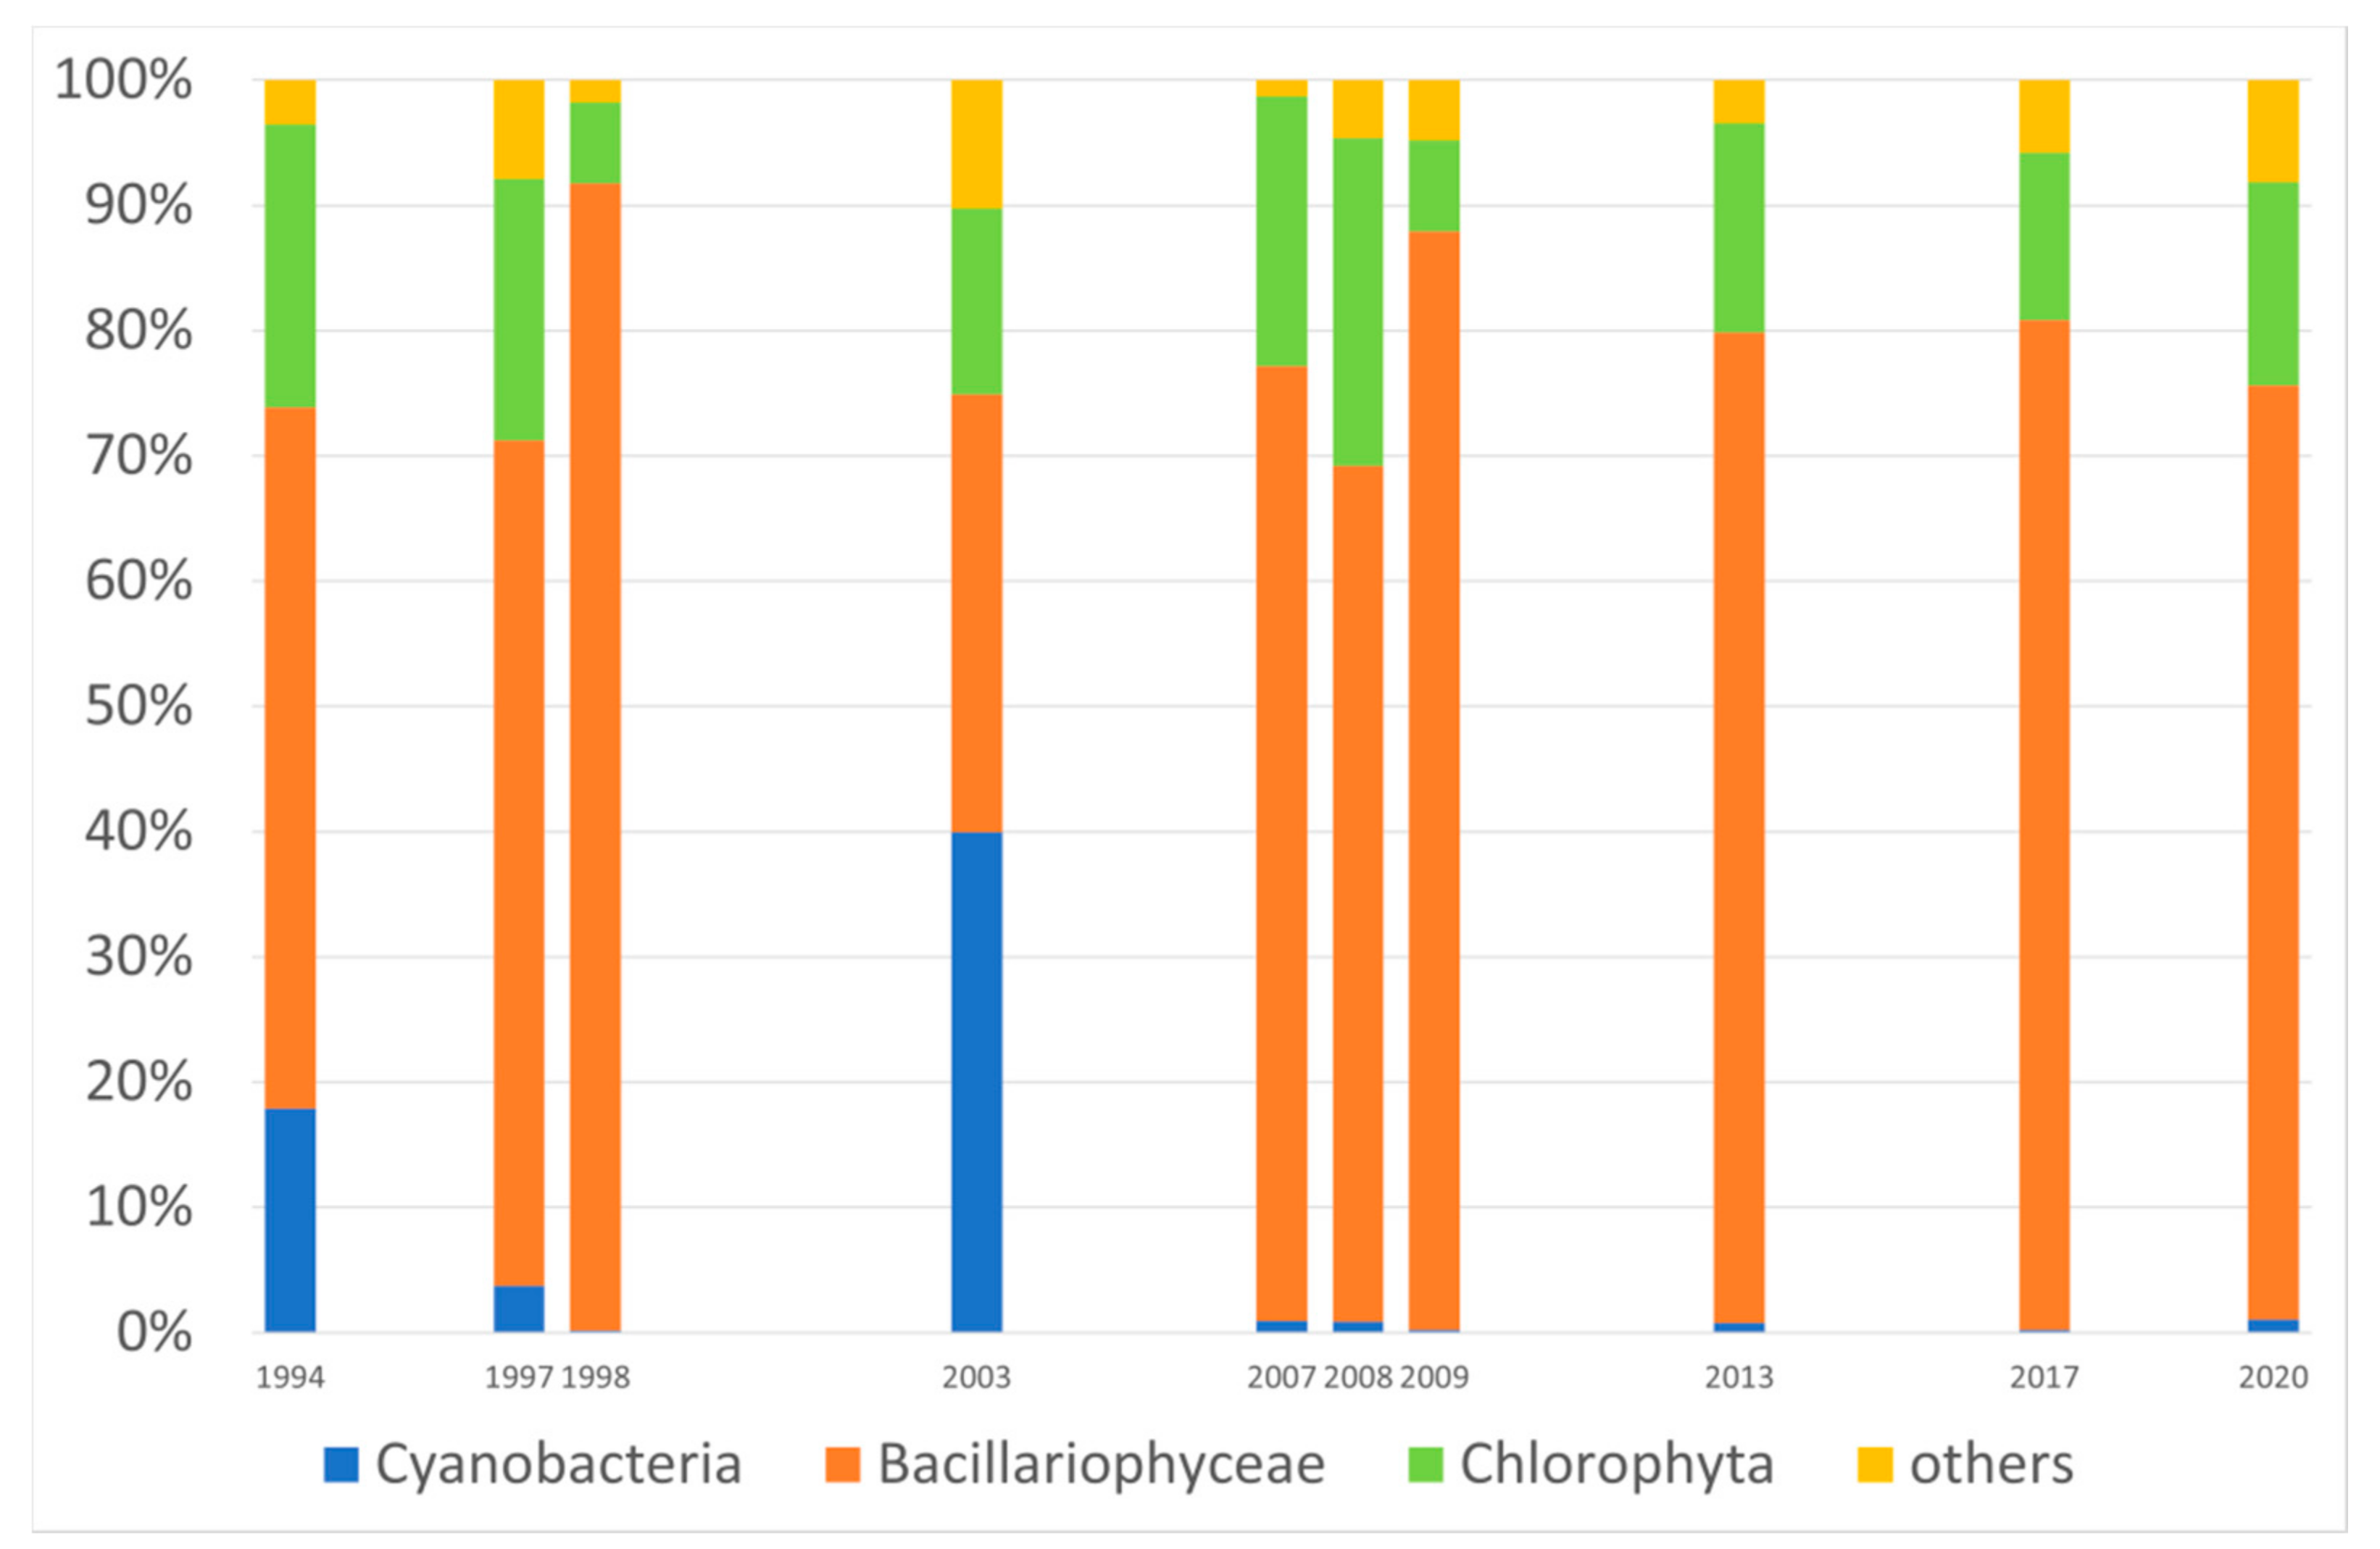
Diatoms were the dominant taxonomic group in most samples and accounted for 8.0–99.5% of total phytoplankton biomass. The average share of Bacillariophyceae in the total biomass of phytoplankton was 68.8% (Figure 4). The second most important group in the Vistula phytoplankton was green algae, mainly belonging to the order Chlorococcales. Their average share was about 16%. The remaining phyla of planktonic algae developed significantly less. However, in some years, representatives of Cyanobacteria or Cryptophyta appeared in greater numbers and biomass. In August of 1994 and 2003, Oscillatoriales had a share of about 60%, and in October 2009, Cryptophyta accounted for over 50% of biomass.
There was a constant upward trend in number of phytoplankton species in biomass. In the years 1994–1998, the presence of 34 codominant taxa of algae was found. In 2003–2007, from 60 to 63 taxa codominated, while in 2017, the number of species important in biomass increased to 87 taxa. The species with the highest biomass were mainly the typically planktonic centric diatoms, such as Aulacoseira granulata (Ehrenberg) Simonsen (with varieties), Actinocyclus normanii (W.Gregory ex Greville) Hustedt, Cyclotella meneghiniana Kützing, C. planctonica Brunnthaler, Cyclostephanos dubius (Hustedt) Round, Stephanodiscus alpinus Hustedt, and S. hantzschii Grunow, as well as planktonic Pennatae Asterionella formosa Hassall and Ulnaria ulna (Nitzsch) Compère. Representatives of other taxonomic groups had a smaller share in the formation of phytoplankton biomass—these were species belonging to green algae (Chlamydomonas sp. div., Coelastrum astroideum De Notaris, and Desmodesmus communis (E. Hegewald)) and Cyanobacteria (Oscillatoria limosa C.A. Agardh ex Gomont and Phormidium tergestinum (Kützing) Anagnostidis et Komárek).
In the 1990s, the values of the multimetric phytoplankton index for rivers indicated the poor ecological potential of the Vistula (in 1994 and 1997, this value was slightly over 0.4). Only in 1998 did the phytoplankton index (IFPL) indicate a moderate ecological potential of the river, with an IFPL value of 0.550 (Figure 5). In the years 2007–2009, the average value of the trophic index increased to over 0.8 and indicated good ecological potential. The maximum value of the IFPL index was noted in 2008 and amounted to 0.870. In the years 2013–2020, the values of the ecological potential of the Vistula’s waters in Toruń indicated moderate conditions, with IFPL values over 0.7. The trend line indicates a gradual, very strong (R2 = 0.52) improvement in water quality in the period from 1994 to 2020.
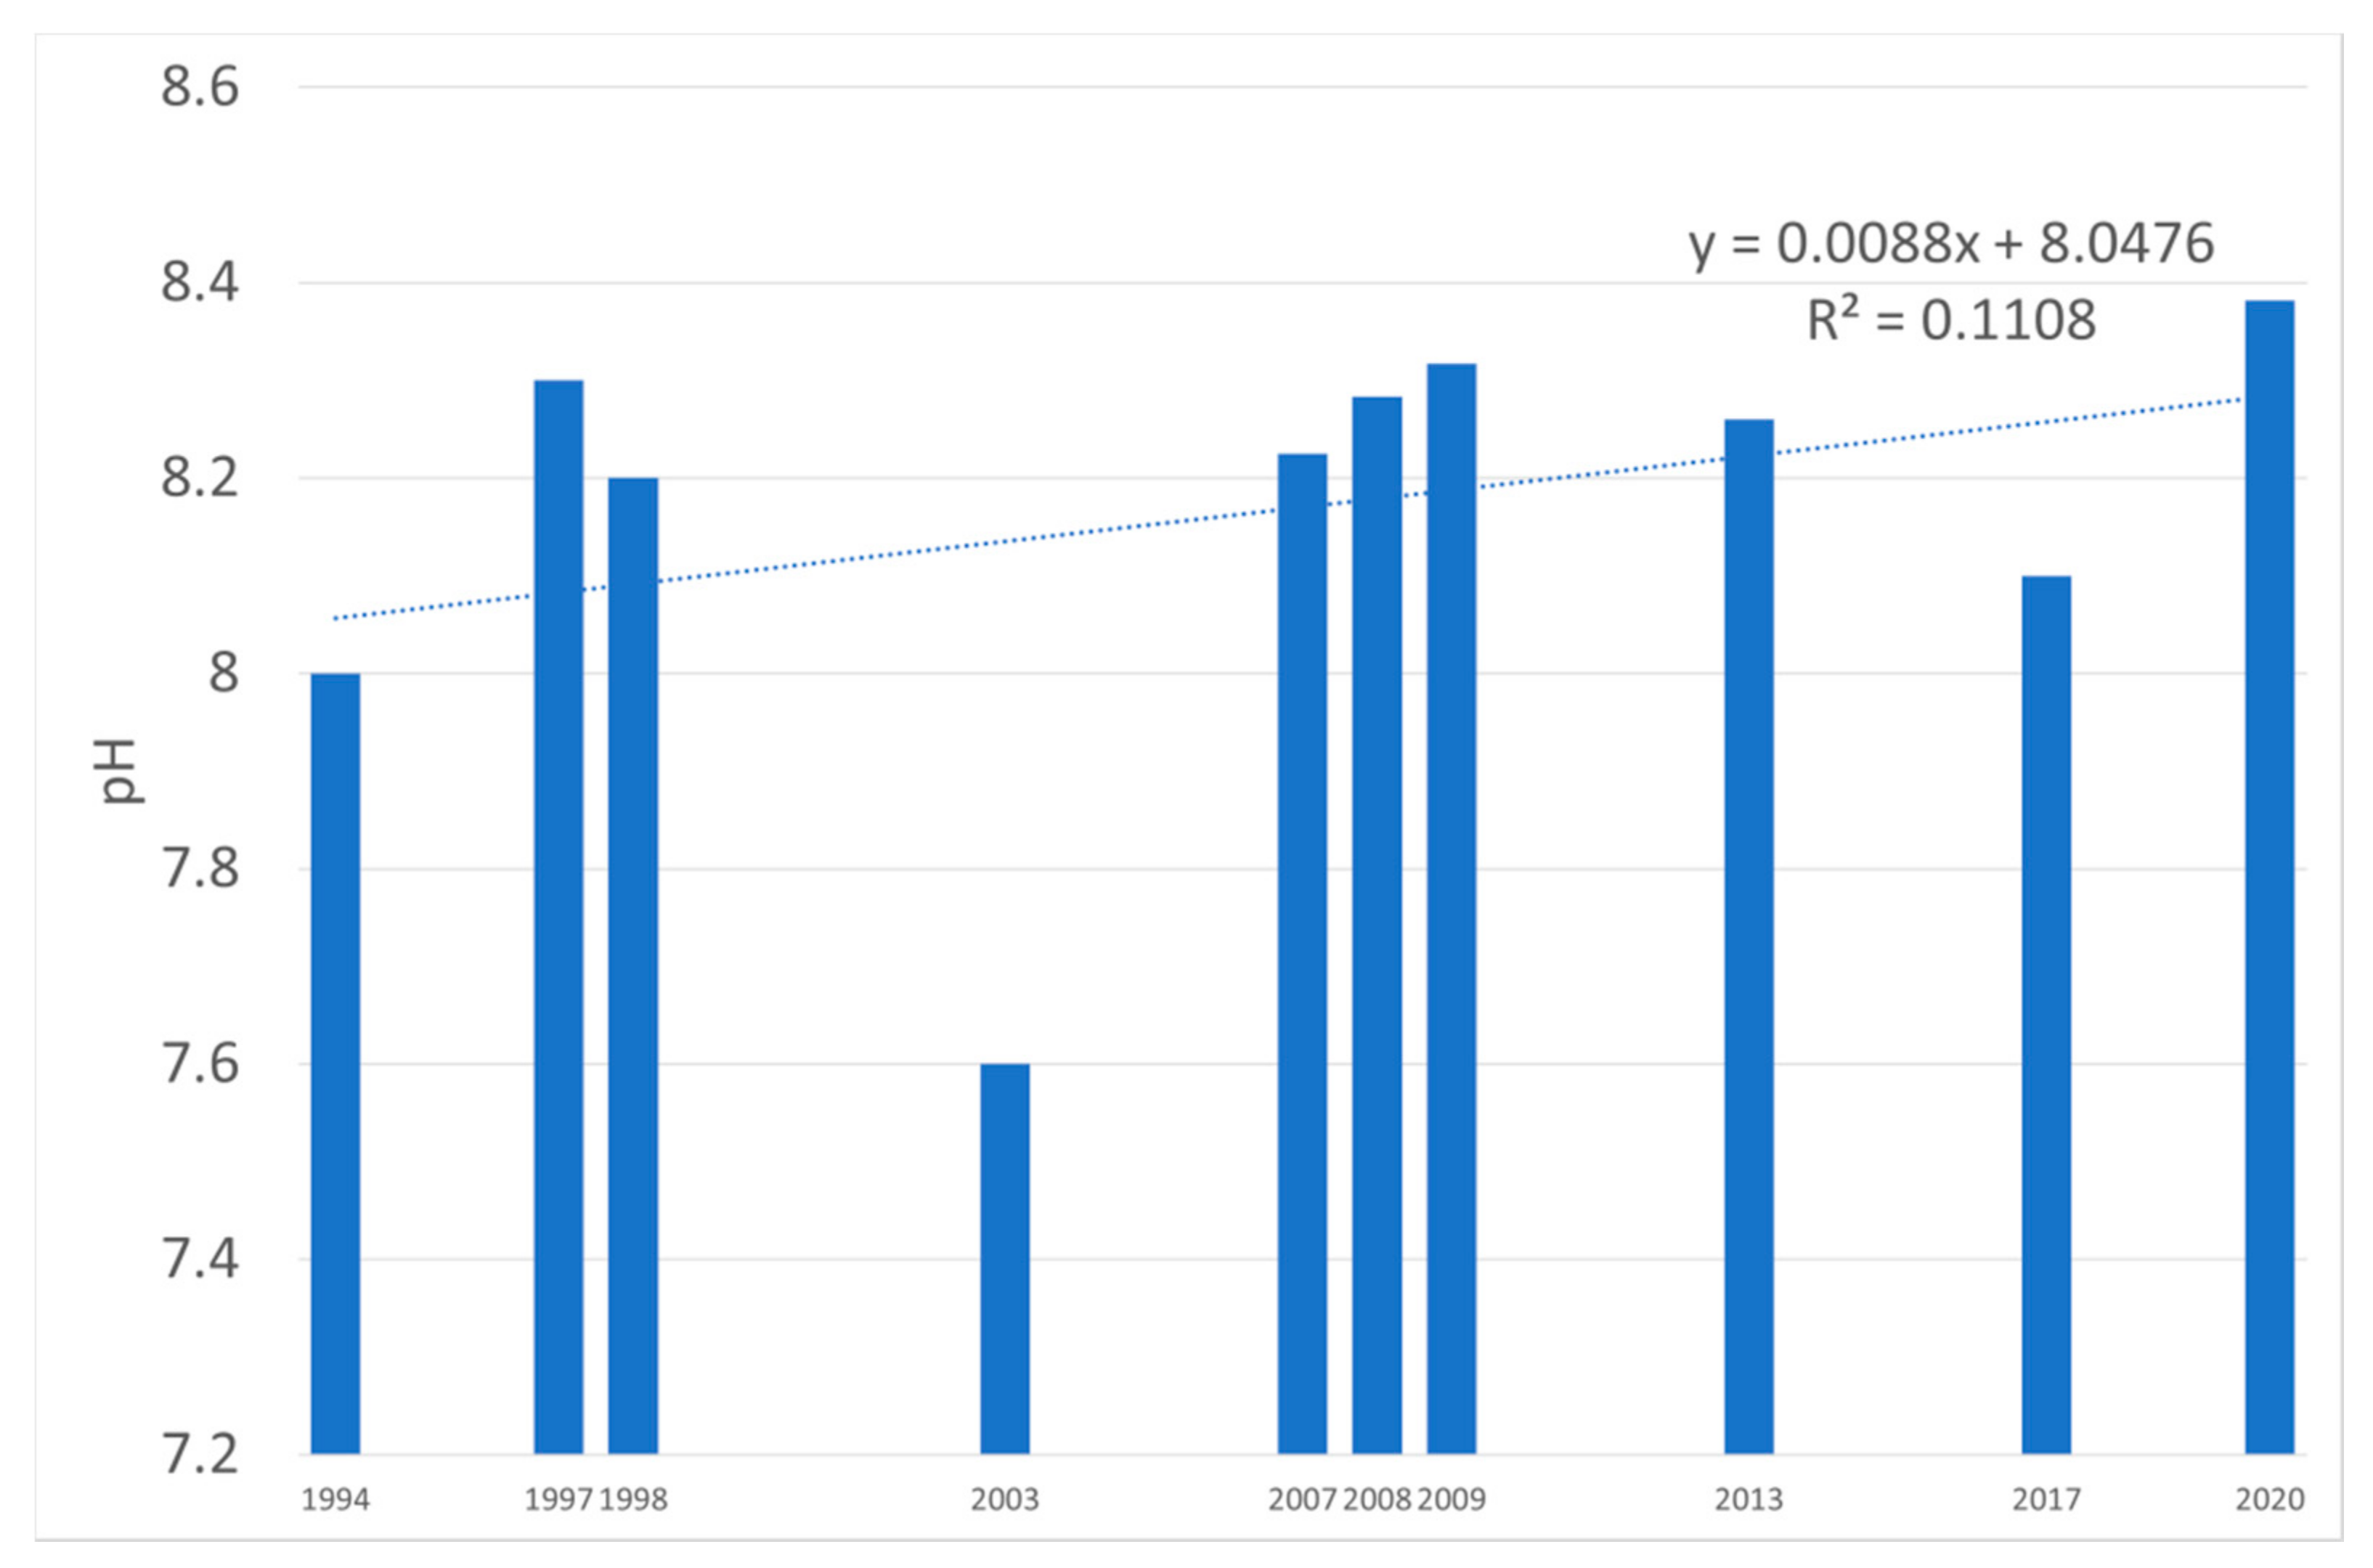
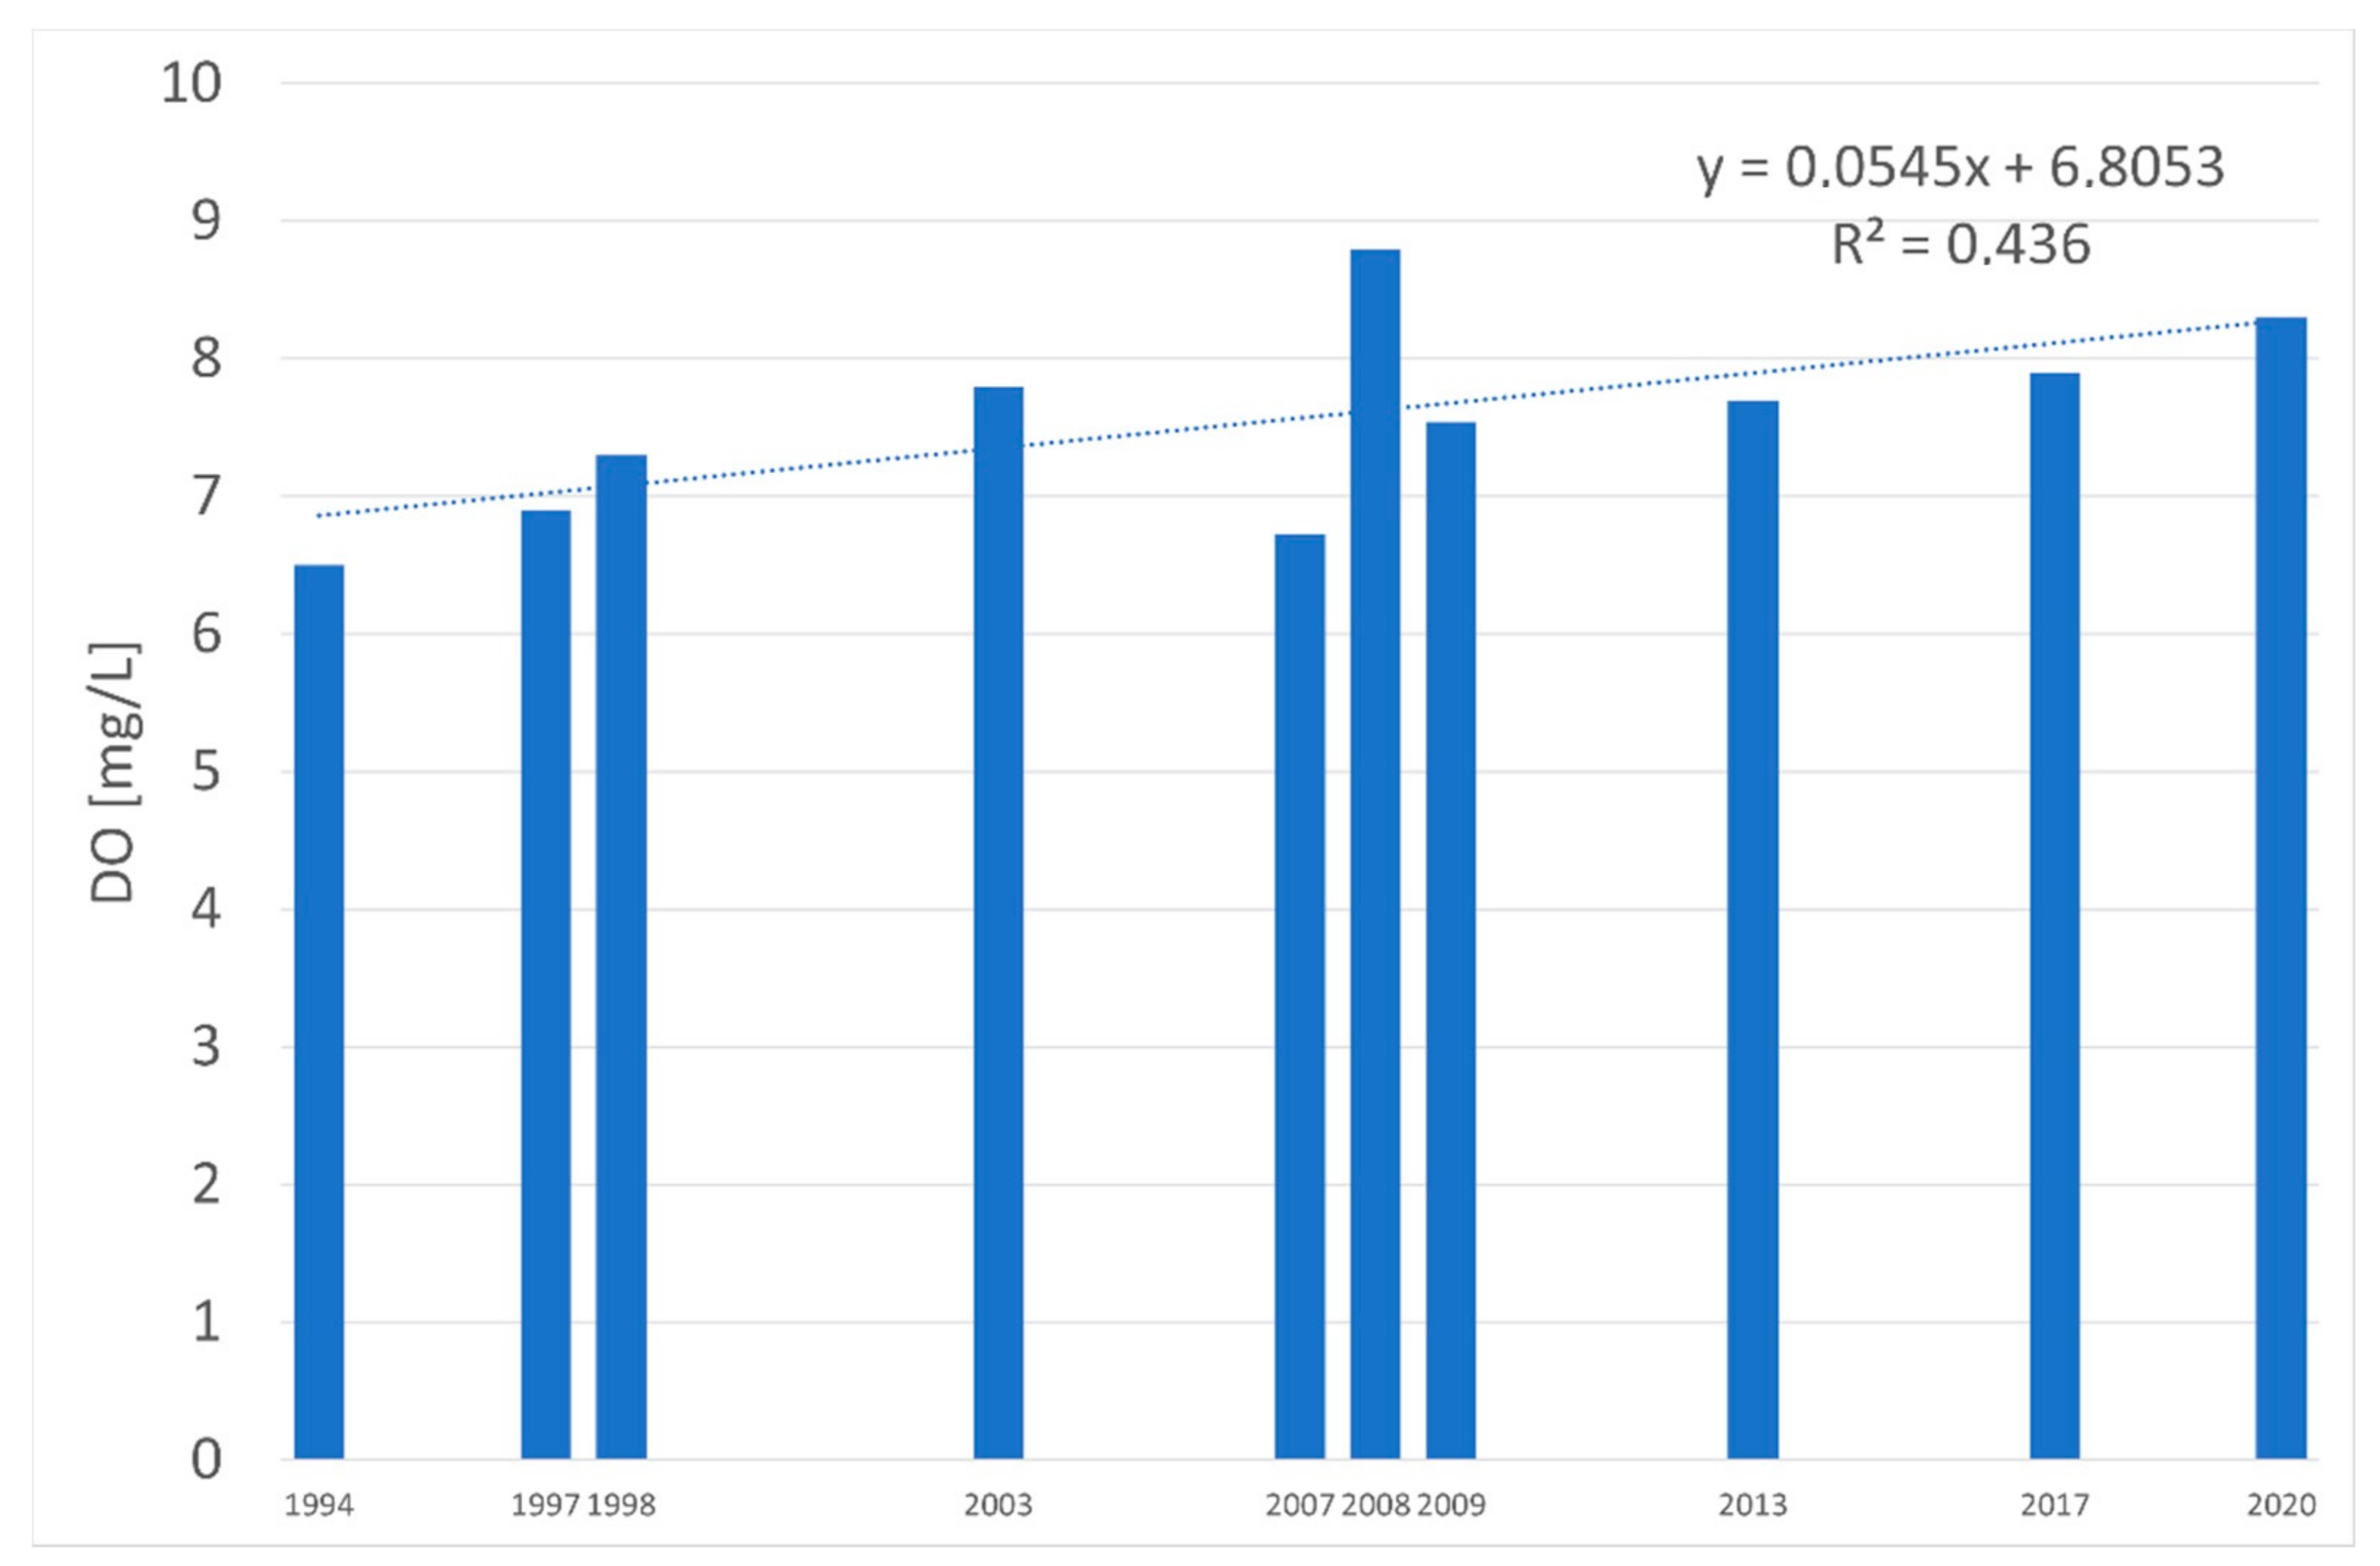
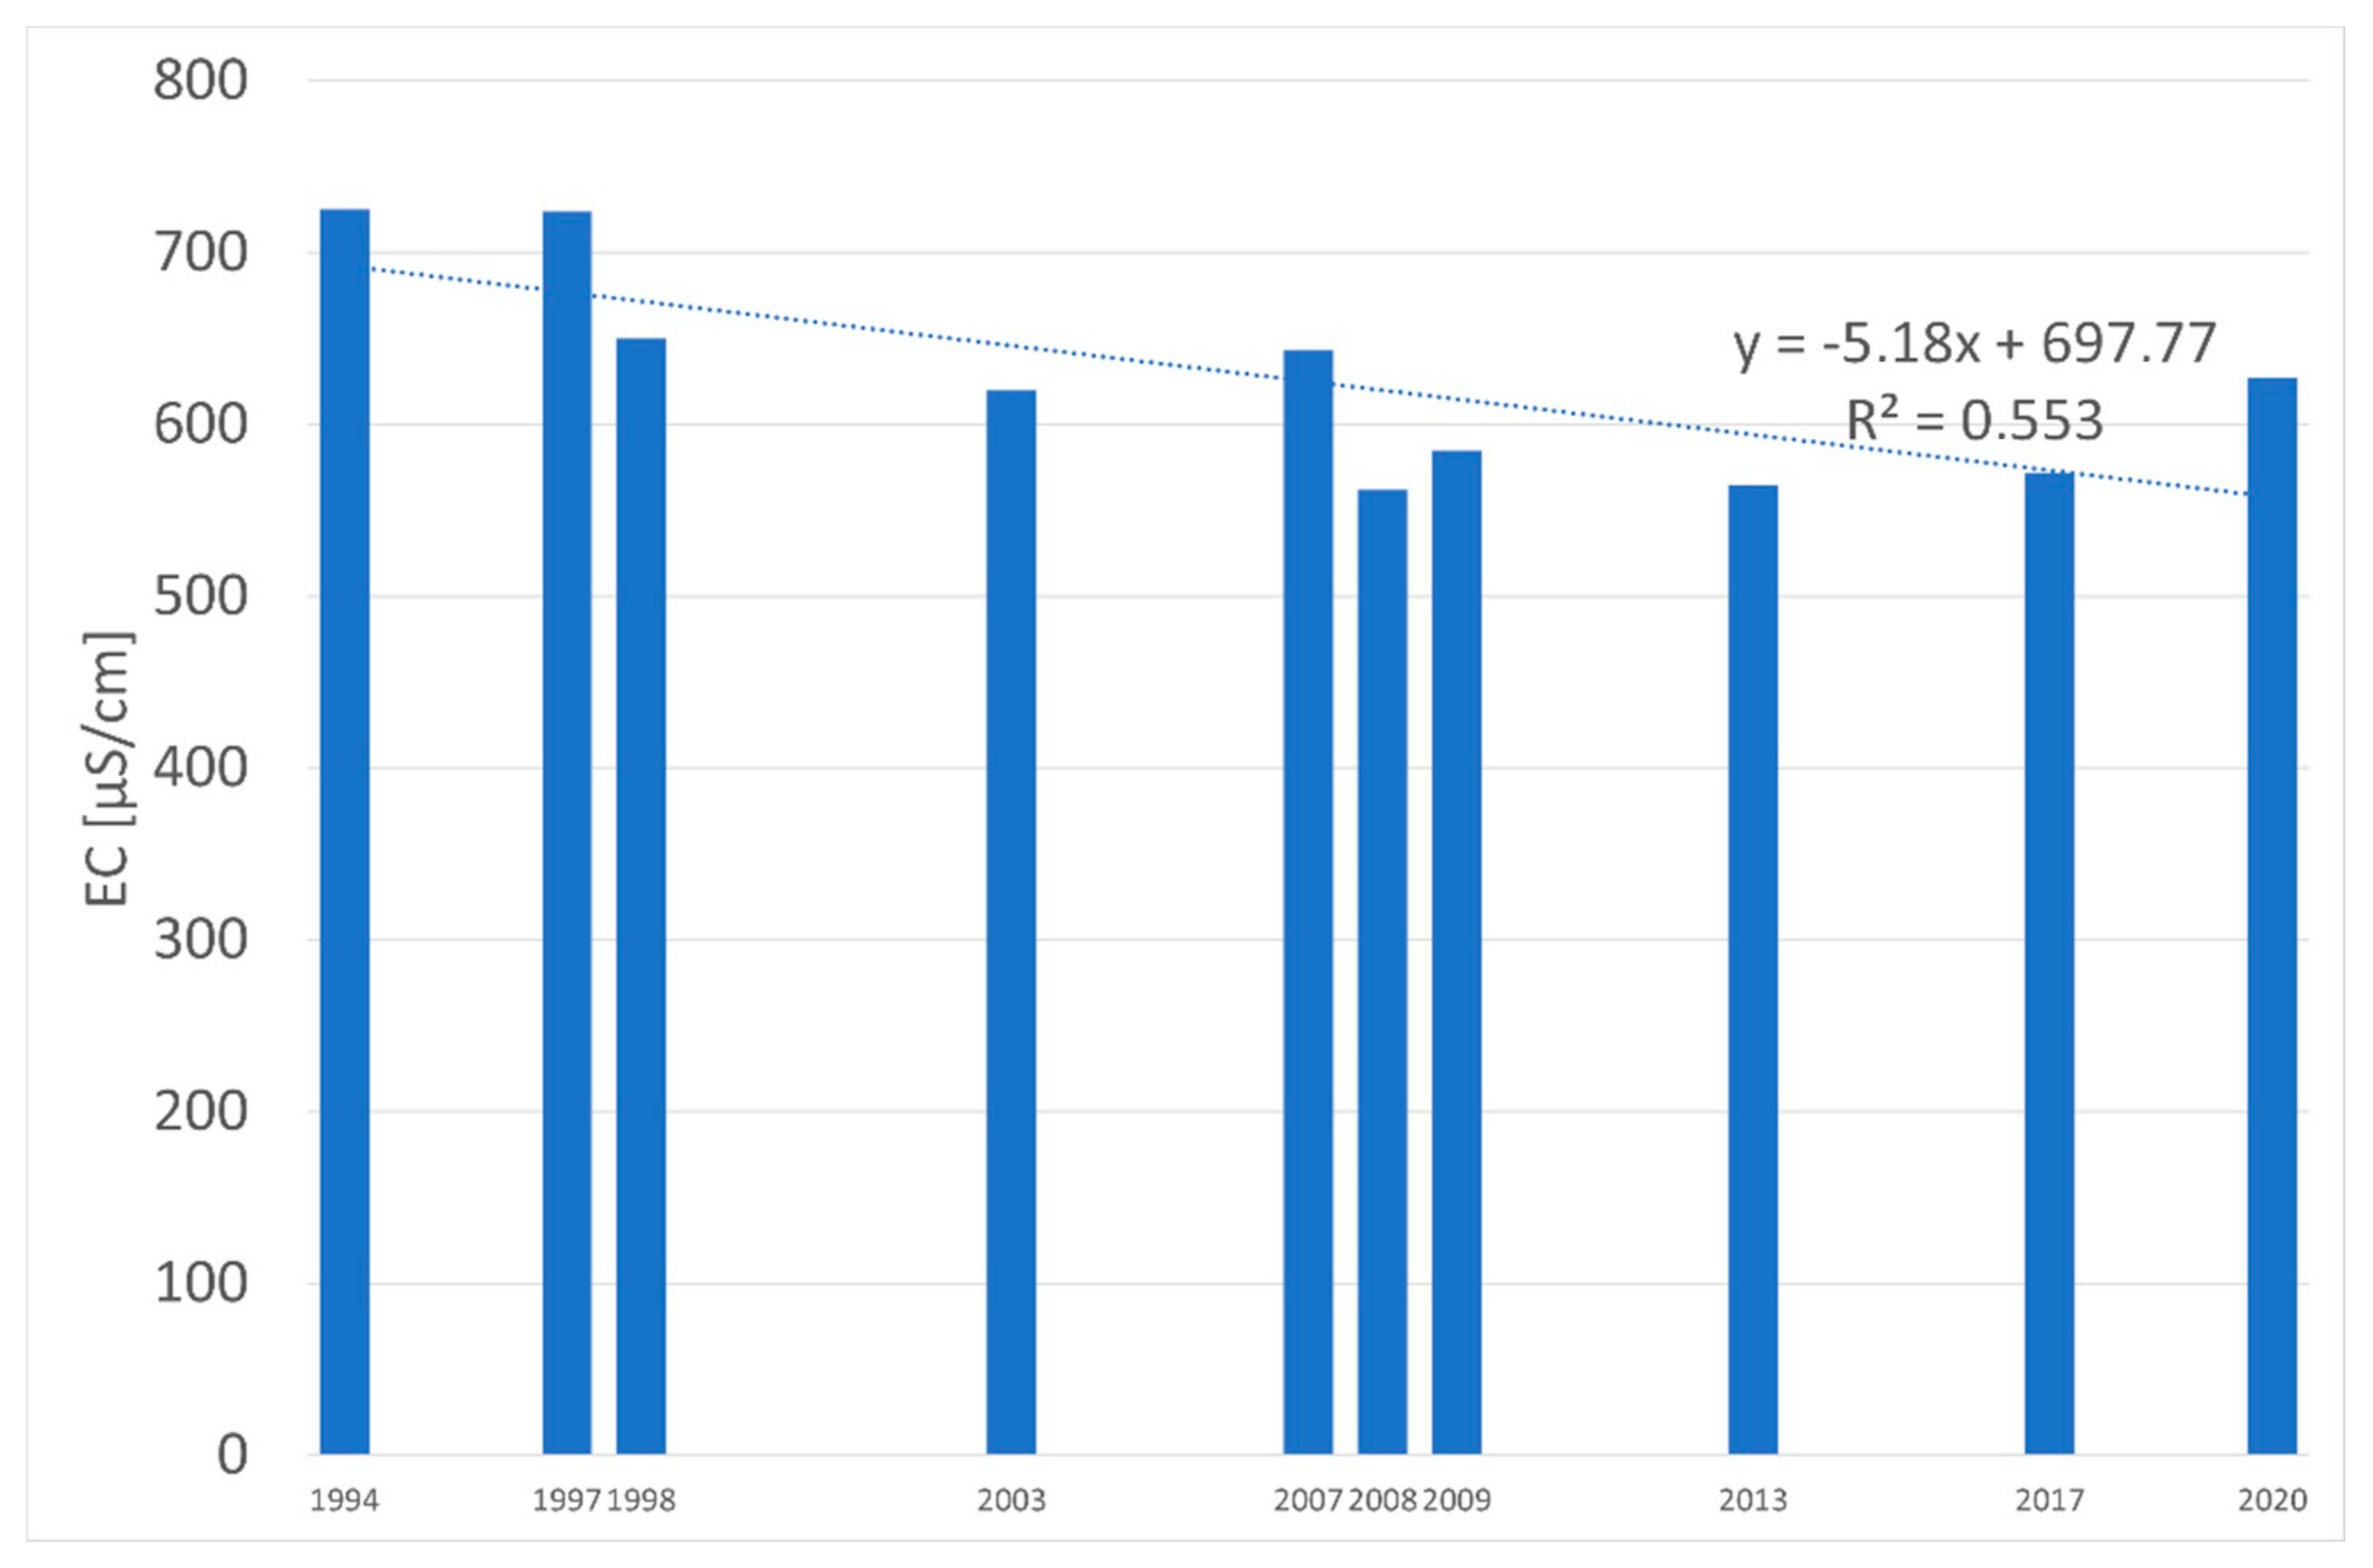
The physical and chemical parameters play a supporting role in evaluations based on biological tests. The waters of the Vistula were found to be slightly alkaline (Figure 6), with an annual value of 8.2 (ranging from 7.6 in 2003 to 8.4 in 2020). Water oxygenation was high (Figure 7), with a long-term average of 7.6 mg/L (ranging from 6.5 mg/L in 1994 to 8.8 mg/L in 2008). The Vistula was also found to be characterised by quite high values of electrical conductivity (Figure 8), with a long-term average of 627 µS/cm (ranging from 565 µS/cm in 2013 to 725 µS/cm in 1994).
Concentrations of total phosphorus and orthophosphates in the Vistula decreased markedly in 2017 compared to previous years. No similar phenomenon was observed with respect to the concentration of total nitrogen. The content of mineral forms of nitrogen showed fluctuations between 1994 and 2017. In the 1990s, the highest concentration was recorded; in 2008, the concentration decreased significantly to a value of 0.93 mg/L, before increasing again in 2017 to a value close to 1.3 mg/L (Table 2).
Nutrient concentrations in the period 1994–2017 allow for the classification of the Vistula waters into quality class 1 or 2, except for 1994, when total nitrogen concentrations were the highest and exceeded quality class 2.
Due to the good ecological potential obtained from phytoplankton for the years 2007–2009, the results of physical and chemical measurements were additionally assessed. In 2007, only oxygen concentrations exceeded the threshold values for the second class, and therefore the ecological potential of the Vistula River for this year should be limited to moderate. In the remaining years (2008–2009), the physical and chemical parameters were within class 1 or 2 and did not result in a lowering of the water quality class on the basis of phytoplankton.

4. Discussion

The Vistula is one of the largest rivers in the Baltic Sea catchment area (second after the Neva), and its valley has been recognised as an important ecological corridor in Central Europe [48,49]. However, the functions of such a corridor can be fulfilled only by waters of adequate ecological quality. In the second half of the 20th century, the Vistula was heavily polluted: in the years 1964–1990, there was a deterioration in the quality of Polish rivers, with only 7% being classified as first class in terms of purity [50]. Only the accession agreements with the European Union countries and then Poland’s accession to the EU contributed to an improvement in the ecological situation. Poland was faced with the need to apply more stringent legal regulations. In the years 1980–2007, the number of sewage treatment plants increased by 38%. There was also a similar increase in the volume of treated wastewater, and the proportion of untreated wastewater discharged decreased by more than 83% [51]. All these factors led to a gradual improvement in the quality of river waters, as shown by studies conducted since 1986 [52,53,54].
Changes in the chemical composition of river waters led to changes in the structure of communities of organisms inhabiting a given ecosystem. Planktonic algae act as an excellent bioindicator and have therefore long been used to assess water quality. Detailed analyses of the Vistula phytoplankton have been conducted since 1994; unfortunately, earlier data on this group of organisms [55,56] were fragmentary and could not be used to assess its ecological potential.
On the basis of the results of research conducted to date—both published [6,7,57] and as yet unpublished—the phytoplankton community of the Vistula River in Toruń can be assessed taxonomically as diatomaceous green algae. The species composition of the lower Vistula phytoplankton is similar to that of other rivers [58,59,60,61]. Most of the diatom species found in the Vistula belong to the sedentary forms that originally inhabit the bottom zones of rivers [62,63]. In some rivers, such as the Danube or the Bug River, green algae dominate the phytoplankton [64,65]. The quantitative structure of the community, taking into account the share of algae in biomass, also clearly indicates the domination of diatoms.
The average share of Bacillariophyceae in the total biomass of phytoplankton in the Vistula River was higher than in, for example, the Danube, where diatoms constitute 59% of the biomass [1]. The second important group in Vistula’s phytoplankton were green algae, mainly belonging to the order Chlorococcales. Their average share was lower than in the Danube, where green algae constitute 25% of biomass [1]. Other groups of algae develop much less in rivers, although they may periodically appear in significant numbers.
The high proportion of Cyanobacteria in phytoplankton is particularly dangerous. The potential for this group to produce toxic substances is a threat. In August 1994 and August 2003, about 60% share of Cyanobacteria was recorded. The significant biomass of Oscillatoria limosa in 1994 was the result of the detachment of this benthic species from the river bottom as a result of the rapid increase in river water velocity during the intense flow (1475 m3/s) that followed a long-term low water level. In August 2003, very favourable conditions for the development of Cyanobacteria were recorded due to the extremely low water flow (290 m3/s) and its very high temperature (25.3 °C). In the following years, no significant share of Cyanobacteria in the phytoplankton biomass was observed.
Cryptophytes (mainly Cryptomonas erosa Ehrenberg) are a permanent element of phytoplankton in some rivers, such as the Danube, where they constitute as much as 16% of phytoplankton biomass [1]. Long-term studies of phytoplankton in the lower Vistula in Toruń have shown favourable changes in its structure. There has been a constant upward trend in the number of dominant species affecting the phytoplankton biomass. The species with the highest biomass mainly included typical planktonic diatoms, Chlorophyta, and some Cyanobacteria.
During the 26-year period (1994–2020) for which the Vistula phytoplankton was studied, an improvement in the water quality in the Vistula can be observed.
Due to the large morphological transformation of the Vistula riverbed and valley, which was carried out in the mid-19th century [13,14], the ecological potential was calculated. The IFPL index takes into account the biomass of trophic indicator (composition of indicator taxa). The second indicator of phytoplankton abundance is the concentration of chlorophyll a [45]. The trend of changes in the period in which the research was conducted indicates a statistically insignificant decrease in phytoplankton biomass, but a clear decrease in the concentration of chlorophyll a. Although the biomass concentration slightly decreases, the improvement is indicated by the change in the structure of dominant species. Over time, the number of bioindicators clearly increases, which is reflected, for example, in an increase in the biodiversity index. Water quality was worst in the 1990s, when the ecological potential index indicated poor quality. Ecological potential was best in 2007–2009. Later, there was a drop, down a class, but the values remain close to the border of the good class [47]. The IFPL has been developed to harmonise water quality assessment methodologies under the Water Framework Directive. It allows for the comparison of ecological status or potential of different rivers that are subject to ecological monitoring. With an adequate dataset, it is possible to use historical data and compare them with the current situation, as analysed in this study.
IFPL is a universal tool, because by intercalibrating with other European indices [66], researchers are able to compare river water quality over a large area of our continent. Improving water quality in Europe is a trend that is visible not only in the Vistula. German water quality has improved over the past 50 years [67]. For example, the river Rhine research (carried out in 1992–2004) also indicates an improvement in ecological quality from moderate to good condition [62]. Unfortunately, over 80% of very large rivers in EU countries still do not meet the WFD good status objective, and about one-third have poor or bad ecological status [16].
Following the recommended method of phytoplankton study [17] and Polish legal regulations [47], alongside phytoplankton observations, measurements should also be taken of physical and chemical parameters. Physical and chemical parameters support the biological tests but may lead to a lowering of water quality classification in the first and second classes. Below the second class of water quality assessed on the basis of biological studies, the physicochemical parameters are irrelevant in the classification. The mean annual values of water pH and electric conductivity were within the limits provided for class 1 of water quality in all years of the study [47] and therefore did not affect any of the ecological potential results based on phytoplankton analysis. In terms of oxygen conditions, 1994 was the worst year, with an average annual oxygen content in water of 6.5 mg/L. However, the ecological potential in the same year, as assessed by the IFPL value, was poor, and therefore such a small amount of oxygen did not affect the classification result. In 2007, the oxygen concentrations exceeded the threshold values for the second class, and therefore the ecological potential of the Vistula River this year should be reduced to moderate. In 2009, the oxygen concentrations corresponded to the second class of water quality, and in 2013, they only slightly deviated from the second class (the limit value in the second class is 7.4 mg/L) and were classified as good. The best year was 2008, when the ecological potential of the Vistula, assessed on the basis of both the IFPL value and the quality of physical and chemical parameters of the water, reached its maximum value.

5. Conclusions

In conclusion, phytoplankton studies carried out over more than 25 years have shown no significant changes in number of species and biomass. However, the rebuilding of planktonic communities, manifested by a greater number of species that make up the biomass, was responsible for an increase in biodiversity and improvement in water quality in the Vistula.

Funding

This paper was partially funded by the Polish Minister of Science and Higher Education under the programme “Regional Initiative of Excellence” in 2019–2022 (grant no. 008/RID/2018/19).

Institutional Review Board Statement

Not applicable.

Informed Consent Statement

Not applicable.

Data Availability Statement

Data is contained within the article.

Conflicts of Interest

The authors declare no conflict of interest.

References

  1. Dokulil, M.T. Phytoplankton of the River Danube: Composition, seasonality and long-term dynamics. In The Danube River Basin Handbook Environmental Chemistry; Liska, I., Ed.; Springer: Berlin/Heidelberg, Germany, 2015; pp. 411–428. [Google Scholar]
  2. Wu, N.; Schmalz, B.; Fohrer, N. Study Progress in Riverine Phytoplankton and its Use as Bio-Indicator—A Review. Austin J. Hydrol. 2014, 1, 9. [Google Scholar]
  3. Tockner, K.; Uehlinger, U.; Robinson, C.T. Rivers of Europe, 1st ed.; Academic Press: London, UK, 2008; p. 728. [Google Scholar]
  4. Stoyneva, M.P. Shallows of the lower Danube as additional sources of potamoplankton. Hydrobiologia 1994, 289, 171–178. [Google Scholar] [CrossRef]
  5. Descy, J.-P.; Darchambeau, F.; Lambert, T.; Stoyneva-Gaertner, M.P.; Bouillon, S.; Borges, A.V. Phytoplankton dynamics in the Congo River. Freshw. Biol. 2017, 62, 87–101. [Google Scholar] [CrossRef] [Green Version]
  6. Kentzer, A.; Dembowska, E.; Giziński, A.; Napiórkowski, P. Influence of the Włocławek Reservoir on hydrochemistry and plankton of a large, lowland river (the Lower Vistula River, Poland). Ecol. Eng. 2010, 36, 1747–1753. [Google Scholar] [CrossRef]
  7. Dembowska, E. Phytoplankton species diversity of the Lower Vistula from Wyszogród to Toruń. Oceanol. Hydrobiol. Stud. 2009, 38, 63–74. [Google Scholar] [CrossRef]
  8. European Commission. Directive 2000/60/EC of the European Parliament and of the Council of 23 October 2000 Establishing a Framework for Community Action in the Field of Water Policy; Official Journal of the European Union: Luxemberg, 2000; Volume 164, p. 19. [Google Scholar]
  9. European Commission. Report from the Commission to the European Parliament and the Council on the Implementation of the Water Framework Directive (2000/60/EC) River Basin Management Plans; Official Journal of the European Union: Luxemberg, 2012; p. 14. [Google Scholar]
  10. Poikane, S.; Kelly, M.; Cantonati, M. Benthic algal assessment of ecological status in European lakes and rivers: Challenges and opportunities. Sci. Total Environ. 2016, 568, 603–613. [Google Scholar] [CrossRef] [PubMed]
  11. Masouras, A.; Karaouzas, I.; Dimitriou, E.; Tsirtsis, G.; Smeti, E. Benthic Diatoms in River Biomonitoring—Present and Future Perspectives within the Water Framework Directive. Water 2021, 13, 478. [Google Scholar] [CrossRef]
  12. Journal of Laws of the Republic of Poland. Rozporządzenie Ministra Środowiska z dnia 22 października 2014r. w sprawie sposobu klasyfikacji jednolitych części wód powierzchniowych oraz środowiskowych norm jakości dla substancji priorytetowych 2014; 1482. Available online: http://isap.sejm.gov.pl/isap.nsf/DocDetails.xsp?id=wdu20140001482 (accessed on 26 November 2021).
  13. Głogowska, B. A geographical and hydrological profile of the study area. In Hydrobiology of the Lower Vistula River between Wyszogród and Toruń. An Assessment of the Influence of the Włocławek Dam on the Structure and Functions of the River Ecosystem, Part II; Giziński, A., Ed.; AUNC Limnol. Pap: Cary, NC, USA, 2000; Volume 21, pp. 11–21. Available online: https://link.springer.com/article/10.2478/s11756-013-0263-6 (accessed on 26 November 2021).
  14. Makowski, J. The lower Vistula River and its bunds. The historical development and the current state and maintenance during major floods. Part Two: The section from Toruń to Biała Góra; Instytut Budownictwa Wodnego PAN Biblioteka Naukowa Hydrotechnika: Gdańsk, Poland, 1998; Volume 27, p. 150. [Google Scholar]
  15. Cyberski, J.; Grześ, M.; Gutry-Korycka, M.; Nachlik, E.; Kundzewicz, Z.W. History of floods on the River Vistula. Hydrol. Sci. J. 2006, 51, 799–817. [Google Scholar] [CrossRef]
  16. Lyche Solheim, A.; Globevnik, L.; Austnes, K.; Kristensen, P.; Moe, S.J.; Persson, J.; Phillips, G.; Poikane, S.; van de Bund, W.; Birk, S. A new broad typology for rivers and lakes in Europe: Development and application for large-scale environmental assessments. Sci. Total Environ. 2019, 697, 134043. [Google Scholar] [CrossRef]
  17. Ettl, H. Xanthophyceae. In Süßwasserflora von Mitteleuropa Bd. 3; Ettl, H., Gerloff, J., Heynig, H., Eds.; Gustav Fischer Verlag: Stuttgart, Germany, 1978; p. 530. [Google Scholar]
  18. Ettl, H. Chlorophyta I: Phytomonadina. In Süβwasserflora von Mitteleuropa Bd. 9; Ettl, H., Gerloff, J., Heynig, H., Mollenhauer, D., Eds.; Gustav Fischer Verlag: Stuttgart, Germany, 1983; p. 807. [Google Scholar]
  19. Hindák, F. Colour Atlas of Cyanophytes; Veda Publishing House of the Slovak Academy of Sciences: Bratislava, Slovakia, 2008; p. 253. [Google Scholar]
  20. Javornickỳ, P. Taxonomic notes on some freshwater planktonic Cryptophyceae based on light microscopy. Hydrobiologia 2003, 50, 271–283. [Google Scholar] [CrossRef]
  21. Komárek, J.; Anagnostidis, K. Cyanoprokaryota 2. Teil: Oscillatoriales. In Süβwasserflora von Mitteleuropa, Bd. 19/2; Büdel, B., Gärtner, G., Krienitz, L., Schagerl, M., Eds.; Spektrum Akademischer Verlag: Heidelberg, Germany, 2007; p. 759. [Google Scholar]
  22. Komárek, J.; Anagnostidis, K. Cyanoprokaryota 1. Teil: Chroococcales. In Süβwasserflora von Mitteleuropa, Bd. 1/19; Ettl, H., Gerloff, J., Heynig, H., Mollenhauer, D., Eds.; Spektrum Akademischer Verlag: Heidelberg, Germany, 2008; p. 548. [Google Scholar]
  23. Komárek, J.; Fott, B.; Chlorophyceae (Grünalgen), O. Chlorococcales. In Die Binnengewässer. Das Phytoplankton des Süβwassers, Systematik und Biologie, 7 Teil.1; Hälfte, E., Ed.; Schweizerbart′sche Verlagsbuchhandlung: Stuttgart, Germany, 1983; p. 1044. [Google Scholar]
  24. Komárek, J.; Komárkowa, J. Diversity of Aphanizomenon–like cyanobacteria. Diverzita sinic z okruhu rodu Aphanizomenon. Czech Phycol. Olomouc 2006, 6, 1–32. [Google Scholar]
  25. Komárek, J.; Zapomelova, E. Planktic morphospecies of the cyanobacterial genus Anabaena = subg. Dolichosperum—1. Part: Coiled types. Fottea 2007, 7, 1–31. [Google Scholar]
  26. Komárek, J.; Zapomelova, E. Planktic morphospecies of the cyanobacterial genus Anabaena = subg. Dolichosperum—2. Part: Straight types. Fottea 2008, 8, 1–14. [Google Scholar]
  27. Krammer, K.; Lange-Bertalot, H. Bacillariophyceae. 1. Teil: Naviculaceae. In Süsswasserflora von Mitteleuropa Bd. 2/1; Ettl, H., Gerloff, J., Heynig, H., Mollenhauer, D., Eds.; Gustav Fischer Verlag: Stuttgart, Germany, 1986; p. 876. [Google Scholar]
  28. Krammer, K.; Lange-Bertalot, H. Bacillariophyceae. 2. Teil: Bacillariaceae, Epithemiaceae, Surirellaceae. In Süsswasserflora von Mitteleuropa, Bd. 2/2; Ettl, H., Gärtner, G., Gerloff, J., Heynig, H., Mollenhauer, D., Eds.; Gustav Fischer Verlag: Stuttgart, Germany, 1988; p. 796. [Google Scholar]
  29. Krammer, K.; Lange-Bertalot, H. Bacillariophyceae. 3. Teil: Centrales, Fragilariaceae, Eunotiaceae. In Süsswasserflora von Mitteleuropa, Bd. 2/3; Ettl, H., Gärtner, G., Gerloff, J., Heynig, H., Mollenhauer, D., Eds.; Gustav Fischer Verlag: Stuttgart, Germany, 1991; p. 578. [Google Scholar]
  30. Krammer, K.; Lange-Bertalot, H. Bacillariophyceae. 4. Teil: Achnanthaceae, Ktitische Ergänzungen zu Navicula (Lineolatae) und Gomphonema Gesamtliteraturverzeichnis. In Süsswasserflora von Mitteleuropa, Bd. 2/4; Gustav Fischer Verlag: Stuttgart, Germany, 1991; p. 437. [Google Scholar]
  31. Popovskỳ, J.; Pfiester, L.A. Dinophyceae (Dinoflagellida). In Süβwasserflora von Mitteleuropa, Bd. 6; Ettl, H., Gerloff, J., Heynig, H., Mollenhauer, D., Eds.; Gustav Fischer Verlag: Stuttgart, Germany, 1990; p. 272. [Google Scholar]
  32. Růžička, J. Die Desmidiaceen Mitteleuropas, Bd. 1/1; E. Schweizerbart’sche Verlagsbuchhandlung: Stuttgart, Germany, 1977; p. 336. [Google Scholar]
  33. Starmach, K.; Chrysophyta, I. Chrysophyceae—Złotowiciowce oraz wiciowce bezbarwne—Zooflagellata wolnożyjące. In Flora słodkowodna Polski, T. 5; Starmach, K., Siemińska, J., Eds.; Państwowe Wydawnictwo Naukowe: Warszawa, Poland; Kraków, Poland, 1968; p. 598. [Google Scholar]
  34. Starmach, K. Cryptophyceae—Kryptofity, Dinophyceae—Dinofity, Raphiophyceae—Rafidofity. In Flora słodkowodna Polski, T. 4; Starmach, K., Siemińska, J., Eds.; Państwowe Wydawnictwo Naukowe: Warszawa, Poland; Kraków, Poland, 1974; p. 520. [Google Scholar]
  35. Starmach, K. Euglenophyta—Eugleniny. In Flora słodkowodna Polski, T. 3; Starmach, K., Siemińska, J., Eds.; Państwowe Wydawnictwo Naukowe: Warszawa, Poland; Kraków, Poland, 1983; p. 594. [Google Scholar]
  36. Wołowski, K. Taxonomic and Environmental studies on Euglenophytes of the Kraków-Częstochowa Upland (Southern Poland). Fragm. Florist. Geobot. 1998, 6, 192. [Google Scholar]
  37. Wołowski, K.; Hindák, F. Atlas of Euglenophytes; Veda, Publishing House of the Slovak Academy of Sciences: Bratislava, Slovakia, 2003; p. 135. [Google Scholar]
  38. Utermöhl, H. Zur Vervollkommung der quantitativen Phytoplankton—Methodik. Mitt. Internat. Verein. Limnol. 1958, 9, 5–46. [Google Scholar]
  39. Hillenbrand, H.; Dürselen, C.D.; Kirschtel, D.; Pollingher, U.; Zohary, T. Biovolume calculation for pelagic and benthic microalgae. J. Phycol. 1999, 35, 403–424. [Google Scholar] [CrossRef]
  40. Sun, J.; Liu, D. Geometric models for calculating cell biovolume and surface area for phytoplankton. J. Plankton Res. 2003, 25, 1331–1346. [Google Scholar] [CrossRef] [Green Version]
  41. Napiórkowska-Krzebietke, A.; Kobos, J. Assessment of the cell biovolume of phytoplankton widespread in coastal and inland water bodies. Water Res. 2016, 104, 532–546. [Google Scholar] [CrossRef]
  42. Holmes, R.W.; Norris, R.; Smayda, T.; Wood, E.J.F. Collection, fixation, identification and enumeration of phytoplankton standing stock. In Recommended Procedures for Measuring the Productivity of Plankton Standing Stock and Related Oceanic Properties; Anon, Ed.; National Academy of Sciences: Washington, DC, USA, 1969; pp. 17–46. [Google Scholar]
  43. Elser, J.J.; Carpenter, S.R. Predation-driven dynamics of zooplankton and phytoplankton communities in a whole-lake experiment. Oecologia 1988, 76, 148–154. [Google Scholar] [CrossRef]
  44. Nusch, E.A. Comparison of different methods for chlorophyll and phaeopigment. Arch. Hydrobiol. Beih. Ergebn. Limnol. 1980, 14, 14–16. [Google Scholar]
  45. Picińska-Fałtynowicz, J.; Błachuta, J.; Pasztaleniec, A. Fitoplankton w rzekach i zbiornikach zaporowych. In Podręcznik do Monitoringu Elementów Biologicznych i Klasyfikacji Stanu Ekologicznego wód Powierzchniowych; Kolada, A., Ed.; Biblioteka Monitoringu Środowiska: Warszawa, Poland, 2020; pp. 23–43. [Google Scholar]
  46. European Commission. Carrying forward the Common Implementation Strategy for the Water Framework Directive-Progress and Work Programme for 2003/2004; Official Journal of the European Union: Luxemberg, 2003; p. 46. [Google Scholar]
  47. Journal of Laws of the Republic of Poland. Rozporządzenie Ministra Infrastruktury z dnia 25 czerwca 2021 r. w sprawie klasyfikacji stanu ekologicznego, potencjału ekologicznego i stanu chemicznego oraz sposobu klasyfikacji stanu jednolitych części wód powierzchniowych, a także środowiskowych norm jakości dla substancji priorytetowych. 2021; p. 1475. Available online: https://isap.sejm.gov.pl/isap.nsf/DocDetails.xsp?id=WDU20210001475 (accessed on 26 November 2021).
  48. Bij de Vaate, A.; Jazdzewski, K.; Ketelaars, H.A.M.; Gollasch, S.; Van der Velde, G. Geographical patterns in range extension of Ponto-Caspian macroinvertebrate species in Europe. Can. J. Fish. Aquat. Sci. 2002, 59, 1159–1174. [Google Scholar] [CrossRef]
  49. Romanowski, J. Vistula River Valley as the Ecological Corridor for Mammals. Pol. J. Ecol. 2007, 55, 805–819. [Google Scholar]
  50. Mysiak, M. Zmiany jakości wód rzecznych w Polsce w dwudziestopięcioleciu 1964–1990. Ochr. Srodowiska 1994, 16, 9–10. [Google Scholar]
  51. Wałęga, A.; Chmielowski, K.; Satora, S. Water and wastewater management condition in Poland regarding Water Framework Directive implementation. Infrastr. Ecol. Rural Areas 2009, 4, 57–72. [Google Scholar]
  52. Kentzer, A. Influence of the Włocławek Reservoir on the quality of waters in the Bay of Gdańsk. Limnol. Pap. 2009, 4, 9–14. [Google Scholar] [CrossRef]
  53. Kowalkowski, T.; Pastuszek, M.; Igras, J.; Buszewski, B. Differences in emission of nitrogen and phosphorus in to the Vistula and Oder basins in 1995–2008. Natural and anthropogenic causes (MONERIS model). J. Mar. Syst. 2012, 89, 48–60. [Google Scholar] [CrossRef]
  54. Pastuszek, M.; Stalnacke, P.; Pawlikowski, K.; Witek, Z. Response of Polish rivers (Vistula, Oder) to reduce pressure from point sources and agriculture during the transition period (1988–2008). J. Mar. Syst. 2012, 94, 157–173. [Google Scholar] [CrossRef]
  55. Uherkovich, G. Über das Wisła–Phytoseston Zwischen Kraków und Tczew. Acta Hydrobiol. 1970, 12, 161–190. [Google Scholar]
  56. Praszkiewicz, A.; Spodniewska, I.; Węgleńska, T. Seston Wisły i zbiorników kaskady Wisły na odcinku od ujścia Sanu do Włocławka. In Ekologiczne Podstawy Zagospodarowania Wisły i jej Dorzecza; Kajak, Z., Ed.; Państwowe Wydawnictwo Naukowe: Warszawa, Poland; Łódź, Poland, 1983. [Google Scholar]
  57. Dembowska, E. Tentative assessment of the phytoplankton in the Vistula between Płock and Toruń (with the Włocławek Reservoir), Poland. AUNC Limnol. Pap. 2005, 24, 19–43. [Google Scholar]
  58. Baykal, T.; Açikgöz, İ.; Udoh, A.U.; Yildiz, K. Seasonal variations in phytoplankton composition and biomass in a small lowland river-lake system (Melen River, Turkey). Turk. J. Biol. 2011, 35, 485–501. [Google Scholar]
  59. Da Silva, I.G.; Pelicice, F.M.; Rodrigues, L.C. Loss of phytoplankton functional and taxonomic diversity induced by river regulation in a large tropical river. Hydrobiologia 2020, 847, 3471–3485. [Google Scholar] [CrossRef]
  60. Várbíró, G.; Ács, É.; Borics, G.; Érces, K.; Fehér, G.; Grigorszky, I.; Japport, T.; Kocsis, G.; Krasznai, E.; Nagy, K.; et al. Use of Self-Organizing Maps (SOM) for characterization of riverine phytoplankton associations in Hungary. Arch. Hydrobiol. 2007, 17, 383–394. [Google Scholar] [CrossRef]
  61. Stanković, I.; Vlahović, T.; Gligora Udovič, M.; Várbíró, G.; Borics, G. Phytoplankton functional and morpho-functional approach in large floodplain rivers. Hydrobiologia 2012, 698, 217–231. [Google Scholar] [CrossRef]
  62. Friedrich, G.; Pohlmann, M. Long-term plankton studies at the lower Rhine/Germany. Limnologica 2009, 39, 14–39. [Google Scholar] [CrossRef] [Green Version]
  63. Descy, J.-P.; Leitao, M.; Everbecq, E.; Smitz, J.S.; Deliège, J.-F. Phytoplankton of the River Loire, France: A biodiversity and modelling study. J. Plankton Res. 2012, 34, 120–135. [Google Scholar] [CrossRef] [Green Version]
  64. Verasztó, C.S.; Kiss, K.T.; Sipkay, C.S.; Gimesi, L.; Vadadi-Fülöp, C.S.; Türei, D.; Hufnagel, L. Long-term dynamic patterns and diversity of phytoplankton communities in a large eutrophic river (the case of River Danube, Hungary). Appl. Ecol. Environ. Res. 2010, 8, 329–349. [Google Scholar] [CrossRef]
  65. Bilous, O.; Barinova, S.; Klochenko, P. Phytoplankton communities in ecological assessment of the Southern Bug River upper reaches (Ukraine). Ecohydrol. Hydrobiol. 2012, 12, 211–230. [Google Scholar] [CrossRef]
  66. Mischke, U.; Belkinova, D.; Birk, S.; Borics, G.; Garbea, R.; Hlúbiková, D.; Jekabsone, J.; Opatrilova, L.; Panek, P.; Picińska-Fałtynowicz, J.; et al. Intercalibration of the national classifications of ecological status for very large rivers in Europe. Biological quality element: Phytoplankton. In Joint Research Centre Technical Report; Poikane, S., Ed.; Publications Office of the European Union: Luxembourg, 2018; p. 174. [Google Scholar]
  67. Arle, J.; Mohaupt, V.; Kirst, I. Monitoring of Surface Waters in Germany under the Water Framework Directive—A Review of Approaches, Methods and Results. Water 2016, 8, 217. [Google Scholar] [CrossRef]
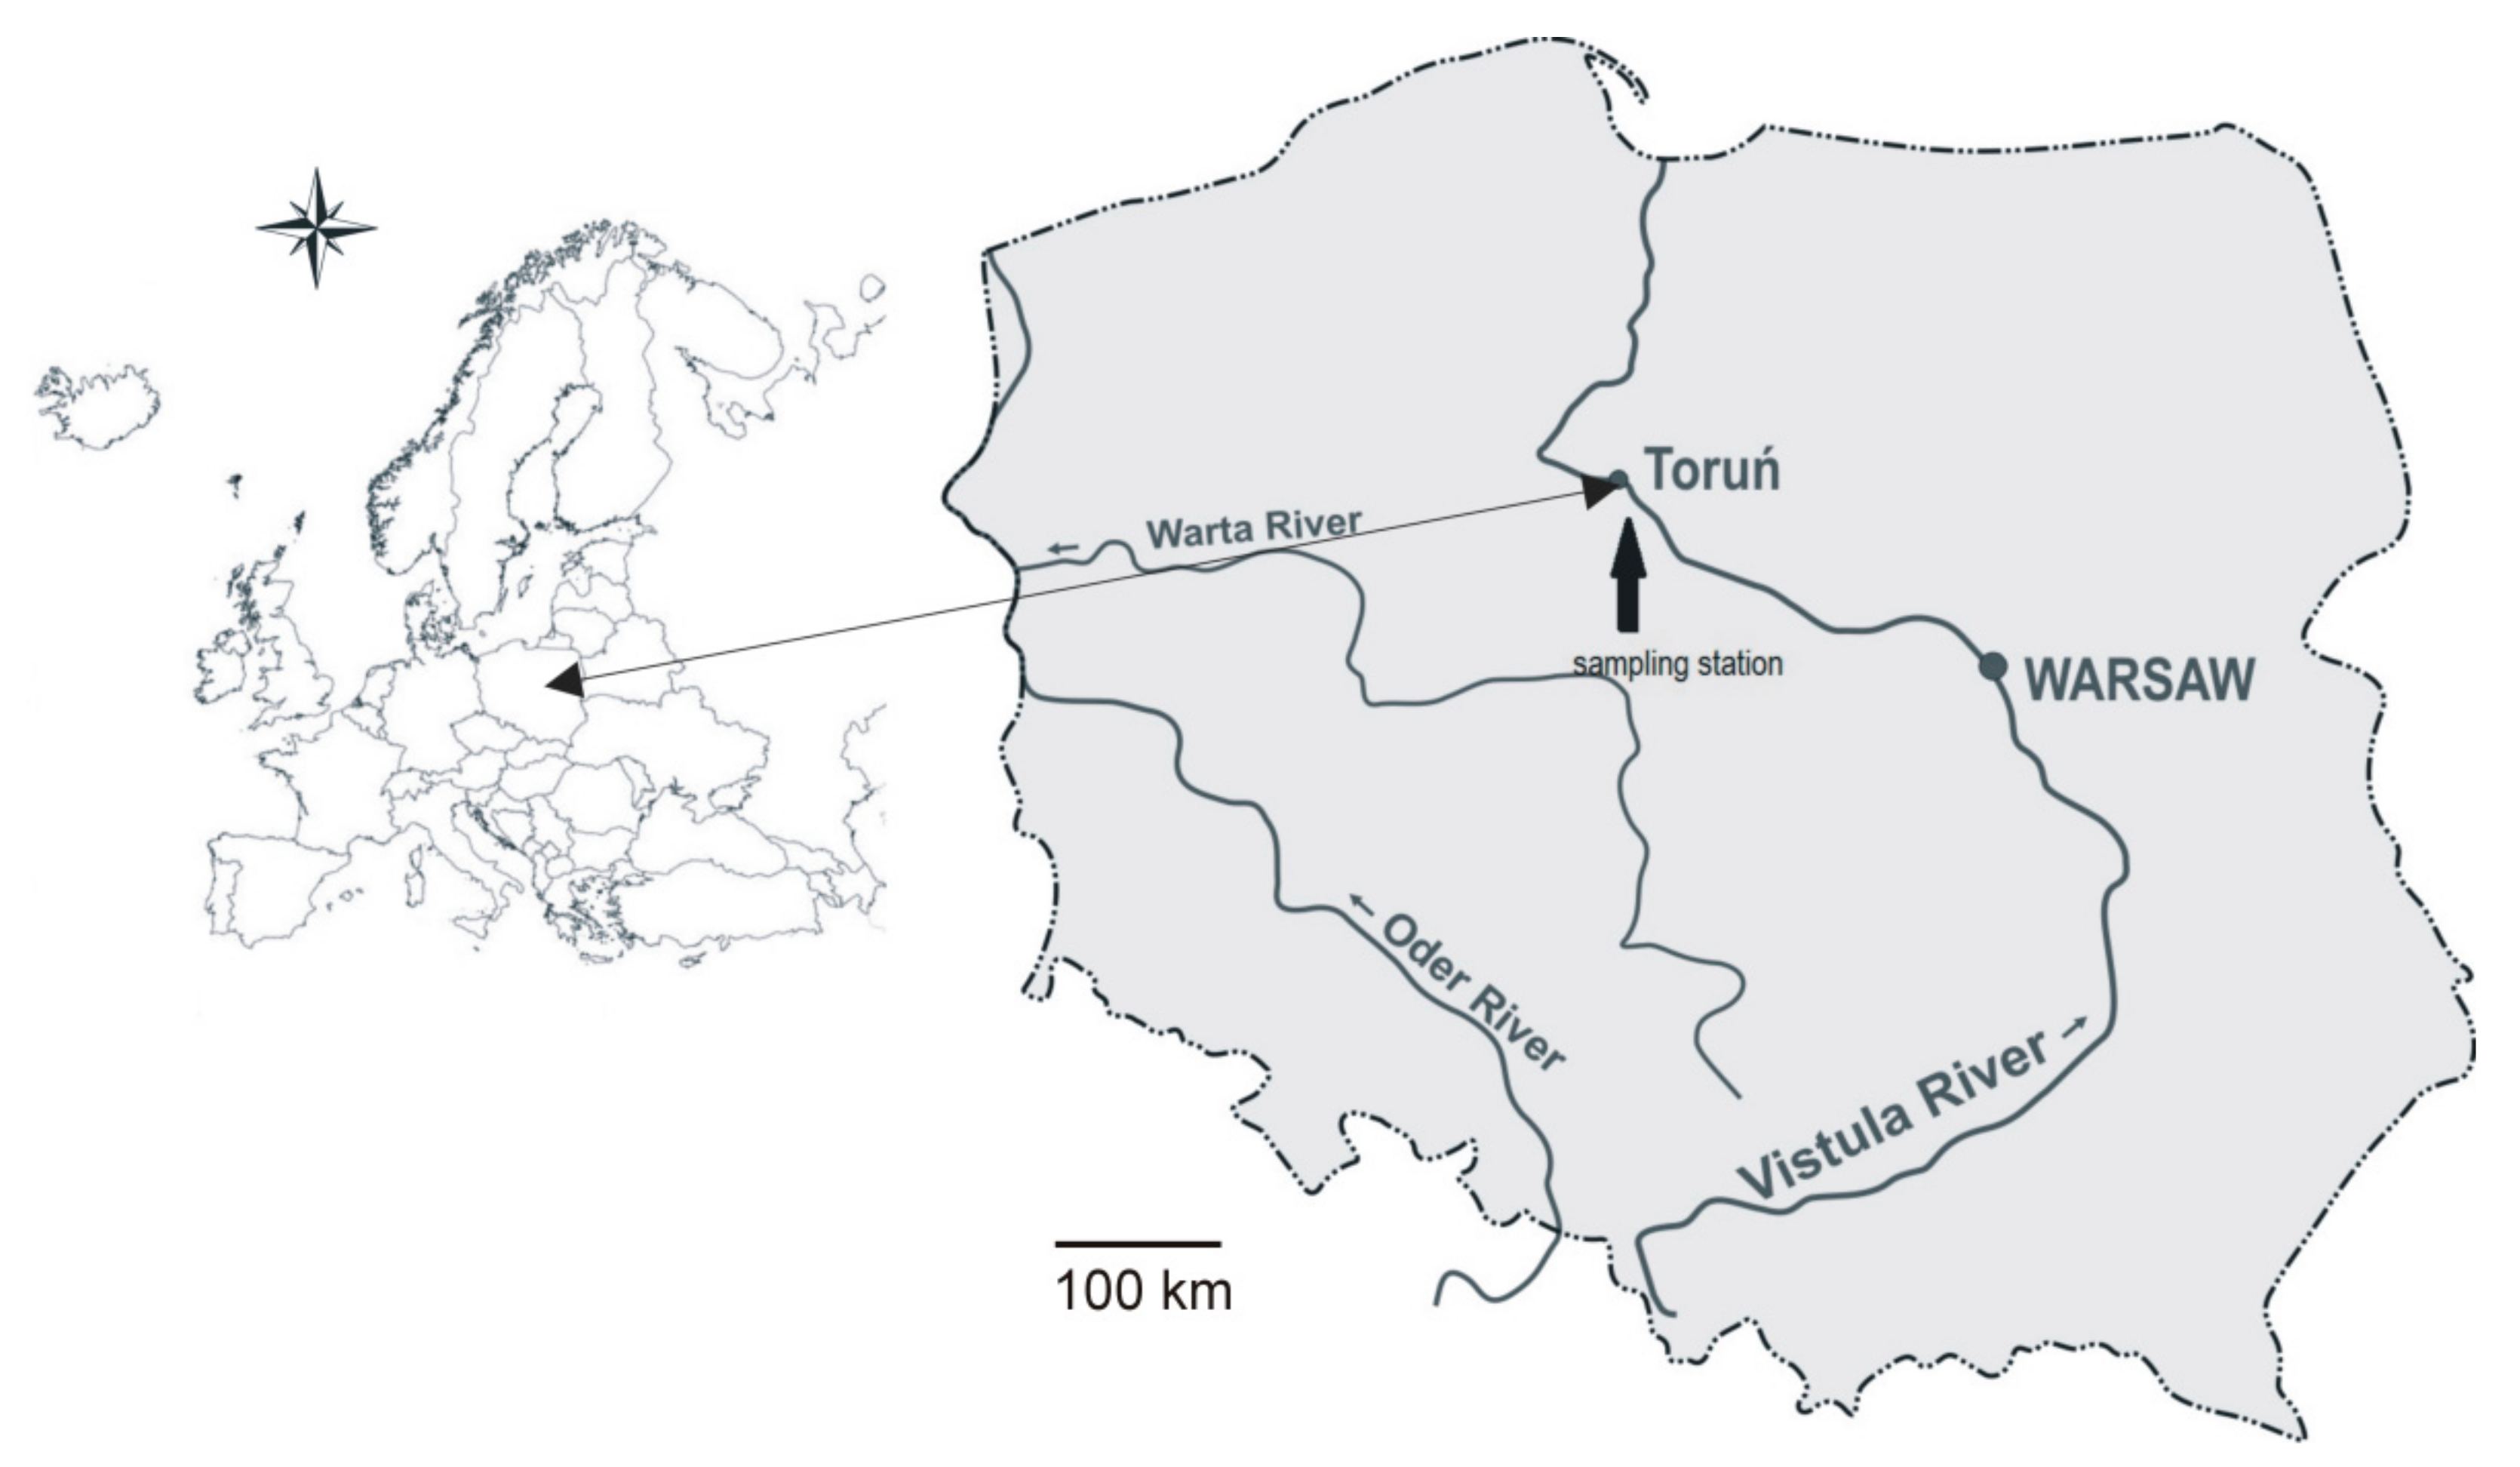
Figure 1. Location of the investigated station on the Vistula River.
Water 13 03471 g001
Figure 2. Number of taxa and Shannon–Wienner diversity index calculated on the basis of phytoplankton biomass in the Vistula in the period from 1994 to 2020.
Water 13 03471 g002
Figure 3. Changes in phytoplankton biomass, chlorophyll a concentrations, and the trend lines in the Vistula in the period from 1994 to 2020.
Water 13 03471 g003
Figure 4. Percentage share of phytoplankton groups during the investigation period.
Water 13 03471 g004
Figure 5. Changes in IFPL values and the trend line in the Vistula in the period from 1994 to 2020 (orange—poor, yellow—moderate, green—good ecological potential).
Water 13 03471 g005
Figure 6. Changes in pH values and the trend line in the Vistula in the period from 1994 to 2020.
Water 13 03471 g006
Figure 7. Changes in oxygen concentration (DO) and the trend line in the Vistula in the period from 1994 to 2020.
Water 13 03471 g007
Figure 8. Changes in conductivity (EC) and the trend line in the Vistula in the period from 1994 to 2020.
Water 13 03471 g008
Table 1. Limit values for the Great Lowland River water quality classes according to phytoplankton surveys (multimetric phytoplankton index for rivers—IFPL).
Water Quality ClassEcological Status/PotentialIFPL Values
Firsthigh/maximal≥0.96
Secondgood≥0.79
Thirdmoderate≥0.47
Fourthpoor≥0.16
Fifthbad<0.16
Table 2. Annual average values of nutrients in the Vistula River.
YearTP (mg/L)P-PO4 (mg/L)TN (mg/L)Nmin. (mg/L)
19940.260.133.01.88
19980.260.092.21.89
2008n.d.0.09n.d.0.93
2009n.d.0.05n.d.1.08
20170.140.053.61.27
n.d.—no data.
Publisher’s Note: MDPI stays neutral with regard to jurisdictional claims in published maps and institutional affiliations.