
Study on the Influence of Sponge Road Bioretention Facility on the Stability of Subgrade Slope
by
Wensheng Tang
1,2, 
Haiyuan Ma
1,2,*,
Xinyue Wang
1,2,
Zhiyu Shao
1,2,
Qiang He
1,2 and
Hongxiang Chai
1,2,* 1
Key Laboratory of Three Gorges Reservoir Region’s Eco-Environment, Ministry of Education, Chongqing University, Chongqing 400045, China
2
National Centre for International Research of Low-Carbon and Green Buildings, Chongqing University, Chongqing 400045, China
*
Authors to whom correspondence should be addressed.
Water 2021, 13(23), 3466; https://doi.org/10.3390/w13233466
Submission received: 3 November 2021
/
Revised: 1 December 2021
/
Accepted: 2 December 2021
/
Published: 6 December 2021
(This article belongs to the Special Issue Urban Runoff Control and Sponge City Construction)
Abstract
:With the large-scale application of sponge city facilities, the bioretention facility in urban roads will be one of the key factors affecting the safety of construction facilities in areas with abundant rainfall. In this study, by establishing a three-dimensional finite element model for numerical analysis and combining it with geotechnical tests, the effects of bioretention facility on water pressure distribution, seepage path, and slope stability under rainwater seepage conditions are proposed. In addition, this study puts forward the relationship between the parameters of the bioretention facility and the stability of the slope in combination with the effect of runoff pollution control, which provides direction and basis for the planning, design, and construction of sponge cities in road construction.
1. Introduction
With the rapid development of cities and the advancement of urbanization, non-point source pollution has begun to become the main factor affecting the urban ecological environment [1]. The gradually developed traffic network leads to a substantial increase in the area of impervious underlying urban surface, and the increase in engineering measures and traffic volume leads to an increase in the emission of pollutants such as dust and tail gas [2,3]. During heavy rains, the surface comprehensive runoff coefficient increases, resulting in increasingly serious surface runoff pollution. This has become one of the important hazards affecting the health of urban water bodies [4,5,6]. In order to reduce the flood disaster in the city during the rainy season and create a green and livable urban ecological environment, the United States first proposed the low-impact development (LID), including bioretention facilities, green roofs, permeable pavement, and other measures, which can effectively control rainwater runoff pollution that is the dominant source of pollution [7,8,9]. To play the natural ecological function, restore the urban ecological environment, and realize the natural collection, storage, penetration, and purification of rainwater, China proposed the concept of “Sponge City” in 2014 and issued relevant guidelines [10]. Since then, China has vigorously promoted the construction of sponge cities to reduce or even remove pollutants in rainwater runoff and realize the coordinated development of water resources and cities [11,12].
Bioretention facilities are an important technical measure in the road construction of sponge city. After introducing rainwater runoff formed by road impervious underlying surface into facilities mainly by gravity flow, they utilize the complex physical, chemical, and biological synergies between plants, soil, and filler to purify the rainwater and simultaneously absorb and reduce in situ rainwater runoff of roads to achieve the purpose of controlling the total amount of rainwater runoff and the peak value of runoff, reduce runoff pollution, and restore the natural hydrological cycle of the site [13,14]. In developed countries such as the United States, the research on bioretention technology started earlier, and much research was conducted on the reduction in peak runoff and the removal of pollutants. Therefore, a relatively complete technical system has been formed so far [15,16,17]. Recently, British scholar Maksimovic and his team put forward the concept of “blue-green dream”, which provides innovative methods for urban planning and transformation through the combination of blue-green components and integrated urban design [18]. With the popularization and application of sponge cities, research on bioretention facilities in China is also gradually deepening. Liang et al. (2020) used numerical simulation to analyze the changes in water content and settlement of the foundation in two bioretention facilities with different lengths of anti-seepage membranes [19]. Meng et al. (2013) summarized the effects of design parameters of bioretention facility on the retention effect and purification effect of road rainwater through years of experimental observations [20]. Pan et al. (2012) studied the total amount of rainwater runoff control, peak reduction, and delay effects of different peak flow in bioretention facilities through simulation experiments [21].
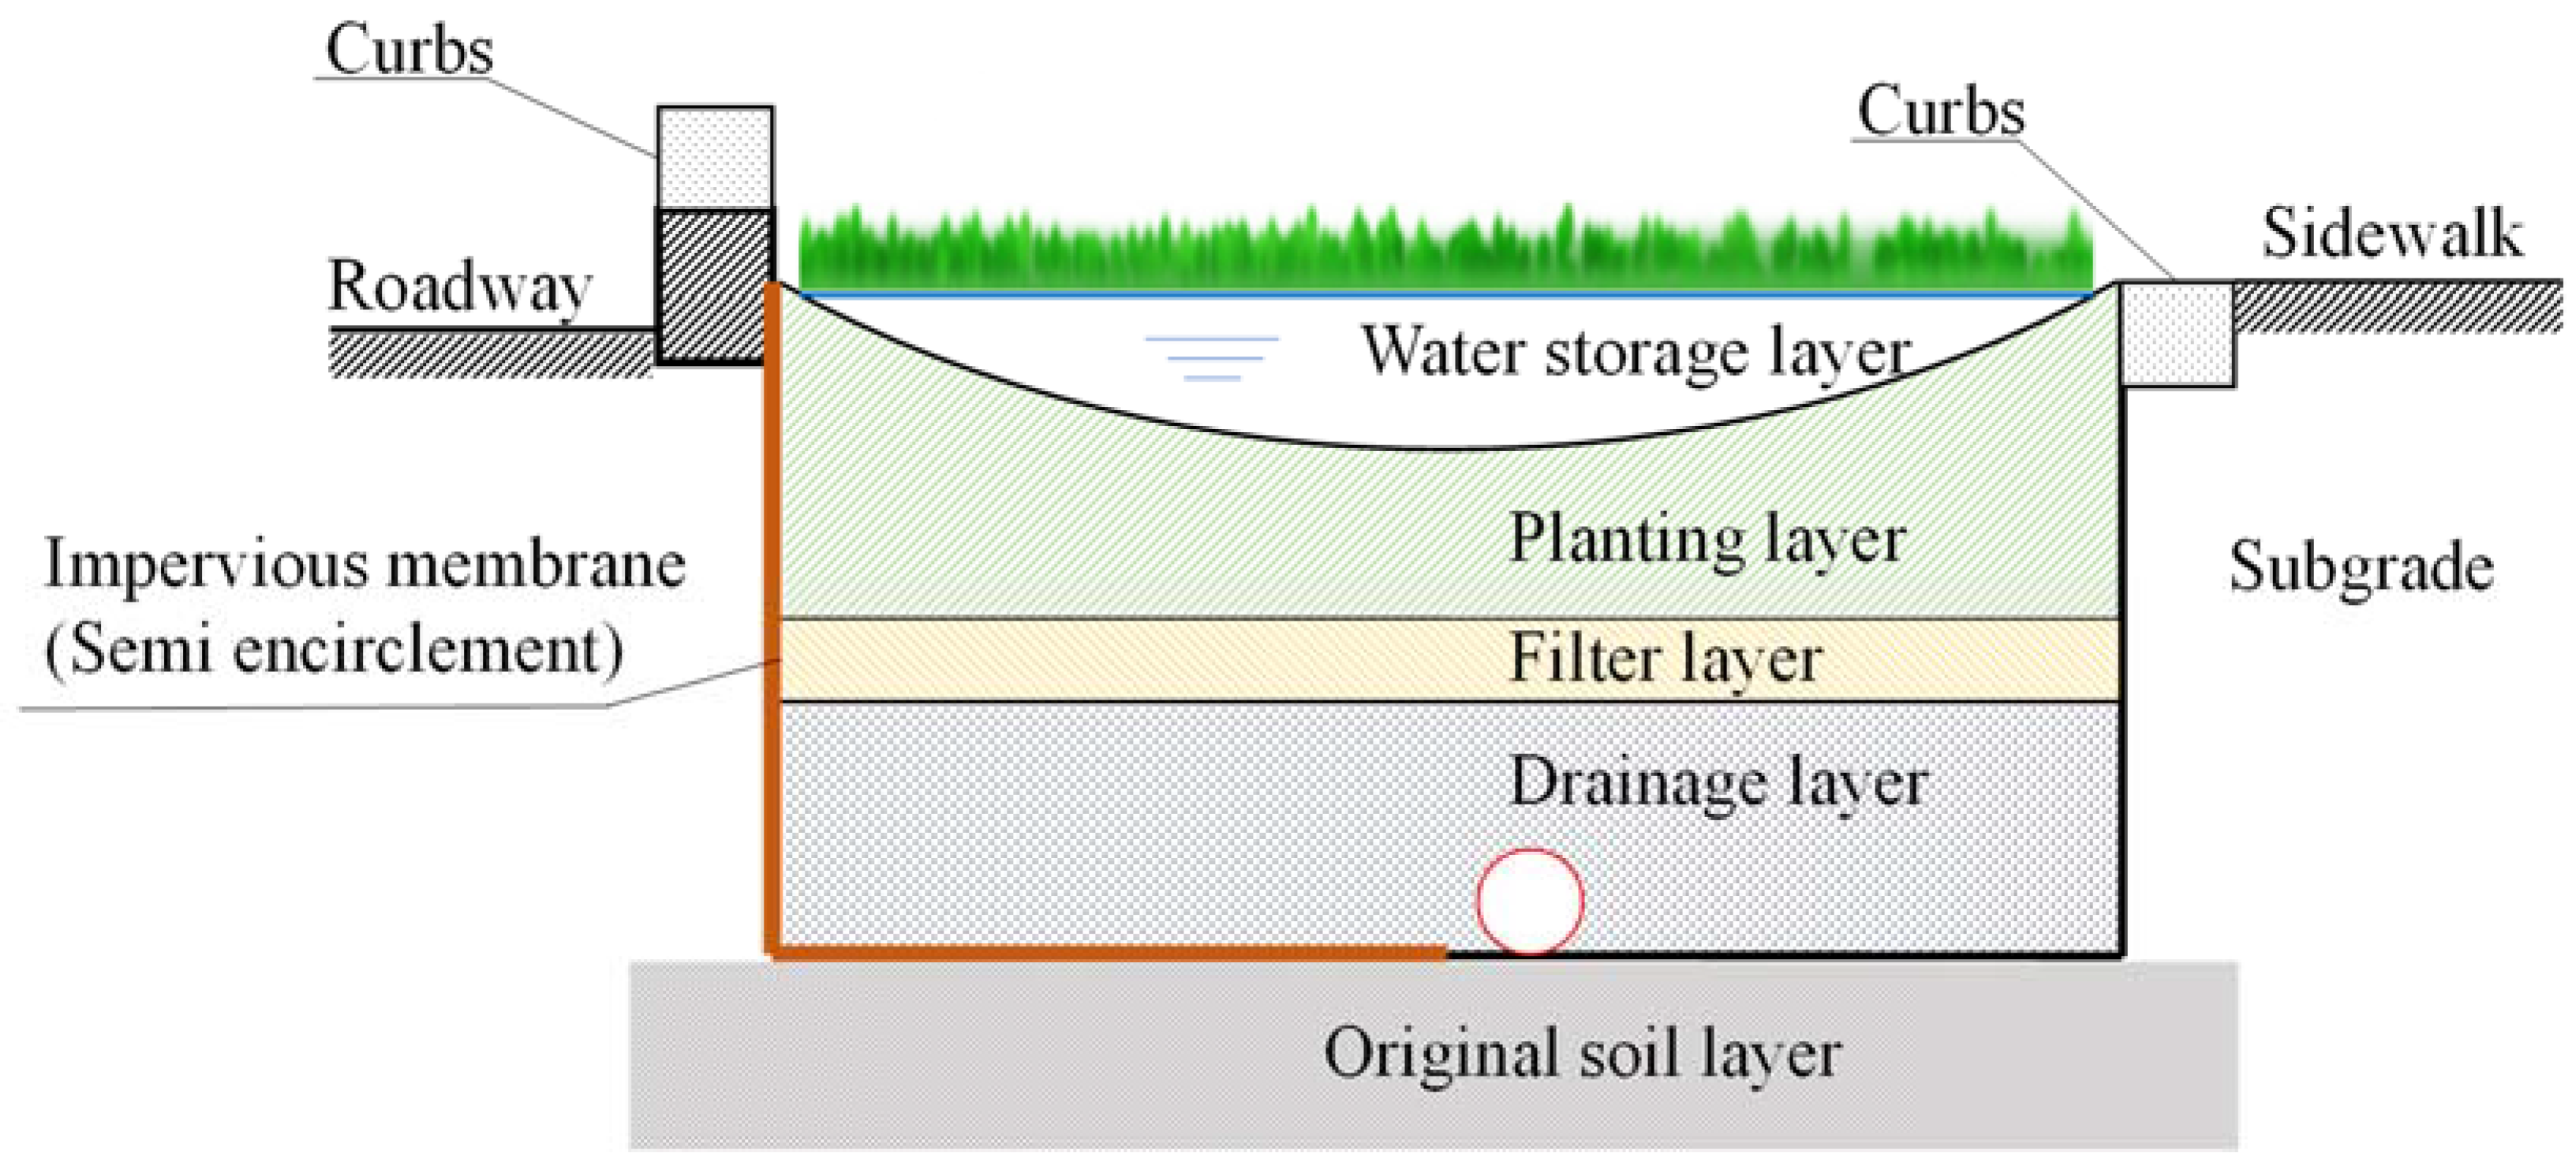
The bioretention facility in Sponge City will absorb most of the surface runoff, effectively reducing the probability of urban waterlogging. Road rainwater runoff enters the bioretention facility through the pavement and curb openings. The structural layer of the bioretention facility is usually composed of the water storage layer, planting layer, filter layer, and drainage system, etc. The typical cross-section is shown in Figure 1. The water storage layer is located on the surface of the facility and acts as temporary retention of rainwater runoff. The planting layer plays the role of infiltration and purification of rainwater runoff and preserves part of the rainwater to meet the need for plant growth. The filter layer can store part of the infiltration runoff and enhance the purification effect of the facility. The drainage system at the bottom is usually composed of a gravel layer and perforated drainage pipes wrapped in it, which serves to enhance the hydraulic conductivity and transport properties of the retention zone.
At present, research on bioretention facilities mainly focuses on the purification mechanism of pollutants and runoff regulation effects. However, few studies pay attention to its influence on the seepage and stability of subgrade slopes. Because most of the carriageways and sidewalks are impervious paving, the rainwater grate on the roadway is easily blocked under heavy rain or continuous rainfall. The biological retention facility will become the main rainwater drainage channel on the road. The influx of a large amount of rainwater caused the biological retention facility to reach saturation. The rainwater seeps into the roadbed and the slope, making the soil of the slope that was originally unsaturated gradually become saturated, the shear strength between the soils reduces. This will further lead to the instability of the road slope [22].
Based on the Green-Ampt model, Pradel et al. (1993) accurately derived the function relationship between rainwater seepage depth and rainfall duration by considering rainfall intensity, rainfall duration, the volume fraction of water in slope soil, and the substrate suction of unsaturated soil [23]. Ng et al. (1998) used the finite element analysis method to analyze the transient seepage changes under different rainfall situations and different initial conditions and analyzed the influence of hydrogeological conditions, slope seepage prevention, and rainfall characteristics on slope stability [24]. Sun et al. (2009) established a finite element model and carried out research with examples, considering slope softening includes damage softening and water-induced softening [25]. The results show that with the increase in water content, the increase in rigidity ratio of soil is the main factor leading to slope instability under rainfall conditions.
When rainwater seepage occurs inside the road slope under the action of rainfall infiltration, the water content of the soil increases, and the shear strength decreases, which has a very negative impact on the stability of the slope. Therefore, it is necessary to consider the influence of pore water pressure when analyzing slope stability. The failure of soil slope manifests as local stability failure and overall stability failure. The former is caused by concentrated seepage or seepage gradient greater than critical gradient, which manifests as internal erosion, leading to piping and flowing soil on slope surface. The latter is caused by pore water pressure prevalent in the seepage field because the pore water pressure, especially the excess pore water pressure, causes the shear strength of the soil to decrease, which leads to instability of the entire slope.
This study focused on the influence of sponge road bioretention facility on the stability of subgrade slope and analyzed the water pressure distribution, seepage path, and slope stability under rainwater seepage conditions by combined use of three-dimensional finite element model and geotechnical tests.
2. Materials and Methods
2.1. Road Runoff Infiltration Analysis
H. Darcy, a French engineer, put forward the famous Darcy’s law through long-term observation, experiment, and deduction to describe saturated flow in homogeneous sand columns. According to Darcy’s law (Equation (1)), there is a proportional relationship between the water velocity and hydraulic gradient in the process of saturated soil seepage:
where is the hydraulic gradient (−), is the hydraulic head (m), and is the length through which the water flows (m). The proportionality coefficient K quantifies the resistance of the porous medium to the movement of the fluid, and it is called the hydraulic conductivity of the saturated porous medium. K was originally referred to as the permeability coefficient [26]. In the International System of Units (SI), K is expressed in m/s, but in the current practice, the most used unit is m/d.
Rainfall infiltration of soil is a movement of water in the gas of the soil. It is a process of two-phase flow, in which water replaces air in the process of infiltration. After the rain infiltrates the slope, the substrate suction field and pore pressure field of the slope are changed, which causes the redistribution and adjustment of the original stress field of the slope.
Based on Darcy’s law and the mass conservation, Richards (1931) formulated the flow equation under transient conditions for a variably saturated porous medium as a function of the water content and the pressure head [27]. The hydraulic conductivity is a function of the water content (Equation (2)):
This is the first time that Darcy’s law has been applied to the analysis of water flow in unsaturated soils. The filling of the urban road subgrade generally controls the degree of soil compaction, which ensures the optimal moisture content of the soil and the unsaturated state of subgrade soil. The volume of water and air contained in unsaturated soils is the key factor affecting rain infiltration. Regardless of thermal, chemical reactions, and electric gradients, the driving force of water seepage in unsaturated soils comes from the positional head and the negative pore water pressure in the soil.
2.2. Project Overview
This paper takes the newly-built municipal sponge city road in Chongqing as the research object. The soil layer in the construction site is mainly quaternary Holocene plain fill (Q4ml) and distributed residual Diluvial silty clay (Q4el+dl); the underlying bedrock is composed of interbedded sandstone and sandy mudstone of the Middle Jurassic Shaximiao Formation (J2s). According to the geological prospecting evaluation, there is no adverse geological phenomenon at the site, and the rock and soil are stable. The newly-built road is an urban trunk road with a design speed of 60 km/h. It is a two-way six-lane standard road with a width of 38 m, of which the sidewalk is 7.5 m wide. The side slope of the roadbed is graded every 8 m, of which the bridle-way is 2 m wide, and the slope rate is 1:1.5 and 1:1.75 from top to bottom.
Biological retention facilities are set up between the sidewalk and the curbs of the road and are arranged longitudinally along the road. According to the requirements of the “Sponge City Planning and Design Guidelines of Chongqing”, the total annual runoff control rate in the region is ≥70%, and the rainwater runoff pollutants reduction rate is ≥50%. The biological retention facility adopts a typical cross-section form with a design width of 3.5 m, in which the depth of the water storage layer, the thickness of the planting layer, the thickness of the filter layer, and the thickness of the gravel layer are 20 cm, 50 cm, 10 cm, and 30 cm, respectively. The anti-seepage membrane is in the form of a half-wrap, and the structure layer is in contact with the roadbed to prevent rainwater from entering the range of the roadbed during the process of rainwater seepage, which affects the quality of the roadbed.
2.3. Calculation Conditions
The three-dimensional finite element program MIDAS/GTS is used for the numerical simulation calculation. The software can simultaneously conduct three-dimensional spatial model analysis, stress analysis by stratum structure method, and stress-seepage coupling analysis considering the influence of groundwater on the structure.
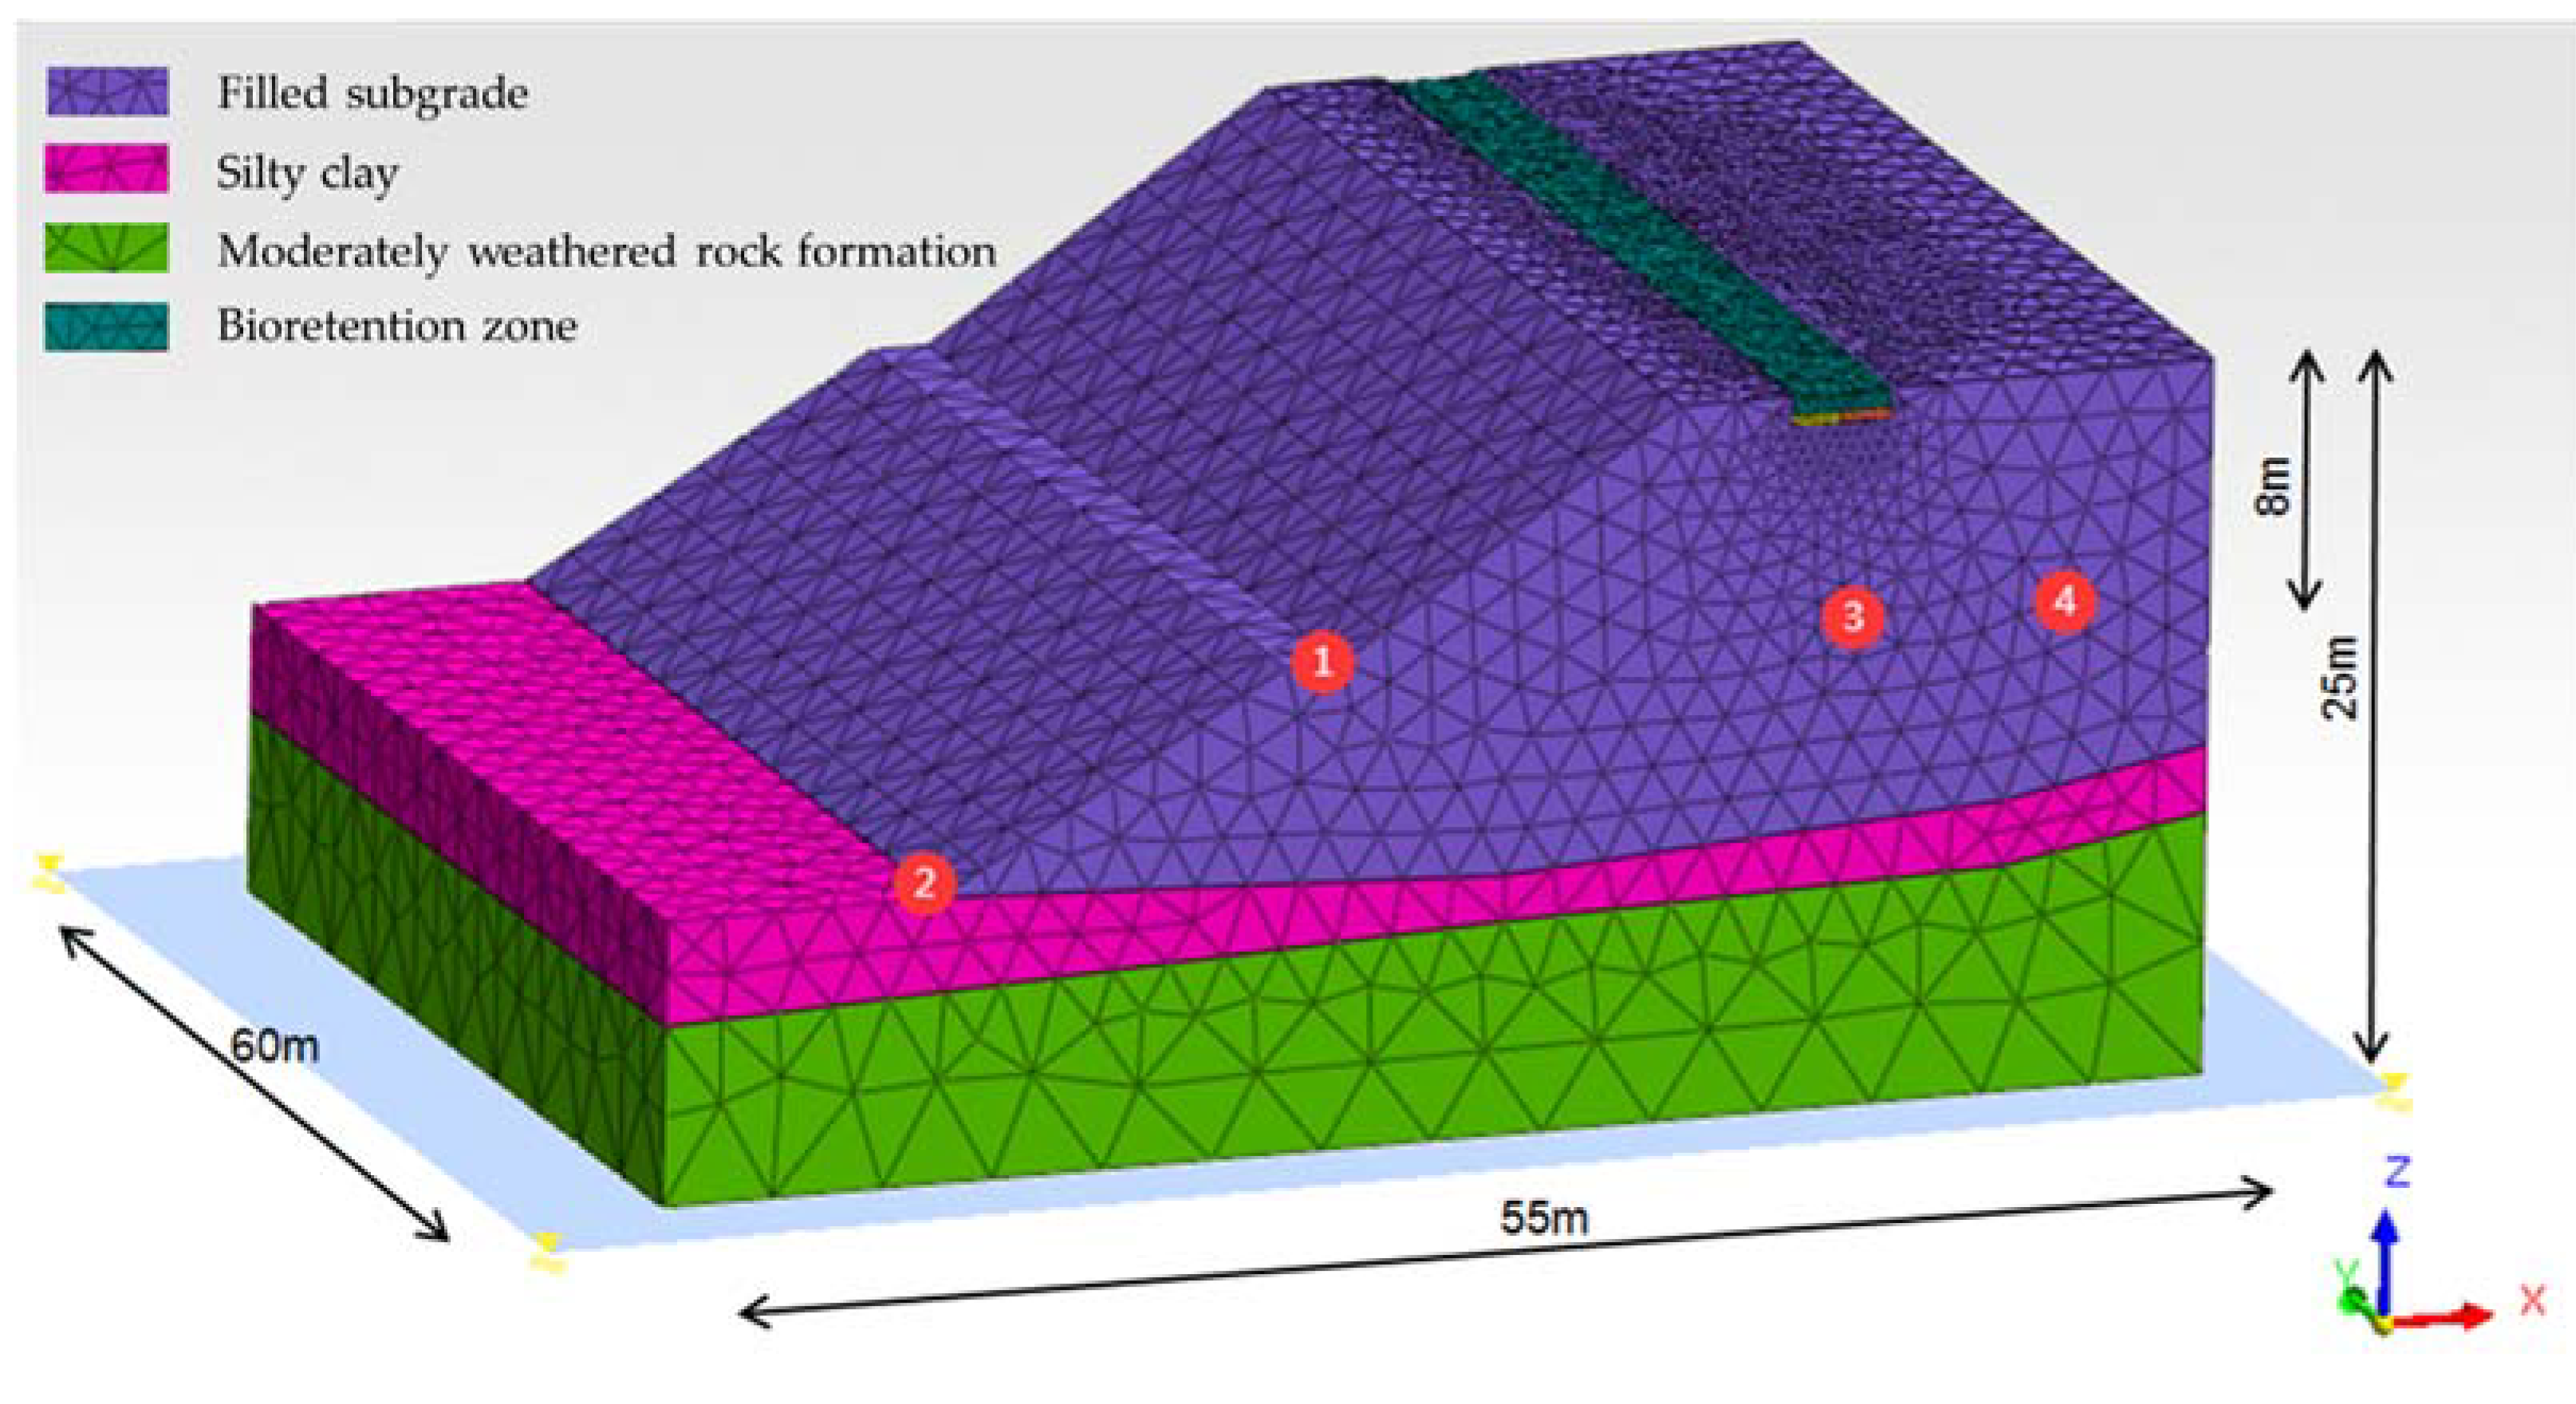
The experiment selects a typical roadbed cross-section with a roadway width of 19 m and a roadbed height of 15 m. The transverse range, vertical range, and length range of the model calculation are 55 m, 25 m, and 60 m, respectively. The calculation model regards the rock and soil as an isotropic ideal elastoplastic material and uses the Mohr–Coulomb yield criterion for analysis. According to the size of the model, the bridle-way in the middle of the slope is selected as the control point 1, the slope foot as the control point 2, 8 m depth below the midpoint of the bioretention facilities as the control point 3, and 8 m depth below the midpoint of the carriageway as the control point 4 (Figure 2).
According to the engineering characteristics of road slopes, this study uses solid element tetrahedral meshes to divide the three-dimensional model, which can perform not only stress-strain analysis on subgrade slopes but also conduct stress-seepage coupling analysis considering the impact of rainwater seepage. The grid division simulation method has become a commonly used numerical analysis method in the engineering field, and the calculation results were verified by actual projects with high credibility [28]. The three-dimensional finite element meshing is shown in Figure 2. The boundary conditions are as follows: for the boundary conditions of the three-dimensional model, the displacement on the left and right sides of the model is constrained in the X direction, the displacement in the front and back directions is constrained in the Y direction, and the displacement in the lower part is constrained in the X, Y, and Z directions. Considering that the bio-retention facility and the slope surface are permeable layers, the rainfall boundary conditions are set at the surface of the bio-retention facility and the side slope surface of the roadbed. The rainfall intensity is selected according to heavy rainfall in the same area of the road project [29], the rainfall duration is 24 h, and the rainfall intensity duration curve is shown in Figure 3.
2.4. Model Parameters
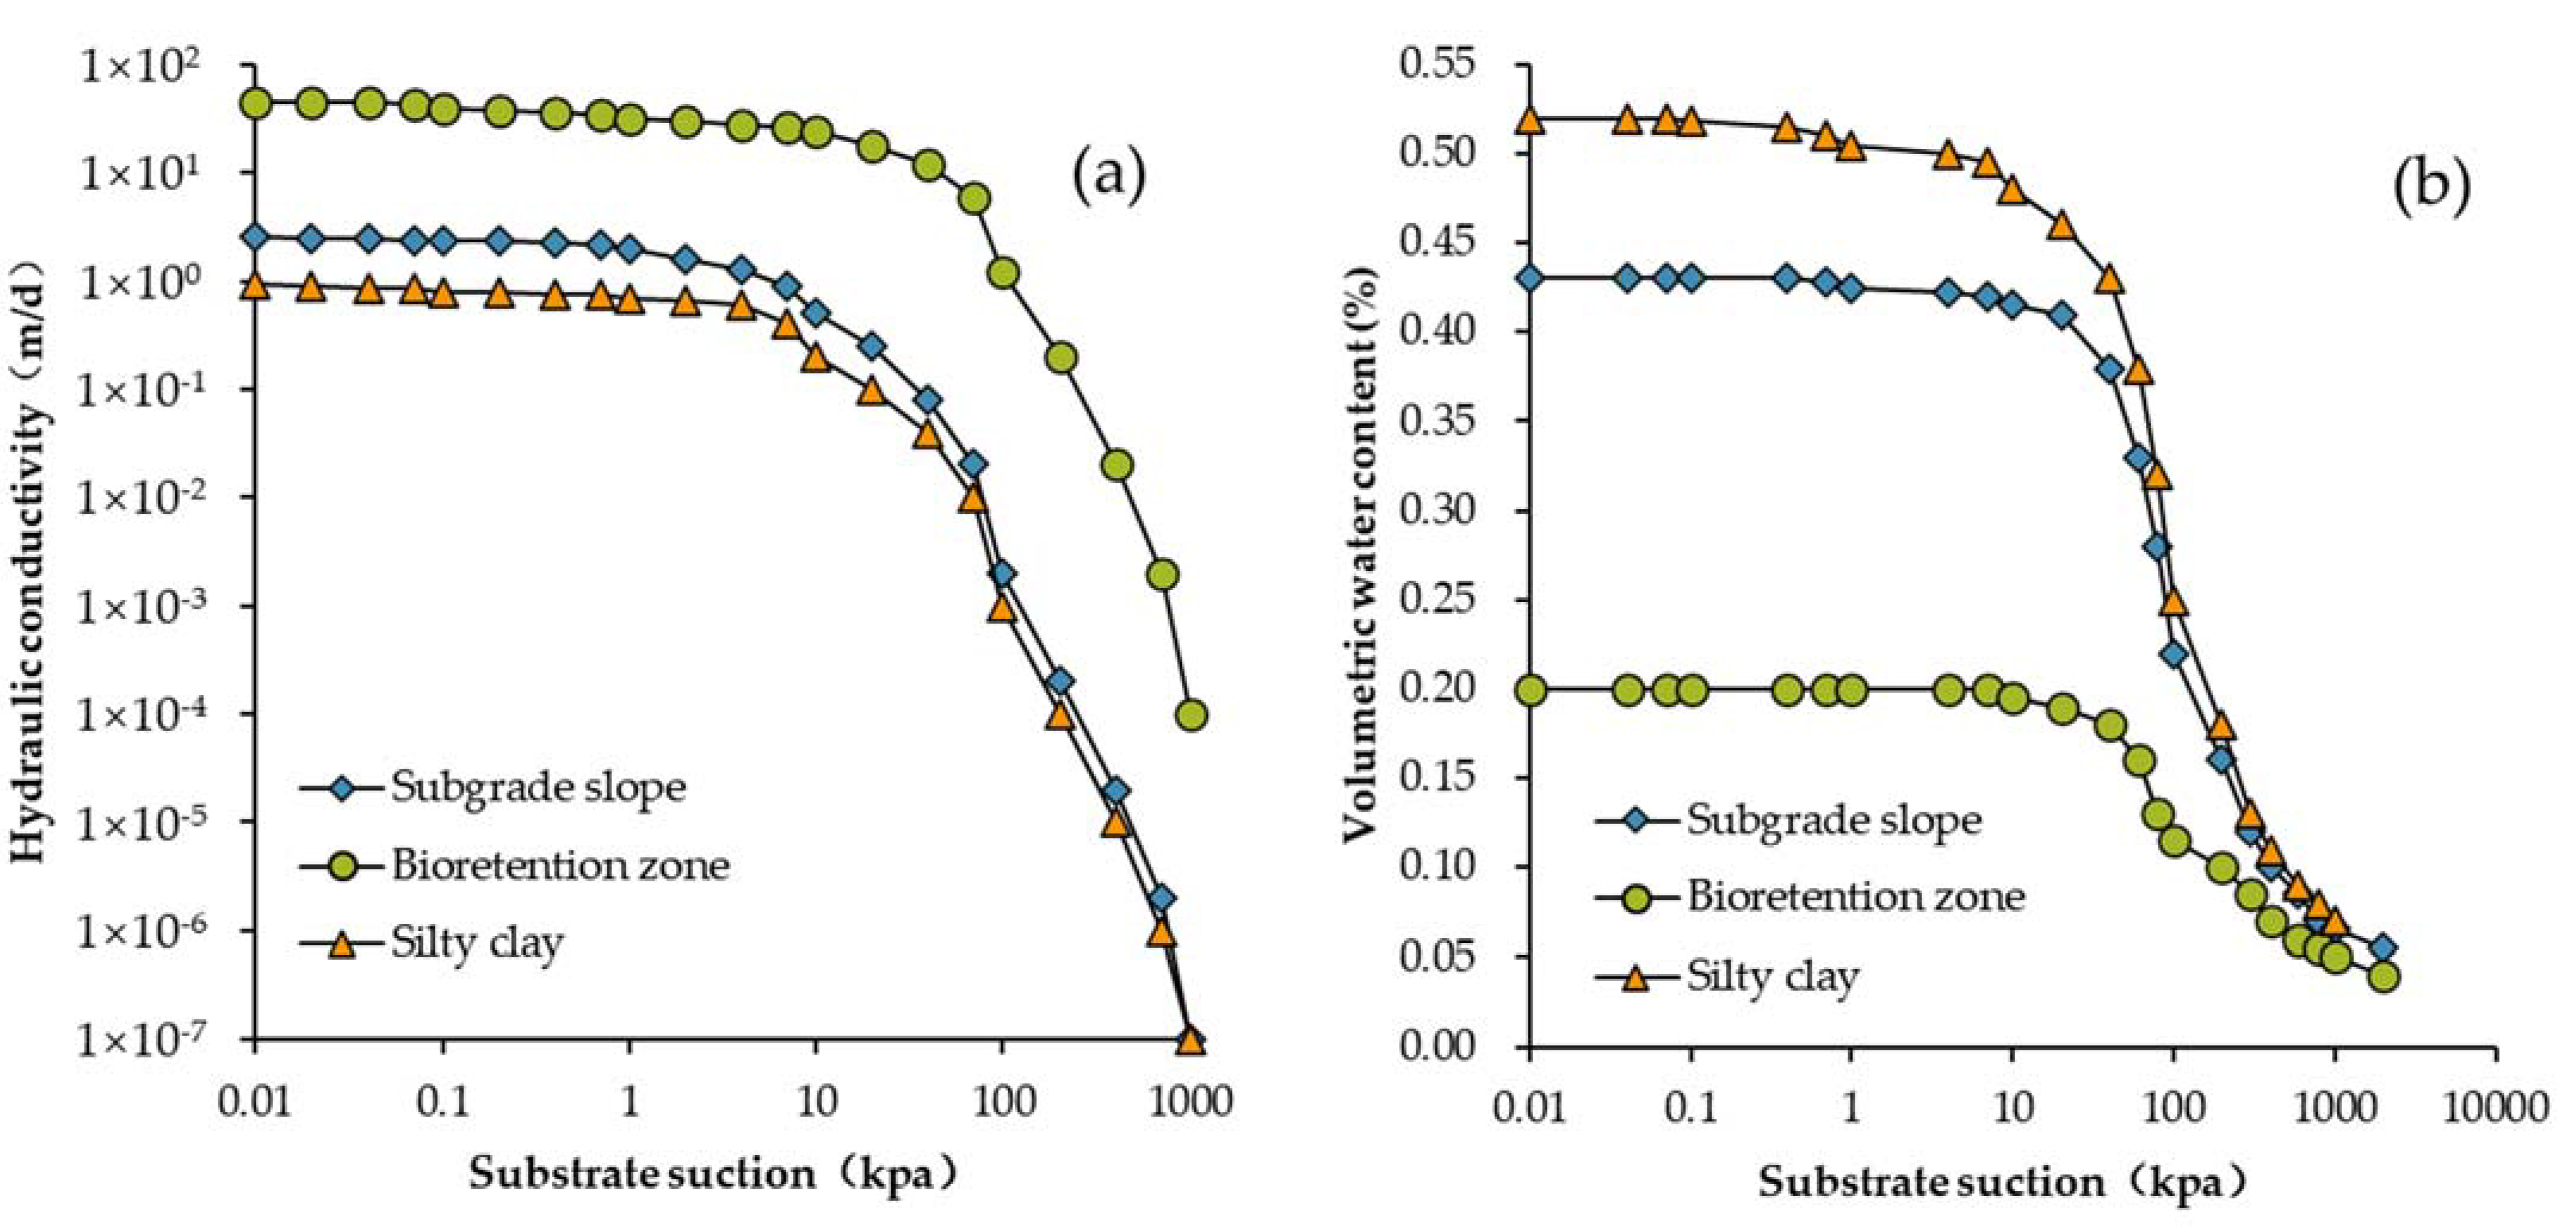
In calculation, according to the compactness of compacted fill in the actual project, the value of compactness of subgrade slope is 94%, and the current soil layer is taken as a silty clay layer. Because the clay cover layer has a low hydraulic conductivity compared to the conductivity of the weathered bedrock, the impact of the rainwater infiltration in the rock formation is not considered. The parameters of the planting soil layer in bioretention facility are consistent with those of subgrade fill, in which the parameters of the lower permeable layer are selected according to the gravel material with higher hydraulic conductivity, and the physical and mechanical parameters are selected according to geological engineering investigation and regional experience, as shown in Table 1.
The hydraulic conductivity curves and soil-water characteristic curves of different materials are shown in Figure 4. The initial pore water pressure distribution and provided in the Supplementary Materials.
3. Results
3.1. Influence of Bioretention on Pore Water Pressure
In order to analyze the influence of bioretention facility on pore water pressure distribution of subgrade slope under rainfall, it is considered that the layer below the slope toe is the current silty clay layer and the moderately weathered bedrock layer, and the subgrade slope soil is unsaturated being above the groundwater table.
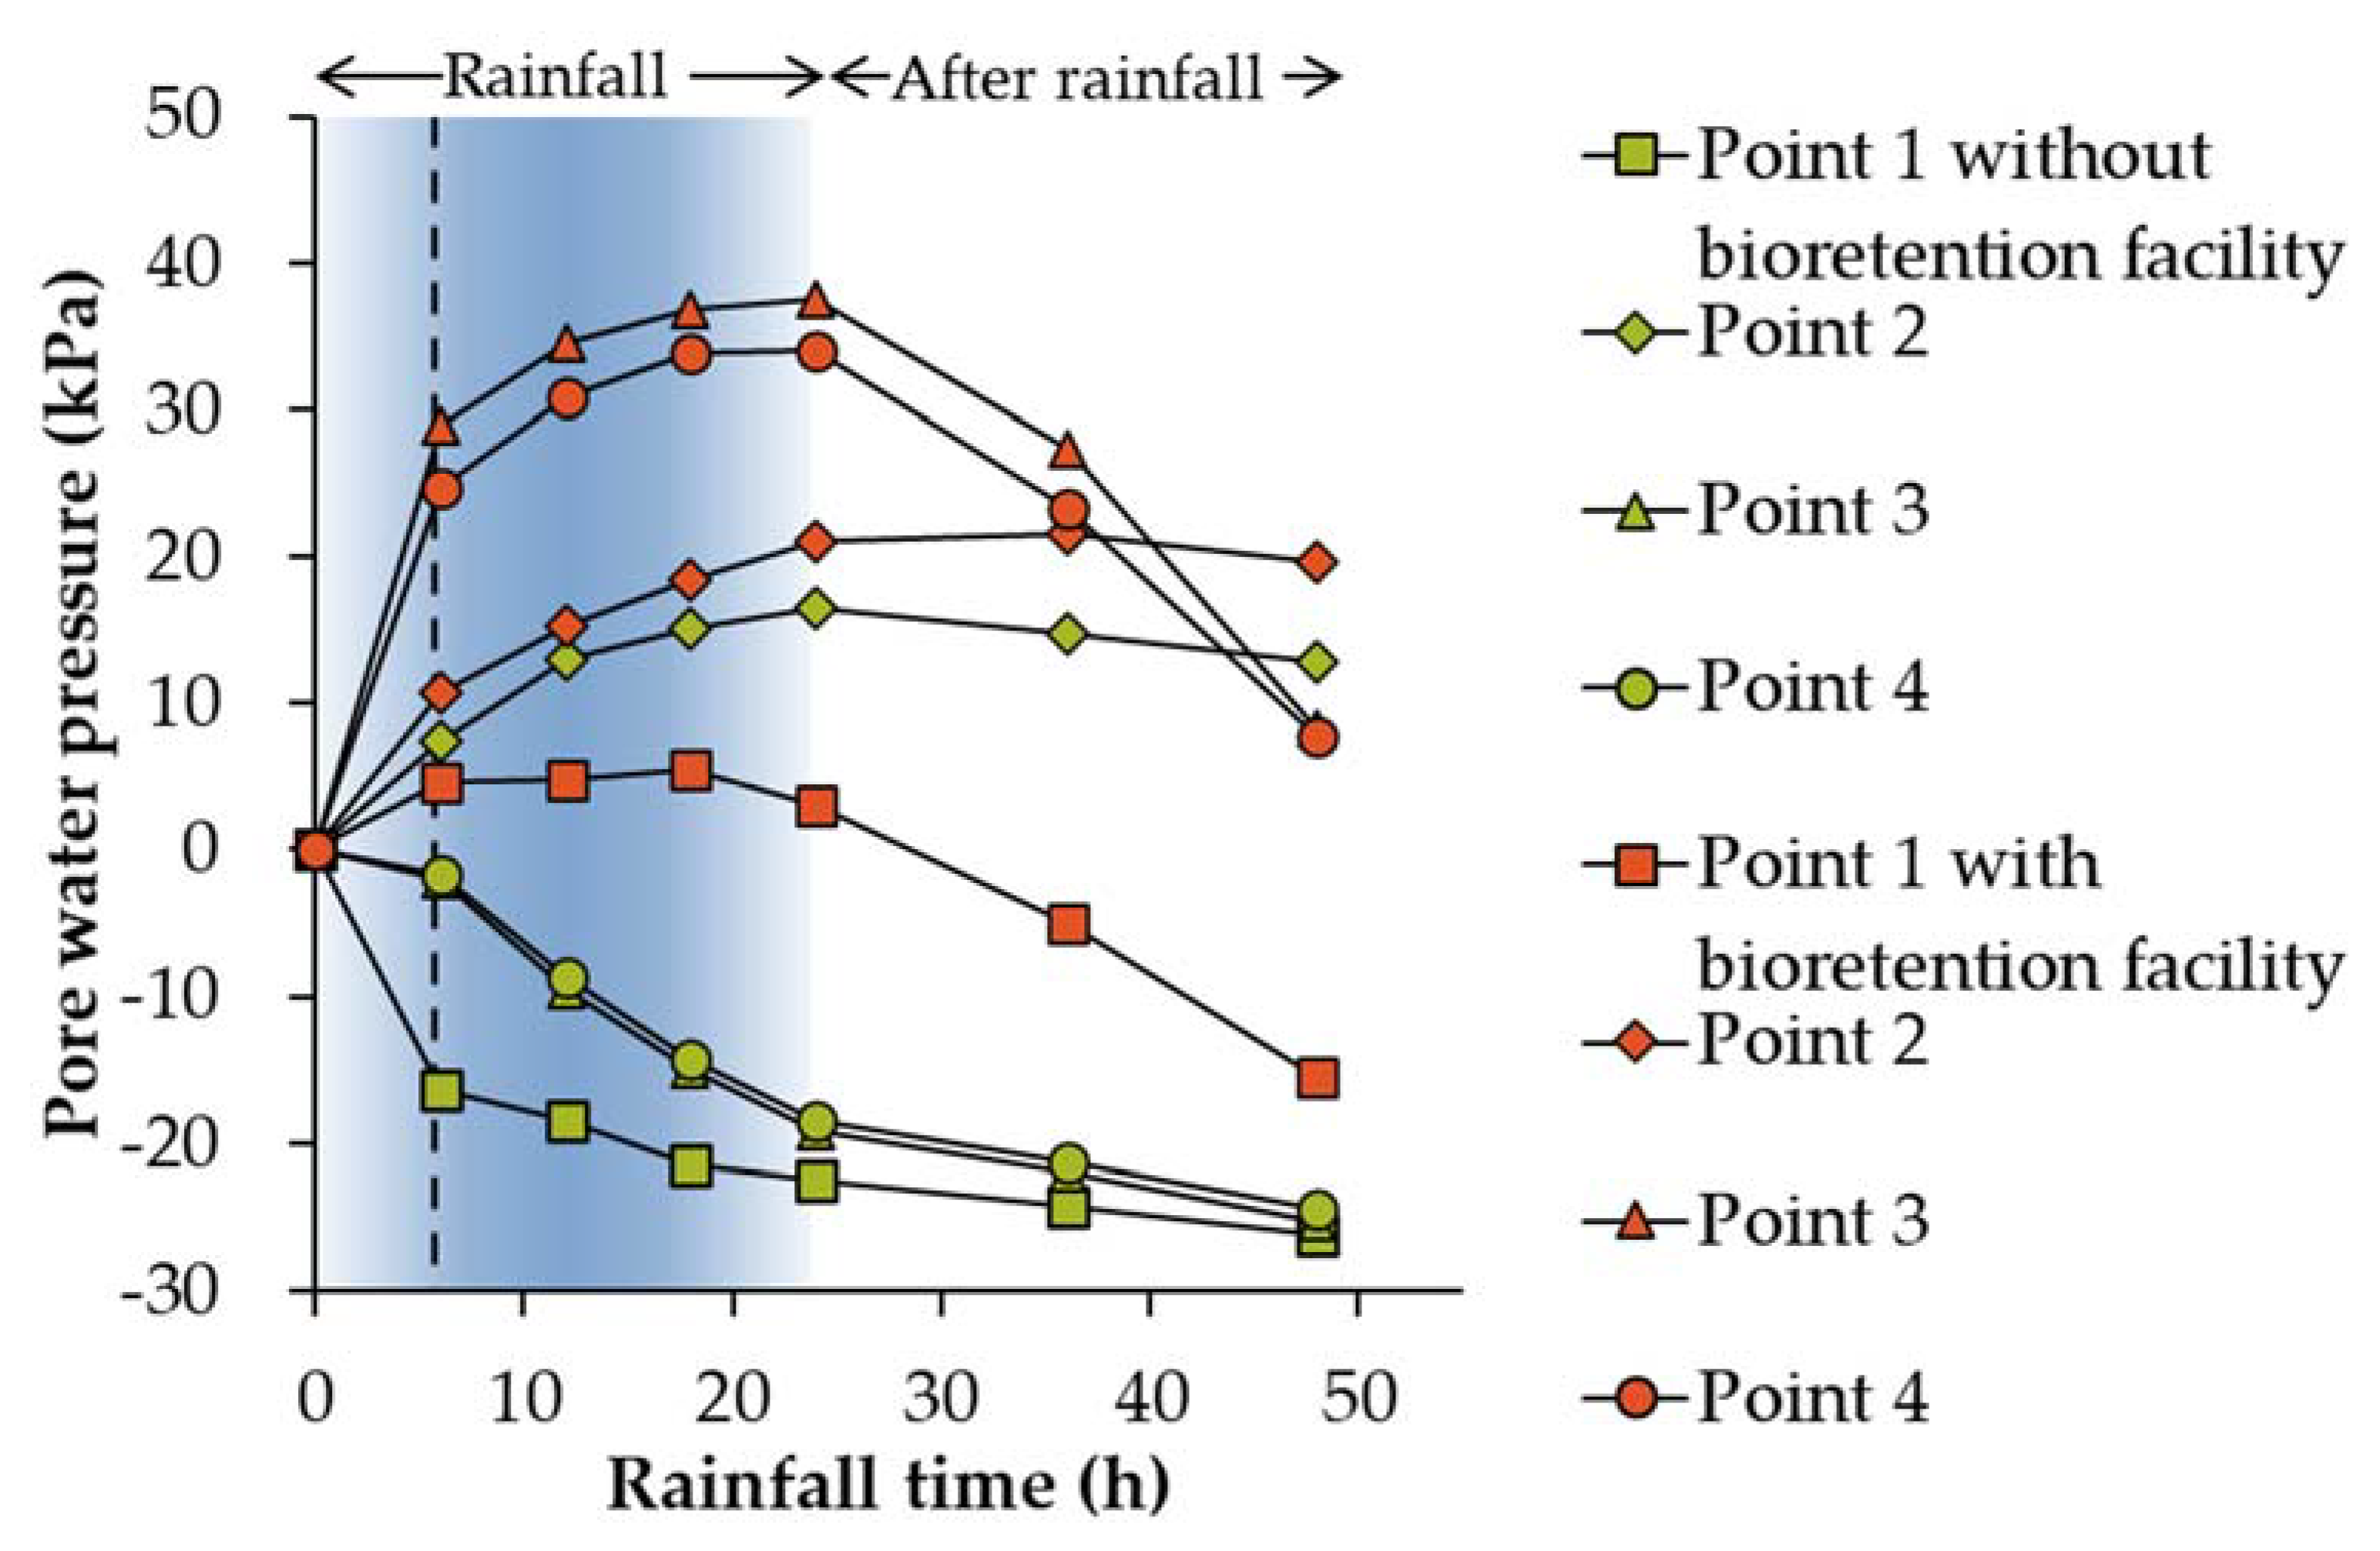
Figure 5 shows a cloud diagram of pore water pressure distribution of subgrade slope within 48 h after rainfall without and with bioretention facility.
Pore water pressure curves (Figure 6) at different control points show that the pore water pressure of rock and soil increases continuously with the rainfall time. When pore water pressure is negative, it indicates that the rock of the slope is unsaturated, and there is substrate suction. The substrate suction gradually decreases as the water content in the rock and soil increases. When the pore water pressure is positive, the inter-particle voids in the soil are filled with water and are in a saturated state. At this time, the substrate suction is zero.
At the beginning of rainfall (0–6 h), the pore water pressures at the four control points showed an increasing trend under the conditions of no biological retention facilities and biological retention facilities. Compared with the roadbed slope without biological retention facilities, the pore water pressure of control point 3 and control point 4 increased significantly from −2.1 kPa to 28.9 kPa and −1.7 kPa to 24.8 kPa, respectively, under the condition of biological retention facilities. It suggested that the rainwater infiltration of biological retention facilities has a greater impact on the pore water pressure of the sidewalk and the soil under the roadway, and the impact is basically the same.
In the middle and late stages of the rainfall (6–24 h), the increasing extent of pore water pressure at each control point under the two conditions decreased. Under the condition of biological retention facilities, the pore water pressure of control points 2, 3, and 4 increased from 10.8 kPa to 21.0 kPa, from 28.9 kPa to 37.5 kPa, and from 24.8 kPa to 34.0 kPa, respectively, showing a trend of slowly increasing with the rainfall time.
During the 24–48 h after the end of rainfall, the pore water pressure of control points 1, 3, and 4 showed different decreases. A decrease from 3.03 kPa to −15.4 kPa, from 37.5 kPa to 8.3 kPa, and from 34.0 kPa to 7.8 kPa were observed for three control points. The pore water pressure of control point 2 only slightly decreases from 21.0 kPa to 19.6 kPa. It indicates that after the rainfall ends, the pore water pressure of the soil under the slope, pavement, and roadway decreases with the infiltration of rainwater. The rainwater in the slope gradually concentrates on the slope foot along the seepage field after the rainfall ends so that the pore water pressure at the slope foot does not show a significant downward trend.
For control points without a bioretention facility, the pore water pressure values at points 1, 3, and 4 are all negative, indicating that the soil under the slope, pavement, and roadway is not saturated under this condition. While the pore water pressure value of point 2 is positive, which indicates that during the rainfall period, the rainwater is concentrated at the foot of the slope and reaches a saturated state. For control points with bioretention facility, the pore water pressure values are all positive values, indicating that the rainwater seepage through bioretention facility causes the saturation condition of slope surface, pavement, and soil under roadway, and has an obvious influence on the distribution of pore water pressure in subgrade slope.
3.2. Influence of Bioretention on Flow Velocity
Figure 7 is the cloud diagram of the flow velocity distribution of subgrade slope within 48 h after rainfall without and with bioretention facility.
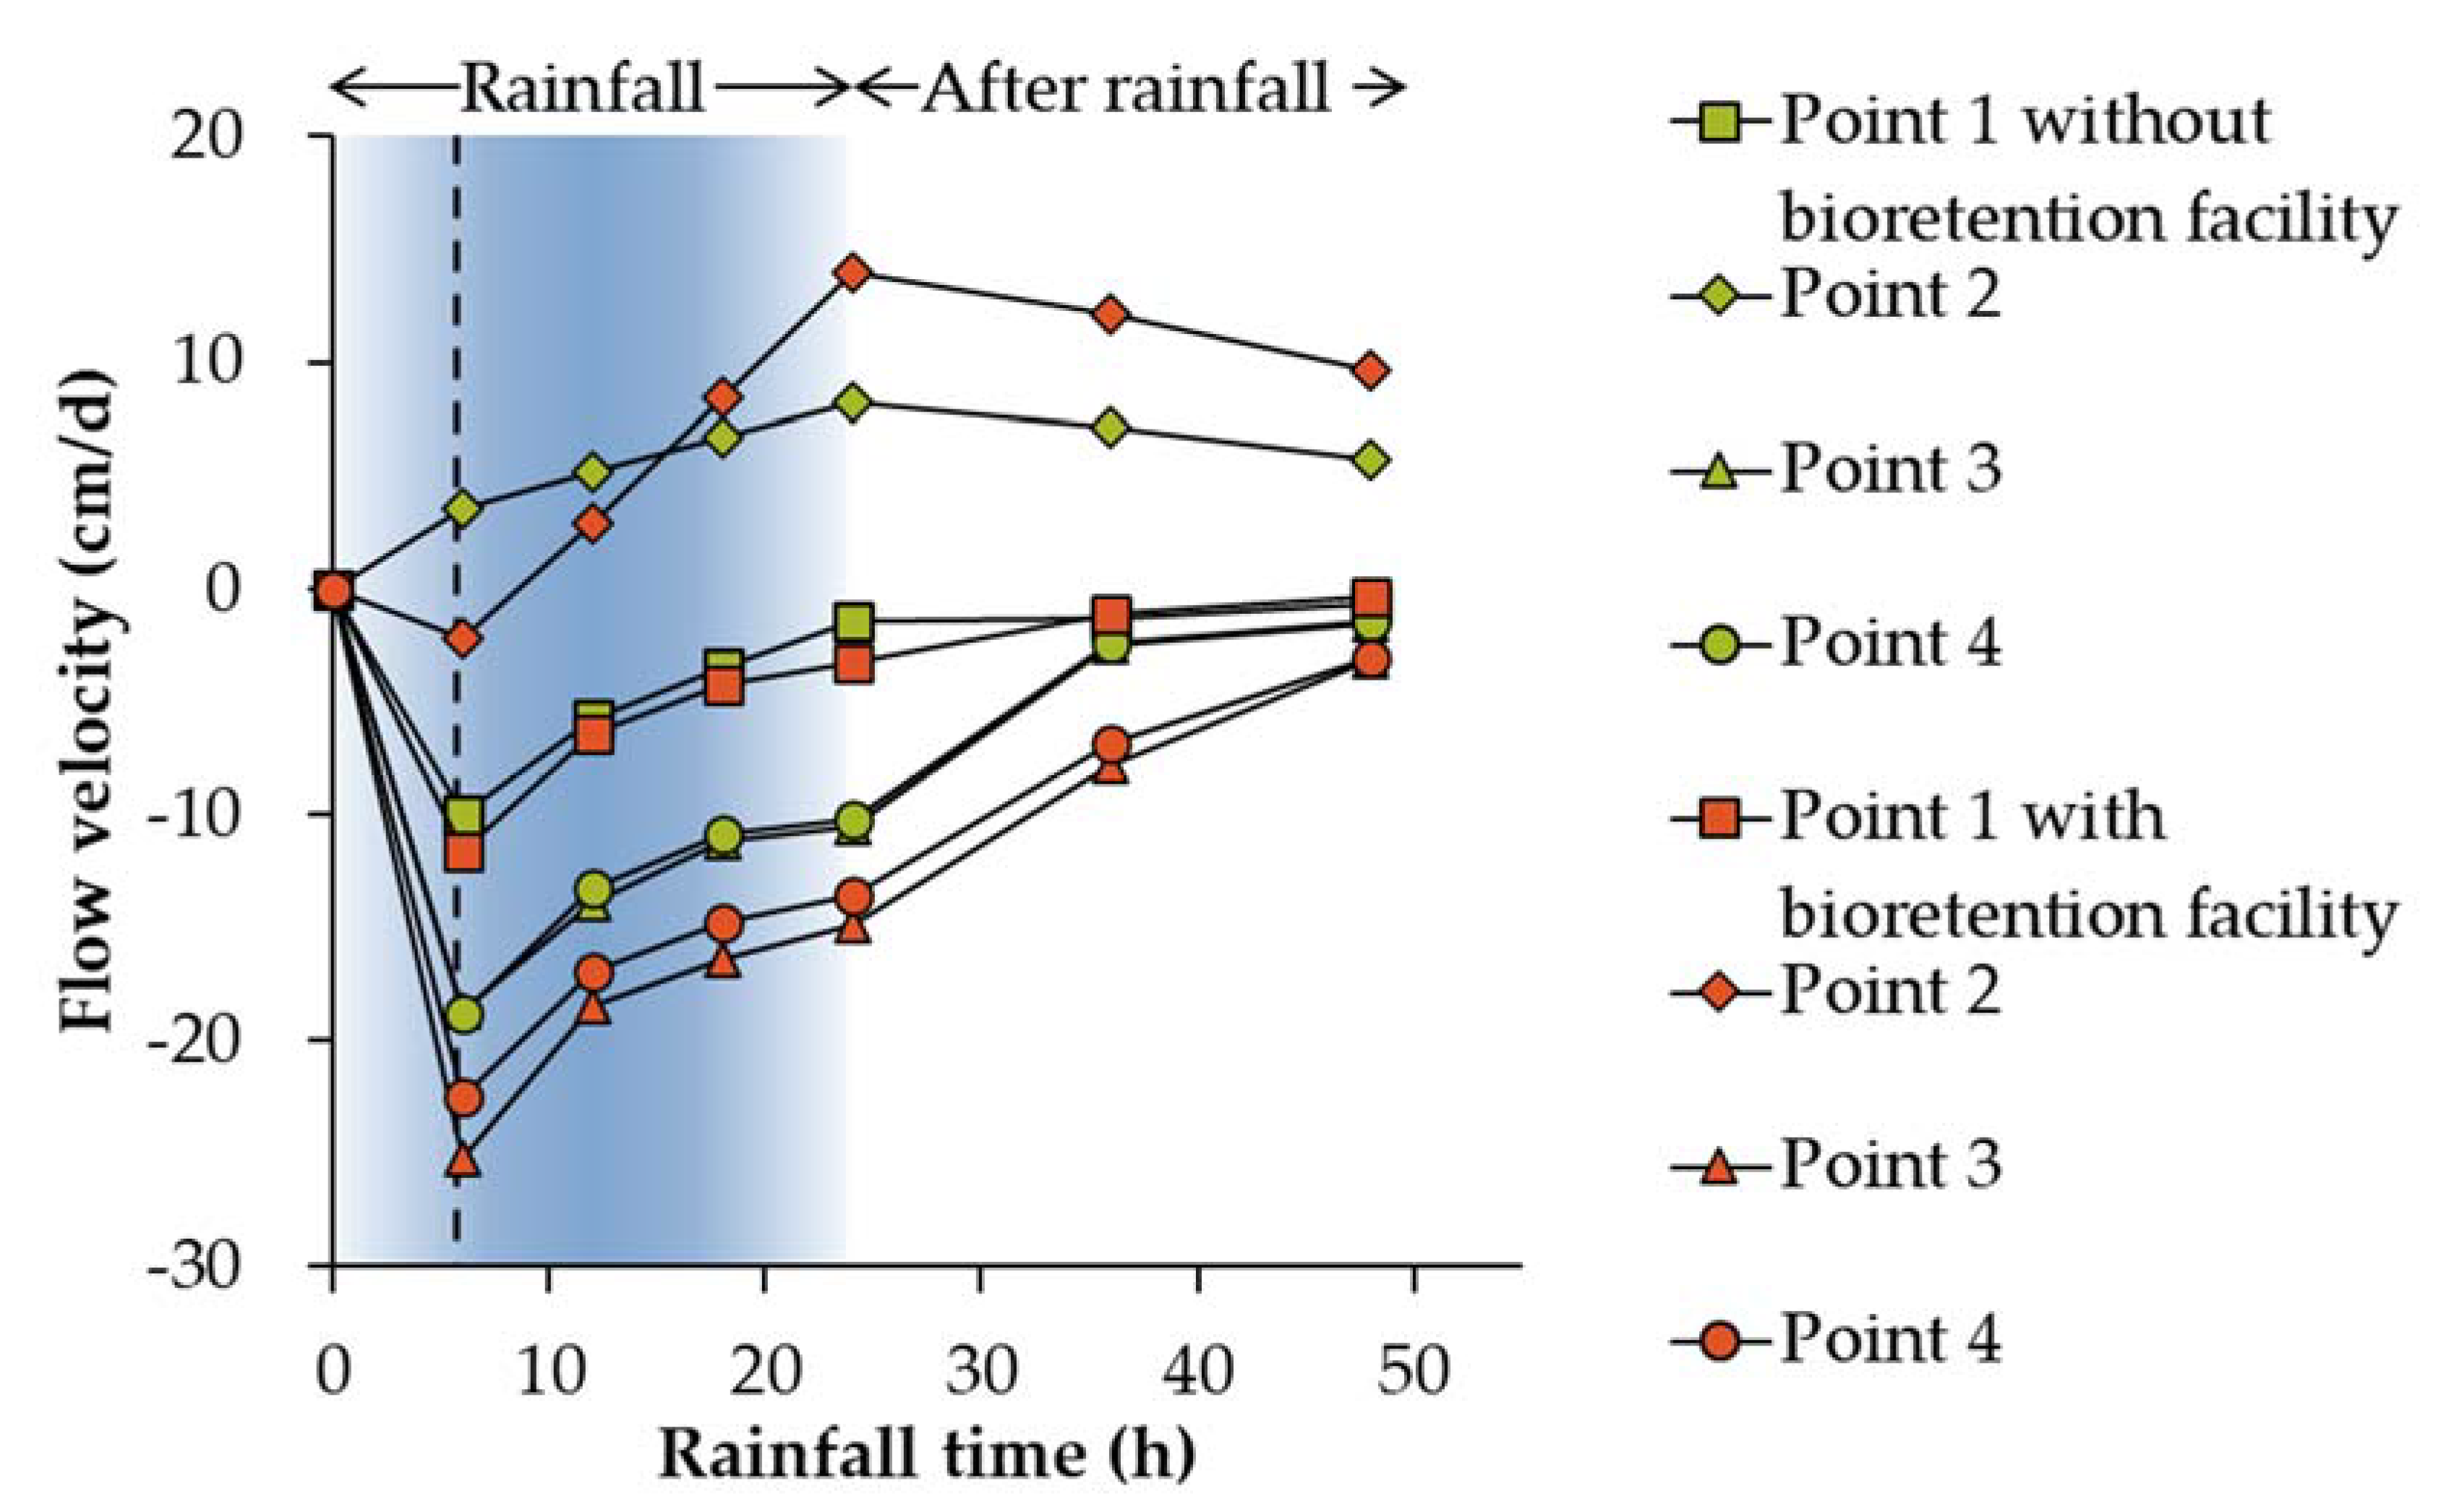
Figure 8 is a graph of the water flow velocity at different control points. In the figure, a positive value means that the direction of water flow is upward along the Z-axis, and a negative value means that the direction of water flow is downward along the Z-axis. The flow velocity curves of different control points were analyzed. In the initial rainfall period of 0–6 h, the flow velocity of control point 1 increased to 9.97 cm/d, control point 2 to 3.52 cm/d, control point 3 to 18.63 cm/d, and control point 4 to 18.74 cm/d. The flow velocity at all four control points increased linearly with the rainfall time, indicating that the slope soil saturated faster in the early rainfall stage, the flow velocity increased greatly, and the water flow at each control point flowed down to the unsaturated soil along the gravity direction. In the middle and late period of rainfall (6–24 h), the flow velocity at control point 1, control point 3, and control point 4 decreased gradually from 9.97 cm/d to 1.45 cm/d, 18.63 cm/d to 10.57 cm/d, and from 18.74 cm/d to 10.19 cm/d under the condition of no biological retention facilities. The flow velocity at control point 2 gradually increased from 3.52 cm/d to 8.21 cm/d, and meanwhile, the flow at control point 2 changed into upward seepage.
Therefore, in the middle and late stages of rainfall, as the slope surface and the inter-particle pore of soil are gradually filled with water, and the rainfall intensity decreases, the internal seepage velocity of the saturated soil gradually decreases. Under the effect of the seepage field, the rainwater seepage from the subgrade slope gradually concentrates at the foot of the slope, causing the increase in water flow velocity at the foot of the slope and upward seepage. After the end of the rainfall (24–48 h), the flow velocity of all control points gradually decreases and approaches zero. Among them, the time required for control point 2 to reduce the flow rate to 0 is longer than that of other control points due to the concentration of rainwater.
Compared with the point without bioretention facility, the changing trend of water flow velocity and direction at the point with bioretention facility is the same, and the flow velocity increases in different degrees. At the beginning of rain, the difference between the flow velocity of each control point under the two conditions is small, indicating that the rainwater seepage of the bioretention facility at the initial stage of rainfall has little effect on the water flow velocity inside the subgrade slope soil. In the middle and late periods of rain, when there is a bioretention facility, the flow velocity at point 2 increased from 2.88 cm/d to 13.93 cm/d, much higher than that at point 1, point 3, and point 4. It shows that the rainwater seepage in the bioretention facility is concentrated at the foot of the slope through the seepage field and generates a greater flow velocity. In addition, the increased value of control point 3 is the same as that of control point 4, indicating that the impact of rainwater from the bioretention facility on the flow velocity of the soil under the pavement and the roadway is the same.
3.3. Influence of Bioretention on Slope Displacement
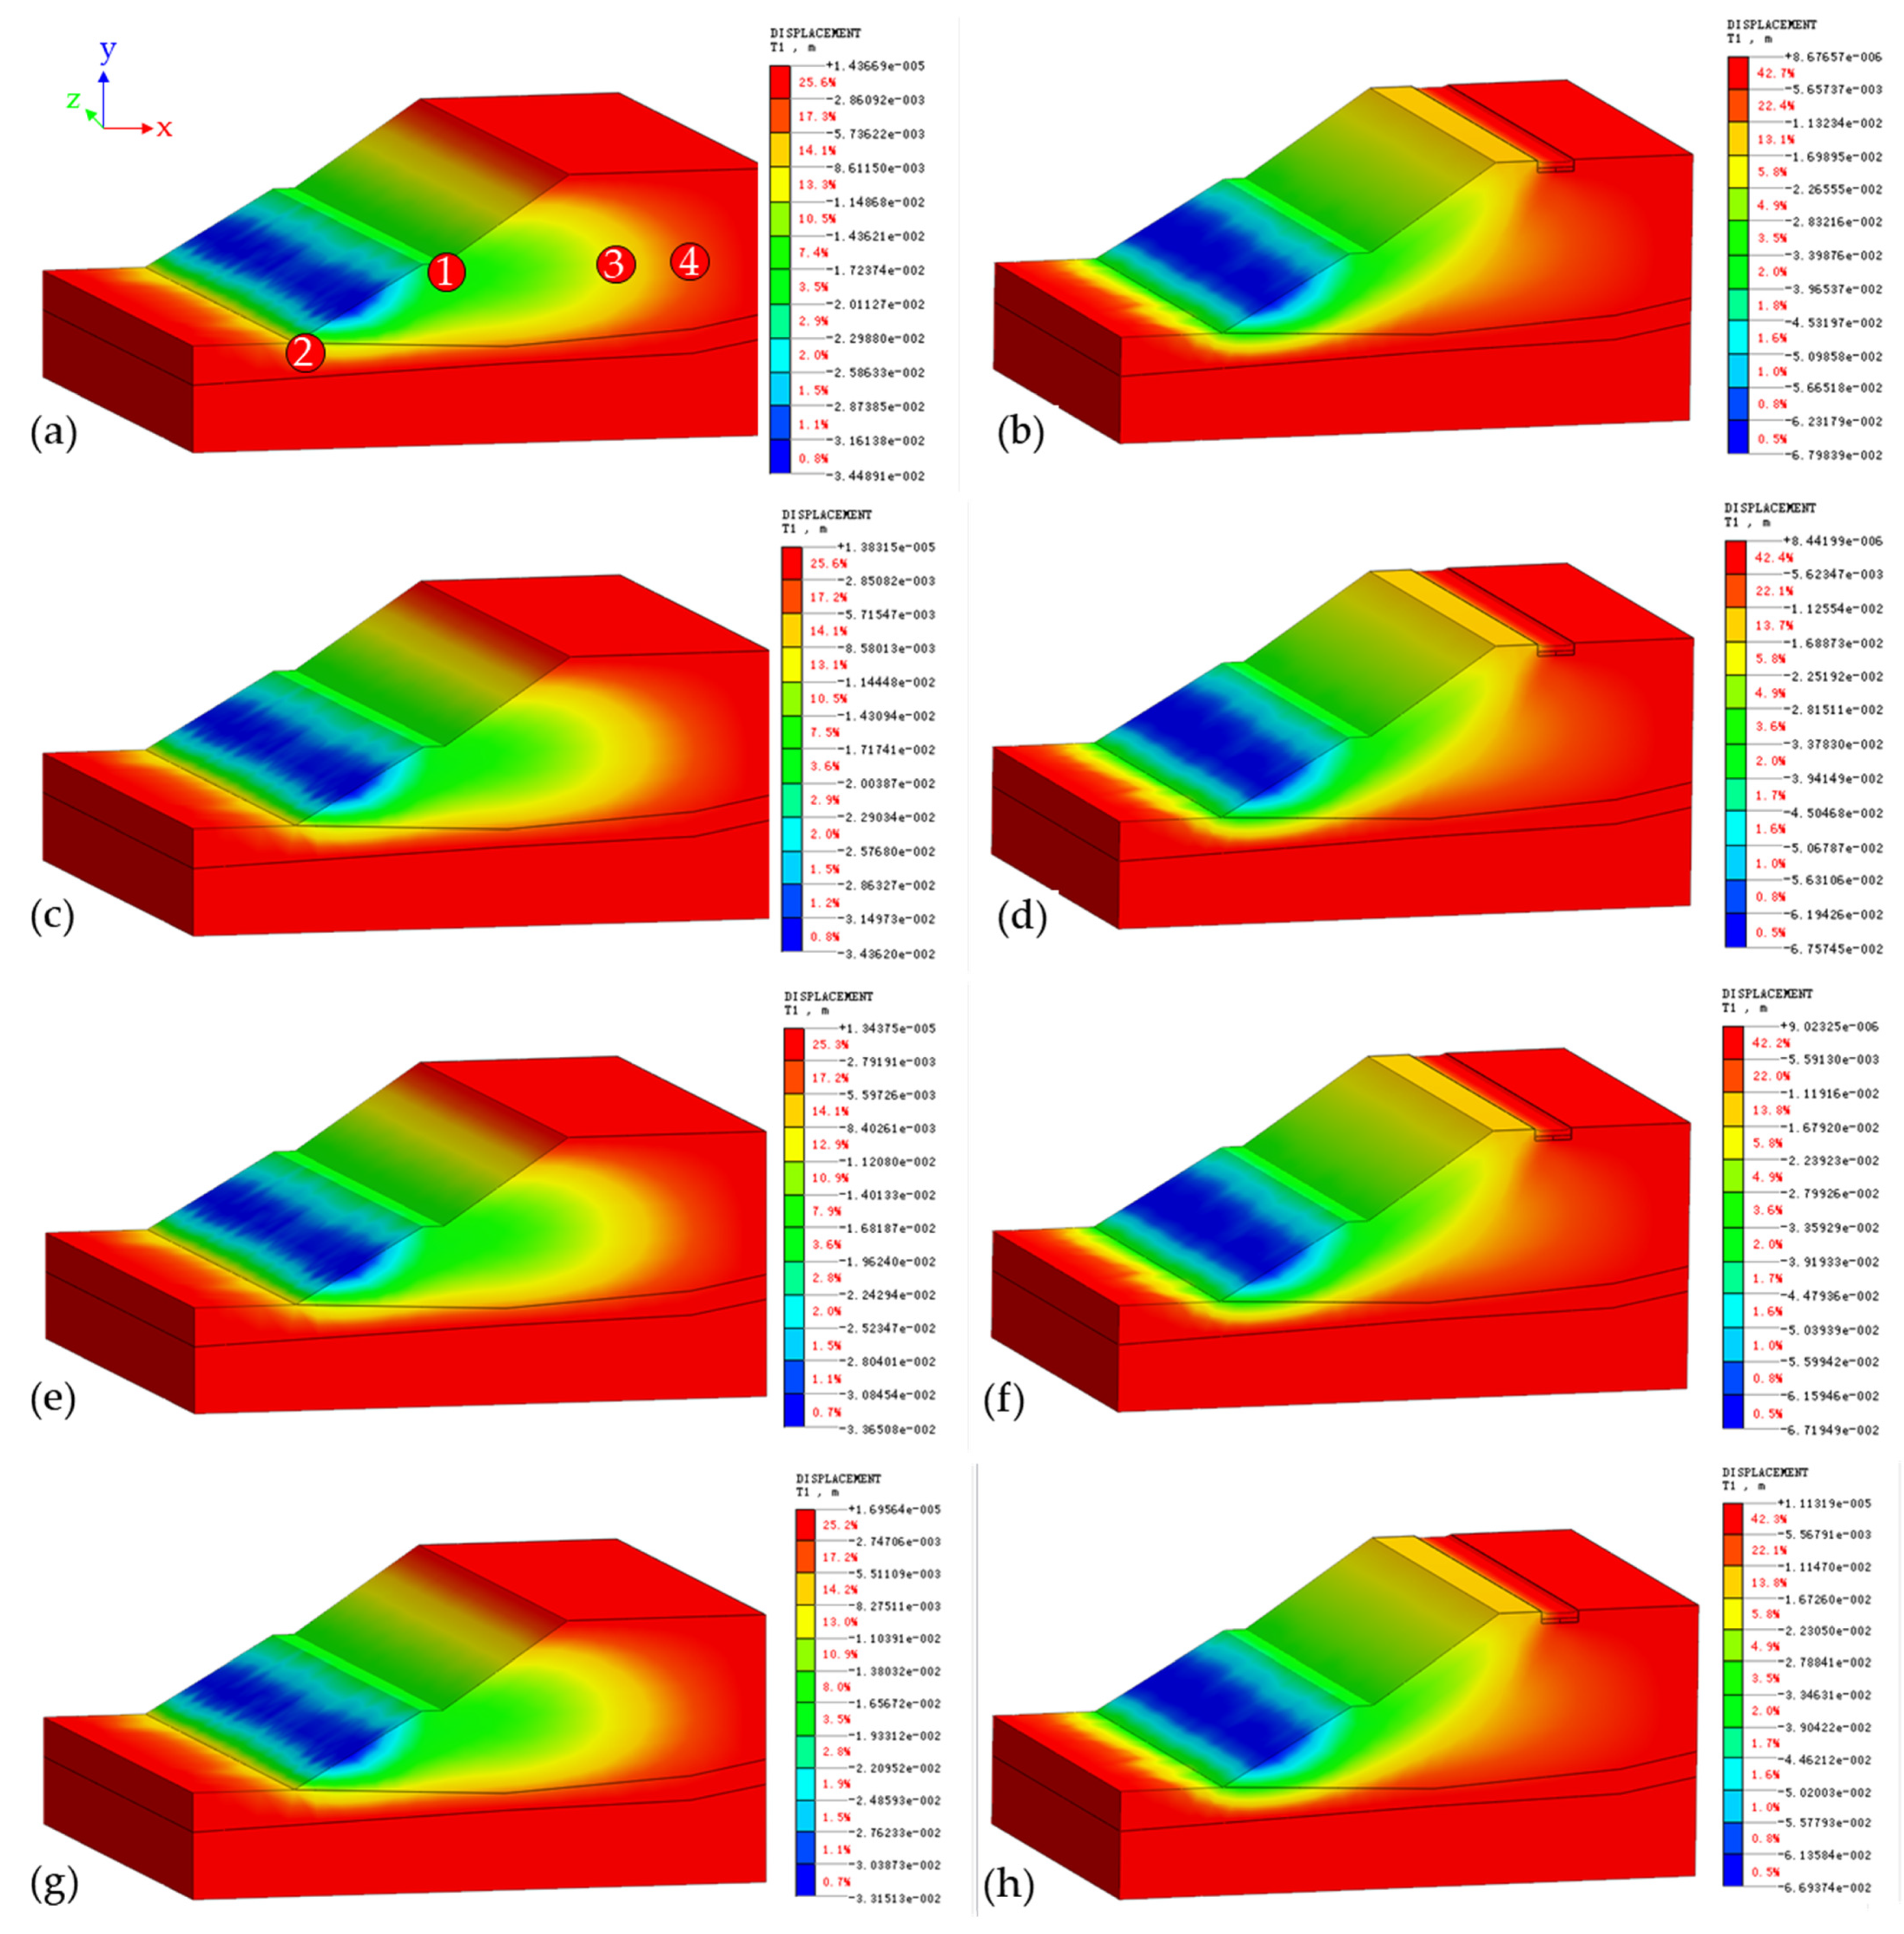
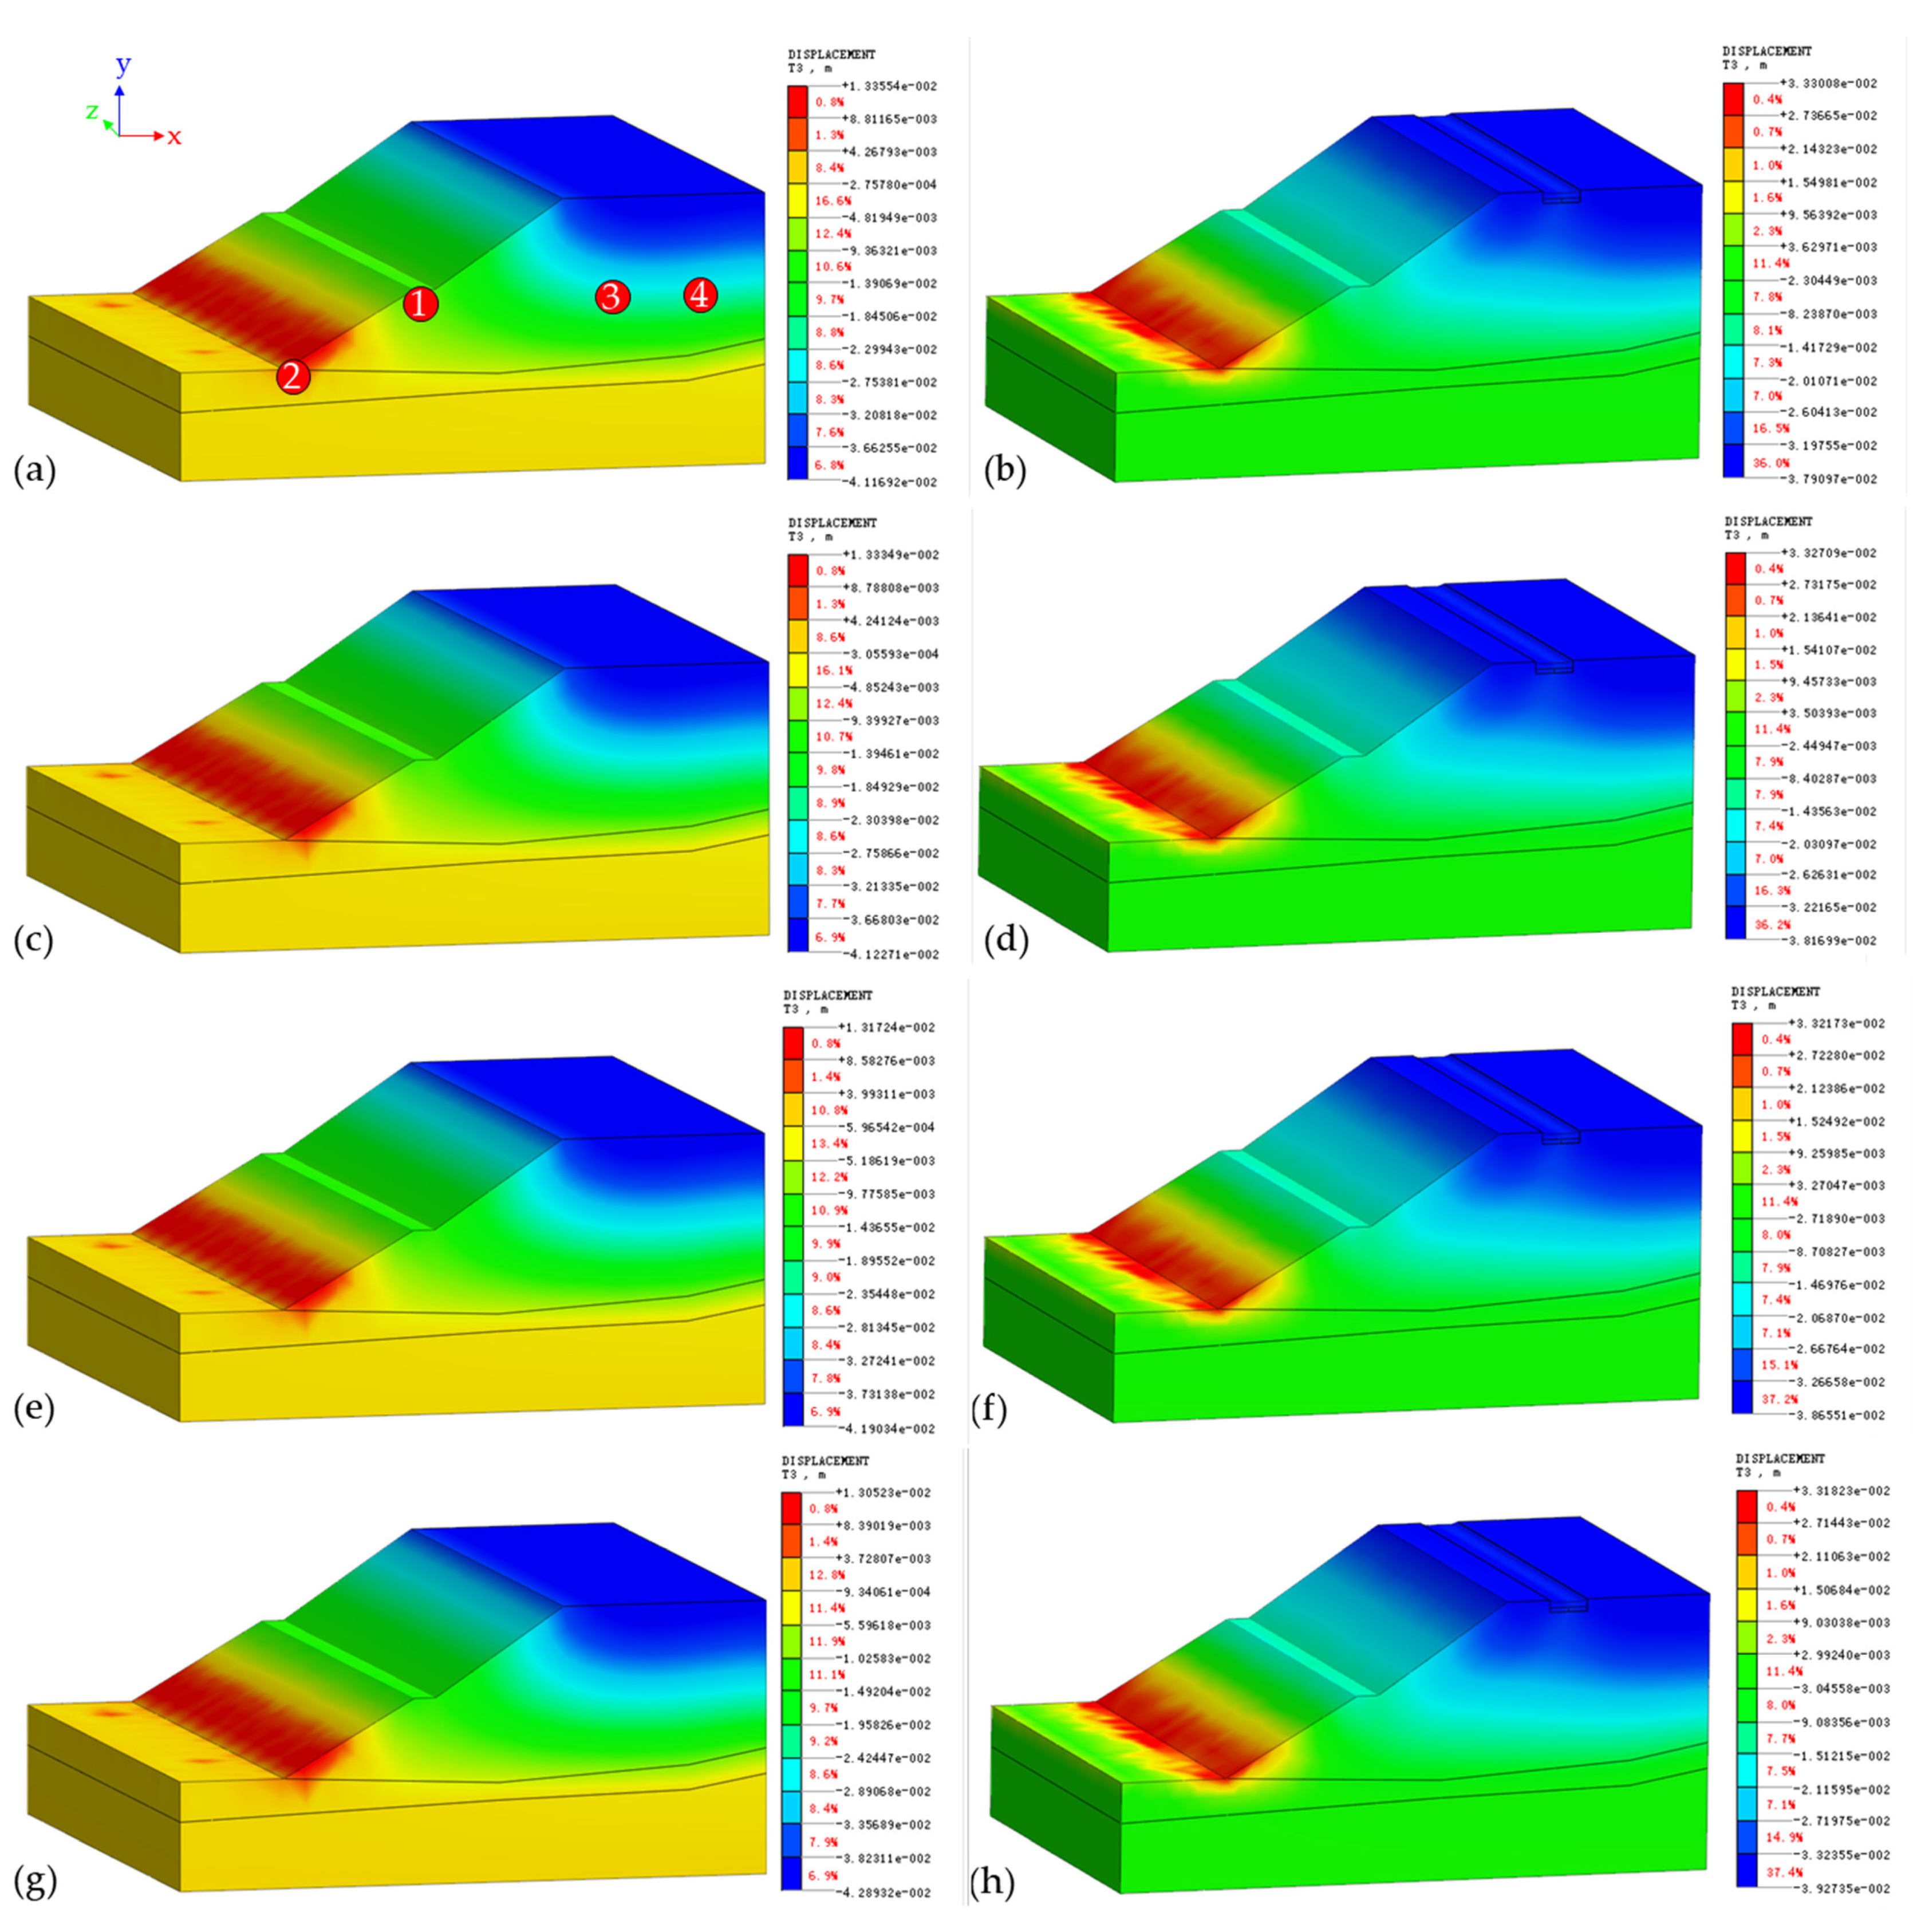
Figure 9 and Figure 10 show the horizontal and the vertical displacement distribution of the subgrade slope within 48 h after rainfall without and with bioretention facilities.
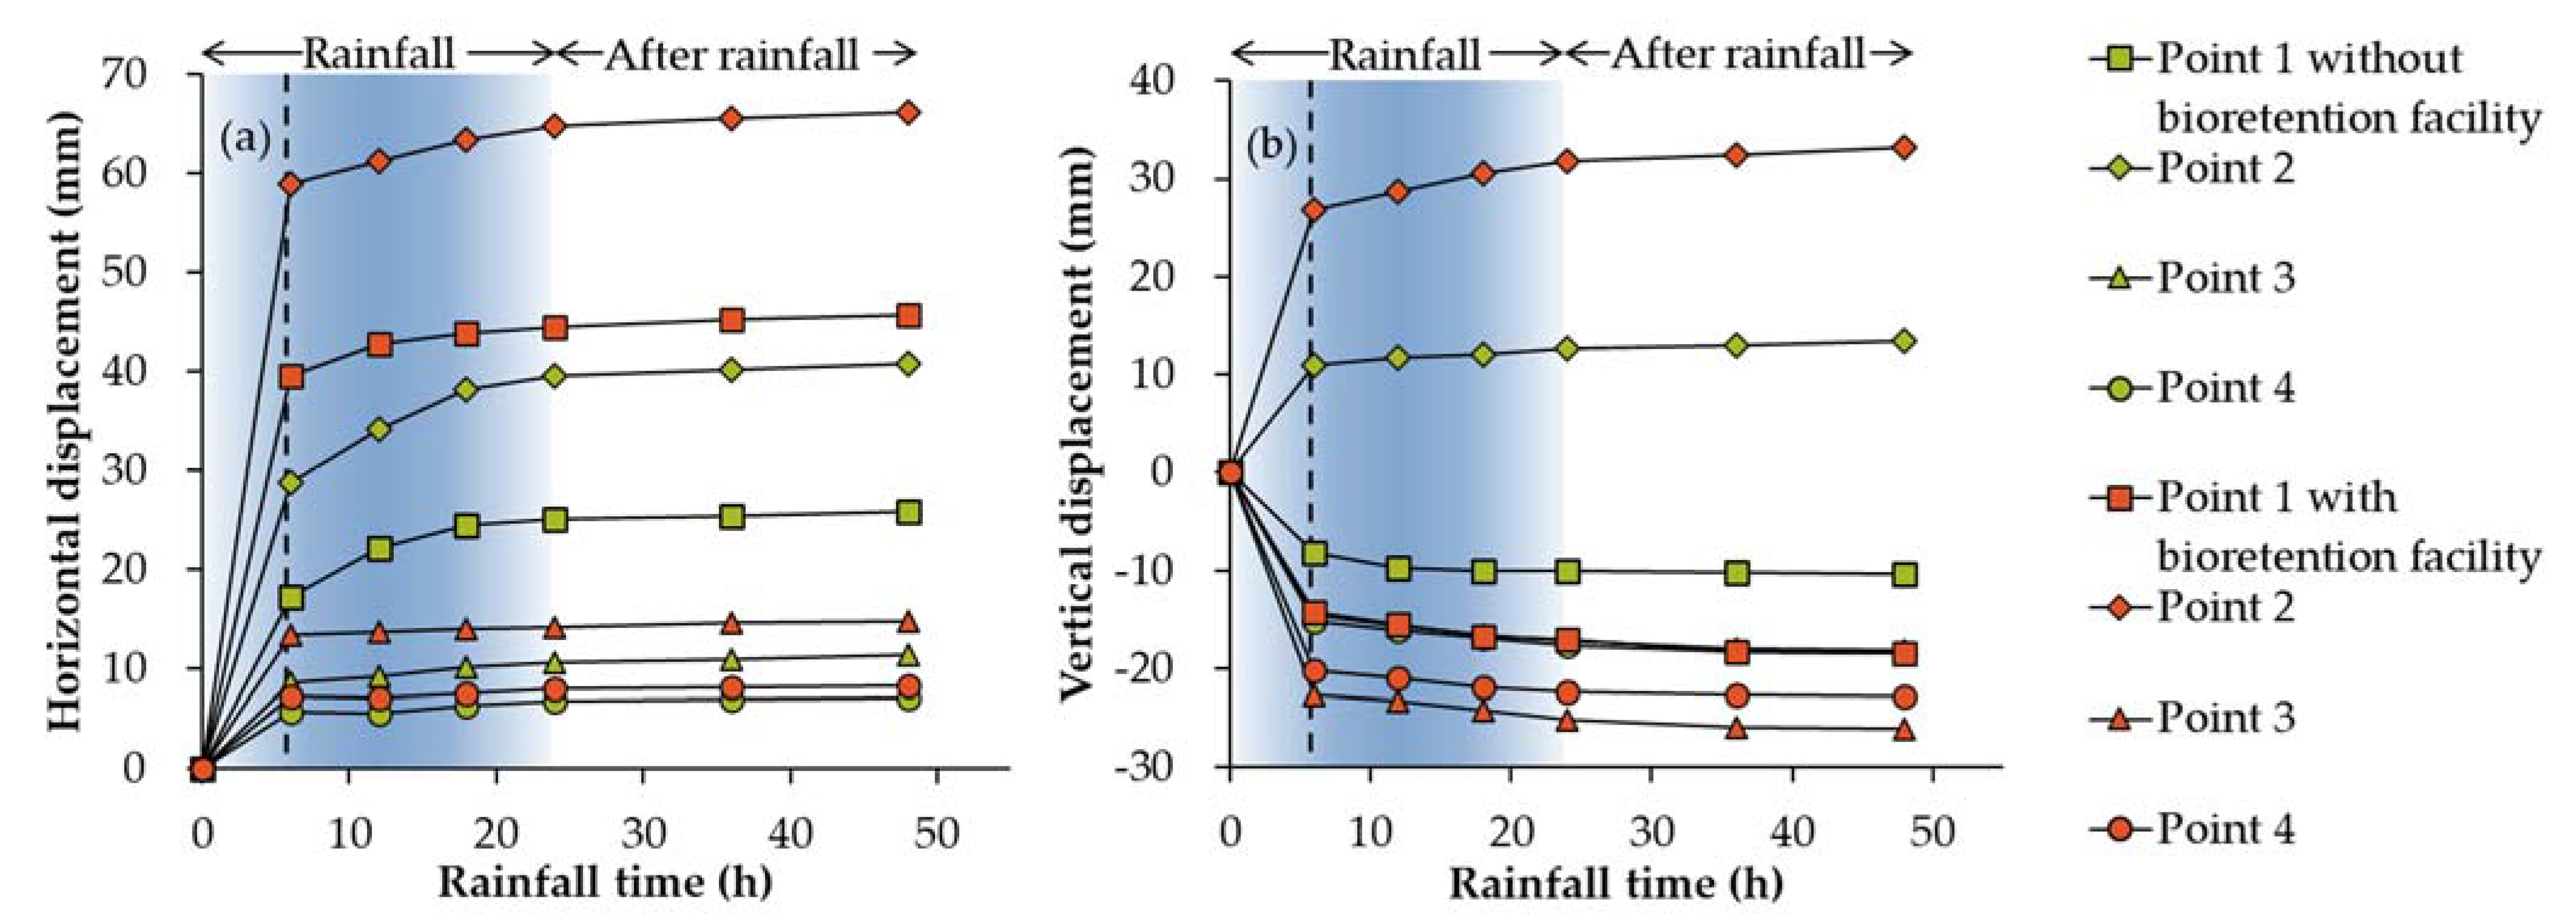
Figure 11 shows the horizontal and vertical displacement curves of different control points. In Figure 11, the positive value represents the upward displacement along the Z-axis, and the negative value represents the downward displacement along the Z-axis. The horizontal displacement of the slope conforms to the dynamic characteristics of the circular slip of the soil slope and is consistent with the displacement trend of the conventional soil slope [30,31]. With the change in rainfall time, the horizontal displacement and vertical displacement at each control point of the subgrade slope gradually increase.
Under the condition without biological retention facilities, the horizontal displacement of control points 1, 2, 3, and 4 is increased to 25.1 mm, 39.5 mm, 10.7 mm, and 6.8 mm, respectively. The increase in control point 1 and control point 2 was higher, indicating that the horizontal direction of the slope and the soil of the slope toe was greatly affected by the rainwater infiltration during the rainfall seepage process, and the horizontal displacement changed greatly. In particular, the slope toe of control point 2 is subjected to stress concentration and gradual rainwater seepage concentration, and the horizontal displacement is greater than that at the slope of control point 1.
At the same time, vertical downward displacement of 10.1 mm, 17.2 mm, and 17.7 mm at control point 1, control point 3, and control point 4 were observed. The vertical displacement of control point 3 and control point 4 is greater than that of control point 1. The results show that under the action of gravity and osmotic force, the pores between soil particles decrease, and the gravity and osmotic force at control point 3 and control point 4 are higher, so the vertical displacement of soil mass changes greatly. The maximum displacement at control point 2 is 12.6 mm, indicating that the slope toe heave occurs under the effect of stress concentration and seepage.
Twenty-four to forty-eight hours after the rain ends, the horizontal and vertical displacements of each control point increased slightly, which suggested that the slope surface and internal soil particles gradually became compacted under the effect of gravity and seepage force, and the variation in soil displacement decreases. The influence of infiltrating rainwater on the displacement of subgrade slope and internal soil gradually weakened.
Compared with the displacement value of the subgrade slope without biological retention facilities, under the condition of biological retention facilities, the changing trend of the horizontal and vertical displacements of each control point is basically the same, and there are different degrees of increase on the basis of the displacement value without biological retention facilities. The maximum horizontal displacement of control point 1 increased from 25.9 mm to 45.6 mm, the maximum vertical displacement increased from 10.4 mm to 18.5 mm. The horizontal displacement of control point 2 increased from 40.8 mm to 66.1 mm, and the vertical displacement increased from 13.5 mm to 33.2 mm. The horizontal displacement of control point 3 increased from 11.4 mm to 14.8 mm, and the vertical displacement of control point 3 increased from 18.1 mm to 26.1 mm. The horizontal displacement of control point 4 increased from 7.05 mm to 8.31 mm, and the vertical displacement increased from 18.4 mm to 22.8 mm. The increased value of the horizontal and vertical displacement of control point 2 was significantly greater than that of other control points. It is proved that the rainwater seepage in the bioretention facility concentrates on the slope foot through the seepage field and produces greater stress concentration at the slope foot, resulting in a greater displacement of the soil at the slope foot. In addition, the increase in displacement at point 3 is the same as that at point 4, which indicates that the influence of rainwater seepage from the bioretention facility on the horizontal and vertical displacement of the soil under the pavement and the roadway is the same.
4. Discussion
Compared with the rainwater infiltration of traditional roads, obvious differences exist in that of sponge cities. Traditional rainwater runoff infiltration is dominated by areal infiltration. Rainwater runoff is scattered throughout the area, and the amount of infiltration rainwater accepted per unit area is small. However, rainwater runoff in the sponge city is dominated by concentrated infiltration in points and strips. Generally, the service area of the bioretention facility is 5–20 times that of itself, and the amount of infiltration water increases significantly. The confluence of traditional rainwater runoff gradually disappears after the rainfall ends, and the infiltration also ends quickly. However, the rainwater runoff centralized infiltration facility in the sponge city can store a large amount of runoff rainwater. After the rainfall is over, the infiltration continues for a certain time. During heavy rain or continuous rainfall, a large amount of rainwater intensively infiltrates the side slope of the roadbed, which changes the key factors such as the distribution of water pressure on the side slope of the roadbed, runoff velocity, and the hydraulic slope. Consequently, the displacement and stress of the slope change, leading to the change in the stability of the subgrade slope.
Combined with the project situation and the above analysis results, the rainwater infiltration from the bioretention facility increases the pore water pressure and flow velocity of soil in the subgrade slope, making the soil easier to reach saturation. In the saturated state, the substrate suction of the soil is significantly weakened, which leads to a rapid decrease in soil cohesion and internal friction angle and a large increase in horizontal and vertical displacement. Especially at the slope foot where the slope stress is concentrated, the uplift and destruction of the foot are more likely to occur, thus having a greater impact on the stability of the slope.
Different rainwater runoff regulation requirements, subgrade compaction degrees, slope heights, and slope ratios in sponge roads all affect the pore water pressure, seepage velocity, and displacement of the subgrade slope. When it is necessary to increase rainwater runoff infiltration of sponge road or change the size and type of filler of bioretention facility, the rainwater seepage in the bioretention facility leads to a larger impact range of the subgrade slope seepage field, higher pore water pressure and water flow velocity, faster saturation state of the roadbed soil, and higher slope displacement. When the compaction of the subgrade increases, the migration of rainwater seepage becomes more difficult, the expansion speed slows down [32], and the impact range of infiltration rainwater in bioretention facility, pore water pressure, flow velocity, and slope displacement is reduced, and vice versa. The higher slope height and steeper slope rate produce greater stress concentration, resulting in a greater displacement of the slope. The infiltration of rainwater brought by the bioretention facility aggravates this phenomenon, which makes the slope displacement larger, and has a more adverse effect on the stability of the slope.
According to the above analysis, with the spread of sponge cities nationwide, the impact of rainwater seepage from biological retention facilities varies in different regions, different geological environments, and different building types. For example, in sandy soil areas with a high soil hydraulic conductivity, rainwater can seep quickly, making the soil difficult to reach a saturated state, and the impact of rainwater seeping in biological retention facilities on subgrade slopes is relatively small [33]. In the loess area with strong water sensitivity, the infiltration of rainwater makes the loess soaked into collapsibility, the soil undergoes substantial settlement and deformation, and the shear strength of the soil decreases rapidly, causing serious instability and damage to the roadbed slope [34]. In addition, when the biological retention facilities are applied to the surrounding sites of the building, it also has an impact on the basic structure of the building. Infiltration of rainwater changes the effective stress of the foundation soil of the building, increases the additional settlement of the foundation, and causes the building to sink or tilt. Therefore, it is necessary to adjust the layout of biological retention facilities according to the requirements of building settlement [35].
5. Conclusions
The bioretention facility in the sponge city can effectively control the runoff of road rainwater and improve the utilization rate of water resources. At the same time, the rainwater seepage path, water pressure distribution, and water flow velocity of the subgrade slope are changed, and the slope displacement is affected. Some key findings are as follows:
- (1)
- Compared with the condition without a bioretention facility, the rainwater seepage from the subgrade slope with a bioretention facility linearly increases the water pressure on the surface and foot of the subgrade slope. At the same time, rainwater seepage makes the soil on the slope, pavement, and roadway saturated, which has a significant impact on the distribution of pore water pressure on the subgrade slope;
- (2)
- In terms of water flow velocity, the bioretention facility at the beginning of rainfall has little effect on the water flow velocity inside the soil of subgrade slope. In the middle and late stages of rainfall, the rainwater seepage through the seepage field is concentrated on the slope foot, which produces a greater flow velocity at the slope foot and is more likely to cause the soil to soften and uplift;
- (3)
- The overall horizontal and vertical displacement of the subgrade slope gradually increases with the increase in rainfall time. The rainwater seepage in the bioretention facility concentrates on the slope foot through the seepage field, which produces greater stress concentration at the slope foot and results in a greater displacement of the soil at the slope foot.
The bioretention facility has an impact on the water pressure distribution, water flow velocity, and displacement of the subgrade slope. In particular, it causes a large uplift displacement at the foot of the slope, which adversely affects the stability of the slope. This study shows that the suitable width, depth, and structural layer of the bioretention facility should be selected to ensure the safety and stability of the subgrade slope in careful consideration of runoff control effect, subgrade compactness, slope height, and slope rate.
Supplementary Materials
The following are available online at https://www.mdpi.com/article/10.3390/w13233466/s1, Figure S1: Initial pore water pressure and water flow rate distribution diagram.
Author Contributions
Conceptualization, W.T. and H.C.; methodology, W.T. and H.C.; software, W.T.; validation, W.T., Z.S., and H.C.; formal analysis, W.T.; investigation, W.T.; resources, W.T. and H.C.; data curation, W.T. and H.M.; writing—original draft preparation, W.T.; writing—review and editing, W.T., H.M., and X.W.; visualization, W.T., X.W., and H.M.; supervision, H.M., Z.S., Q.H., and H.C.; project administration, H.C.; funding acquisition, Z.S. and H.C. All authors have read and agreed to the published version of the manuscript.
Funding
This research was funded by Chongqing Key R&D Program, Chongqing, PR China, grant number cstc2018jszx-zdyfxmX0010, and the support of Creative Research Groups in Colleges and Universities of Chongqing (No. CXQT21001, Water Environment Protection and Management in Mountainous City).
Conflicts of Interest
The authors declare no conflict of interest.
References
- Lee, J.Y.; Kim, H.; Kim, Y.; Han, M.Y. Characteristics of the event mean concentration (EMC) from rainfall runoff on an urban highway. Environ. Pollut. 2011, 159, 884–888. [Google Scholar] [CrossRef] [PubMed]
- Helmreich, B.; Hilliges, R.; Schriewer, A.; Horn, H. Runoff pollutants of a highly trafficked urban road—Correlation analysis and seasonal influences. Chemosphere 2010, 80, 991–997. [Google Scholar] [CrossRef] [PubMed]
- Paus, K.H.; Morgan, J.; Gulliver, J.S.; Hozalski, R.M. Effects of bioretention media compost volume fraction on toxic metals removal, hydraulic conductivity, and phosphorous release. J. Environ. Eng. 2014, 140, 04014033. [Google Scholar] [CrossRef]
- Song, X.; Zhang, J.; Wang, G.; He, R.; Wang, X. Development and challenges of urban hydrology in a changing environment: Ⅱ: Urban stormwater modeling and management. Adv. Water Sci. 2014, 25, 752–764. [Google Scholar]
- Zhang, Q.; Xiangquan, L.; Wang, X.; Wan, W.; Ouyang, Z. Research advance in the characterization and source apportionment of pollutants in urban roadway runoff. Ecol. Environ. Sci. 2014, 2, 352–358. [Google Scholar]
- USEPA. National Water Quality Inventory: Report to Congress; Office of Water Regulations and Standards: Washington, DC, United States, 1994; p. 344. ISBN 32437010554794.
- Dikshit, A.; Loucks, D.P. Estimating Non-Point Pollutant Loadings—I: A Geographical-Information-Based Non-Point Source Simulation Model. J. Environ. Syst. 1996, 24, 395–408. [Google Scholar] [CrossRef]
- Taylor, M.; Henkels, J. Stormwater Best Management Practices: Preparing for the Next Decade. Stormwater 2001, 2, 1–11. [Google Scholar]
- Fletcher, T.D.; Shuster, W.; Hunt, W.F.; Ashley, R.; Butler, D.; Arthur, S.; Trowsdale, S.; Barraud, S.; Semadeni-Davies, A.; Bertrand-Krajewski, J.-L. SUDS, LID, BMPs, WSUD and more–The evolution and application of terminology surrounding urban drainage. Urban Water J. 2015, 12, 525–542. [Google Scholar] [CrossRef]
- Mohurd, P. Sponge City Construction Technical Guide; China Construction Industry Press: Beijing, China, 2015; pp. 1–88. [Google Scholar]
- Zhang, J.; Wang, Y.; Hu, Q.; He, R. Discussion and views on some issues of the sponge city construction in China. Adv. Water Sci. 2016, 27, 793–799. [Google Scholar]
- Sun, X.; Davis, A.P. Heavy metal fates in laboratory bioretention systems. Chemosphere 2007, 66, 1601–1609. [Google Scholar] [CrossRef]
- Mangangka, I.R.; Liu, A.; Egodawatta, P.; Goonetilleke, A. Performance characterisation of a stormwater treatment bioretention basin. J. Environ. Manag. 2015, 150, 173–178. [Google Scholar] [CrossRef] [PubMed] [Green Version]
- Gülbaz, S.; Kazezyılmaz-Alhan, C.M. Experimental investigation on hydrologic performance of LID with rainfall-watershed-bioretention system. J. Hydrol. Eng. 2017, 22, D4016003. [Google Scholar] [CrossRef]
- Davis, A.P.; Shokouhian, M.; Sharma, H.; Minami, C.; Winogradoff, D. Water quality improvement through bioretention: Lead, copper, and zinc removal. Water Environ. Res. 2003, 75, 73–82. [Google Scholar] [CrossRef]
- Hunt, W.; Smith, J.; Jadlocki, S.; Hathaway, J.; Eubanks, P. Pollutant removal and peak flow mitigation by a bioretention cell in urban Charlotte, NC. J. Environ. Eng. 2008, 134, 403–408. [Google Scholar] [CrossRef]
- Hatt, B.E.; Fletcher, T.D.; Deletic, A. Hydrologic and pollutant removal performance of stormwater biofiltration systems at the field scale. J. Hydrol. 2009, 365, 310–321. [Google Scholar] [CrossRef]
- Stanković, S.M. Blue green component and integrated urban design. Tehnika 2016, 71, 365–371. [Google Scholar] [CrossRef] [Green Version]
- Liang, H.-H.; Li, X.-L.; Zhang, X.; Ma, Y.; Ji, G.-Q.; Hu, Z.-P.; Lu, Y.-N. Optimization Analysis of Rainwater Infiltration in Bioretention Zone near Municipal Roads. China Water Wastewater 2020, 36, 107–112. [Google Scholar]
- Meng, Y.; Wang, H.; Zhang, S.; Chen, J. Experiments on detention, retention and purifying effects of urban road runoff based on bioretention. J. Beijing Norm. Univ. (Nat. Sci.) 2013, 49, 286–291. [Google Scholar]
- Pan, G.; Xia, J.; Zhang, X.; Wang, H.; Liu, E. Research on simulation test of hydrological effect of bioretention units. Water Resour. Power 2012, 30, 13–15. [Google Scholar]
- Lin, H.-c.; Yu, Y.-z.; Li, G.; Peng, J. Influence of rainfall characteristics on soil slope failure. Chin. J. Rock Mech. Eng. 2009, 28, 198–204. [Google Scholar]
- Pradel, D.; Raad, G. Effect of permeability on surficial stability of homogeneous slopes. J. Geotech. Eng. 1993, 119, 315–332. [Google Scholar] [CrossRef]
- Ng, C.W.W.; Shi, Q. A numerical investigation of the stability of unsaturated soil slopes subjected to transient seepage. Comput. Geotech. 1998, 22, 1–28. [Google Scholar] [CrossRef]
- Sun, Q.; Hu, X.; Wang, Y.; Li, M. Research on instability of slope composed of two strain-softening media. Rock Soil Mech. 2009, 30, 976–980. [Google Scholar]
- Darcy, H. Determination of the laws of water flow through sand. Public Fountains City Dijon Append. D Filtr. Victor Dalmont Paris 1856, 1, 1–10. [Google Scholar]
- Richards, L.A. Capillary conduction of liquids through porous mediums. Physics 1931, 1, 318–333. [Google Scholar] [CrossRef]
- Guan, J.; Lyu, Y.; Zhao, G. Ecological Restoration and Slope Stability Analysis of Slag Discharge Site on the North Side of Yumen River. Min. Res. Dev. 2021, 41, 90–94. [Google Scholar]
- Zhao, J.; Lin, J.; Gong, H.; Zheng, X. Effect of Biological Retention Ditch on Water Distribution in Subgrade of Sponge City. Sci. Technol. Eng. 2018, 18, 239–245. [Google Scholar]
- Fredlund, D.G.; Krahn, J. Comparison of slope stability methods of analysis. Can. Geotech. J. 1977, 14, 429–439. [Google Scholar] [CrossRef]
- Chugh, A.K. Variable interslice force inclination in slope stability analysis. Soils Found. 1986, 26, 115–121. [Google Scholar] [CrossRef] [Green Version]
- Liu, Z. The Evolution of Highway Subgrade Humidity Field in Western Arid and Semi Arid Regions; China University of Mining and Technology: Xuzhou, China, 2012; pp. 1–146. [Google Scholar]
- Zhang, J.; Zhang, S.; Shuai, P.; Ji, Y. Lateral Seepage Prevention Study of Sinking-Mode Greenbelt Based on Fluid-Solid Coupling. China Munic. Eng. 2017, 1, 85–88. [Google Scholar]
- Wang, Q.; Li, X.; Zhang, X.; Wang, S. Risk Analysis of Leakage Location of Bioretention Zone in Municipal Roads. Sci. Technol. Eng. 2019, 19, 321–326. [Google Scholar]
- Deng, Z.; Wen, X.; Hu, Z.; Chai, S.; Ma, Y.; Ji, G. Impact of Leakage of Sponge Facilities on Building at Loess Site in Xixian New Area of Shaanxi Province, China. J. Earth Sci. Environ. 2020, 42, 560–568. [Google Scholar]
Figure 1.
Cross-sectional view of road bioretention.

Figure 2.
Finite element mesh model used in this study, 1–4 in the figure indicates the control points in the model.
Figure 2.
Finite element mesh model used in this study, 1–4 in the figure indicates the control points in the model.

Figure 3.
Rainfall intensity over time.
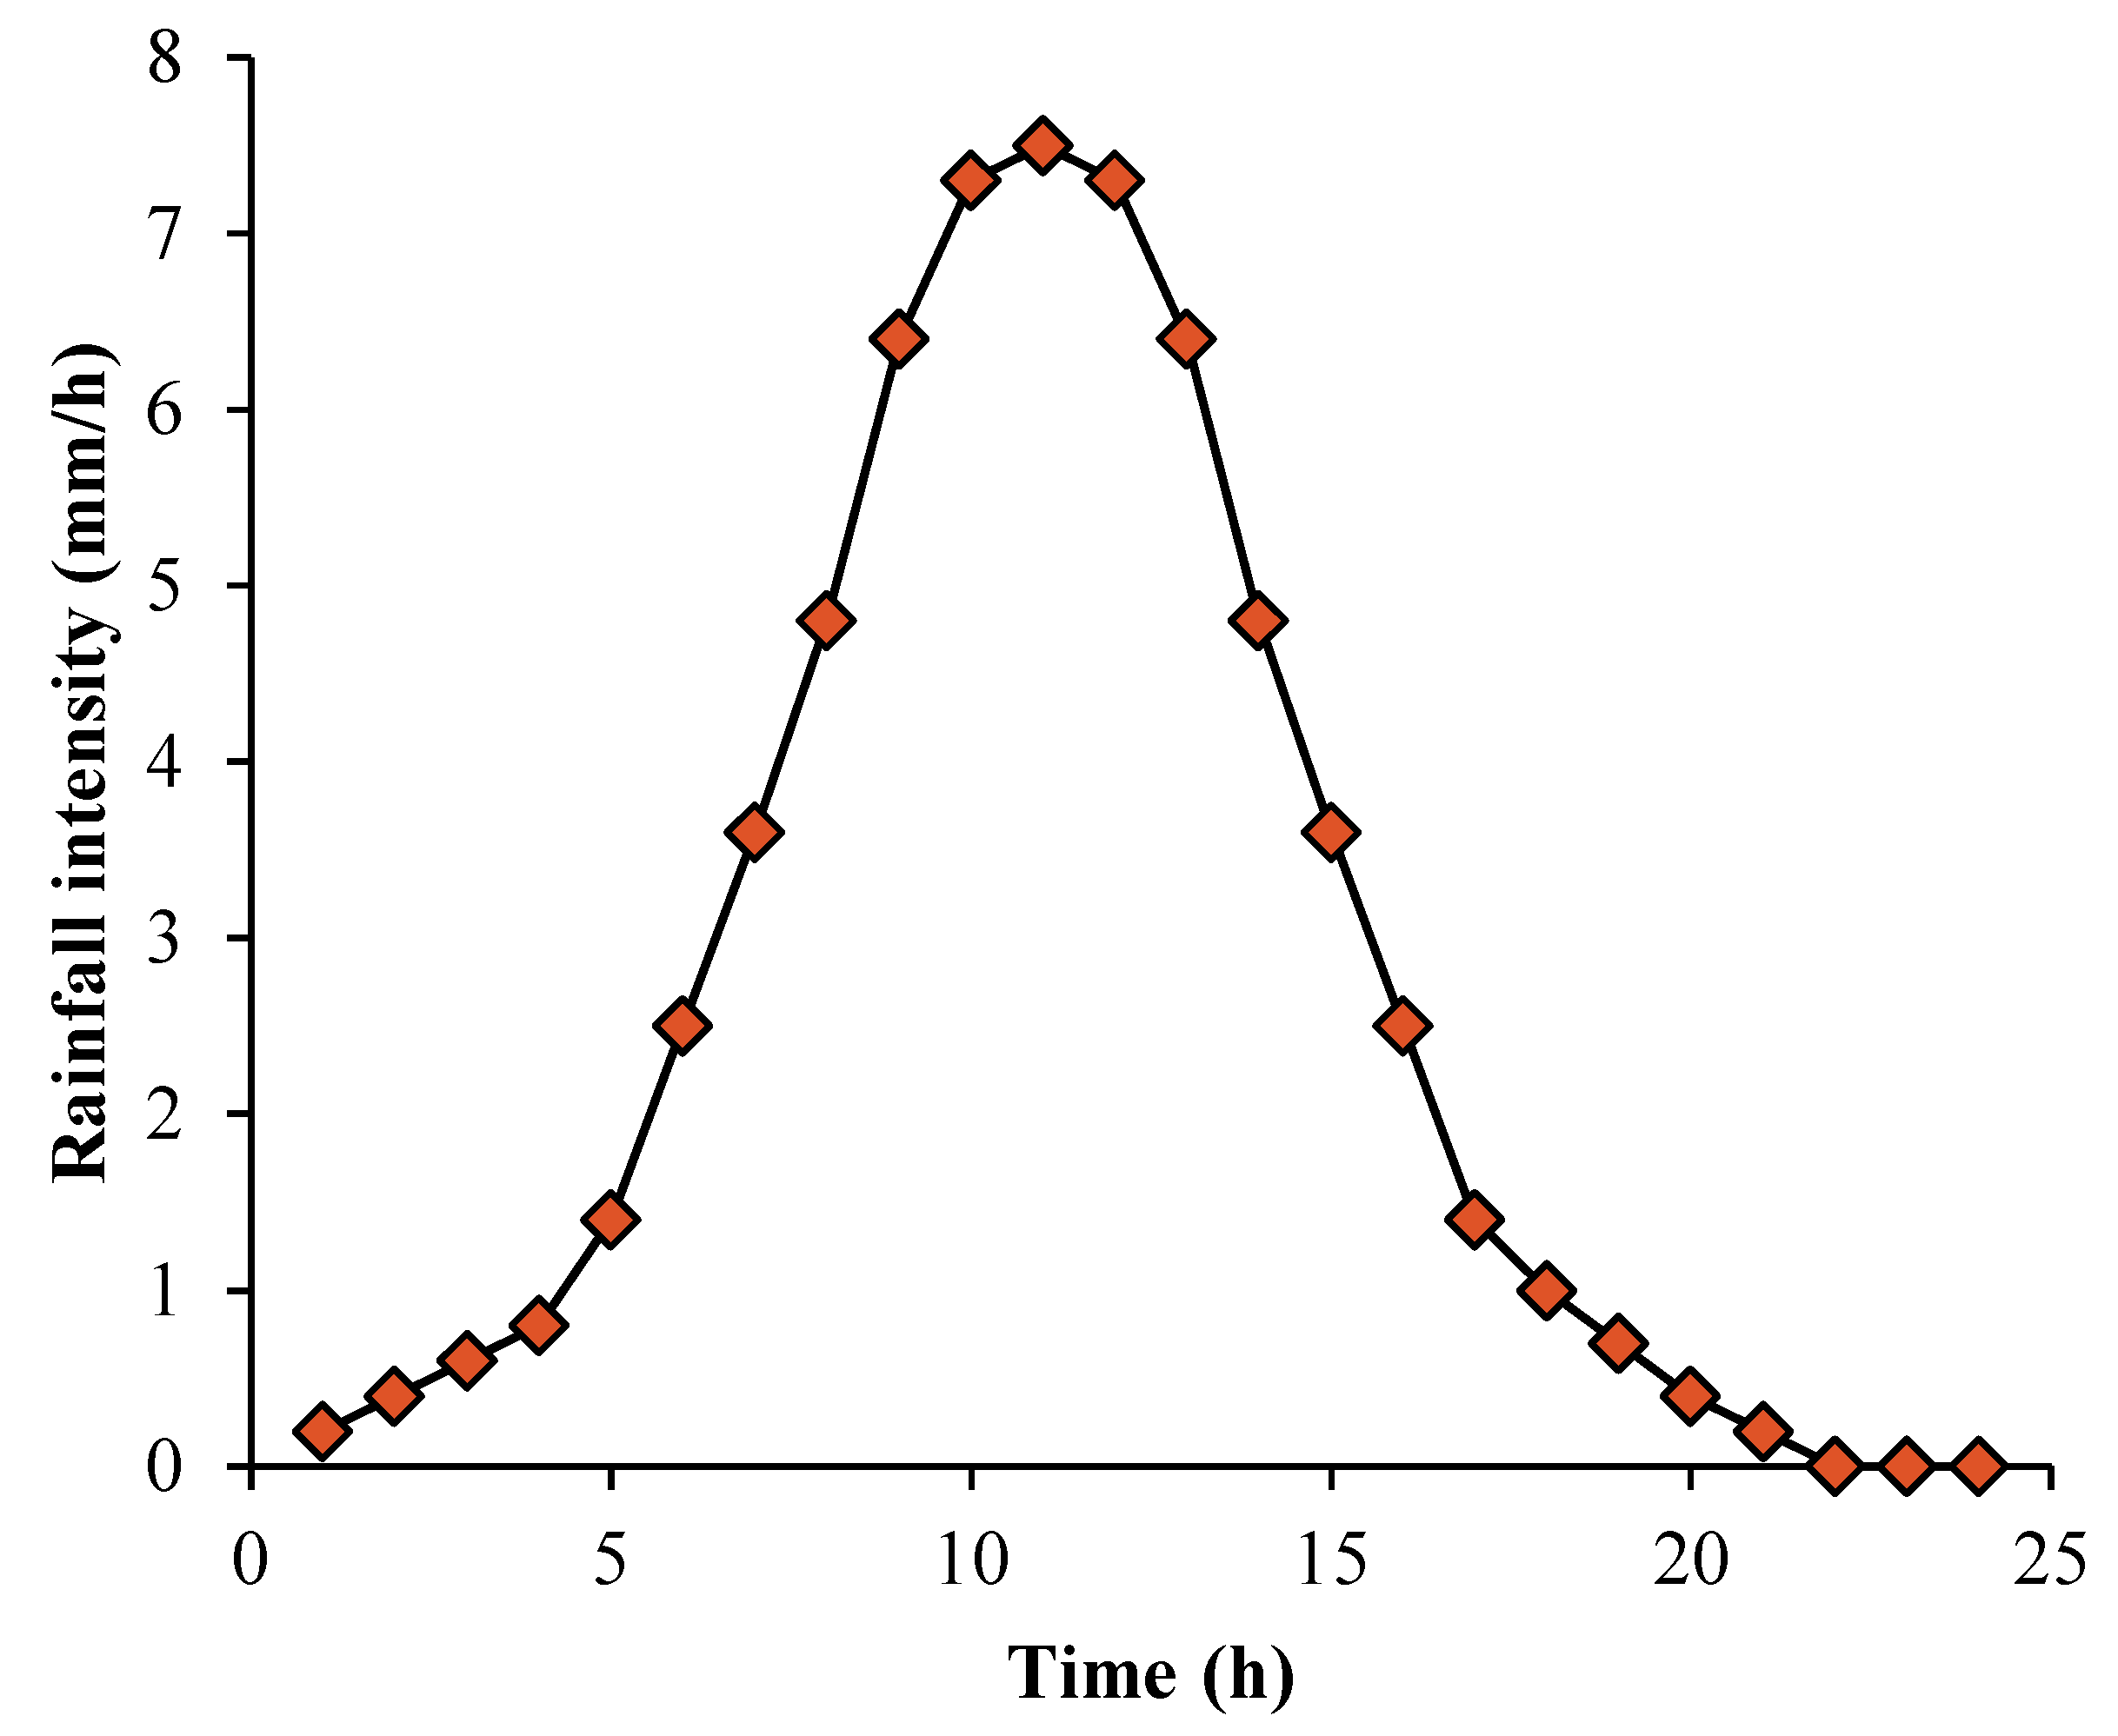
Figure 4.
Hydraulic conductivity (a) and soil-water characteristic (b) curves of different materials.
Figure 4.
Hydraulic conductivity (a) and soil-water characteristic (b) curves of different materials.

Figure 5.
Comparison of water pressure distribution on subgrade slopes without or with biological retention facilities within 48 h after rainfall: (a,b) 6 h; (c,d) 12 h; (e,f) 24 h; (g,h) 48 h.
Figure 5.
Comparison of water pressure distribution on subgrade slopes without or with biological retention facilities within 48 h after rainfall: (a,b) 6 h; (c,d) 12 h; (e,f) 24 h; (g,h) 48 h.
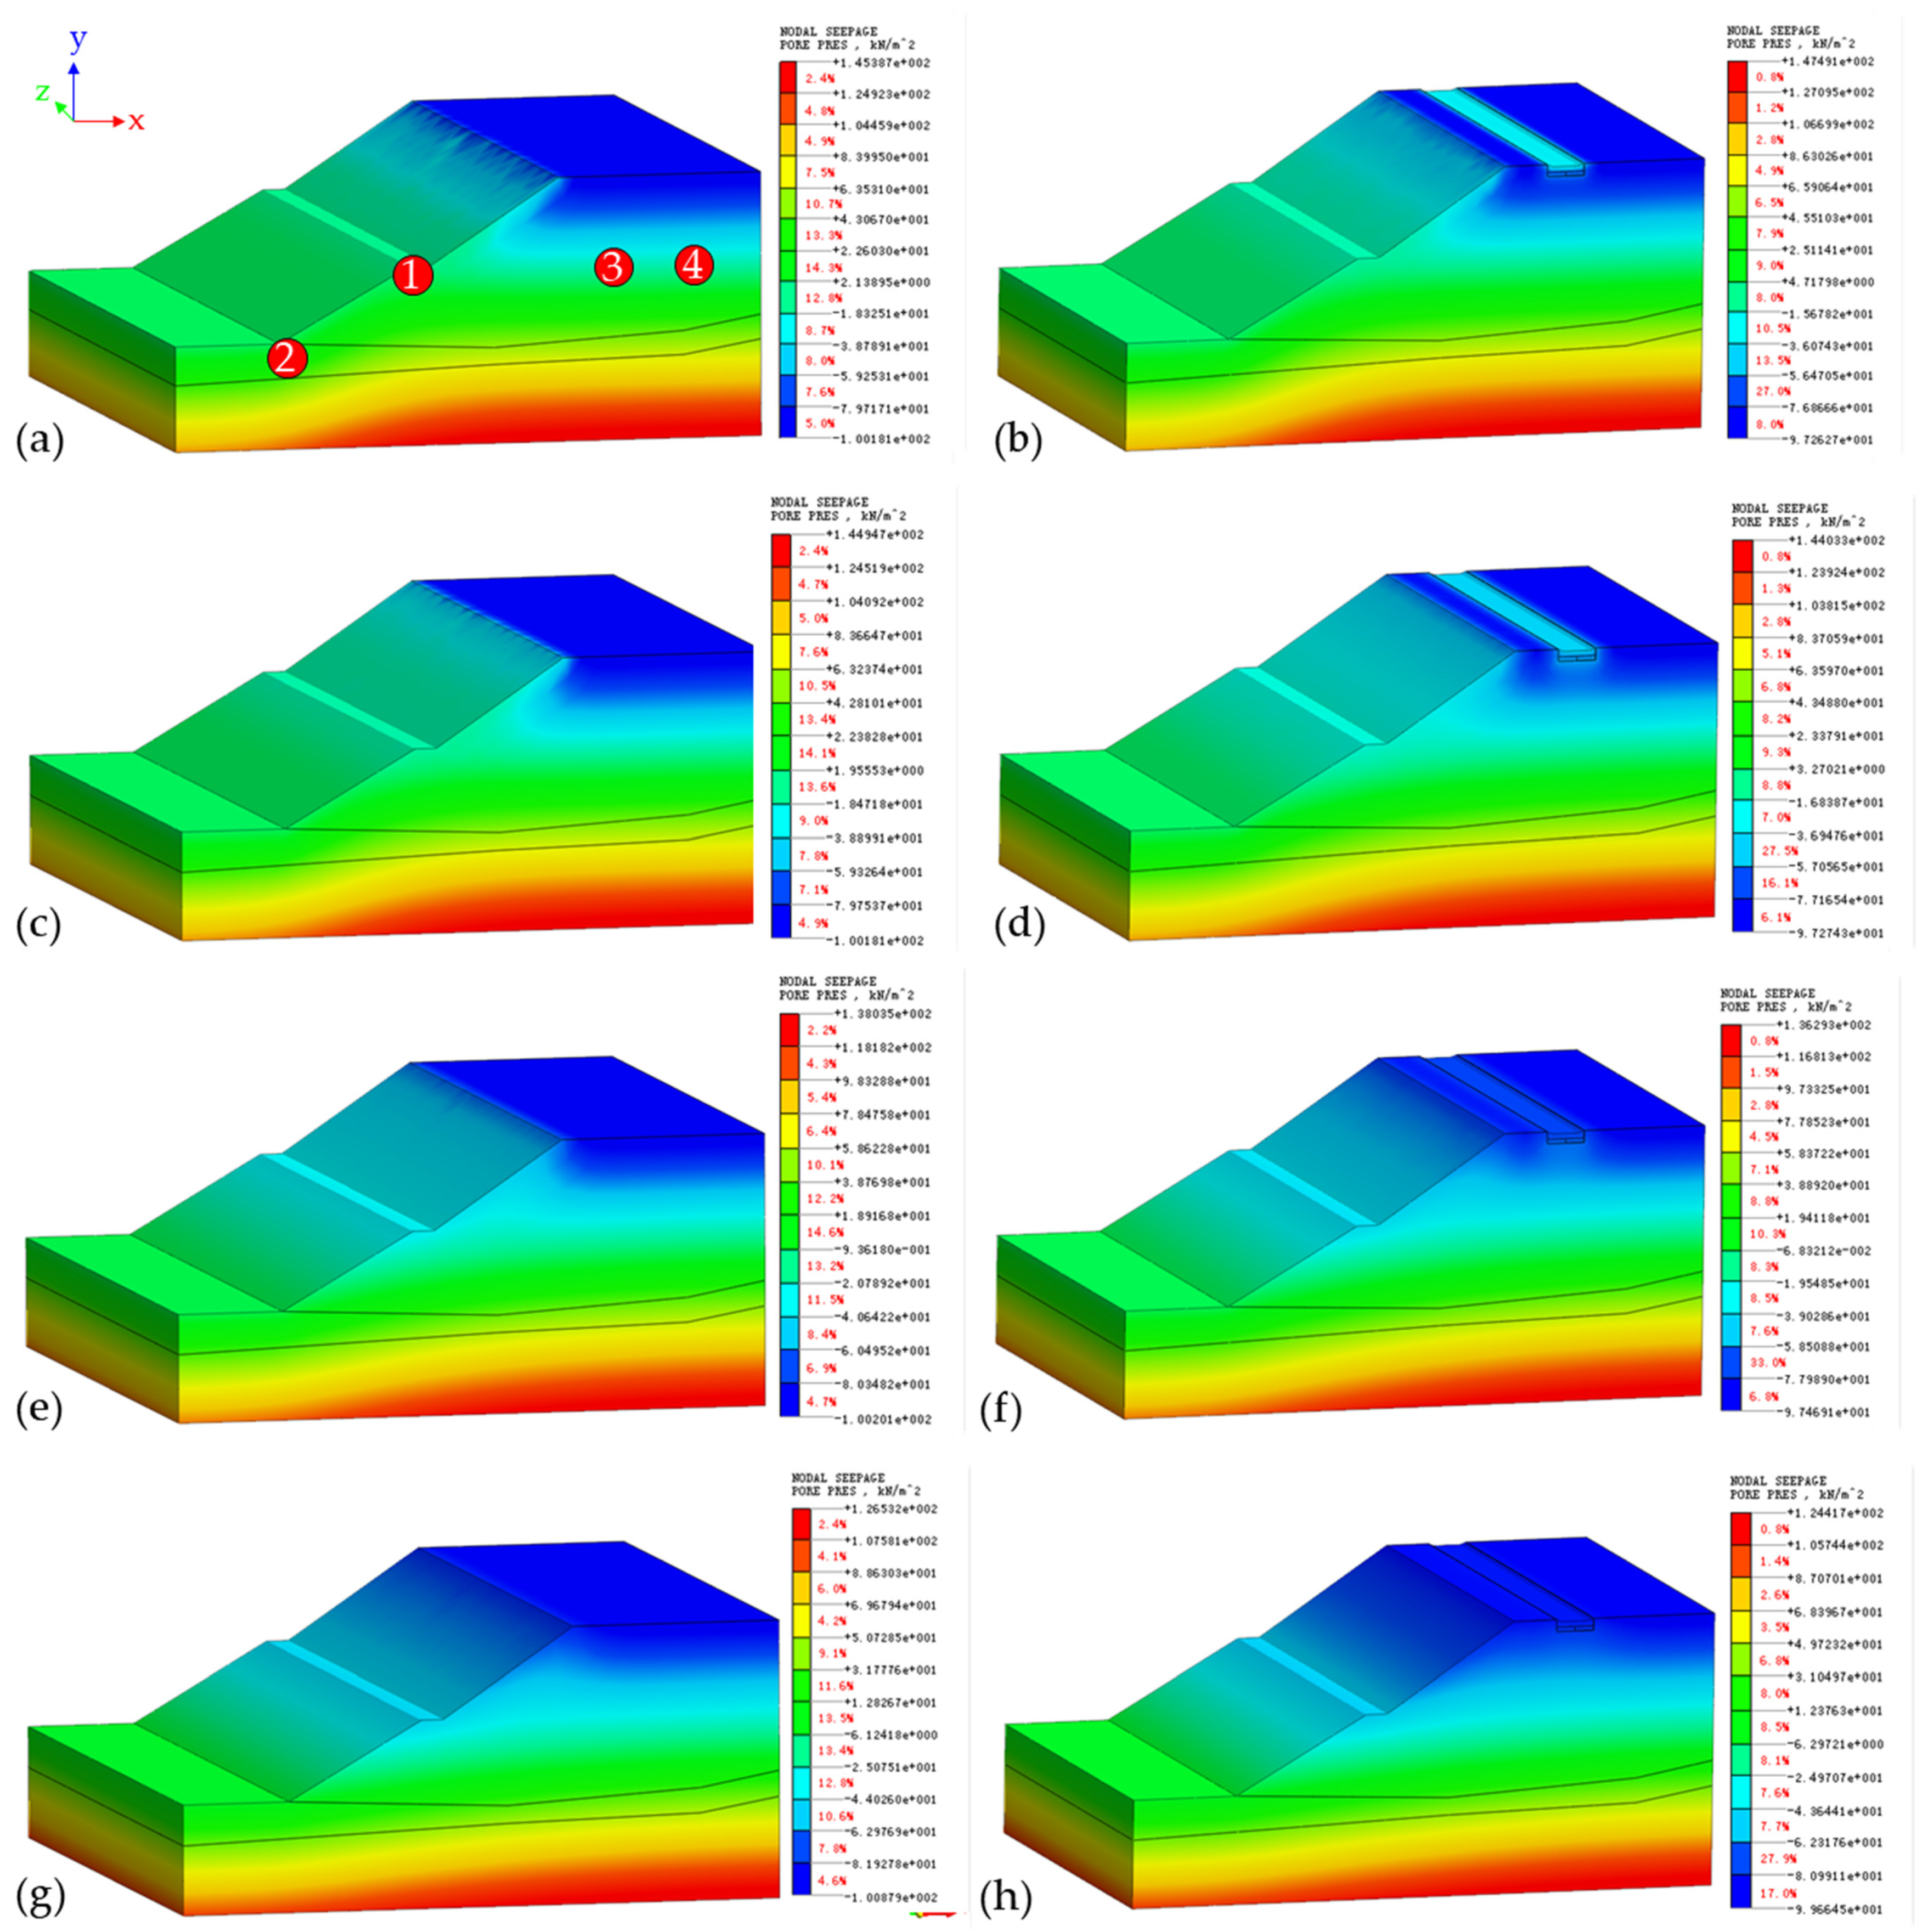
Figure 6.
Pore water pressure curves of different control points.

Figure 7.
Comparison of water flow rate distribution in subgrade slopes without or with biological retention facilities within 48 h after rainfall: (a,b) 6 h; (c,d) 12 h; (e,f) 24 h; (g,h) 48 h.
Figure 7.
Comparison of water flow rate distribution in subgrade slopes without or with biological retention facilities within 48 h after rainfall: (a,b) 6 h; (c,d) 12 h; (e,f) 24 h; (g,h) 48 h.
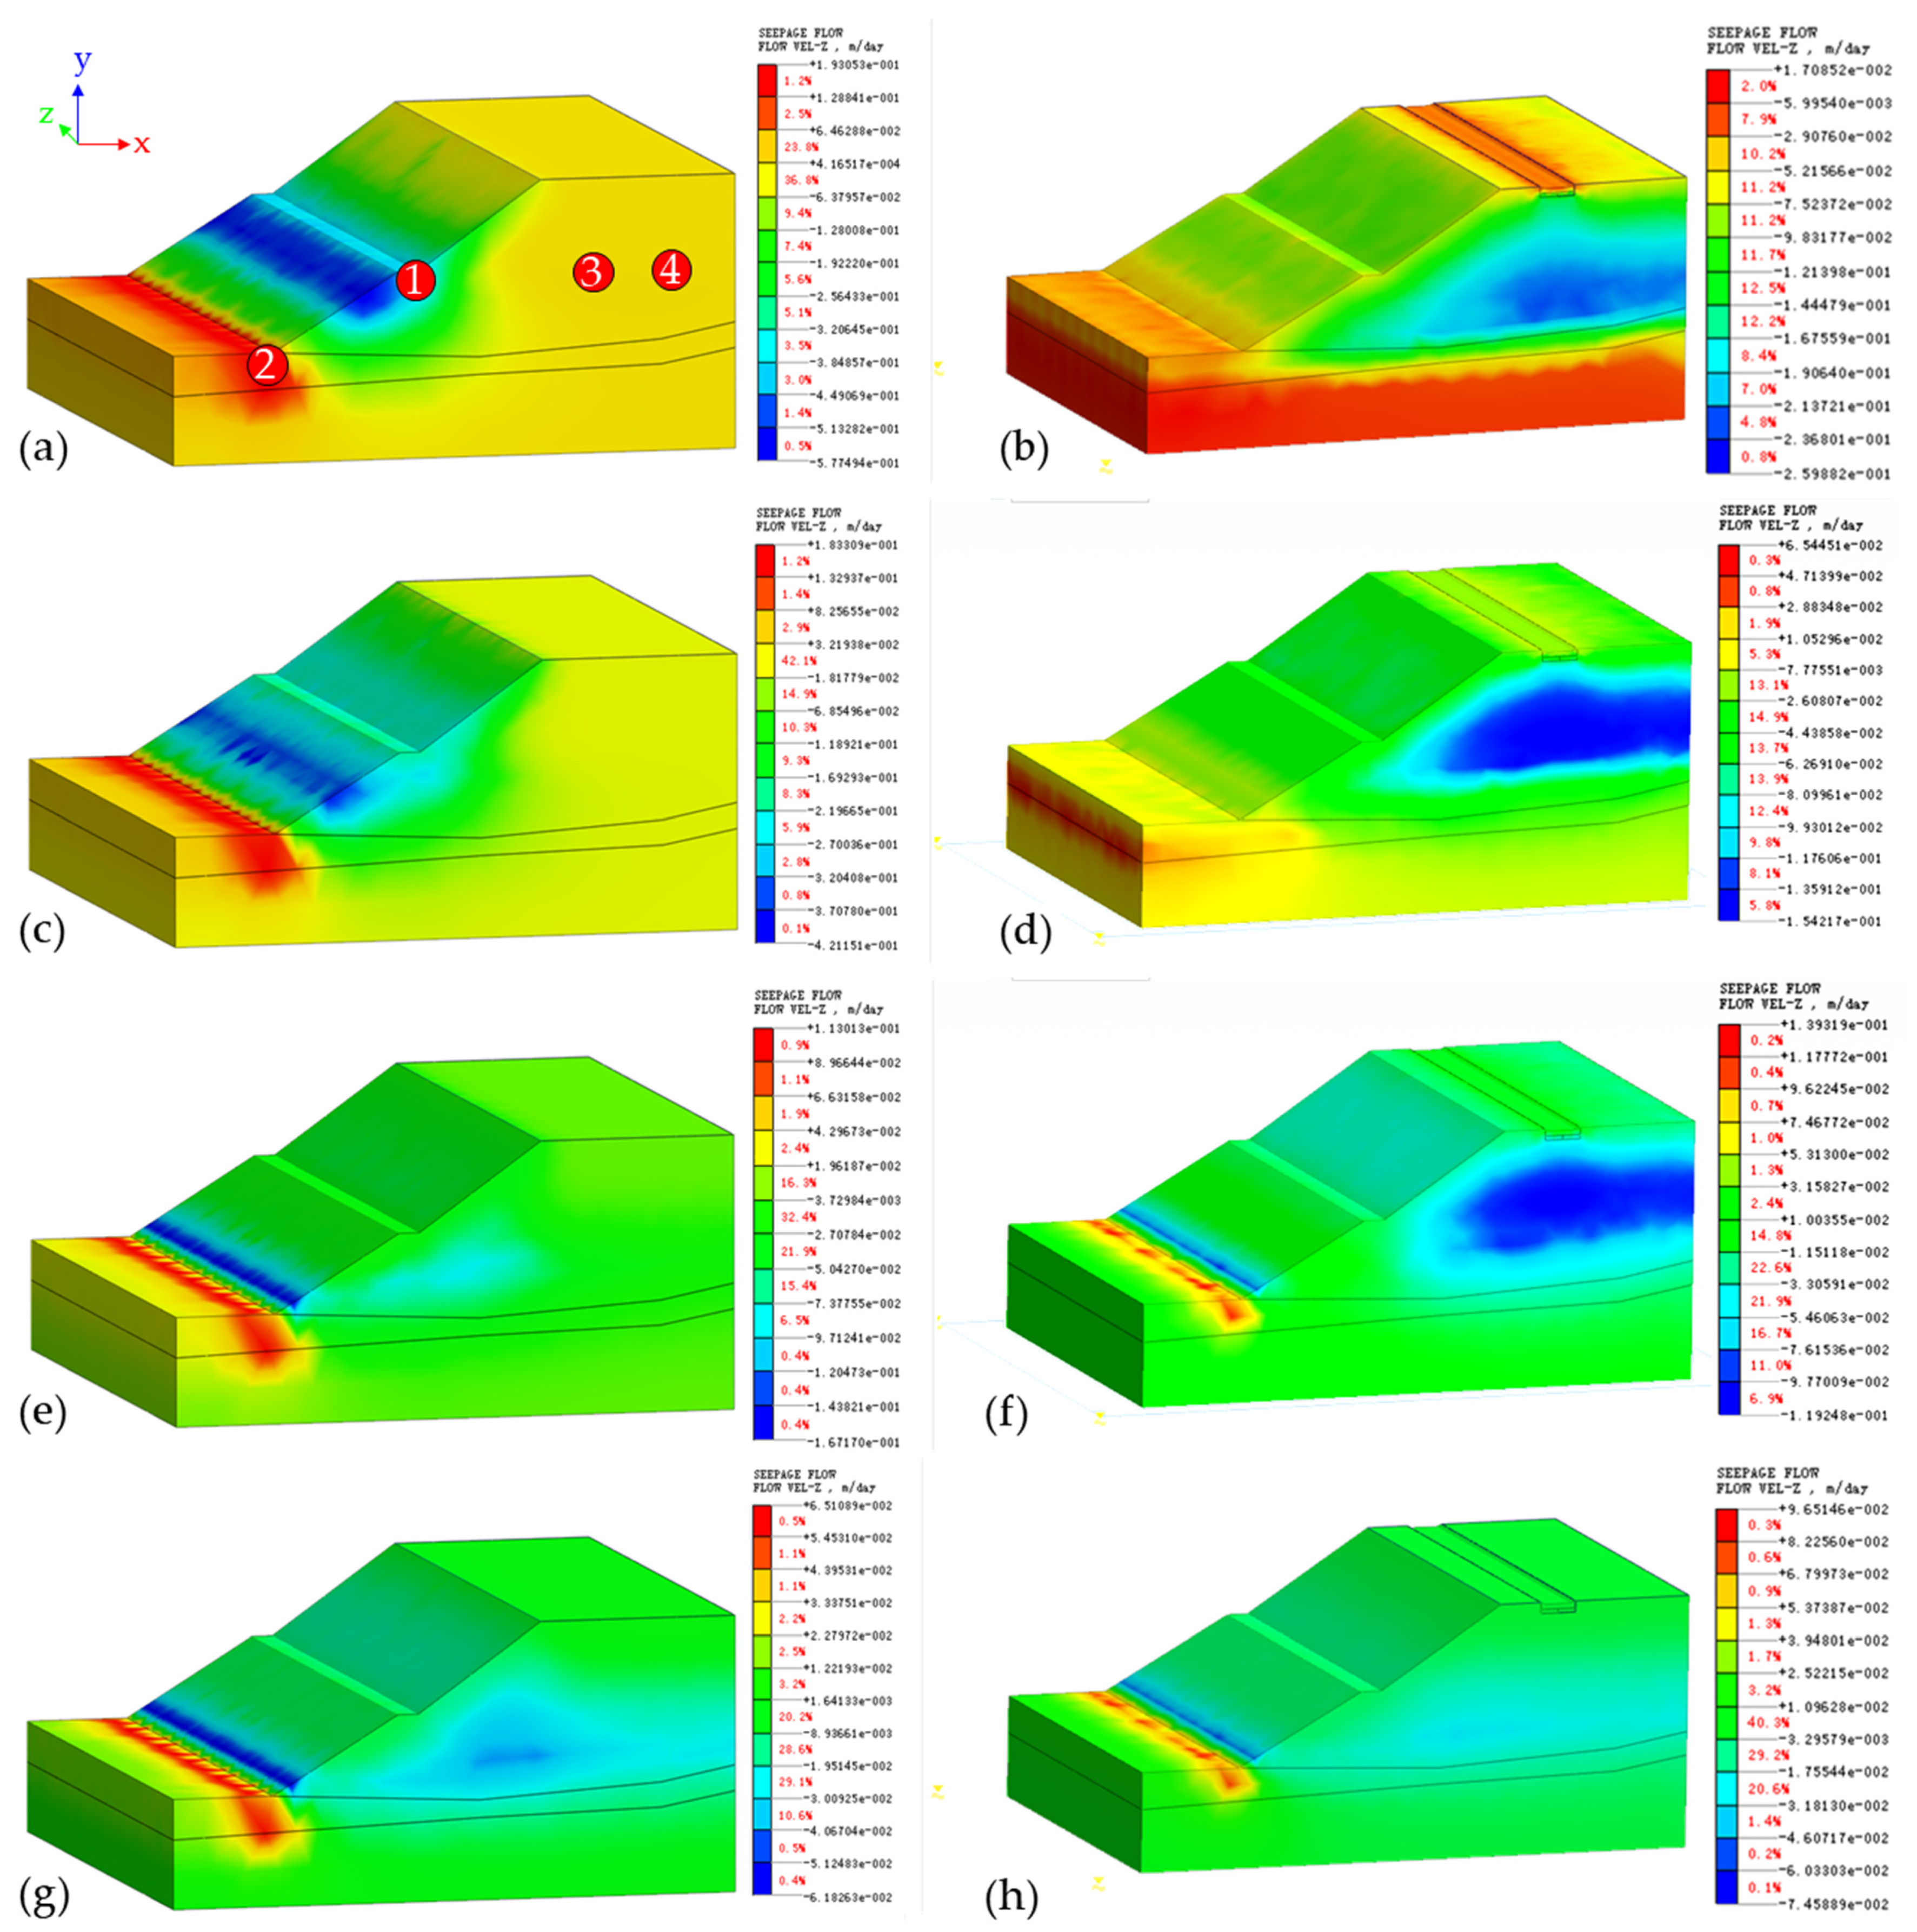
Figure 8.
Flow velocity curves of different control points.

Figure 9.
Comparison of horizontal displacement distribution in subgrade slopes without or with biological retention facilities within 48 h after rainfall: (a,b) 6 h; (c,d) 12 h; (e,f) 24 h; (g,h) 48 h.
Figure 9.
Comparison of horizontal displacement distribution in subgrade slopes without or with biological retention facilities within 48 h after rainfall: (a,b) 6 h; (c,d) 12 h; (e,f) 24 h; (g,h) 48 h.

Figure 10.
Comparison of vertical displacement distribution in subgrade slopes without or with biological retention facilities within 48 h after rainfall: (a,b) 6 h; (c,d) 12 h; (e,f) 24 h; (g,h) 48 h.
Figure 10.
Comparison of vertical displacement distribution in subgrade slopes without or with biological retention facilities within 48 h after rainfall: (a,b) 6 h; (c,d) 12 h; (e,f) 24 h; (g,h) 48 h.

Figure 11.
Horizontal (a) and vertical (b) displacement curves of different control points.

Table 1.
Mechanical parameters.
| Material | Elastic Modulus E/MPa | Poisson Ratio μ | Density γ/(Kg · m−3) | Cohesion C/(KPa) | Internal Friction Angle Φ/(°) |
|---|---|---|---|---|---|
| Subgrade slope | 3200 | 0.32 | 2000 | 5 | 25 |
| Bioretention facility | 8000 | 0.25 | 2100 | 0 | 35 |
| Silty clay | 5500 | 0.3 | 2050 | 20 | 16 |
| Moderately weathered bedrock | 21,000 | 0.2 | 2500 | 330 | 38.5 |
Publisher’s Note: MDPI stays neutral with regard to jurisdictional claims in published maps and institutional affiliations. |
© 2021 by the authors. Licensee MDPI, Basel, Switzerland. This article is an open access article distributed under the terms and conditions of the Creative Commons Attribution (CC BY) license (https://creativecommons.org/licenses/by/4.0/).
Share and Cite
MDPI and ACS Style
Tang, W.; Ma, H.; Wang, X.; Shao, Z.; He, Q.; Chai, H. Study on the Influence of Sponge Road Bioretention Facility on the Stability of Subgrade Slope. Water 2021, 13, 3466. https://doi.org/10.3390/w13233466
AMA Style
Tang W, Ma H, Wang X, Shao Z, He Q, Chai H. Study on the Influence of Sponge Road Bioretention Facility on the Stability of Subgrade Slope. Water. 2021; 13(23):3466. https://doi.org/10.3390/w13233466
Chicago/Turabian StyleTang, Wensheng, Haiyuan Ma, Xinyue Wang, Zhiyu Shao, Qiang He, and Hongxiang Chai. 2021. "Study on the Influence of Sponge Road Bioretention Facility on the Stability of Subgrade Slope" Water 13, no. 23: 3466. https://doi.org/10.3390/w13233466
Note that from the first issue of 2016, this journal uses article numbers instead of page numbers. See further details here.