Article

Spatial Distribution Characteristics and Risk Assessment of Nutrient Elements and Heavy Metals in the Ganjiang River Basin

1
School of Resources Environment & Chemical Engineering, Nanchang University, Nanchang 330031, China
2
Jiangxi Institute of Geo-Environment Monitoring, Nanchang 330095, China
3
Key Laboratory of Poyang Lake Environment and Resources Utilization Ministry of Education, Nanchang 330031, China
4
School of Hydraulic and Ecological Engineering, Nanchang Institute of Technology, Nanchang 330099, China
*
Authors to whom correspondence should be addressed.
Water 2021, 13(23), 3367; https://doi.org/10.3390/w13233367
Submission received: 24 October 2021 / Revised: 18 November 2021 / Accepted: 24 November 2021 / Published: 28 November 2021
(This article belongs to the Section Water Quality and Contamination)

Abstract

:
The pollution of water bodies by nutrients and heavy metals can lead to a loss of biodiversity, environmental degradation, and harm to human health. During the two-month monitoring period (e.g., December 2019 to January 2020), variables such as trace metals (e.g., Cu, Zn, As, and Cr), nutrients (e.g., NH4+-N, TN, and TP), water temperature, pH value, dissolved oxygen (DO), chemical oxygen demand (COD) and five-day biochemical oxygen demand (BOD5) were measured at 102 monitoring points in the main stream and tributaries of the Ganjiang River in the Poyang Lake Basin. A variety of multivariate statistical techniques, including cluster analysis (CA), principal component analysis (PCA), and correlation analysis, were used to conduct risk assessments and source analyses of the nutrient elements and heavy metals in the Ganjiang River system. The results show that although the Ganjiang River Basin is polluted by human activities, its water chemistry characteristics and trace metal and nutrient elements concentrations were better than the national standards. Through principal component analysis, the water pollution sources could be divided into urban sewage, agricultural activities, industrial activities, and the sources of industrial activities and transportation activities. The comprehensive risks of noncarcinogens (Hc) and comprehensive risks of carcinogens (Rc) for adults and children due to drinking water indicated that the risk from drinking water for the children in the basin was greater than that for adults, and that the Hc for adults and children was acceptable. However, the Rc for adults and children was slightly higher than the acceptable values. This study provides a reference for the fine control of the environmental water pollution sources in the Ganjiang river basin and health risk assessments in the basin, which are of great significance for improving the environmental water quality standards in the river basin and for reducing the risk of carcinogenesis.

1. Introduction

With the continuous development of human society, especially the various impacts that are brought by population growth and economic development, the various indicators of water quality in the natural environment continue to deteriorate [1]. Water is polluted by human activities (e.g., industrial pollution, pesticides and fertilizers, and direct sewage discharges) and by natural sources (e.g., volcanism, bedrock erosion, atmospheric migration, and plant release) [2]. The heavy metals that are introduced by industrial pollution due to human activities have an important impact on the biogeochemical cycle [3]. Because the heavy metals contained in these waters accumulate in higher organisms through the food chain, they will indirectly cause serious harm to human health, and a loss of biodiversity will pose a very large threat to the water environment [4]. Poyang Lake is the largest freshwater lake in China, with rich biodiversity. The results showed that the N and P contents in the Poyang Lake waters increased, slowly developed, and trended toward eutrophication [5]. With the drainage from mineral exploitation and metal smelting wastewater, development of industry and agriculture, and expansion of urbanization, the lake area exhibits different degrees of heavy metal pollution [6]. The Ganjiang River is the largest tributary of Poyang Lake. According to the reports, in the water body of Poyang Lake, the Pb, Zn, Cu, Ni, As, and Cd contents from the Ganjiang River accounted for 75.4, 56.8, 47.3, 30.6, 25.5, and 23.2%, respectively [7,8].
To better understand the water quality and ecological health of the basin, multivariate analyses and statistics have been widely used to determine the water’s chemical characteristics, nutrient elements, trace heavy metal sources, and health risks [9], such as cluster analysis (CA), principal component analysis (PCA), factor analysis (FA), analysis of variance (ANOVA), and correlation analysis. Cluster analysis (CA) is a method to classify or cluster samples based on the similarities of samples and differences between different samples [10]. Factor and principal component analysis (FA/PCA) has been widely used for spatial and temporal characterizations and is valuable for determining the sources of heavy metals [11,12,13].
The human health risks that are caused by long-term exposure to heavy metals in rivers cannot be ignored. After quantitatively determining the pollution source, it was more important to quantify the health risks from each type of pollution source to the residents in the study area. A study of the spatial variations in the heavy metals and nutrients in water bodies could reflect their anthropogenic sources and geological activities [14]. Although there are reports on the source identifications and risk assessments of heavy metals in the environment, the relationship between pollution sources and health risks is lacking.
Although there are relevant studies on the characteristics of water eutrophication, heavy metal pollution, and health risk assessments of the Ganjiang River, they are limited to parts of the main stream of the Ganjiang River or individual tributaries [15]. The evaluations of heavy metals were limited and lacked a comprehensive analysis of the entire Ganjiang River Basin, including the upper, middle, and lower reaches and the related main tributaries. The Jinjiang River, Yuanshui River, Lushui River, Heshui River, Shangyou River, Zhangshui River, Enjiang River, Gujiang River, Taojiang River, Meijiang River, and other tributaries around the Ganjiang River Basin have important impacts on the local area. There are many nonferrous metals and rare earth minerals in the upper reaches of the Ganjiang River [16]. At the same time, the Ganjiang River also flows through important navel orange planting areas in China. In the middle reaches, it flows through rice planting areas. In the lower reaches, it passes through Yichun, Xinyu, Nanchang, and other major cities. Many tributaries are rich in coal and iron ore resources [17].
Therefore, it is of important and substantial significance to carry out research on the characteristics of the environmental water pollution in the Ganjiang River Basin and its pollution sources and risk assessments. Identifying the pollution sources of the metal elements in the Ganjiang River Basin and the contribution rates of the pollution sources are the basis for pollution prevention and control. The aim of this study was to understand the distribution characteristics, sources, and potential health risks of nutrient elements and heavy metals in the entire section of the Ganjiang River and its tributary networks. It can provide references for the study of water pollution in the Poyang Lake Eco-economic Zone and for the management and supervision of heavy metals, as well as for other lakes with respect to heavy metals. The monitoring network and quality control provide a theoretical basis.

2. Materials and Methods
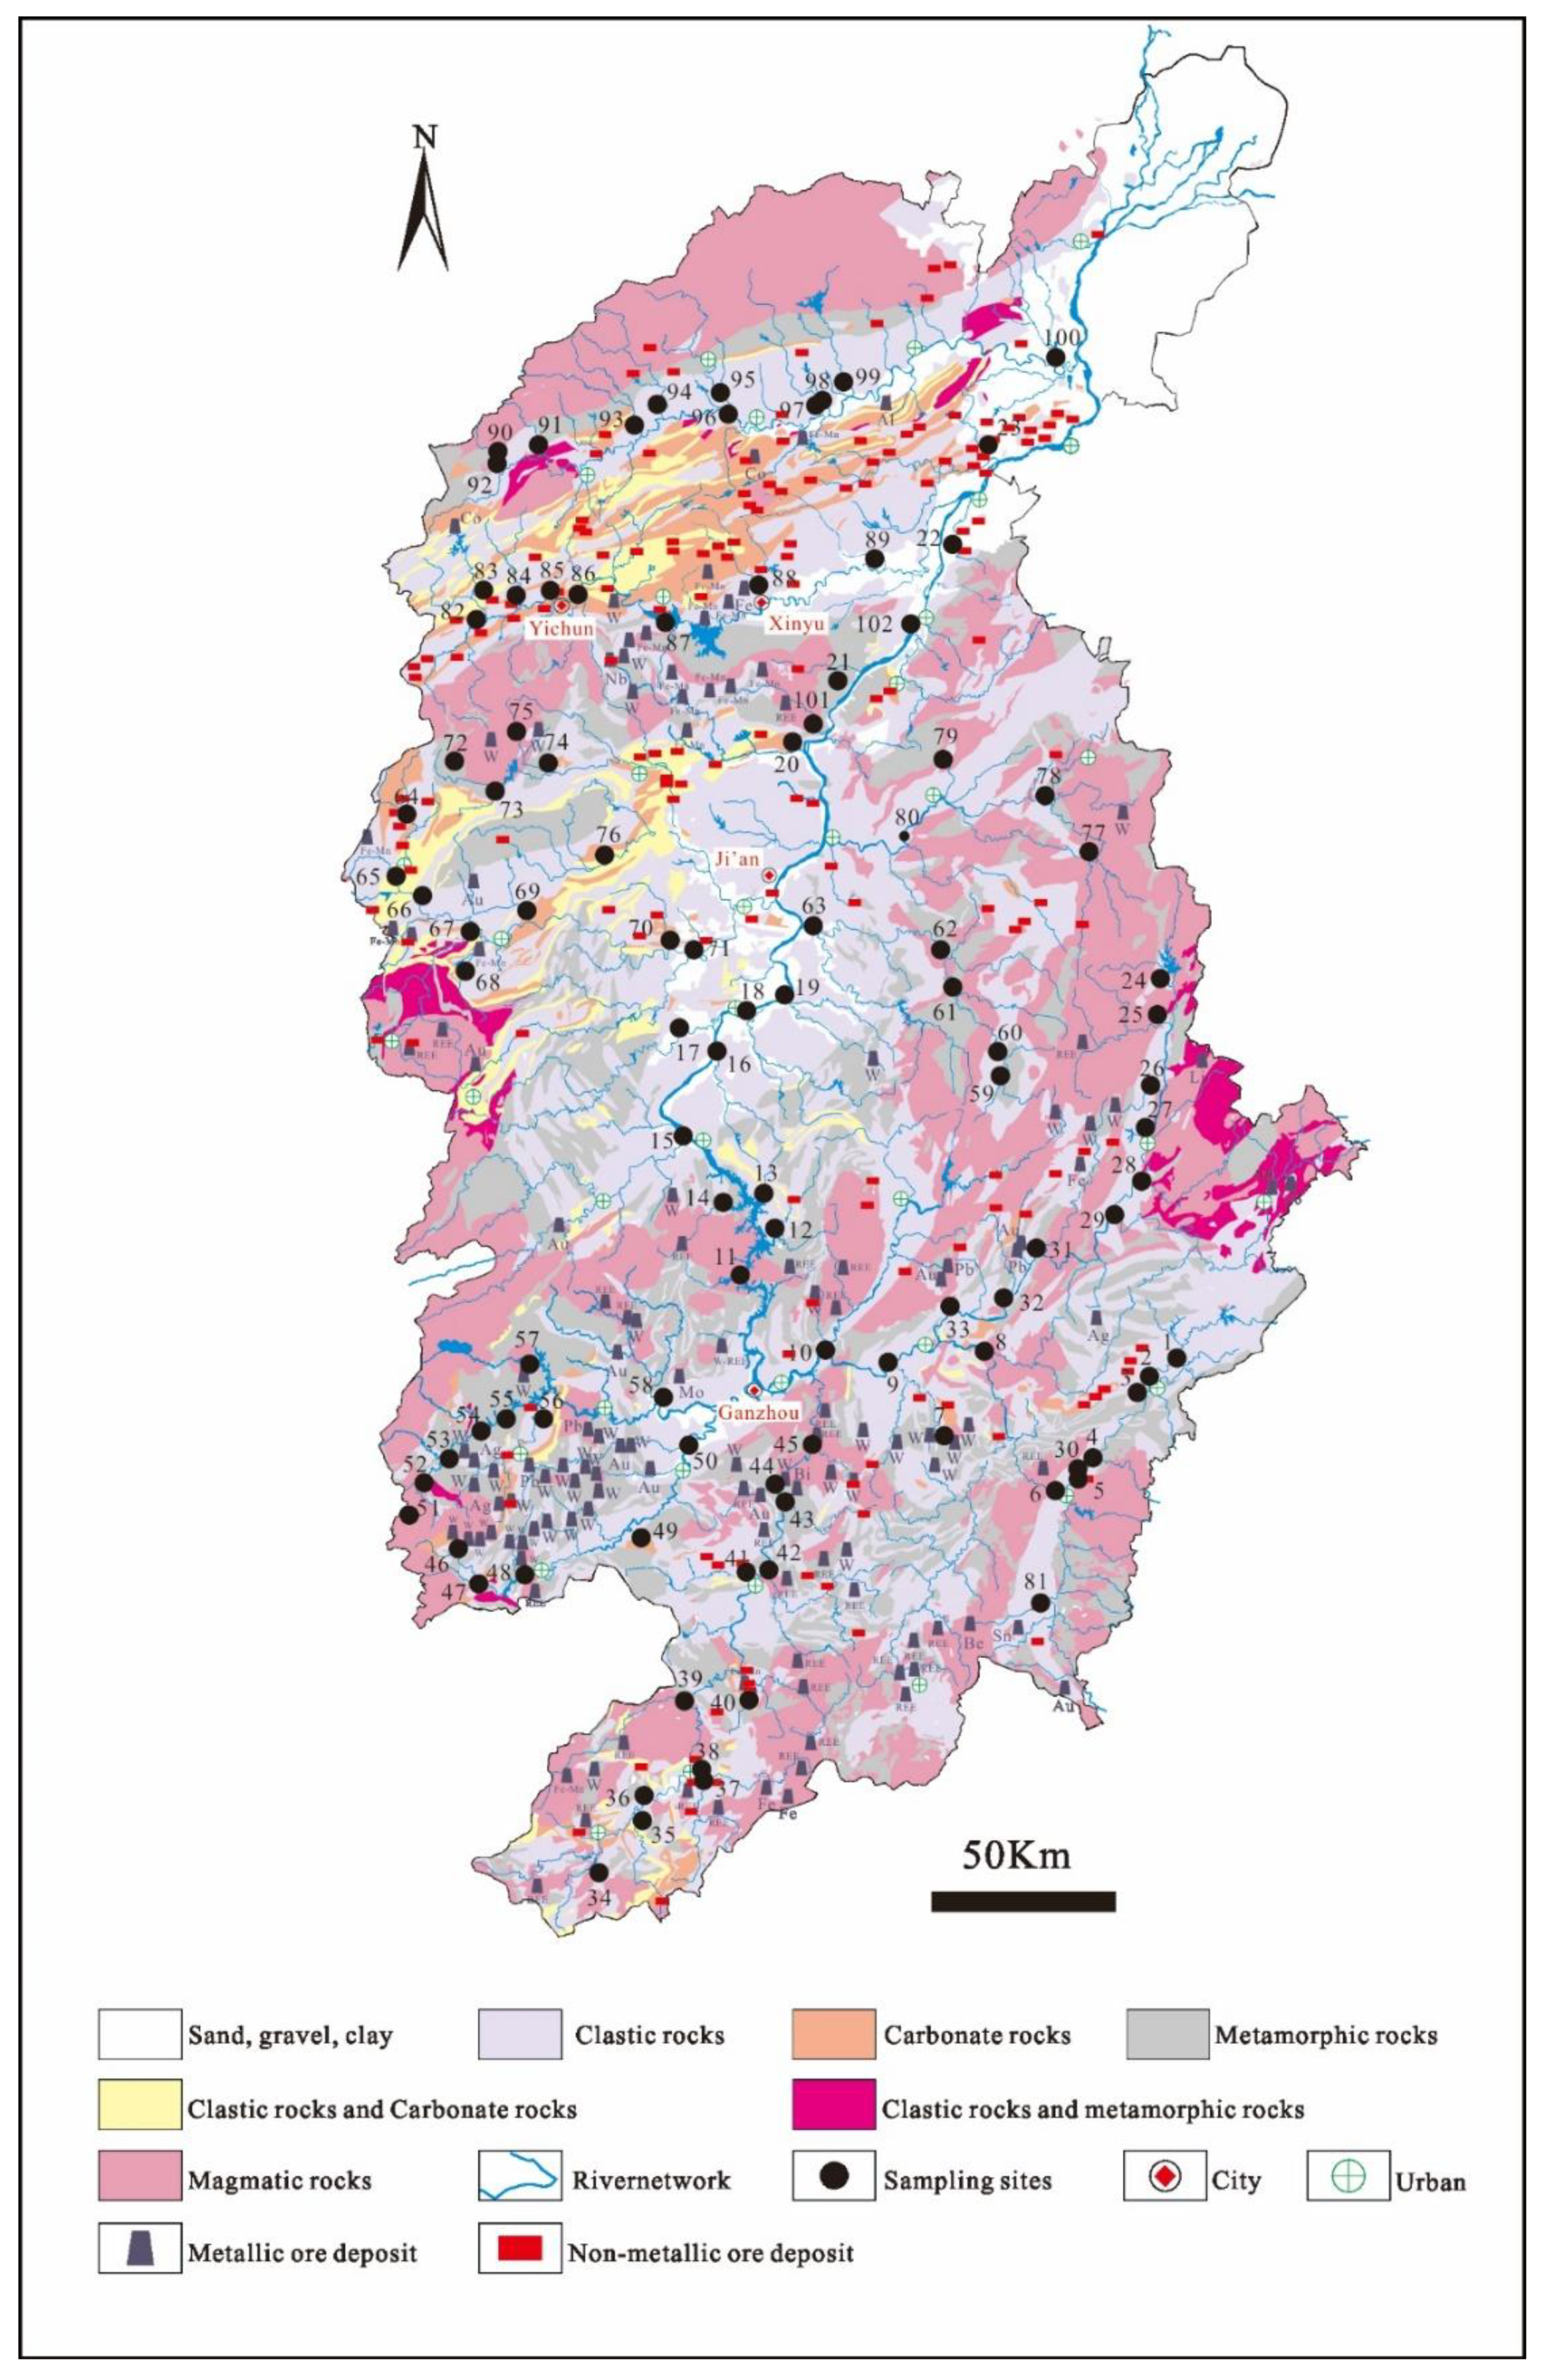
2.1. Study Area

The Ganjiang River is located in Jiangxi Province in southern China. It originates from the Wuyi Mountain area at the junction of Fujian and Jiangxi. It starts in Shicheng County and has a total length of 823 kilometers [18]. The Ganjiang River Basin has a total area of 82,890 square kilometers and affects as many as 18 million people. It has a subtropical monsoon humid climate with an average annual rainfall of 1580 mm, and its runoff accounts for approximately 46.6% of the total runoff of the Poyang Lake water system. The Ganjiang River Basin plays an important role for local residents and is the main water source for the various needs of local residents, being mainly used for farmland irrigation. Ganzhou City and Xingan County divide the Ganjiang River into the upper, middle, and lower reaches. The upper reaches of Ganzhou are located upstream, the middle reaches run from Ganzhou to Xingan County, and the downstream reaches run from Xingan County to Poyang Lake [15].
The landforms of the Ganjiang River Basin are mainly mountainous and hilly and are distributed in a ladder shape along the flow direction of the Ganjiang River from south to north. The mountainous and hilly areas in the upper reaches of the Ganjiang River Basin account for 83% of the total area, low hilly land accounts for 15.6%, and plains account for only 1.5%. The area of mountainous hills in the middle reaches accounts for 56.7%, low hills and mounds account for 38.1%, and plains account for 5.2%. In the lower reaches, the area of mountainous hills accounts for 37%, the area of low hills and mounds accounts for 55.9%, and the plains account for 7%. The upper reaches of the basin are mainly composed of clastic and magmatic rocks. The middle reaches mainly consist of clastic rocks, and the lower reaches mainly consist of metamorphic and clastic rocks. Forestry and agriculture are the main activities in the basin. However, with the rapid development of railways and highways, the communications between the middle and upper reaches of the basin have improved, which has greatly promoted the economic development of the Ganjiang Basin. In particular, the mineral resources in the Ganjiang River Basin are extremely characteristic. Large quantities of rare earth and tungsten ores are distributed in the upper reaches of the southern region, while the minerals in the middle reaches are less distributed. In the lower reaches of the north, there are concentrations of coal and rare metals (Figure 1).

2.2. Sample Collection

From December 2019 to January 2020, 102 sampling points were defined in the main tributaries and main streams of the Ganjiang River Basin (Figure 1). In order to shorten the sampling time span, the research points were divided into 8 groups, and 8 sampling teams started collecting at the same time. Samples were collected at each sampling point for three consecutive days. The sampling method was in accordance with the previous research [19]. All samples were collected using polythene plastic samplers placed 0.5 m underwater to collect clear water samples. The sample bottles with polythene plastic were washed with 2 N HCl solution and 18.2 MΩ cm Milli-Q water before use. The collected water samples were divided into three parts. One part was used to determine the nutrient element parameters. After a sample was moved to the laboratory for 24 h, the supernatant was taken to determine the total nitrogen (TN), ammonia nitrogen (NH4+-N), total phosphorus (TP), and chemical oxygen demand (COD). A second portion was used to determine the five-day biochemical oxygen demand (BOD5). The remaining portion was acidified with nitric acid and was used to determine the heavy metal contents. The temperature (T), pH, and dissolved oxygen (DO) values of the river water were measured on-site. The 5-day biochemical oxygen demand (BOD5) was measured after incubation at 20 ± 1 °C for 5 days by using a YSI portable water quality analyzer (YSI Pro1020, Yellow Springs Instrument Company(YSI Inc.) Ohio, USA) with an error of 0.01. The solubility of TN was determined by alkaline potassium persulfate digestion and UV spectrophotometry. NH4+-N was measured by Nessler’s colorimetric spectrophotometry, and the solubility of TP was measured by ammonium molybdate spectrophotometry. The analysis accuracies were better than ±5%. The CODs were measured with the dichromate method (GH5B-3C, China COD Analyzer), and the analysis accuracy was better than ±5%. The heavy metal elements in the samples were measured by using inductively coupled plasma mass spectrometry (NexION300) at the State Key Laboratory of Hydrology, Water Resources and Hydraulic Engineering, Hohai University. The reproducibility of the measurements was good, and the relative standard deviation (RSD) was ±5%. The mercury, cadmium, and lead content was very low for some sites and ND for the rest of the sites. Therefore, this paper only analyses Cr, Cu, As, and Zn.
The 7th and 81st sampling points of this sampling were discarded due to excessive deviations. The remaining 100 points are valid points. Among these, there were a total of 12 sampling points (e.g., 1, 2, 3, 4, 5, 6, 8, 9, 10, 11, 12, and 30) in the upper stream of the Ganjiang River; 10 sampling points (e.g., 13, 14, 15, 16, 17, 18, 19, 20, 21, and 101) in the middle reaches of the main stream of the Ganjiang River; 3 sampling points (e.g., 102, 22, and 23) located downstream of the main stream of the Ganjiang River; and 25 sampling points in the main stream of the Ganjiang River.
The Ganjiang tributaries that were included in the study included Taojiang (e.g., 34, 35, 36, 37, 38, 39, 40, 41, 42, 43, 44, and 45) with 12 sampling points; Zhangshui (e.g., 46, 47, 48, 49, and 50) with a total of 5 sampling points; Shangyoujiang (e.g., 51, 52, 53, 54, 55, 56, 57, and 58) with 8 sampling points; Heshui (e.g., 64, 65, 66, 67, 68, 69, 70, and 71) with 8 sampling points; Lushui (e.g., 72, 73, 74, 75, and 76) with 5 sampling points; Yuanshui (e.g., 82, 83, 84, 85, 86, 87, 88, and 89) with 8 sampling points; Jinjiang (e.g., 90, 91, 92, 93, 94, 95, 96, 97, 98, 99, and 100) with 11 sampling points; Enjing(e.g., 77, 78, 79, and 80) with 4 points; and there were 5 sampling points in Gujiang (e.g., 59, 60, 61, 62, and 63); and 9 sampling points in Meijiang (e.g., 24, 25, 26, 27, 28, 29, 31, 32, and 33). All samples were carefully standardized, and blank samples and repeated sample measurements were used to ensure the quality of the analyzed data. The chemical compositions of the river water vary with the sampling locations, and box diagrams were used to represent the characteristics and chemical elements variations of the river water.

2.3. Nemiro Comprehensive Pollution Index Method

The Nemiro comprehensive pollution index method is commonly used and is a representative water heavy metal evaluation method.
Single-factor pollution index:
P i = C i / S i .  
Multi-factor comprehensive pollution index:
P n = max ( P i ) 2 + ( P i ) 2 2 .  
In the formula, Ci is the actual measured concentration of heavy metal i and Si is the corresponding water quality standard, while the surface water environmental quality standard (GB3838-2002) is used as the reference water quality standard, and max(Pi) refers to the single factor pollution index of a heavy metal. Ave(Pi) is the average value single factor pollution index of each heavy metal. The evaluation criteria for potential pollution due to heavy metals are shown in Table A1.

2.4. Statistical Analysis

The principal component analysis (PCA) and factor analysis (FA) methods were used to determine the possible pollution sources in the Ganjiang River Basin. Cluster analysis (CA) was used to measure the similarities among samples for classification or clustering. SPSS 20.0 (IBM) software was used to perform statistical processing of the results.

3. Results and Discussion

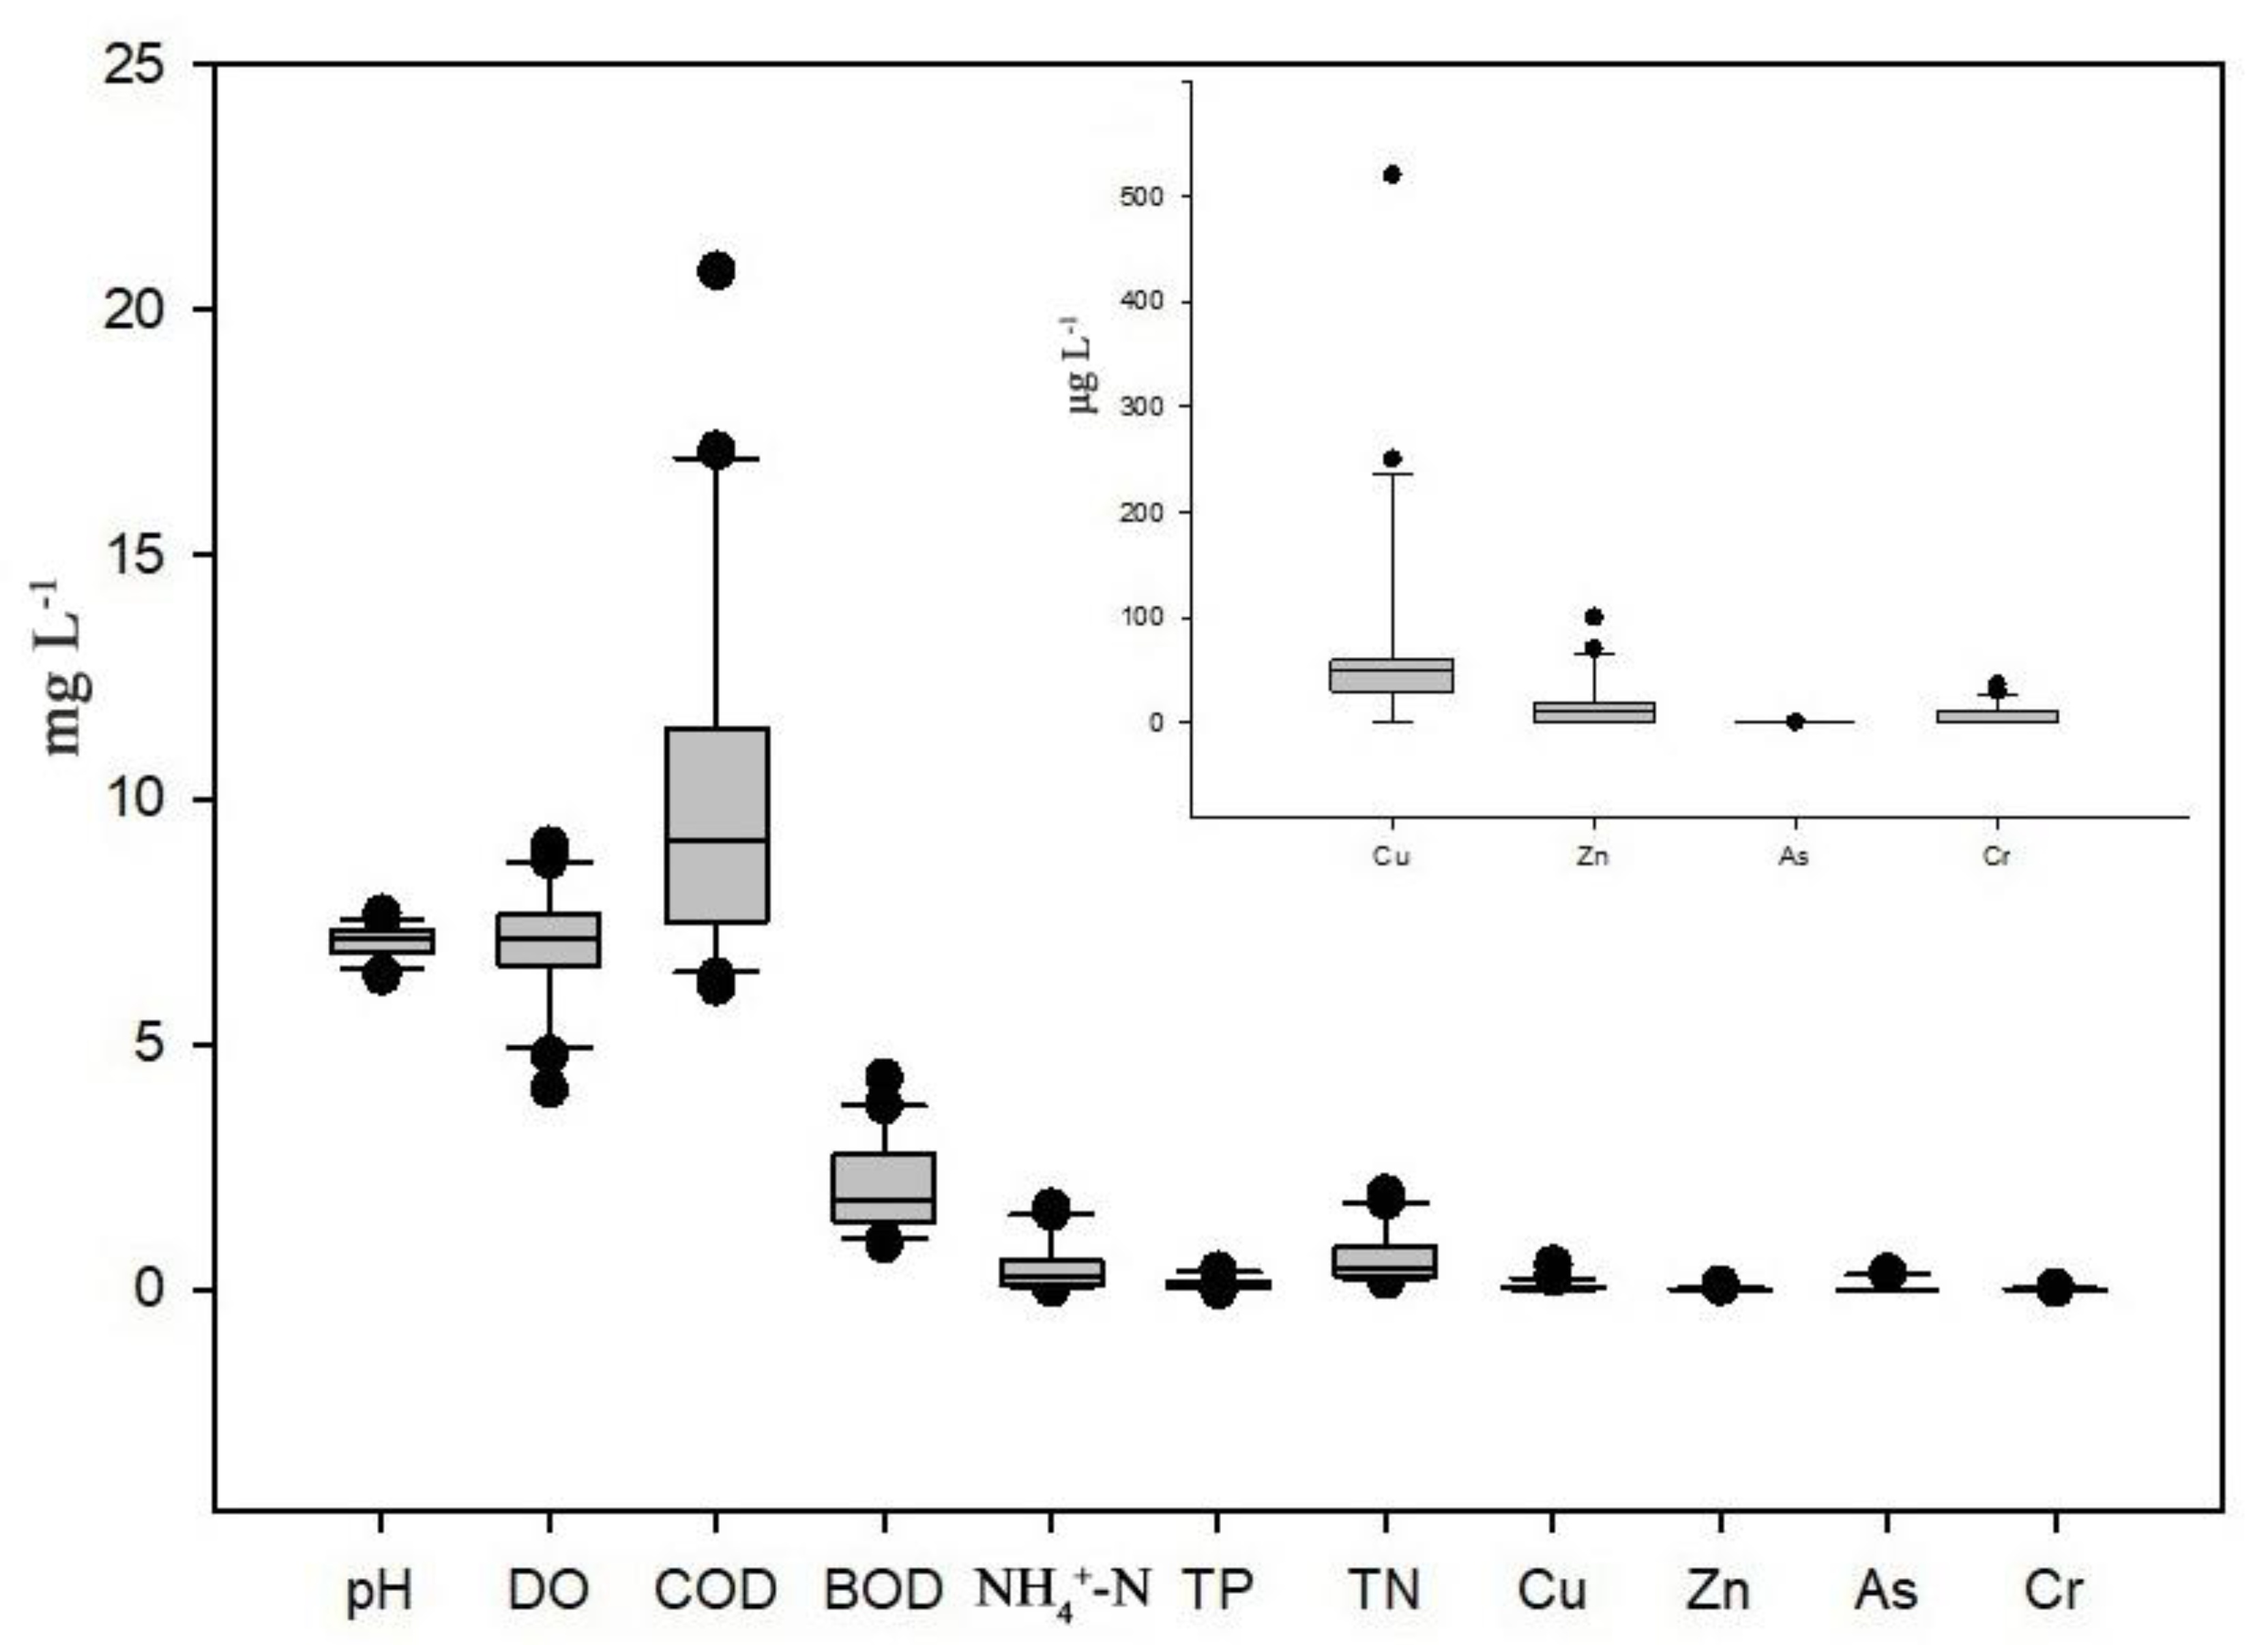
3.1. Element Discrete Analysis

As shown in Figure 2, the DO, COD, and BOD5 contents in the Ganjiang River Basin exhibit a wide range of changes, which are reflected in the large values of the standard deviations. The contents of the nutrient element TP were low and discrete. The contents of Cu in the heavy metal trace elements show large dispersion and fluctuations, while the contents of the heavy metal As were almost negligible. These results show that different locations in the Ganjiang River Basin were affected by varying degrees of human activities and mining industry activities, which have resulted in large spatial variations in the water chemistry values and Cu contents.

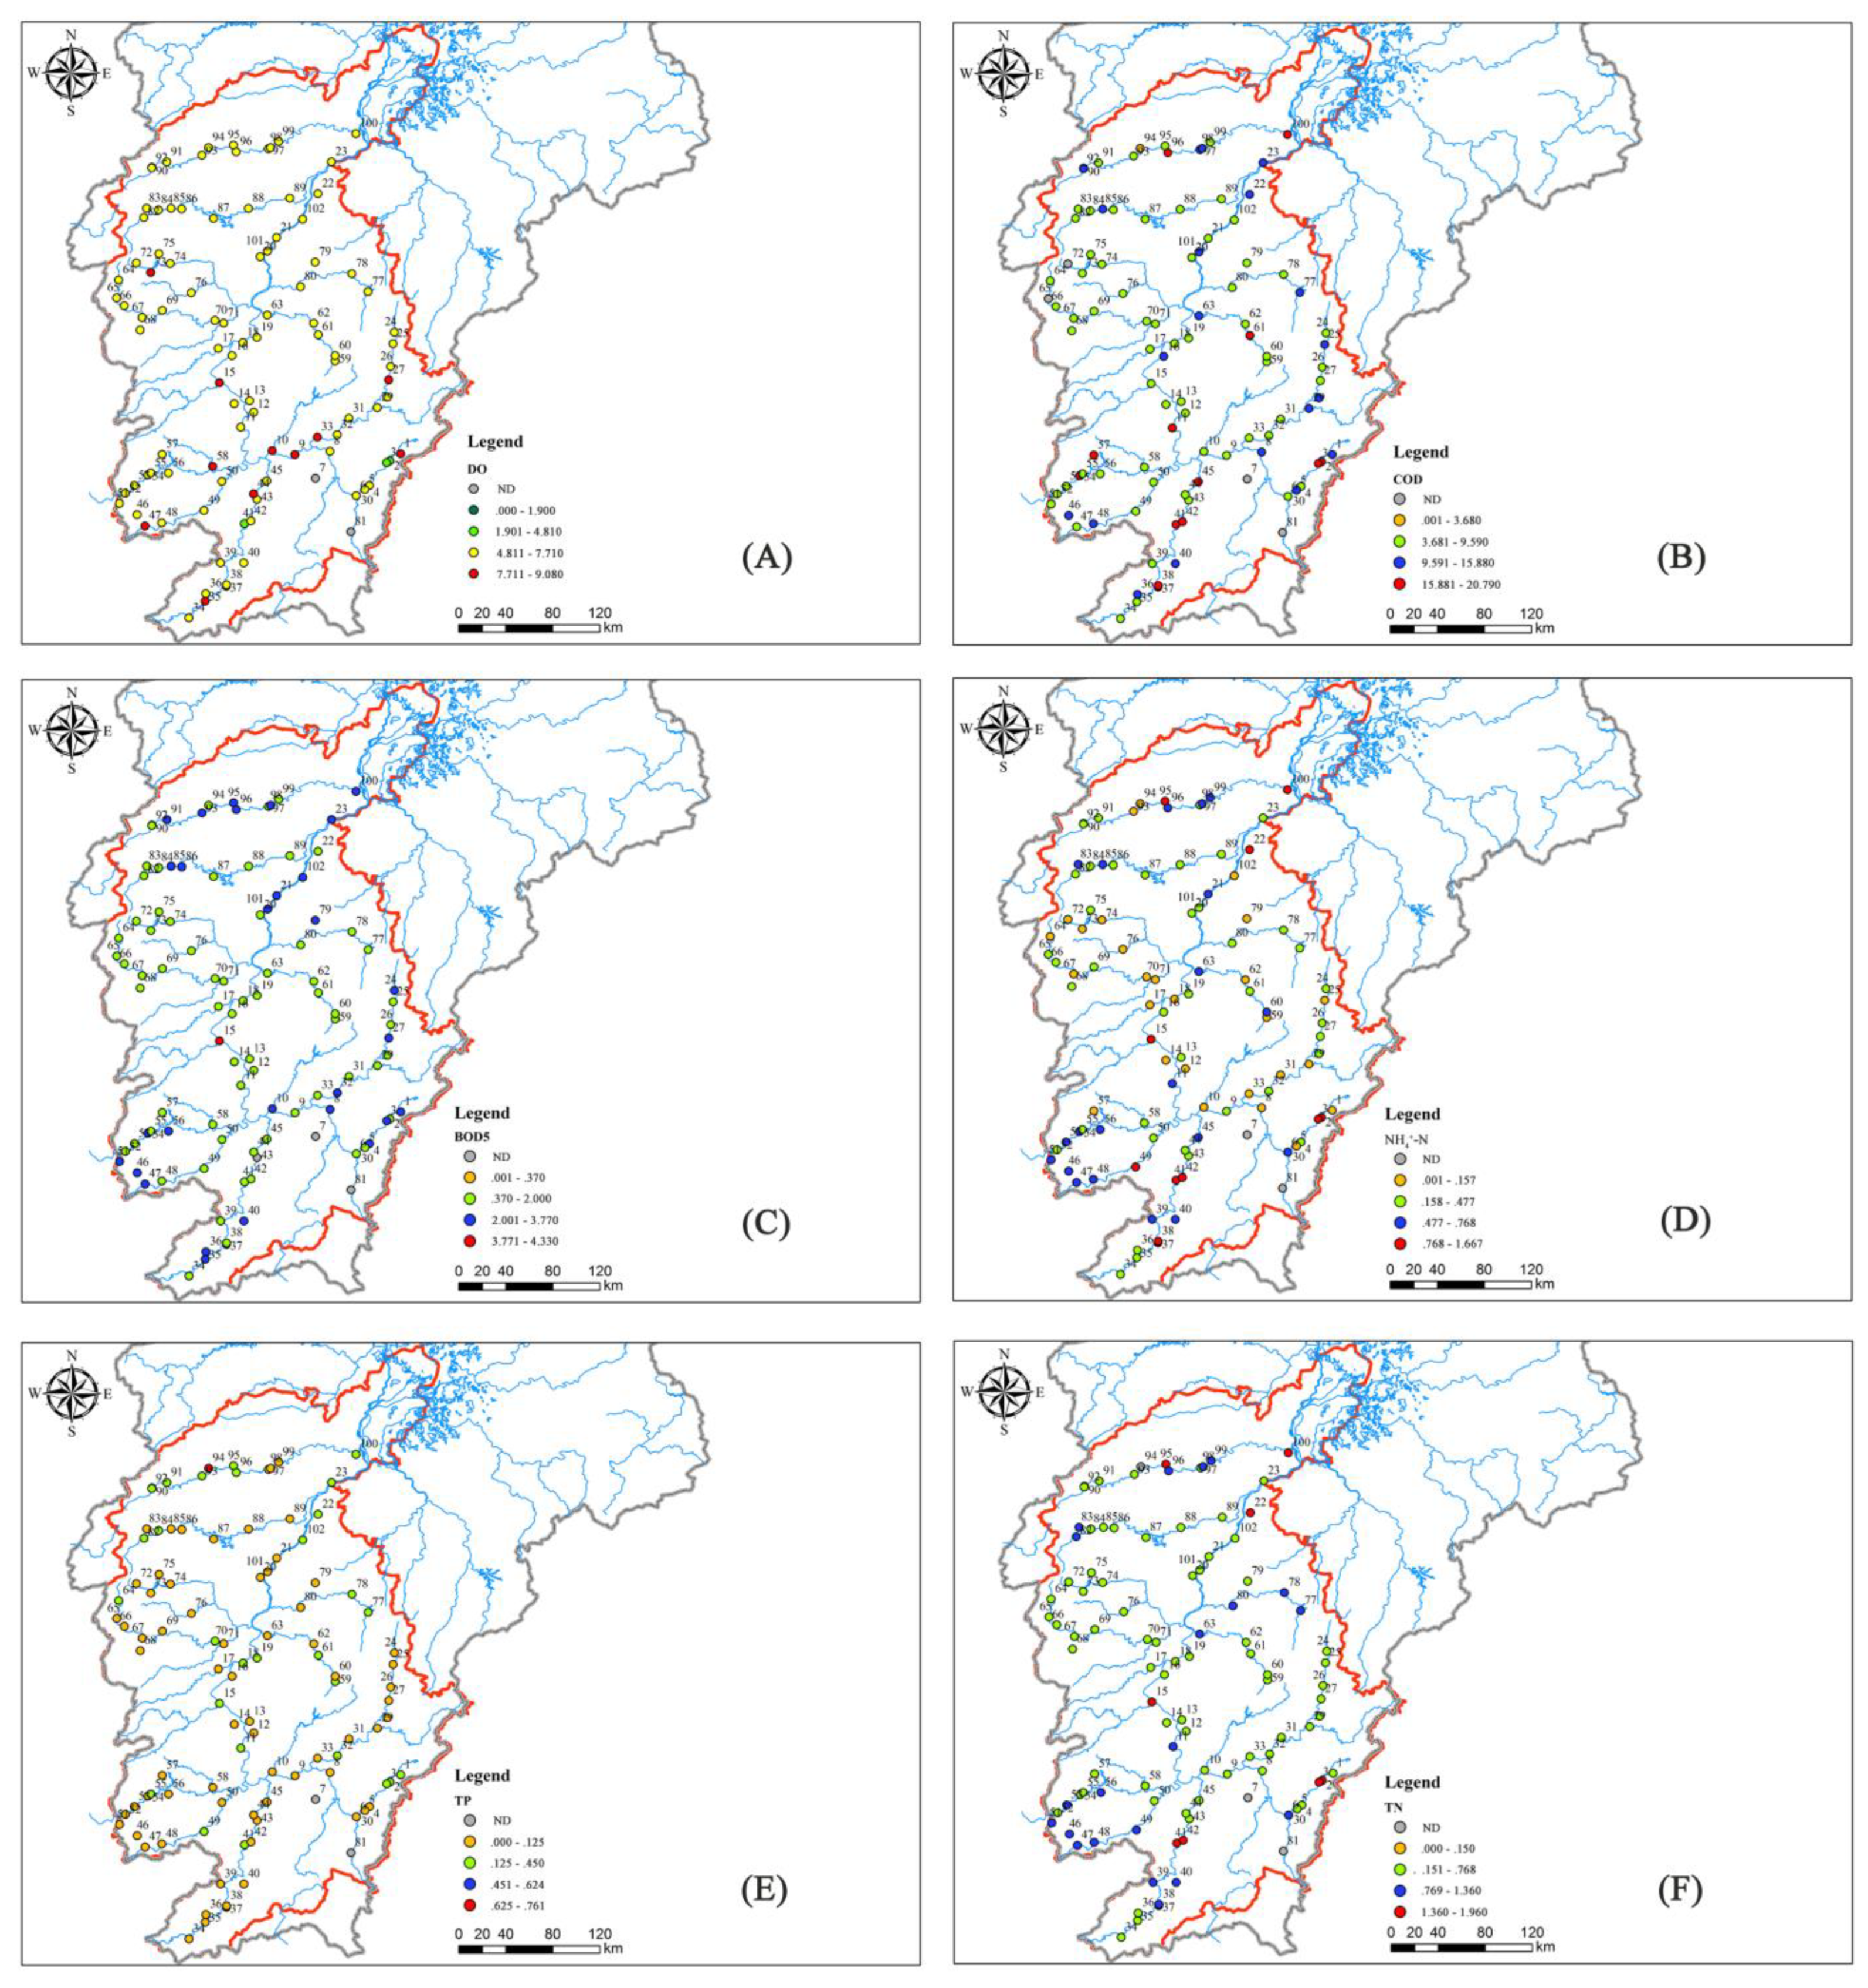
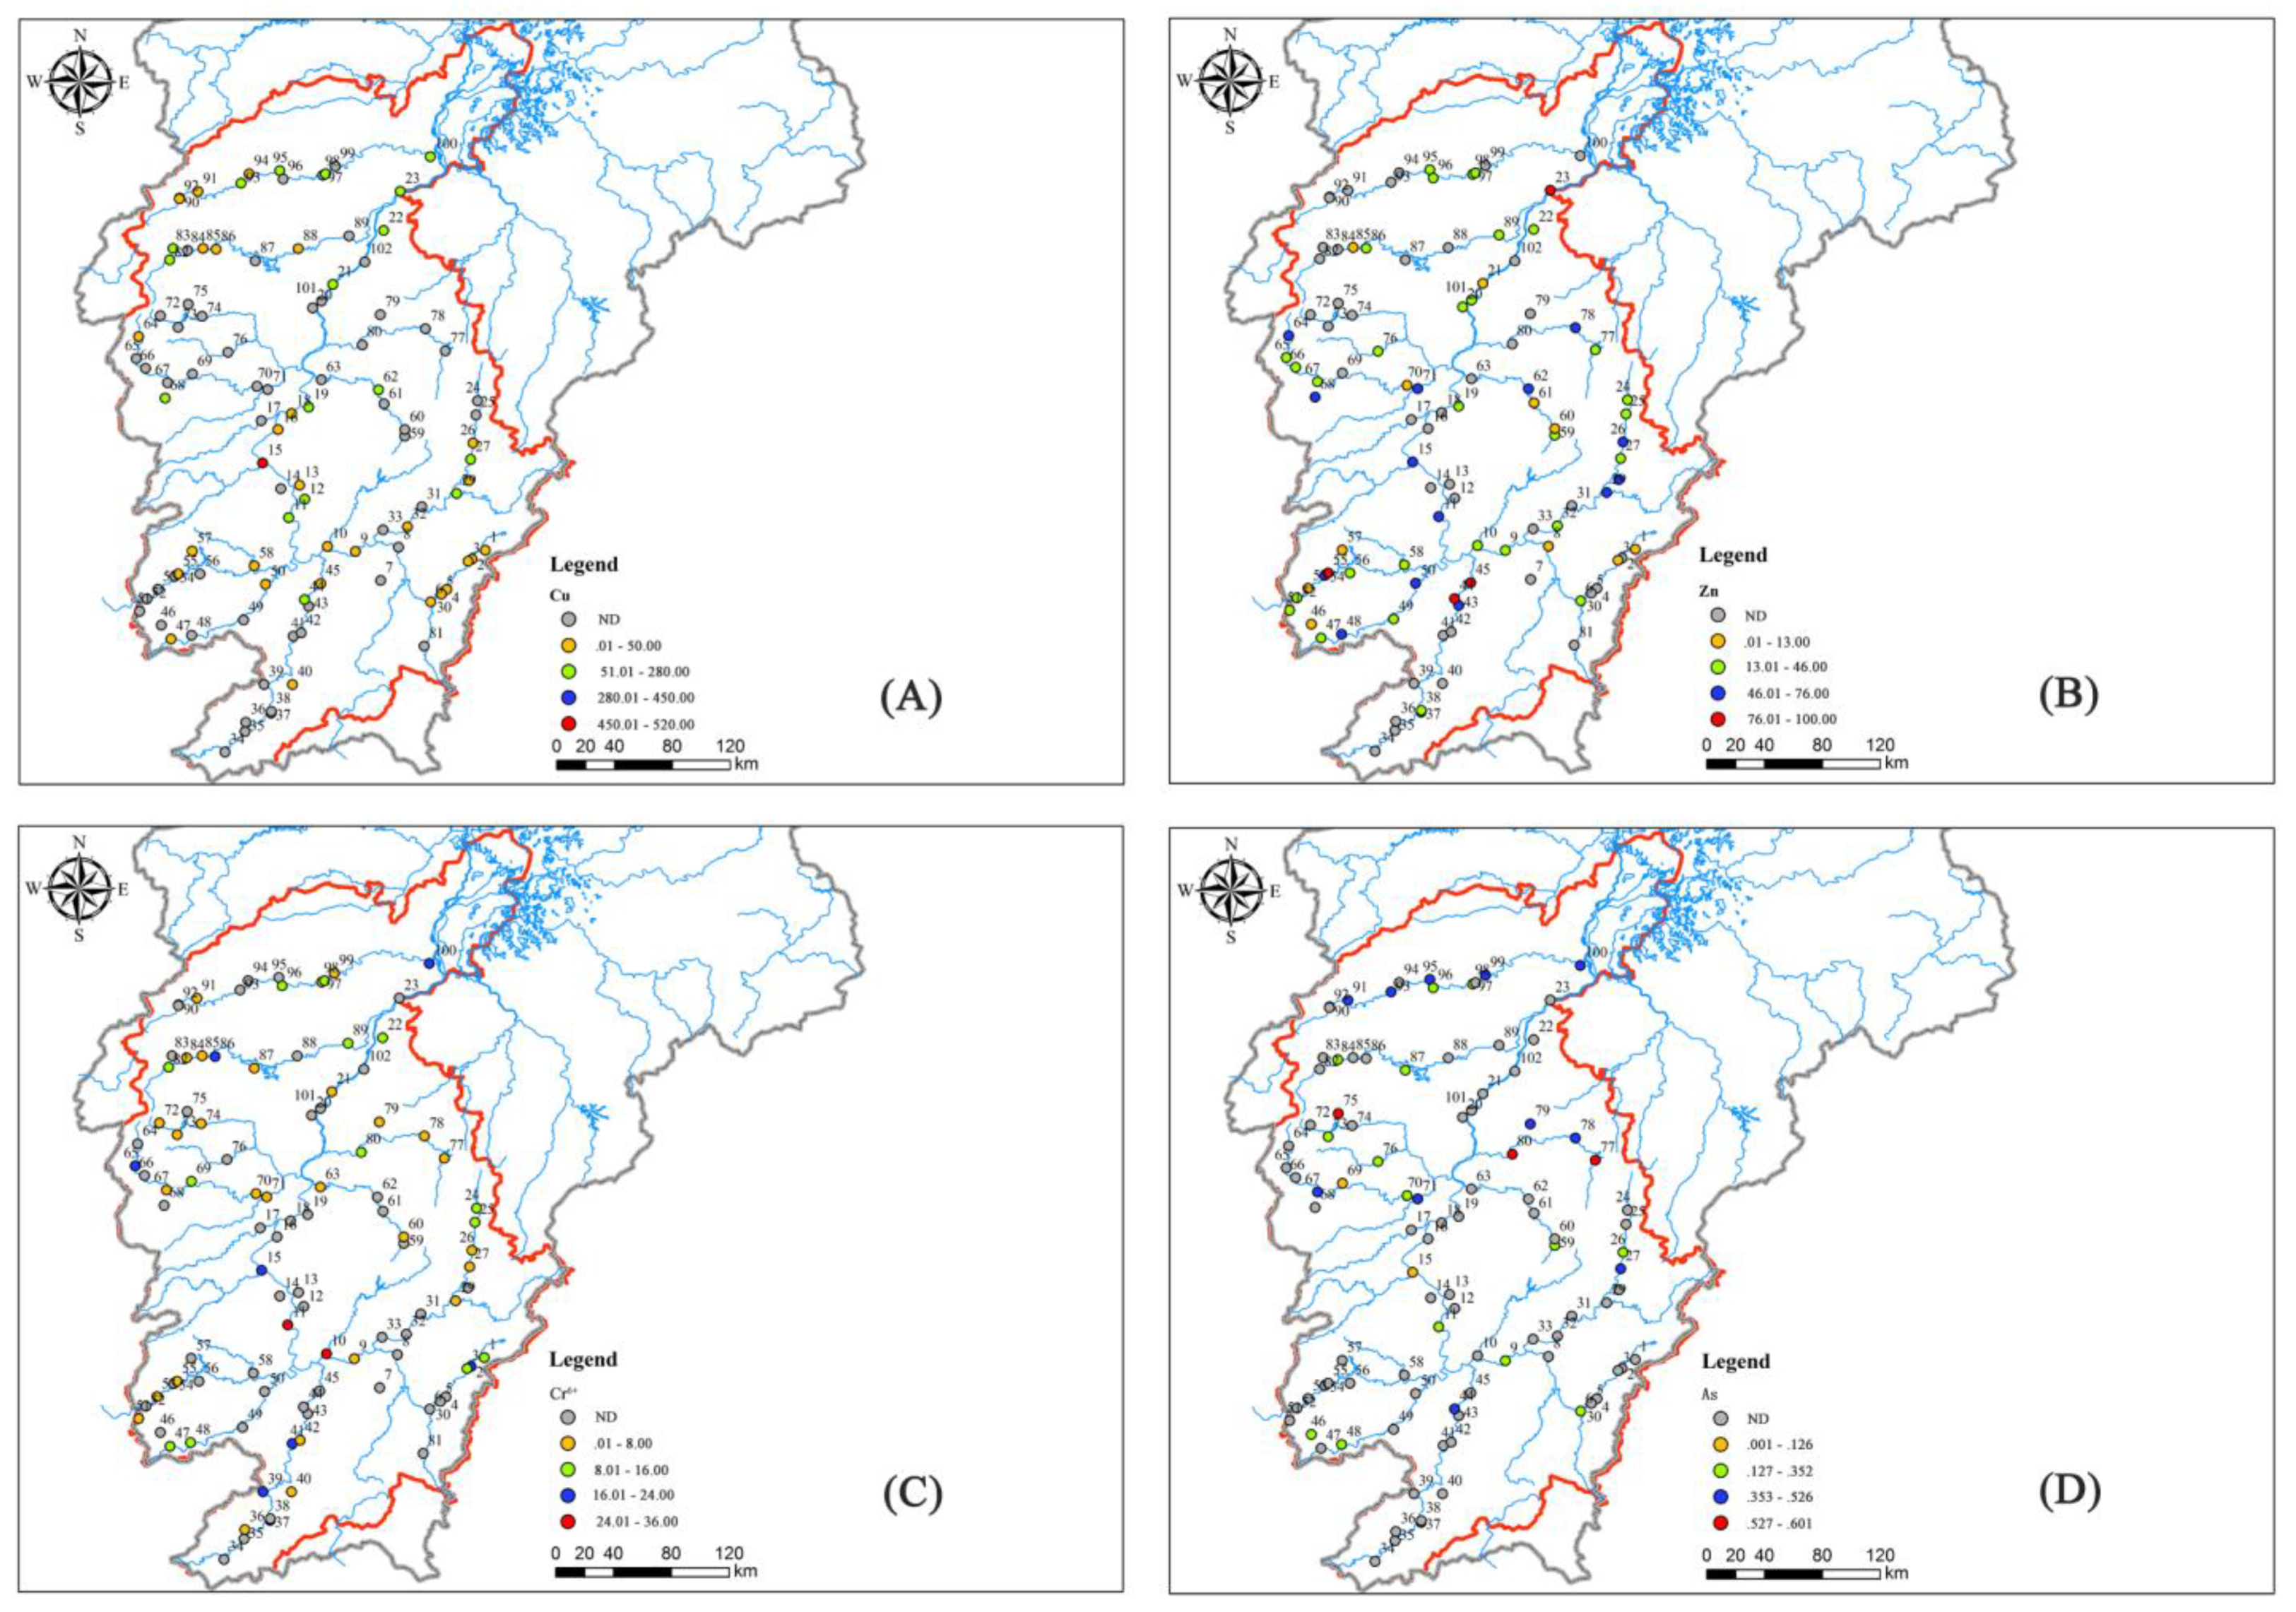
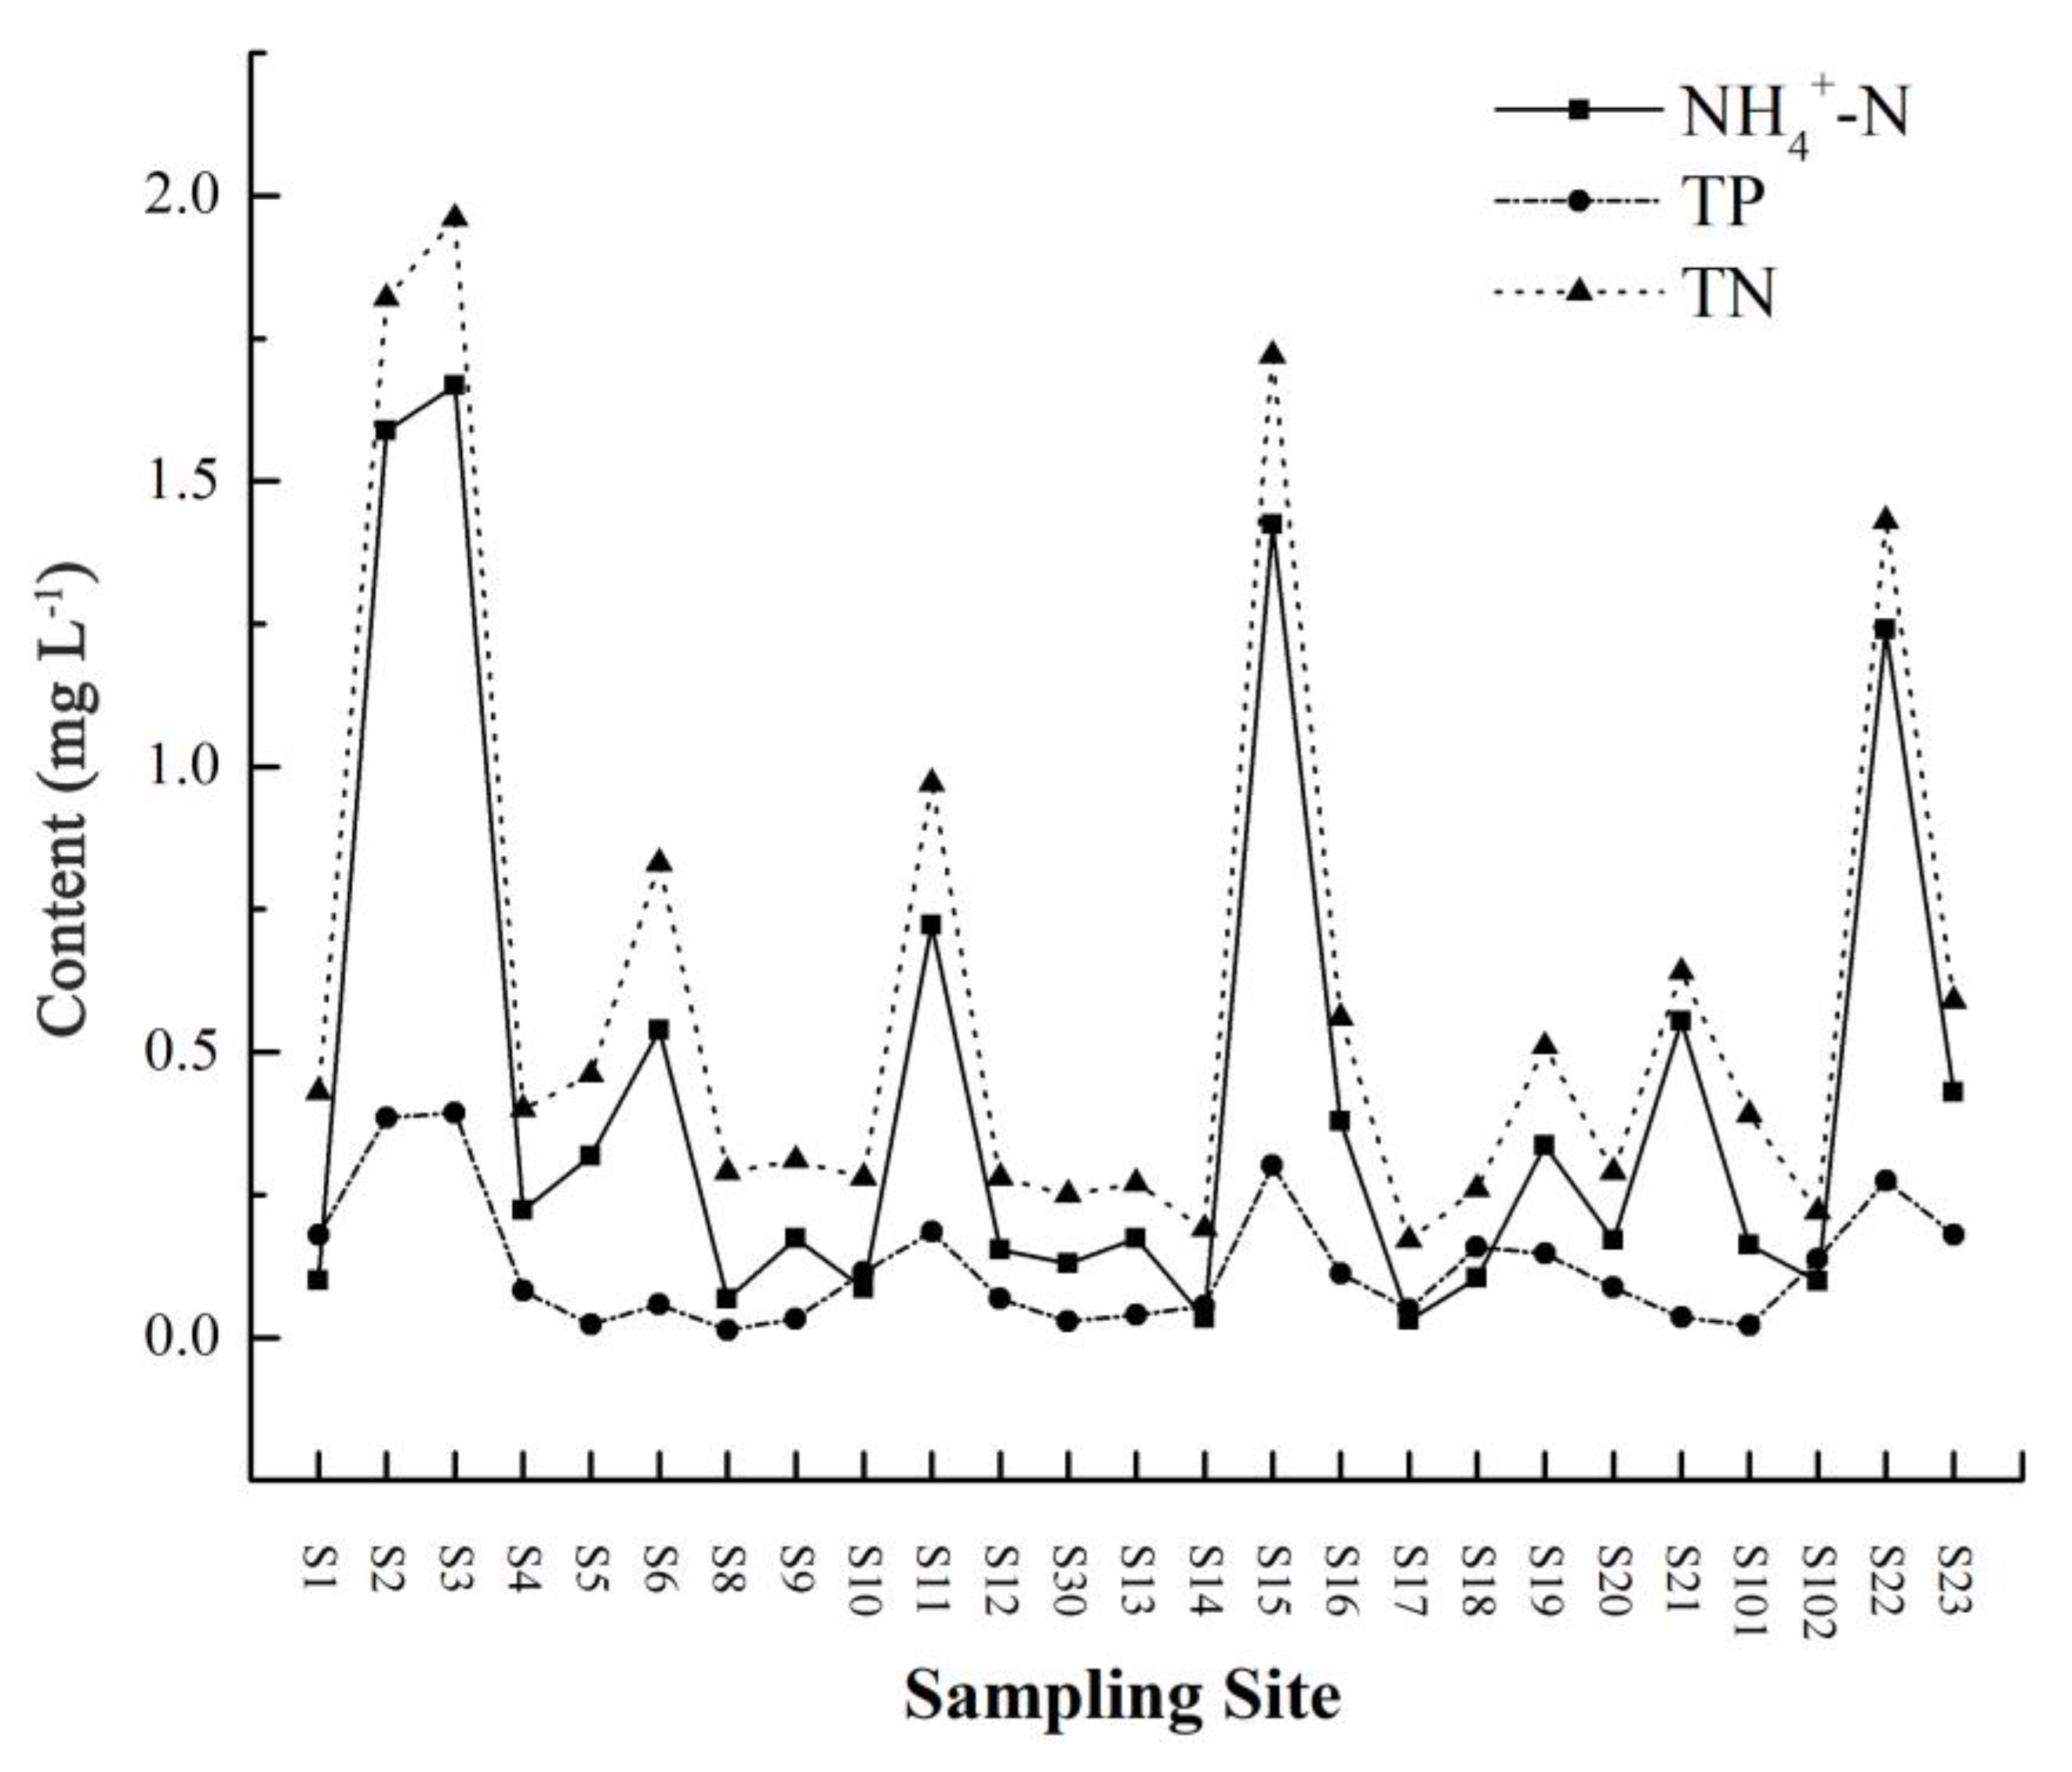
3.2. Nutrient Element and Metal Element Characteristics in the Ganjiang River Basin

The pH values of the main stream in the Ganjiang River Basin range from 6.40 to 7.67, with an average of 7.12 (Table 1). The pH values of the Ganjiang tributaries ranged between 6.69–7.13, with an average value of 6.93 (Table A2), which were within the limits proposed by the World Health Organization (WHO) (pH: 6.5–8.5) [20]. These results indicated that the ranges of the pH changes along the tributaries of the Ganjiang River were relatively small, which may be related to the different landscape backgrounds and geological conditions along the tributaries of the Ganjiang River. The river water mainly comes from rainwater and is affected by the actions of water and rock and by the discharges of wastewater and sewage from human activities in the runoff process. Therefore, the main influencing factors for the river pH levels are atmospheric precipitation, rock dissolution, and human inputs [21].
The minimum pH value for the Ganjiang tributary was 6.03, which was lower than the standard limit for pH values of 6.5–8.5 [20]. The average pH value of the Ganjiang tributaries was lower than that of the main stream of the Ganjiang River. The low pH levels in this area may be due to the high organic contents in this area, such as industrial wastewater [22] and acid rain [23]. According to reports, the rainwater in the Ganjiang River Basin has relatively high acidity in winter and spring, and the sulfur in the rainwater is mainly derived from man-made sulfur [24].
The DO, COD, and BOD values reflect the degree of pollution of water bodies and are a comprehensive indicator of the relative organic matter content and are an important indicator for complete pollution control and water environmental management [25]. The dissolved oxygen (DO) concentrations in the upper reaches of the Ganjiang River ranged between 4.10–9.06 mg L−1, with an average value of 7.03 mg L−1. The DO concentrations in the middle and downstream reaches were between 6.52 and 8.13 mg L−1 and 6.25–7.48 mg L−1, with average values of 7.07 mg L−1 and 6.95 mg L−1, respectively (Table 1). The average DO level of the Ganjiang tributaries was 6.60 mg L−1 (Table A2). The COD concentrations in the Ganjiang River Basin ranged from 6.19 mg L−1 to 20.79 mg L−1, with an average of 10.34 mg L−1. The average COD concentration in the tributaries was 9.32 mg L−1 (Table 1 and Table A2). The BOD5 concentrations in the main stream and tributaries of the Ganjiang River were 0.93–4.33 mg L−1 and 0–3.63 mg L−1, respectively, with averages of 2.31 mg L−1 and 1.63 mg L−1, respectively. The COD and BOD5 concentrations in the main stream basin of the Ganjiang River were higher in the upper and lower reaches, while the areas with higher COD and BOD5 concentrations in the tributary basins were located in Taojiang, Shangyoujiang, Jinjiang, and Gujiang (Figure 3 and Table A2).
From the perspective of the entire Ganjiang River Basin, its hydrochemical characteristics may be related to the existence of many nonferrous metal mines, rare earth mines, and related metal industries in the upper reaches of the Ganjiang River [16]. In the middle and lower reaches of the Ganjiang River, there are large tracts of farmland [26], to which large amounts of pesticides were applied. These factors have caused the sewage to contain large amounts of organic matter and microorganisms. Table A2 shows that the pH value, COD, and BOD5 of the Ganjiang River Basin did not exceed the values of the pollution limits, and they were all within the drinking water quality standards of China (GB5749-2006) and WHO. The dissolved oxygen (DO) concentrations were generally higher than the drinking water quality standards of China (GB5749-2006) and WHO in both the main stream and tributary streams.
The Cu and Zn concentrations first increased and then decreased from upstream to downstream, while the Cr concentrations instead show a downward trend in the main stream. The Cu and Zn concentrations increased abnormally in the S11 Youzhen River and S15 Suichuan River, and the Zn concentrations also increased abnormally in the S23 Xiaojiang River. This may be due to the influx of sewage from the tributaries, with the main stream being directly affected by human activities or the impact of the rare earth mines around the S11 Youzhen River (Figure 1 and Figure 4). Studies have shown that the heavy metal contents in rivers are related to the geological conditions, which mainly involve the weathering of soil and minerals [27]. By comparsion with the drinking water guidelines that were issued by the WHO, China, and the USEPA [28], the highest Cu, Zn, As, and Cr concentrations in the Ganjiang River Basin found in our study were all below the guidelines (Table 1). These results indicate that the trace element concentrations in the Ganjiang River waters were not high, which may be due to the dilution effects caused by floods or precipitation in the monsoon season [7,29]. Wan et al. (2020) reported that the water flow in the Ganjiang river basin is affected by temperature and the East Asian monsoon, controlled by solar activity. Flooding in the Ganjiang river may be related to strong solar activity and monsoon failure. According to the statistics, the once-in-a-century flood discharge of the Ganjiang river can reach 1031 × 108 cubic meters, and the flood standard of the 1000 year return period can reach 1188 × 108 m3 [30]. The average annual flow of the Ganjiang River is 2130 m3 s1 [31].
It was reported that industrial wastewater and sewage are the causes of the high trace elements levels in certain areas of the Ganjiang River Basin [32]. Therefore, natural processes and human activities are the main reasons that are necessary to control the trace elements levels in Ganjiang.
The coefficient of variation (CV) is defined as the ratio of the standard deviation to its average value, which can reflect the degrees of dispersion of the spatial distributions of different heavy metals and the wide range of changes in the physical and chemical properties of the samples. When CV < 0.15, this represents weak variability; when 0.15 ≤ CV < 0.36, this indicates medium variability; and when CV ≥ 0.36, this indicates high variability [33]. Table 1 shows that the pH values for the upper, middle, lower reaches and tributaries of the Ganjiang River Basin are slightly variable. Except for the moderate variations in the DO contents in the upper reaches, the variations in the other basins were slight, with small spatial fluctuations. The COD and BOD5 concentrations in the midstream and downstream were smaller than those of the upstream section and tributaries, which indicated that the influencing factors for COD and BOD5 in the midstream and downstream areas were relatively single. The three major nutrient elements in the main stream and tributary basins of the Ganjiang River all exhibit large variations, and the coefficients of variation are very close, with large spatial fluctuations. These results indicate that the sources of NH4+-N, TP, and TN were complex. The coefficients of variation for Cu, Zn, Cr, and As in the Ganjiang River Basin were all greater than 1, which represent strong variability and indicate that the sources were complex and were affected by the basin background and human activities. This result may be related to the uneven distributions of many minerals (e.g., tungsten ore, rare earth ores, and anthracite) in the basin (Figure 1).
As shown in Figure 5, the NH4+-N, TP, and TN concentrations in the main stream of the Ganjiang River vary from 0.03–1.67 mg L−1, 0.06–0.39 mg L−1, and 0.19–1.96 mg L−1, respectively. The average NH4+-N, TP, and TN values in the main stream of the Ganjiang River (Table 1) were 0.44 mg L−1, 0.13 mg L−1, and 0.62 mg L−1, respectively. The average NH4+-N, TP, and TN values in the tributaries of the Ganjiang River were 0.42 mg L−1, 0.09 mg L−1 and 0.63 mg L−1, respectively. The nitrogen and phosphorus that is present in the water bodies comes mainly from farmland water, urban wastewater, and groundwater [34]. The chemical forms and migration abilities of heavy metals are closely related to the activity of NH4+ in the water environment [35]. The greater the NH4+ content in water is, the easier it is to cause pollution by heavy metal regeneration.
The average values of the three major nutrients in the main stream and tributaries of the Ganjiang River were very close to each other. The ammonia nitrogen, total phosphorus, and total nitrogen concentrations in the main stream basin of the Ganjiang River were all lower than the national drinking water category III standard and the limiting values of the WHO water quality standard. Among the tributaries of the Ganjiang River, only the total phosphorus content of the Jinjiang River was slightly higher than the national drinking water category III and WHO water quality standards, while the other tributaries did not exceed the standard. This result could be because Jinjiang is located in the lower reaches of the Ganjiang River, where there are large tracts of farmland, which may be affected by the phosphate fertilizer introduced by agricultural activities, which caused the TP contents to exceed the standard [26].

3.3. Water Environment Health Risk Assessment of the Ganjiang River Basin

The water environment health risk assessment model can quantitatively describe the risk of river heavy metals that cause harm to the human body. The heavy metals Cd, As, and Cr measured in this study are carcinogens, and Cu, Zn are noncarcinogens. The health risk assessment model of chemical carcinogens ingested through drinking water is:
R i = [ 1 exp ( D i q i ) ] / 74 .  
R c = a i = 1 k R i .  
In the formula, Ri is the average annual personal carcinogenic risk of chemical carcinogen i, Di is the average daily exposure dose per unit weight of carcinogen i obtained from drinking water (mg/(kg×d)), and qi (Table A3) represents the carcinogenic intensity coefficient of chemical carcinogen i due to intake through drinking water (mg/(kg×d)), 74 is the average lifespan of the population of Jiangxi Province, and Rc is the combined risk of k carcinogens due to drinking water.
The carcinogenic risk assessment model of the nonchemical substances ingested through drinking water is:
H i = ( D i R F D i ) × 10 6 74 .  
H C = i = 1 k H i .  
In the formula, Hi is the noncarcinogenic substance i per capita carcinogenic risk due to drinking water ingestion, RFDi (Table A3) is the average daily exposure dose per unit body weight for noncarcinogen i through ingestion of drinking water (mg/(kg×d)), and Hc is the combined risk of k noncarcinogens that is caused by drinking water consumption.
Where Di is expressed as:
D i = 2.2 C i 64.3 ( a d u l t ) D i = 1.0 C i 22.9 ( a d u l t )
In the formula, 2.2 and 1.0 are the average daily water consumption levels for adults and children (L), respectively; Ci is the mass concentration of heavy metals (mg L−1); 64.3 and 22.9 are the average weights of adults and 7-year-old children, respectively (kg).
The overall health risk calculation formula is:
R t o t a l = R c + H c .  
The Nemiro comprehensive pollution index determines the degree of heavy metal pollution at sampling points by calculating the single and comprehensive pollution indices of heavy metals. The health risk assessments of areas that are polluted by multiple elements are usually very complex and are affected by many factors, such as topography, organic matter, hydrological conditions, and the interactions among multiple elements at each sampling point [36]. Table A4 shows that the comprehensive pollution indices, Pn, of the upper, middle, lower reaches and tributaries of the Ganjiang River were less than 1. A health risk assessment model for the Ganjiang River Basin was established. The results suggested that the average annual personal comprehensive risk (Hc) of adults and children caused by noncarcinogenic heavy metals was between 0.01 × 10⁻⁹~8.08 × 10⁻⁹ and 0.01 × 10⁻⁹~10.31 × 10⁻⁹, respectively (Table 2). Since the per capita carcinogenic risk limit was 1 × 10⁻⁶, this indicates that both adults and children were at an acceptable level of risk. The overall carcinogenic risks (Rc) for adults and children that were caused by carcinogenic heavy metals were between 45.73 × 10⁻⁶~182.22 × 10⁻⁶ and 58.30 × 10⁻⁶~231.46 × 10⁻⁶, respectively, which exceeded the acceptable risk limits. This shows that the R values were mainly related to carcinogenic heavy metals; that is, the health risks at each sampling point were mainly derived from the carcinogenic heavy metals Cr and As.
As seen in Table 2, the total risks from the noncarcinogenic and carcinogenic heavy metals increased simultaneously, which further verified that the enrichment levels of the carcinogenic heavy metals and noncarcinogenic heavy metals at the same sampling point were similar. The total noncarcinogenic risk and total carcinogenic risk for adults at all sampling points were lower than those for children, which indicated that heavy metal pollution poses a greater threat to the health of children due to drinking water (Table 2). This is consistent with the research results of other scholars [3]. This may be because growing children are more sensitive to heavy metals and are more vulnerable than adults. In addition, the higher respiratory rates, stronger gastrointestinal absorption capacities, and some behavioral habits (e.g., hand-to-mouth contact) of children lead to higher exposure sensitivities per unit weight [37,38].

3.4. Multivariate Statistical Analysis of Trace Elements

3.4.1. Principal Component Analysis

Principal component analysis (PCA), as a statistical technique, has been well developed over many years of practical applications. It was used to identify the different elements of the group members that are related to each other in the watershed, so it can be determined whether these elements have similar behaviors and common sources [39,40,41]. Table 3 shows the dataset of the measured elements and the PCA loadings that were obtained by normalized rotation using the maximum variance method. The KMO value was 0.592, and the significance of Bartlett’s sphericity test was less than 0.001, which showed that PCA was appropriate for this study [42]. Four principal components (PCs) (characteristic value > 1) were extracted, which explained 61.37% of the total variance in the element concentration dataset (Table 3) and explained 4 possible sources of the water chemistry values of 12 components, including T, Ph, DO, COD, BOD5, NH4+-N, TN, TP, Cu, Zn, As, and Cr. The first component (PC1) accounts for 21.83% of the total variance, in which there was moderate positive loading (>0.50) from BOD5, TN, and Cr and medium loading from the temperature T. Moreover, BOD5, TN, and Cr are significantly positively correlated at p < 0.01 (Table A5), which further verifies that the BOD5, TN, and Cr came from the same source. Although PC1 contains Cr, it does not exceed the China (GB5749-2006) and WHO drinking water quality standards. Urban sewage is also one of the important sources of Cr [43,44], so PC1 represents the urban sewage source.
The second component (PC2) accounted for 17.93% of the total variance. Among them, COD, NH4+-N, and TN were moderately positively loaded, pH was moderately negatively loaded, and DO was strongly negatively loaded (absolute value > 0.70). While COD, NH4+-N, and TN indicated significant positive correlations at p < 0.01 (Table A5), DO and COD, NH4+-N, and TN indicated significant negative correlations at p < 0.01, which verified that the COD, NH4+-N, and TN came from the same source. Following the extensive use of chemical fertilizers and pesticides, the residues were carried by storm runoff and flowed into the river to cause pollution. NH4+-N and TN are considered to be the main sources from agricultural activities [45], so PC2 represents the sources from agricultural activities. The third component (PC3) accounted for 12.20% of the total variance and had a strong positive load for Cu and Zn. Cu and Zn showed a significant positive correlation when p < 0.01 (Table A5), which verified that the Cu and Zn came from the same source. Cu and Zn often exist as companions and are affected by the affairs of people. Cu and Zn mainly come from the influences of industrial activities such as mining, smelting, and processing [46], so PC3 represents the industrial activity source. Similar research results indicate that the increased concentrations of chromium, copper, and zinc pollution in the river water may be caused by electroplating wastewater and are caused by industrial pollution [47]. It was reported that in the commercial manufactures of electroplating and galvanizing, the discharged wastewaters contain large amounts of heavy metals, such as Zn, Cu, and Cr [48].
The fourth component accounted for 9.40% of the total variance and had a strong positive load on As. As mainly comes from urban and industrial activities, such as energy production, mining, metal smelting and refining, and manufacturing processes, and automobile exhaust and waste incineration [49,50,51]. Therefore, PC4 represents the source due to industrial and transportation activities.

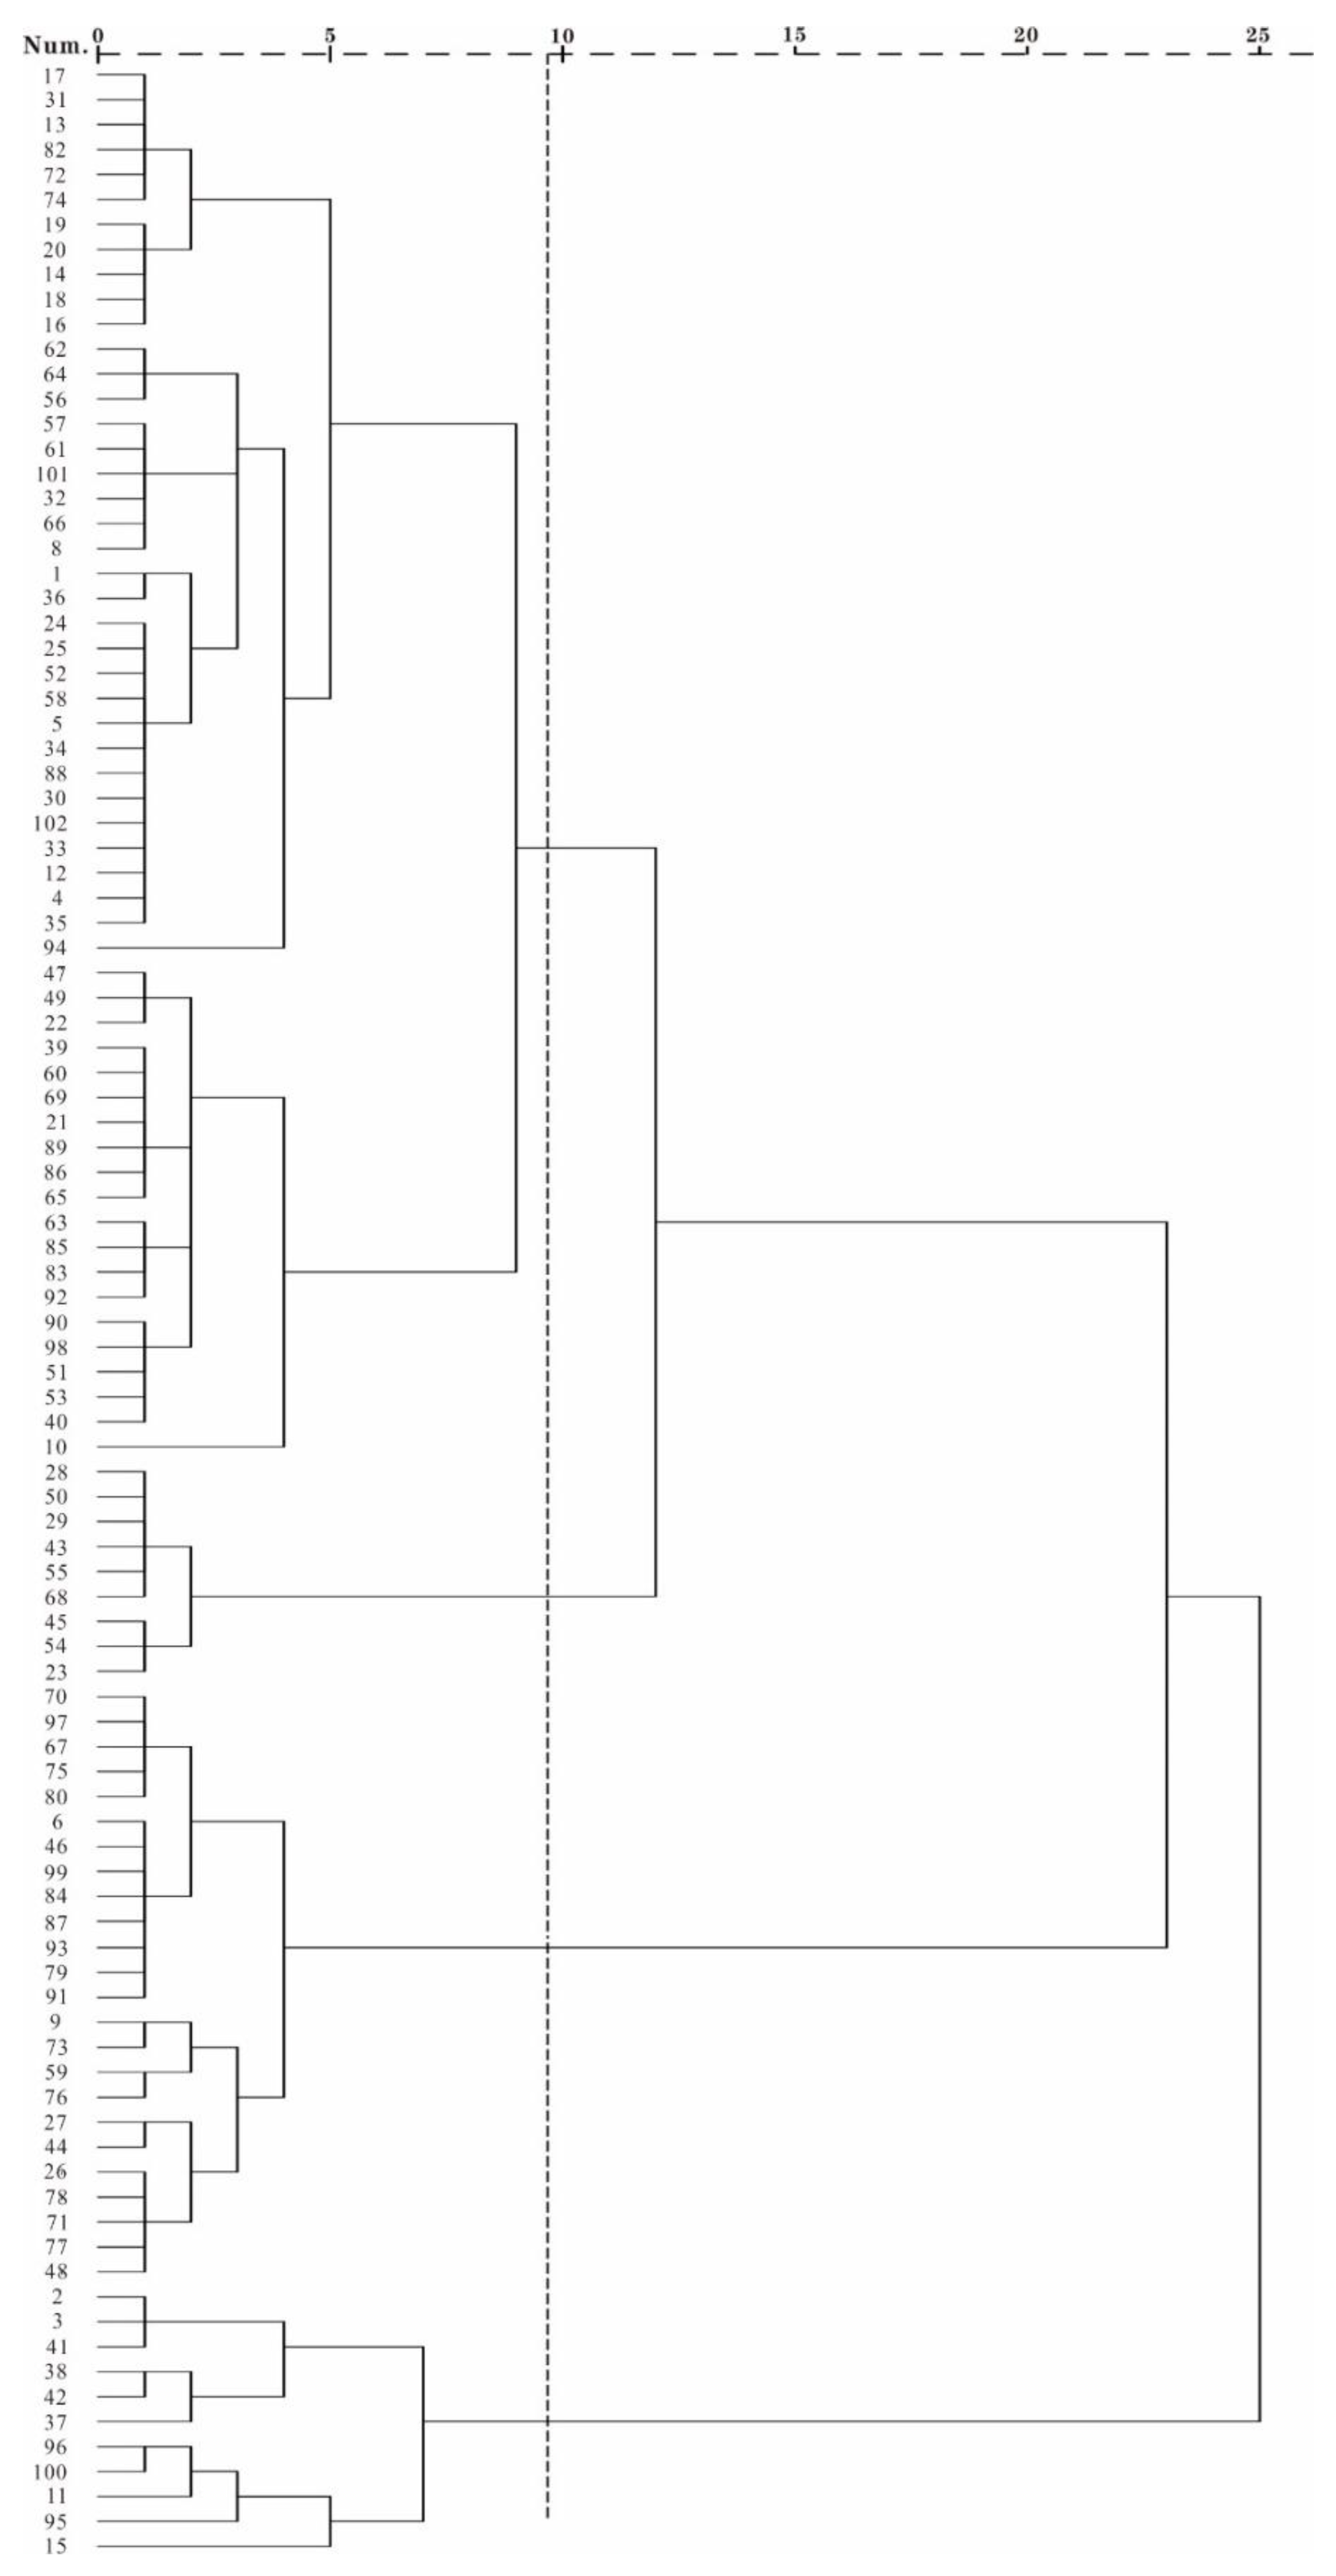
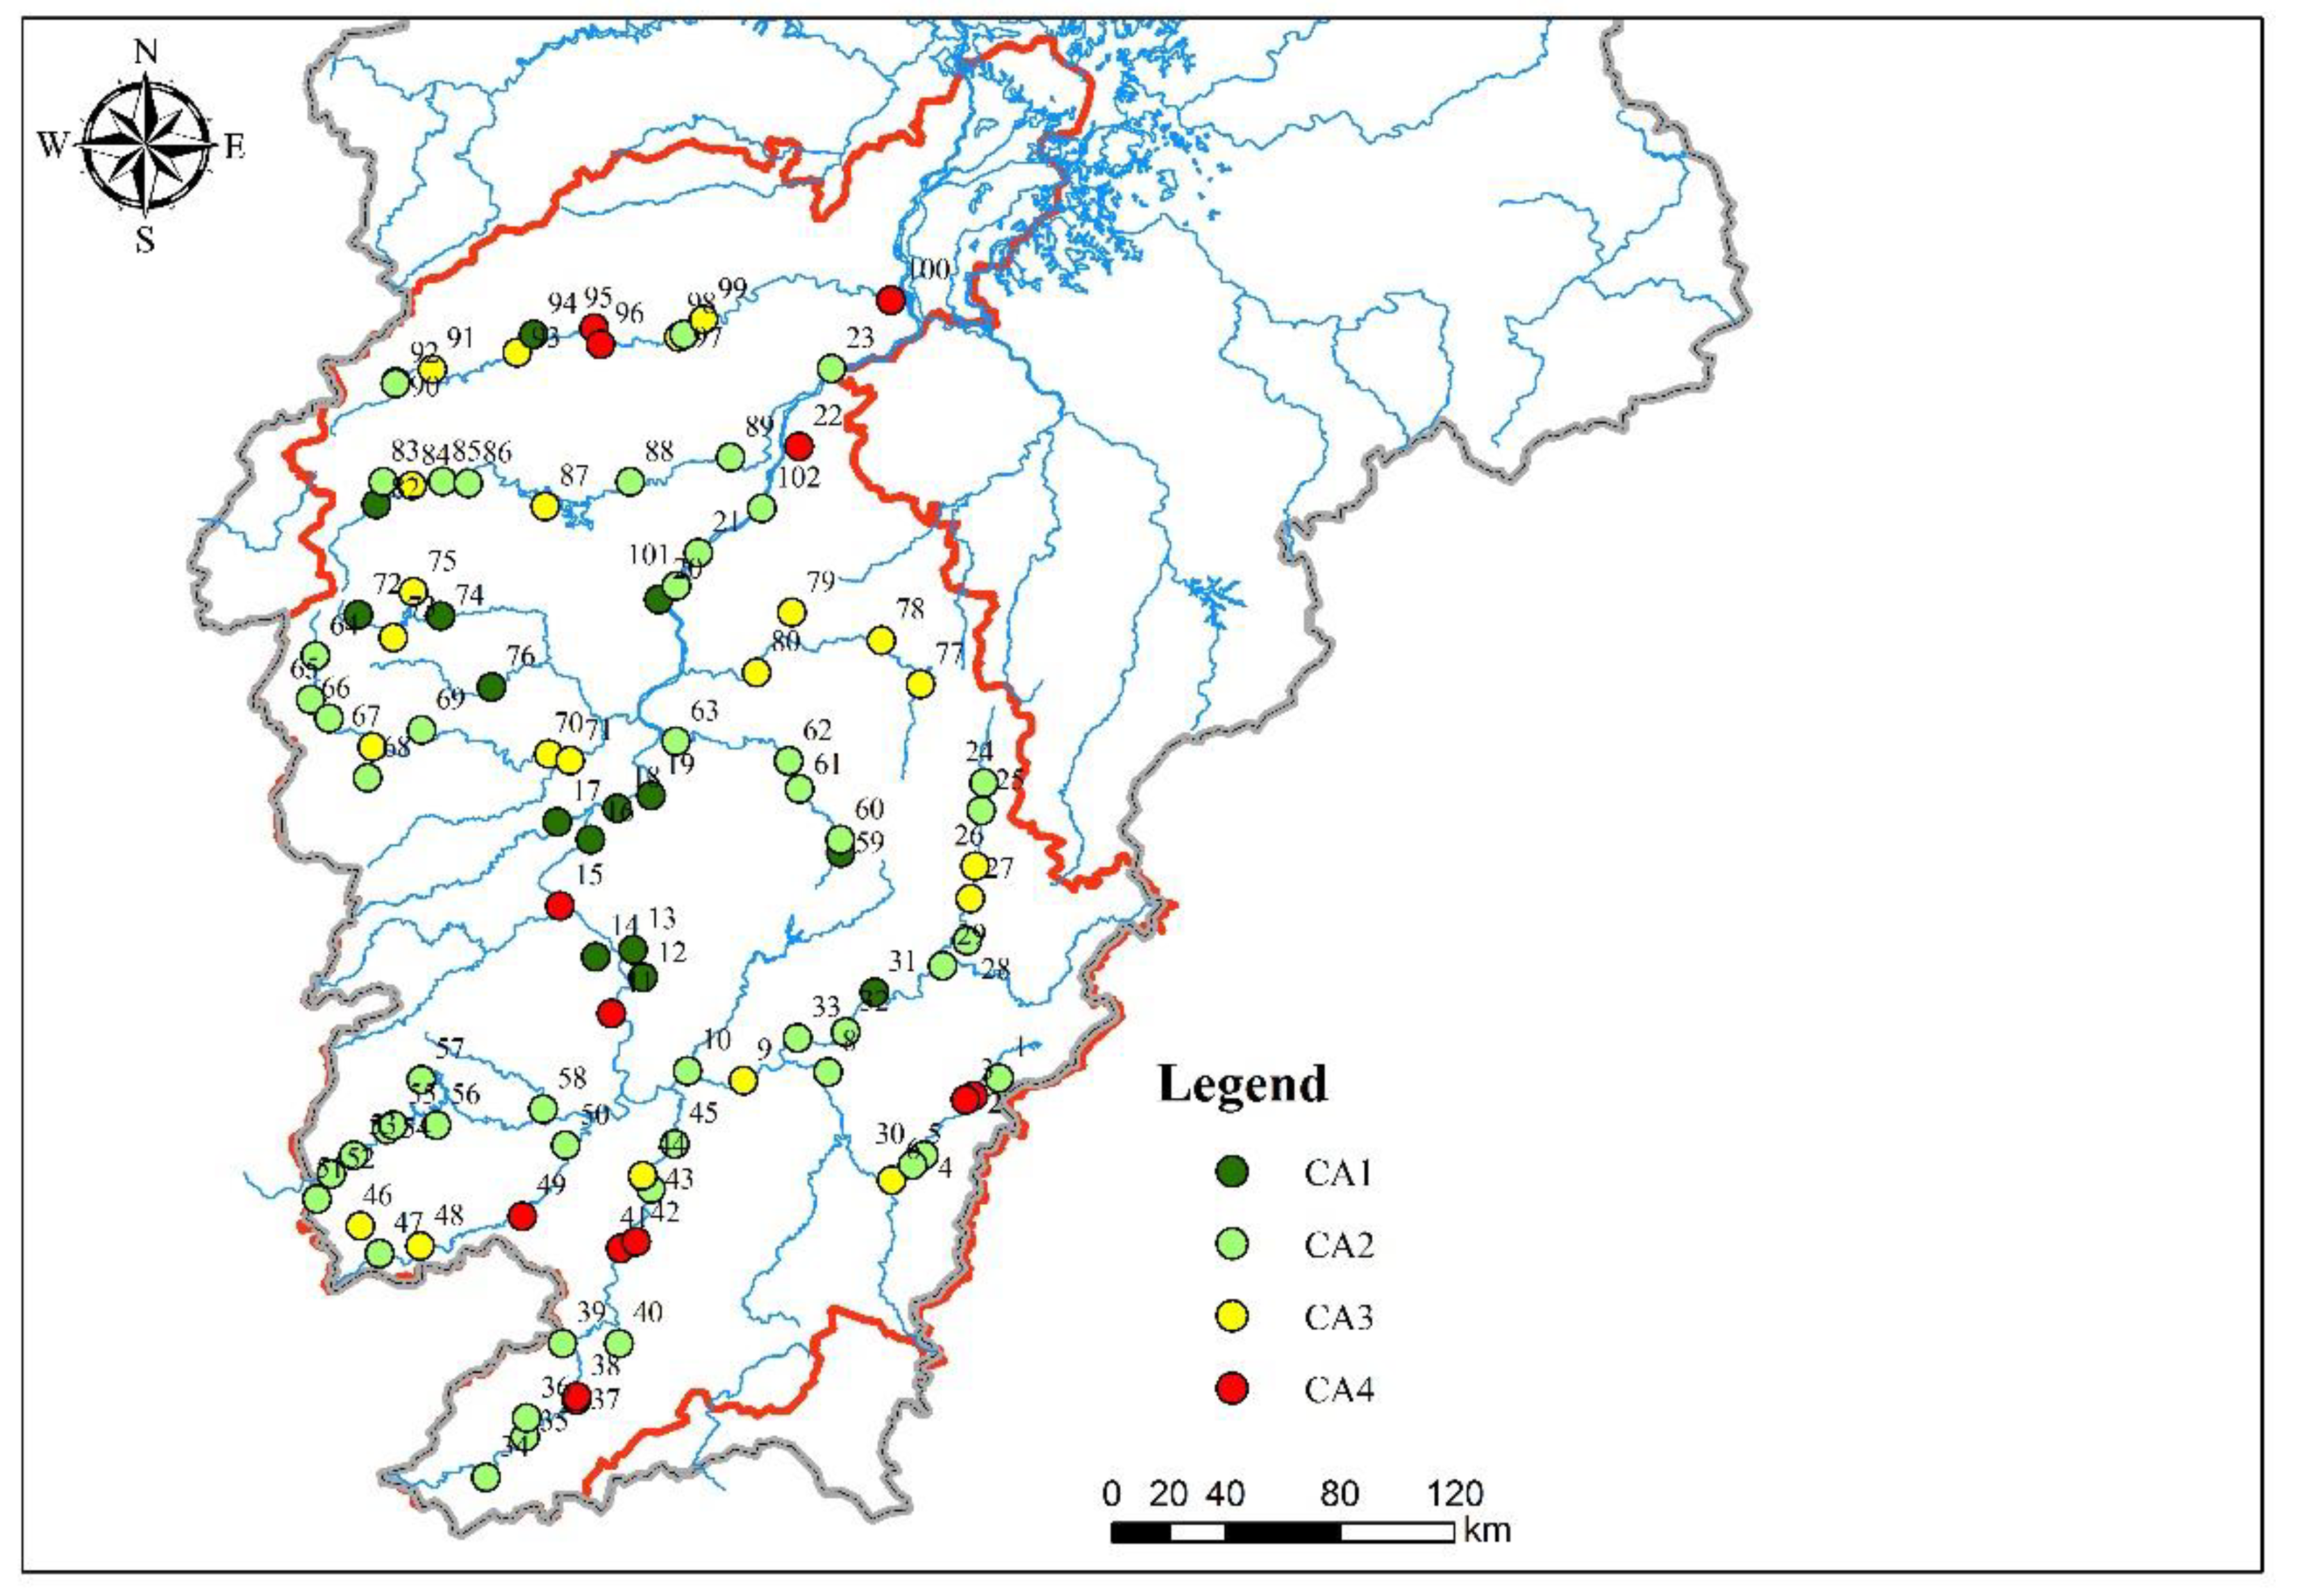
3.4.2. Cluster Analysis

Cluster analysis (CA) is an evaluation technique that can classify groups with similarities based on variable homogeneity and can identify the similarities among individuals contained in the same cluster and the differences among individuals in different clusters [52]. To classify the homogeneous clusters, hierarchical analysis was carried out sequentially. Then, the Euclidean distance method was used to calculate the distances between clusters, and Ward’s method was used to analyze the clusters [53]. By using cluster analysis (CA) to generate a dendrogram (Figure 6), the Ganjiang River Basin was divided into four statistically significant clusters (Figure 7). Among them, 15% of the sampling points of CA1 (12, 13, 14, 16, 17, 18, 19, 20, 31, 59, 72, 74, 76, 82, 94) were in the area and were mainly located in Lushui and the middle reaches of the main stream of the Ganjiang River (Figure 1). In CA2 (1, 4, 5, 8, 10, 21, 23, 24, 25, 28, 29, 30, 32, 33, 34, 35, 36, 39, 40, 43, 45, 47, 50, 51, 52, 53, 54, 55, 56, 57, 58, 60, 61, 62, 63, 64, 65, 66, 68, 69, 83, 85, 86, 88, 89, 90, 92, 98, 101, and 102), 50% of the sampling points were in same the region and were mainly located in the upper and lower reaches of the Ganjiang River and tributaries of the Ganjiang River (e.g., Taojiang, Yuanshui, Meijiang, Heshui, Shangyoujiang, Gujiang, Zhangshui) (Figure 1). In CA3 (6, 9, 26, 27, 44, 46, 48, 67, 70, 71, 73, 75, 77, 78, 79, 80, 84, 87, 91, 93, 97, and 99), 22% of the sampling points were located in the same area and were located mainly in Jinjiang, Zhangshui, and Enjiang (Figure 1). CA4 (2, 3, 11, 15, 22, 37, 38, 41, 42, 49, 95, 96, and 100) had 13% sampling points in the same area, which were mainly distributed in Taojiang, Jinjiang, and Ganjiang upstream of the main stream (Figure 1 and Figure 6). These results were very similar to the clustering results of the PCA. This result proves the validity of the principal component analysis results.
The contents of heavy metals and nutrient elements that were measured in CA1, CA2, and CA3 in the four clusters were much smaller than those in CA4 and were better than the national quality standards (Table 4). In CA1, CA2, and CA3, a total of 87% of the sampling points were in the same areas, which included the main stream of the Ganjiang River and all of its tributaries and indicated that the overall water quality of the Ganjiang River Basin was good. In the four clusters, the averages of the COD, BOD5, NH4+-N, TP, TN, Cu, and Cr contents in CA4 were the highest, which were 15.08 mg L−1, 2.45 mg L−1, 1.25 mg L−1, 0.21 mg L−1, 1.45 mg L−1, 86.92 μg L−1 and 12μg L−1, respectively. These results indicate that the pollution in some areas of the Ganjiang River Basin was affected by mineral processing and agricultural activities. The related agricultural activities include aquatic products and agricultural products, such as antifouling coatings, fishing nets, and agrochemicals [54]. At present, China’s agricultural nonpoint source prevention and control still lack perfect regulatory policies. Therefore, it is necessary to accelerate the establishment of monitoring and management systems for chemical inputs such as chemical fertilizers and pesticides [3].

3.4.3. Correlation Matrix

The relationships among trace elements can provide a reliable source and pathway information. The correlations among the measured water chemistry characteristics, nutrient elements, and heavy metal elements in the Ganjiang River Basin are shown in Table A5. The correlation matrix shows that there were some significant positive correlations between the selected measured values. For example, pH-DO, TP-Cr, and Cu-Cr showed significant positive correlations at p < 0.05 and T-COD. T-TP and pH-NH4+-N showed a significant negative correlation at p < 0.05. COD-BOD5, COD-NH4+-N, COD-TN, BOD5-NH4+-N, BOD5-TN, BOD5-Cu, BOD5-Cr, NH4+-N-TP, NH4+-N-TN, NH4+-N-Cu, NH4+-N-Cr, TP-TN, TP-Cu, TN-Cu, TN-Cr, and Cu-Zn were significantly positively correlated at p < 0.01, and T-COD, T-NH4+-N, T-TN, pH-COD, DO-COD, DO-NH4+-N, and DO-TN showed significant negative correlations when p < 0.01. If the correlation coefficients between the measured elements were positive, it could be preliminarily inferred that these measured values have common, interdependent, and the same behaviors during the transmission process or were affected by the same elements [55,56]. The observed correlation matrix supports the PCA results regarding the relationships among the hydrochemical eigenvalues, nutrient elements, and heavy metals in the Ganjiang River Basin.

3.4.4. Source Identification of Heavy Metals and Nutrient Elements

As shown in Table 4 and Table A5, in component 1, BOD5, TN, and Cr had moderate positive loads, and T had medium loads, which had a strong correlation. T had no positive correlations with BOD5, TN, or Cr, while BOD5 and TN were considered to be the main sources of urban wastewater discharges and agricultural pollution. Agricultural fertilizers and urban sewage are also important sources of Cr [57]. Therefore, component 1 mainly represents agricultural and municipal pollution. The excessive use of pesticides and fertilizers bring many heavy metals to river and water environments, which threaten the health of nearby residents [3].
In component 2, COD, NH4+-N, and TN had moderate positive loads, pH had a medium negative load, and DO had a strong negative load. COD, NH4+-N, and TN had strong correlations, while pH and COD, and DO and COD had strong negative correlations. These correlations and principal component loads reflect the influence of COD by NH4+-N and TN.
In component 3, Cu and Zn had strong positive loads and a strong correlation. Cu mainly comes from urban and industrial activities, such as the mining activities in the upper reaches of the Ganjiang River [50], while Zn mainly comes from urban sewage. Both of these results indicate that the mining industry in the Ganjiang River Basin caused Cu and Zn pollution [58].
In component 4, As had strong positive loads, but there were no elements related to As, which indicates that As was not consistent with the other elements. The emission and pollution types of heavy metals in different rivers are different. The research results show that the discharges of heavy metals from the Minjiang River are related to the types of sediments and hydrological characteristics [59].

4. Conclusions

By monitoring and evaluating the heavy metals and nutrients in the Ganjiang River system in the Poyang Lake Basin, the results showed that the Ganjiang River Basin was mostly pollution-free, but there were strong spatial variations among the different tributaries and the upper, middle, and lower reaches of the Ganjiang River. The risk assessment and identification of water qualities and sources in the Ganjiang River Basin were studied by multivariate statistical methods. The results showed that cluster analysis and principal component analysis were effective and consistent when used together. The main sources can be divided into urban sewage, agricultural activities, industrial activities, and traffic activities. The trace element concentrations that were measured in the surface water of the Ganjiang River were better than the national quality (GB5749-2006), WHO, and USEPA standards. The water quality was good and can be used as a habitat for aquatic organisms. According to the health risk assessment, the total noncarcinogenic risk and total carcinogenic risk for adults were lower than those for children. The total risk from the noncarcinogenic and carcinogenic heavy metals increased simultaneously, which further verified that the enrichment levels of the carcinogenic and noncarcinogenic heavy metals at the same sampling point were similar. Here, the water environment quality assessment of the entire Ganjiang River Basin can provide data support for protecting the Yangtze River Basin in China and constructing the Poyang Lake Ecological Economic Zone. As the sediment and soil are called reservoirs, it is easy for heavy metals to accumulate from the wastewater that is produced by various anthropogenic activities near urban rivers. Therefore, research on the relationship between the heavy metal pollution sources in river soil systems can be carried out in the future, and an emphasis should be placed on the collection and simulation of accurate pollutant fingerprints to protect the urban environment and ecological health in similar areas or larger watersheds.

Author Contributions

X.C.; methodology: D.W.; formal analysis: C.H.; resources: F.Z.; data curation: L.H.; writing-original draft preparation: X.C. and L.H.; writing-review and editing: D.W. and F.Z.; visualization: X.C. and F.Z.; validation: H.W. and D.W. All authors have read and agreed to the published version of the manuscript.

Funding

This study is financially supported by the Science and Technique Foundation of the Water Resources Department of Jiangxi Province (Grant Nos. 202123YBKT10) and the Natural Science Foundation of Jiangxi Province (Grant Nos. 2017BAB213027 and 20181BAB213016).

Institutional Review Board Statement

Not applicable.

Informed Consent Statement

Not applicable.

Data Availability Statement

The authors confirm that the data supporting the findings of this study are available within the article.

Acknowledgments

We would like to thank Lanzhi Zhao for her help in sampling.

Conflicts of Interests

The authors declare that they have no conflict of interest.

Abbreviations

Dissolved oxygen (DO); chemical oxygen demand (COD); five-day biochemical oxygen demand (BOD5); total nitrogen (TN); ammonia nitrogen (NH4+-N); total phosphorus (TP); cluster analysis (CA); principal component analysis (PCA); coefficient of variation (CV); comprehensive risks of nocarcinogens (Hc), comprehensive risk of carcinogens (Rc); factor analysis (FA); analysis of variance (ANOVA); temperature (T); relative standard deviation (RSD); World Health Organization (WHO); United States Environmental Protection Agency (USEPA).

Appendix A

Table A1. Assessment criteria for potential pollution of heavy metals.
Single Factor Pollution
Index (Pi)
Pollution LevelComprehensive Pollution
Index (Pn)
Pollution Level
Pi ≤ 1CleanPn ≤ 1pollution-free
1 < Pi ≤ 2Mild pollution1 < Pn ≤ 2Mild pollution
2 < Pi≤3Moderate pollution2 < Pn ≤ 3Moderate pollution
Pi > 3Heavy pollutionPn > 3Heavy pollution
Table A2. Average contents of pH, nutrient elements, and heavy metals in Ganjiang River Basin.
SitepHDOCODBOD5NH4+-NTPTNCuZnAsCr
mg·L−1µg·L−1
Main stream7.127.0410.342.110.440.130.6269.6016.120.046.36
TributariesTaojiang6.696.7412.451.740.700.040.8316.6724.670.044.67
Zhangshui6.996.419.011.990.680.100.8518.0044.000.133.80
Shangyoujiang6.936.2210.141.640.400.050.5917.5035.250.002.50
Heshui7.136.716.521.280.210.100.5431.2535.250.156.50
Lushui6.997.135.600.990.120.050.350.004.400.233.60
Yuanshui6.946.547.391.560.420.070.6733.757.750.087.13
Jinjiang6.926.4810.432.110.570.240.8241.2711.000.266.64
Enjiang6.996.307.391.340.200.100.710.0023.750.488.00
Gujiang7.116.7011.141.480.340.110.4912.0021.800.062.40
Meijiang6.816.779.331.630.190.060.3231.1136.330.084.00
Yangtze River Background Value 3.016.463.3212.6
WHO a6.5–8.53.0 0.50.2 2000 1050
China(GB5749-2006) a6–95.020410.21100010001050
a Drinking water quality standard.
Table A3. Model parameters of RFDi and qi.
NoncarcinogenRFDi/[mg·(kg·d)−1]Carcinogenqi/[mg·(kg·d)−1]
Cu0.005As15
Zn0.3Cr41
Table A4. Comprehensive pollution index Pn.
SiteMain StreamTributary
Upper ReachMiddle ReachLower ReachTaojiangZhangshuiShang youjiangHeshuiLushuiYuanshuiJinjiangEnjiangGujiangMeijiang
Pn0.1580.0660.1250.0870.1210.0360.1230.0570.1150.1130.1180.050.071
Table A5. Correlation analysis of temperature, hydrochemical characteristic value, nutrient elements, and heavy metals.
TpHDOCODBOD5NH4+-NTPTNCuZnAsCr
T1
pH0.1111
DO0.1160.22 *1
COD−0.24 *−0.27 **−0.28 **1
BOD5−0.36 **−0.0240.0290.28 **1
NH4+-N−0.37 **−0.20 *−0.34 **0.54 **0.363 **1
TP−0.23 *−0.032−0.1340.1140.1090.32 **1
TN−0.35 **−0.186−0.38 **0.51 **0.35 **0.95 **0.32 **1
Cu−0.099−0.1440.1680.0670.35 **0.28 **0.26 **0.27 **1
Zn−0.042−0.1780.0250.012−0.0150.058−0.0640.0380.39 **1
As−0.0780.002−0.046−0.079−0.03−0.090.0580.063−0.071−0.0311
Cr−0.150.045−0.0560.1380.276 **0.292 **0.196 *0.341 **0.203 *−0.0290.1051
Note: ** indicates significant correlations at the 0.01 level (bilateral); and * indicates significant correlations at the 0.05 level (bilateral).

References

  1. Ishida, S.; Tsuchihara, T.; Imaizumi, M. Fluctuation of NO3-N in groundwater of the reservoir of the Sunagawa Subsurface Dam, Miyako Island, Japan. Paddy Water Environ. 2006, 4, 101–110. [Google Scholar] [CrossRef]
  2. Zhang, R.; Li, H.X.; Wu, X.F. Current Situation Analysis on China Rural Drinking Water Quality. J. Environ. Health 2009, 26, 3–5. [Google Scholar]
  3. Wu, H.; Xu, C.; Wang, J.; Xiang, Y.; Ren, M.; Qie, H.; Zhang, Y.; Yao, R.; Li, L.; Lin, A. Health risk assessment based on source identification of heavy metals: A case study of Beiyun River, China. Ecotoxicol. Environ. Saf. 2021, 213, 112046. [Google Scholar] [CrossRef]
  4. Qiu, Y.-W. Bioaccumulation of heavy metals both in wild and mariculture food chains in Daya Bay, South China. Estuar. Coast. Shelf Sci. 2015, 163, 7–14. [Google Scholar] [CrossRef]
  5. Liu, X.; Lu, Q.; Zhou, Y.; Li, K.; Xu, Y.; Lv, Q.; Qin, J.; Ouyang, S.; Wu, X. Community characteristics of phytoplankton and management implications in Poyang Lake Basin. Limnology 2020, 21, 207–218. [Google Scholar] [CrossRef]
  6. Zhang, D.W.; Zhang, L.; He, J.H.; Luo, L.G.; Wei, Y.H. Spatial distributions and risk assessment of dissolved heavy metals in Poyang Lake. Acta Ecol. Sin. 2015, 35, 8028–8035. [Google Scholar]
  7. Li, W.; Yang, Z.; Zhou, L.; Tang, M.; Yuan, G.; Liu, C. Geochemical Characteristic and Fluxes of Heavy Metals in Water System of the Poyang Lake. Geoscience 2014, 28, 512. [Google Scholar] [CrossRef]
  8. Li, T.; Yi, W.; Fu, Q.; Li, H.; Liu, Y.; Wu, Z.; Zheng, B. Load Estimation of Non-Point Heavy Metal Pollution in Beijiang River during Extreme Storm Runoff Event. Res. Environ. Sci. 2014, 27, 990–997. [Google Scholar]
  9. Yidana, S.M.; Ophori, D.; Banoeng-Yakubo, B.K. A multivariate statistical analysis of surface water chemistry data—The Ankobra Basin, Ghana. J. Environ. Manag. 2008, 86, 80–87. [Google Scholar] [CrossRef] [PubMed]
  10. Vega, M.; Pardo, R.; Barrado, E.; Debán, L. Assessment of seasonal and polluting effects on the quality of river water by exploratory data analysis. Water Res. 1998, 32, 3581–3592. [Google Scholar] [CrossRef]
  11. López, J.A.L.; Vargas, M.G.; Moreno, C. A chemometric approach to the evaluation of atmospheric and fluvial pollutant inputs in aquatic systems: The Guadalquivir River estuary as a case study. Environ. Pollut. 2011, 159, 1136–1143. [Google Scholar] [CrossRef]
  12. Salim, I.; Sajjad, R.U.; Paule-Mercado, M.C.; Memon, S.A.; Lee, B.-Y.; Sukhbaatar, C.; Lee, C.-H. Comparison of two receptor models PCA-MLR and PMF for source identification and apportionment of pollution carried by runoff from catchment and sub-watershed areas with mixed land cover in South Korea. Sci. Total Environ. 2019, 663, 764–775. [Google Scholar] [CrossRef] [PubMed]
  13. Varol, M. Dissolved heavy metal concentrations of the Kralkızı, Dicle and Batman dam reservoirs in the Tigris River basin, Turkey. Chemosphere 2013, 93, 954–962. [Google Scholar] [CrossRef]
  14. Krishna, A.K.; Satyanarayanan, M.; Govil, P.K. Assessment of heavy metal pollution in water using multivariate statistical techniques in an industrial area: A case study from Patancheru, Medak District, Andhra Pradesh, India. J. Hazard. Mater. 2009, 167, 366–373. [Google Scholar] [CrossRef]
  15. Wang, P.; Liu, J.; Qi, S.; Wang, S.; Chen, X. Tracing sources of nitrate using water chemistry, land use and nitrogen isotopes in the Ganjiang River, China. Isot. Environ. Health Stud. 2017, 53, 539–551. [Google Scholar] [CrossRef]
  16. Yong, J.; Jie, Z.; Huang, X.; Bai, C.; Chen, X. Investigation and assessment of heavy metals in surface sediments of Ganjiang River, China. J. Environ. Biol. 2014, 35, 1173–1179. [Google Scholar]
  17. Li, Y.; Kuang, H.; Hu, C.; Ge, G. Source Apportionment of Heavy Metal Pollution in Agricultural Soils around the Poyang Lake Region Using UNMIX Model. Sustainability 2021, 13, 5272. [Google Scholar] [CrossRef]
  18. Hu, M.; Wang, C.; Liu, Y.; Zhang, X.; Jian, S. Fish species composition, distribution and community structure in the lower reaches of Ganjiang River, Jiangxi, China. Sci. Rep. 2019, 9, 10100. [Google Scholar] [CrossRef] [Green Version]
  19. Chu, X.; Wang, H.; Zheng, F.; Huang, C.; Xu, C.; Wu, D. Spatial Distribution Characteristics and Sources of Nutrients and Heavy Metals in the Xiujiang River of Poyang Lake Basin in the Dry Season. Water 2021, 13, 1654. [Google Scholar] [CrossRef]
  20. WHO. Guidelines for Drinking-Water Quality, 4th, ed.; WHO: Geneva, Switzerland, 2011. [Google Scholar]
  21. Gibbs, R.J. Mechanisms Controlling World Water Chemistry. Science 1970, 170, 1088–1090. [Google Scholar] [CrossRef] [PubMed]
  22. Galambos, I.; Molina, J.M.; Járay, P.; Vatai, G.; Bekássy-Molnár, E. High organic content industrial wastewater treatment by membrane filtration. Desalination 2004, 162, 117–120. [Google Scholar] [CrossRef]
  23. Franken, G.; Postma, D.; Duijnisveld, W.H.; Böttcher, J.; Molson, J. Acid groundwater in an anoxic aquifer: Reactive transport modelling of buffering processes. Appl. Geochem. 2009, 24, 890–899. [Google Scholar] [CrossRef]
  24. Le, S.K.; Pan, J.Y.; Chen, Y.P.; Yan, Z.B. Study on sulfur isotopes in rain water and lake water in Nanchang city. Earth Environ. 2007, 35, 297–302. [Google Scholar]
  25. Yang, Q.; Liu, Z.; Yang, J. Simultaneous Determination of Chemical Oxygen Demand (COD) and Biological Oxygen Demand (BOD5) in Wastewater by Near-Infrared Spectrometry. J. Water Resour. Prot. 2009, 1, 286–289. [Google Scholar] [CrossRef] [Green Version]
  26. Xiang, S.L.; Wang, Q.J.; Xu, L.-K.; Nie, F.H. Nitrogen & Phosphorus Loading and Migration of Farmland Ditch Runoff in Ganjiang River. J. Henan Agric. Sci. 2012, 41, 72–74. Available online: http://en.cnki.com.cn/Article_en/CJFDTOTAL-HNNY201203020.htm (accessed on 27 November 2021). (In Chinese).
  27. Pekey, H.; Karakaş, D.; Bakoglu, M. Source apportionment of trace metals in surface waters of a polluted stream using multivariate statistical analyses. Mar. Pollut. Bull. 2004, 49, 809–818. [Google Scholar] [CrossRef]
  28. Liang, B.; Han, G.; Liu, M.; Yang, K.; Li, X.; Liu, J. Distribution, Sources, and Water Quality Assessment of Dissolved Heavy Metals in the Jiulongjiang River Water, Southeast China. Int. J. Environ. Res. Public Health 2018, 15, 2752. [Google Scholar] [CrossRef] [PubMed] [Green Version]
  29. Gao, L.; Chen, J.; Tang, C.; Ke, Z.; Wang, J.; Shimizu, Y.; Zhu, A. Distribution, migration and potential risk of heavy metals in the Shima River catchment area, South China. Environ. Sci. Process. Impacts 2015, 17, 1769. [Google Scholar] [CrossRef]
  30. Wan, Z.; Chen, X.; Ju, M.; Ling, C.; Liu, G.; Lin, S.; Liu, H.; Jia, Y.; Jiang, M.; Liao, F. Streamflow Reconstruction and Variation Characteristic Analysis of the Ganjiang River in China for the Past 515 Years. Sustainability 2020, 12, 1168. [Google Scholar] [CrossRef] [Green Version]
  31. Zhang, Y.Q.; Xiang, Y.; Chen, C.C.; Wei, R.C. Research on spatial-temporal variation of drought and flood events over Ganjiang basin. J. Meteorol. Sci. 2015, 35, 346–352. (In Chinese) [Google Scholar] [CrossRef]
  32. Zhang, H.; Jiang, Y.; Wang, M.; Wang, P.; Shi, G.; Ding, M. Spatial characterization, risk assessment, and statistical source identification of the dissolved trace elements in the Ganjiang River—Feeding tributary of the Poyang Lake, China. Environ. Sci. Pollut. Res. 2016, 24, 2890–2903. [Google Scholar] [CrossRef]
  33. Liu, Y.; Ma, Z.; Lv, J.; Bi, J. Identifying sources and hazardous risks of heavy metals in topsoils of rapidly urbanizing East China. J. Geogr. Sci. 2016, 26, 735–749. [Google Scholar] [CrossRef] [Green Version]
  34. Alexander, R.B.; Smith, R.A.; Schwarz, G.E.; Boyer, E.W.; Nolan, J.V.; Brakebill, J.W. Differences in Phosphorus and Nitrogen Delivery to the Gulf of Mexico from the Mississippi River Basin. Environ. Sci. Technol. 2007, 42, 822–830. [Google Scholar] [CrossRef] [Green Version]
  35. Åström, M. Abundance and fractionation patterns of rare earth elements in streams affected by acid sulphate soils. Chem. Geol. 2001, 175, 249–258. [Google Scholar] [CrossRef]
  36. Rinklebe, J.; Antoniadis, V.; Shaheen, S.M.; Rosche, O.; Altermann, M. Health risk assessment of potentially toxic elements in soils along the Central Elbe River, Germany. Environ. Int. 2019, 126, 76–88. [Google Scholar] [CrossRef]
  37. Mukherjee, I.; Singh, U.K.; Singh, R.P.; Kumari, D.; Jha, P.K.; Mehta, P. Characterization of heavy metal pollution in an anthropogenically and geologically influenced semi-arid region of east India and assessment of ecological and human health risks. Sci. Total. Environ. 2019, 705, 135801. [Google Scholar] [CrossRef]
  38. Rodriguez, R.R.; Basta, N.T.; Casteel, S.W.; Pace, L.W. An in Vitro Gastrointestinal Method to Estimate Bioavailable Arsenic in Contaminated Soils and Solid Media. Environ. Sci. Technol. 1999, 33, 642–649. [Google Scholar] [CrossRef]
  39. Bu, H.; Wang, W.; Song, X.; Zhang, Q. Characteristics and source identification of dissolved trace elements in the Jinshui River of the South Qinling Mts., China. Environ. Sci. Pollut. Res. 2015, 22, 14248–14257. [Google Scholar] [CrossRef]
  40. Giri, S.; Singh, A.K. Risk assessment, statistical source identification and seasonal fluctuation of dissolved metals in the Subarnarekha River, India. J. Hazard. Mater. 2014, 265, 305–314. [Google Scholar] [CrossRef] [PubMed]
  41. Krishna, A.K.; Mohan, K.R. Risk assessment of heavy metals and their source distribution in waters of a contaminated industrial site. Environ. Sci. Pollut. Res. 2013, 21, 3653–3669. [Google Scholar] [CrossRef] [PubMed]
  42. Varol, M. Assessment of heavy metal contamination in sediments of the Tigris River (Turkey) using pollution indices and multivariate statistical techniques. J. Hazard. Mater. 2011, 195, 355–364. [Google Scholar] [CrossRef]
  43. Buzier, R.; Tusseau-Vuillemin, M.-H.; Meriadec, C.M.D.; Rousselot, O.; Mouchel, J.-M. Trace metal speciation and fluxes within a major French wastewater treatment plant: Impact of the successive treatments stages. Chemosphere 2006, 65, 2419–2426. [Google Scholar] [CrossRef] [PubMed]
  44. Micó, C.; Recatalá, L.; Peris, M.; Sánchez, J. Assessing heavy metal sources in agricultural soils of an European Mediterranean area by multivariate analysis. Chemosphere 2006, 65, 863–872. [Google Scholar] [CrossRef] [PubMed]
  45. Wang, X.-L.; Lu, Y.-L.; Han, J.-Y.; He, G.-Z.; Wang, T.-Y. Identification of anthropogenic influences on water quality of rivers in Taihu watershed. J. Environ. Sci. 2007, 19, 475–481. [Google Scholar] [CrossRef]
  46. Taneez, M.; Marmier, N.; Hurel, C. Use of neutralized industrial residue to stabilize trace elements (Cu, Cd, Zn, As, Mo, and Cr) in marine dredged sediment from South-East of France. Chemosphere 2016, 150, 116–122. [Google Scholar] [CrossRef]
  47. Zhao, G.; Ye, S.; Yuan, H.; Ding, X.; Wang, J.; Laws, E.A. Surface sediment properties and heavy metal contamination assessment in river sediments of the Pearl River Delta, China. Mar. Pollut. Bull. 2018, 136, 300–308. [Google Scholar] [CrossRef] [PubMed]
  48. Qu, L.; Huang, H.; Xia, F.; Liu, Y.; Dahlgren, R.; Zhang, M.; Mei, K. Risk analysis of heavy metal concentration in surface waters across the rural-urban interface of the Wen-Rui Tang River, China. Environ. Pollut. 2018, 237, 639–649. [Google Scholar] [CrossRef] [PubMed] [Green Version]
  49. Cheung, K.; Poon, B.; Lan, C.; Wong, M. Assessment of metal and nutrient concentrations in river water and sediment collected from the cities in the Pearl River Delta, South China. Chemosphere 2003, 52, 1431–1440. [Google Scholar] [CrossRef]
  50. Huang, S.; Liao, Q.; Hua, M.; Wu, X.; Bi, K.; Yan, C.; Chen, B.; Zhang, X. Survey of heavy metal pollution and assessment of agricultural soil in Yangzhong district, Jiangsu Province, China. Chemosphere 2007, 67, 2148–2155. [Google Scholar] [CrossRef]
  51. Neal, C.; Neal, M.; Hill, L.; Wickham, H. The water quality of the River Thame in the Thames Basin of south/south-eastern England. Sci. Total. Environ. 2006, 360, 254–271. [Google Scholar] [CrossRef] [PubMed]
  52. Casado-Martínez, M.; Forja, J.; Del Valls, T. A multivariate assessment of sediment contamination in dredged materials from Spanish ports. J. Hazard. Mater. 2009, 163, 1353–1359. [Google Scholar] [CrossRef]
  53. Li, J.; He, M.; Han, W.; Gu, Y. Analysis and assessment on heavy metal sources in the coastal soils developed from alluvial deposits using multivariate statistical methods. J. Hazard. Mater. 2009, 164, 976–981. [Google Scholar] [CrossRef] [PubMed]
  54. Toro, P.P.V.; Bedoya, L.F.V.; Correa, I.D.; Franco, G.R.B.; Alcántara-Carrió, J.; Baena, J.A.P. Impact of terrestrial mining and intensive agriculture in pollution of estuarine surface sediments: Spatial distribution of trace metals in the Gulf of Urabá, Colombia. Mar. Pollut. Bull. 2016, 111, 311–320. [Google Scholar] [CrossRef] [PubMed]
  55. Lu, X.; Wang, L.; Li, L.Y.; Lei, K.; Huang, L.; Kang, D. Multivariate statistical analysis of heavy metals in street dust of Baoji, NW China. J. Hazard. Mater. 2010, 173, 744–749. [Google Scholar] [CrossRef] [PubMed]
  56. Saeedi, M.; Li, L.; Zadeh, M. Heavy metals and polycyclic aromatic hydrocarbons: Pollution and ecological risk assessment in street dust of Tehran. J. Hazard. Mater. 2012, 227–228, 9–17. [Google Scholar] [CrossRef]
  57. Kidd, P.; Domínguez-Rodríguez, M.; Díez, J.; Monterroso, C. Bioavailability and plant accumulation of heavy metals and phosphorus in agricultural soils amended by long-term application of sewage sludge. Chemosphere 2007, 66, 1458–1467. [Google Scholar] [CrossRef] [PubMed]
  58. Kim, I.-G.; Kim, Y.-B.; Kim, R.-H.; Hyon, T.-S. Spatial distribution, origin and contamination assessment of heavy metals in surface sediments from Jangsong tidal flat, Kangryong river estuary, DPR Korea. Mar. Pollut. Bull. 2021, 168, 112414. [Google Scholar] [CrossRef] [PubMed]
  59. Fan, J.; Jian, X.; Shang, F.; Zhang, W.; Zhang, S.; Fu, H. Underestimated heavy metal pollution of the Minjiang River, SE China: Evidence from spatial and seasonal monitoring of suspended-load sediments. Sci. Total Environ. 2020, 760, 142586. [Google Scholar] [CrossRef] [PubMed]
Figure 1. Distribution of sampling points in the Ganjiang River System.
Water 13 03367 g001
Figure 2. Box diagram of measured values of Ganjiang River System. (the pH is dimensionless, and the unit of Cu, Zn, As, and Cr in the large box diagram is μg L−1, and other elements are mg L−1).
Water 13 03367 g002
Figure 3. The variation trend of concentration of nutrients in the Ganjiang river basin. ((A), DO; (B), COD; (C), BOD5; (D), NH4+-N; (E), TP; (F), TN) (mg L−1).
Water 13 03367 g003
Figure 4. The variation trend of concentration of Cu, Zn, Cr6+ and As in the Ganjiang river basin. ((A), Cu; (B), Zn; (C), Cr6+; (D), As) (μg·L−1).
Water 13 03367 g004
Figure 5. Concentration variation of NH4+-N, TP, and TN.
Water 13 03367 g005
Figure 6. Dendrogram of sampling points in Ganjiang River.
Water 13 03367 g006
Figure 7. The cluster of sampling points in the Ganjiang River.
Water 13 03367 g007
Table 1. Characteristics of hydrochemistry, nutrient elements, and heavy metals in Ganjiang River Basin.
ReachValuepHDOCODBOD5NH4+-NTPTNCuZnCrAs
mg·L−1µg·L−1
Upper reachMax7.479.0620.793.771.670.391.9625050400.35
Min6.874.16.190.930.070.010.250000
Mean7.167.0311.312.310.480.130.6958.3311.589.750.08
Mean square error0.191.544.420.900.550.130.5861.4914.0612.150.14
RSD0.030.230.390.391.140.980.841.051.211.251.73
Counts1212121212121212121212
Middle reachMax7.678.1314.574.331.420.31.7252070200.03
Min6.46.526.6810.030.040.190000
Mean7.087.079.061.850.340.10.578.0014.402.700.00
Mean square error0.400.502.130.940.390.080.43149.4520.996.360.01
RSD0.060.070.240.511.170.800.871.921.462.353.00
Counts1010101010101010101010
Lower reachMax7.337.4812.152.571.240.281.43200100200
Min6.836.258.681.830.10.140.220000
Mean7.086.9510.72.140.590.200.7586.6740.005.000.00
Mean square error0.200.521.470.310.480.060.5183.8043.207.070.00
RSD0.030.070.140.150.810.290.680.971.081.41
Counts33333333333
TributariesMax8.279.0820.53.631.550.761.638090200.6
Min6.034.23000.090.0100000
Mean6.936.659.481.640.420.10.6322.224.25.80.13
Mean square error0.301.133.550.890.490.110.53108.2423.9710.200.11
RSD0.040.160.340.421.130.860.851.561.491.602.62
Counts7575757575757575757575
Table 2. Annual average personal health risk of heavy metal pollutants for adults and children.
Ganjiang River BasinNoncarcinogen RiskCarcinogen RiskRtotal (10−6)
Cu (10−9)Zn (10−11)As (10−6)Cr (10−6)
AdultsChildrenAdultsChildrenAdultsChildrenAdultsChildrenAdultsChildren
Main streamUpper reach5.396.881.792.280.570.73181.65230.73182.22231.47
Middle reach7.219.212.222.830.020.0350.5564.3050.5864.34
Lower reach8.0110.236.167.870.000.0093.79119.3693.80119.37
TributaryTaojiang1.541.973.804.850.240.3187.40111.1987.65111.50
Zhangshui1.662.126.788.650.871.1171.5691.1672.4392.27
Shangyoujiang1.622.075.436.930.000.0047.1760.1247.1760.13
Heshui2.893.695.436.931.061.35121.98155.24123.04156.60
Lushui0.000.000.680.871.602.0567.9486.6169.5588.65
Yuanshui3.123.981.191.520.560.71133.86170.42134.42171.14
Jinjiang3.824.871.702.161.812.31124.63158.66126.45160.97
Enjiang0.000.003.664.673.354.28150.63191.89153.98196.17
Gujiang1.111.423.364.290.430.5545.3057.7545.7358.30
Meijiang2.883.675.607.150.580.7475.3796.0475.9596.78
Table 3. Total variance explained and component matrixes for dissolved trace elements in surface water from the Ganjiang River.
ComponentInitial Eigenvalue Rotating Load Sum of Squares
TotalVariance %Cumulative % TotalVariance %Cumulative %
T3.42228.51628.516 2.62021.83121.831
pH1.51212.59641.113 2.15217.93039.761
DO1.35011.25252.365 1.46512.20951.971
COD1.0819.00861.373 1.1289.40261.373
BOD50.9397.82269.195
NH4+-N0.8597.16176.356
TP0.7386.15482.510
TN0.6545.44787.957
Cu0.5674.72892.685
Zn0.5094.23996.924
As0.3332.77799.700
Cr0.0360.300100.000
VariableRotated Component Matrix a Extract
PC1PC2PC3PC4
T−0.513−0.222−0.026−0.060 0.317
pH0.143−0.567−0.469−0.043 0.563
DO0.016−0.7540.151−0.198 0.631
COD0.3050.641−0.004−0.296 0.591
BOD50.682−0.0430.068−0.309 0.567
NH4+-N0.6470.6170.077−0.177 0.836
TP0.5110.1080.0380.289 0.357
TN0.6660.6130.058−0.031 0.824
Cu0.477−0.1660.707−0.119 0.769
Zn−0.0790.0320.8390.018 0.711
As0.111−0.021−0.0240.863 0.758
Cr0.638−0.059−0.0550.161 0.440
Table 4. Concentrations, ANOVA (analysis of variance), and significant test of the four clusters by cluster analysis in the Ganjiang River, China.
ComponentClustering
CA1 (n = 15)CA2 (n = 50)CA3 (n = 22)CA4 (n = 13)Significance Test df = 3
MeanSDMeanSDMeanSDMeanSDMSFP
T13.741.1111.810.5212.050.8011.420.770.550.520.47
pH7.030.366.990.416.990.306.770.420.302.030.16
DO6.810.626.810.996.750.956.111.322.011.950.17
COD6.832.739.623.578.181.8015.084.900.070.000.95
BOD51.280.371.830.771.520.522.450.866.8013.140.00
NH4+-N0.160.100.340.220.290.181.250.291.027.250.01
TP0.130.170.070.060.090.070.210.120.043.510.06
TN0.320.180.520.240.580.221.450.291.207.930.01
Cu24.2728.2233.7543.7616.8225.3086.92140.622.4×105128.770.00
Zn6.2010.5628.1328.3721.2324.4822.8521.152350.633.670.06
As0.040.110.000.000.390.080.130.190.010.200.65
Cr1.603.384.757.514.913.4412.0010.03249.744.910.03
Note: T (°C); pH is dimensionless; the unit of DO, COD, BOD5, NH4+-N, TP, TN is mg·L−1; the unit of Cu, Zn, Cr, As isμg·L−1. SD is the mean square error, df is the degree of freedom, MS is mean square.
Publisher’s Note: MDPI stays neutral with regard to jurisdictional claims in published maps and institutional affiliations.

