Article

Integrated Decision Support System for Pluvial Flood-Resilient Spatial Planning in Urban Areas

Department of Civil Engineering and Architecture, Tallinn University of Technology, Ehitajate tee 5, 19086 Tallinn, Estonia
*
Author to whom correspondence should be addressed.
Water 2021, 13(23), 3340; https://doi.org/10.3390/w13233340
Submission received: 14 October 2021 / Revised: 17 November 2021 / Accepted: 19 November 2021 / Published: 25 November 2021
(This article belongs to the Special Issue Urban Drainage Systems in Smart Cities)

Abstract

:
Flood-resilient spatial planning in urban areas involves designing and implementing structural and nonstructural measures. For the latter, urban planners apply a precautionary principle, which is normally not grounded in the actual performance of the urban drainage system (UDS). This approach, however, fails during weather extremes with heavy precipitation. This paper presents a new concept for reducing pluvial flood risks in the urban planning process. The novelty of the developed planning support system named Extreme Weather Layer (EWL) is that it creates dynamic interlinkages between land developments, the performance of UDS, and other factors that contribute to flood risk. The EWL is built on the digital twin of the existing UDS and delivers an easy-to-use concept, where the end user can analyze hydraulic modelling results interlinked with climate scenarios using the GIS platform. This allows planning specialists to consider land use and soil types in the urban environment to simulate the response of the storm water system and the catchments to different rainfall events. This proposed approach was piloted in Haapsalu (Estonia) and Söderhamn (Sweden). The resulting planning support system, which performs as a set of layers within municipalities’ GIS, allows decision makers to understand and predict the impact of various spatial planning decisions on the pluvial flood risk.

1. Introduction

The new EU Strategy on the Adaptation to Climate Change calls for smarter, faster, and more systematic responses to the effects of climate change [1]. The member states are commissioned to “prevent the un-adaptable and adapt to the un-preventable”. Plenty of policy level guidelines and tools exist for applying various adaptation frameworks for adapting cities to climate change, considering the climate scenarios, potential risks and human development pathways. Easy-to-understand guidelines were developed to help public authorities consider the role of climate scenarios in urban adaptation [2]. The European Commission along with the European Environmental Agency streamlined the iterative framework in the form of the Climate-Adapt Support Tool, which includes specific features for city-scale adaptation [3]. However, when preparing cities for flooding events that are caused by intense short-term precipitation, such general frameworks fail to consider all of the key factors exacerbating the flood risk in urban areas.
Although climate change causes a variety of urban vulnerabilities, the present paper focuses on mitigating the effects of extreme events of more frequent and intense rainfall. These events trigger floods of natural water bodies and the surcharge of urban drainage [4]. Flooding has strong social impacts, potentially damaging infrastructure, contributing to job losses, and restricting access to vital services, such as energy, transport and clean water. Furthermore, when excessive urban runoff ends up in natural water bodies, flooding negatively affects natural ecosystems [5].
Flash flooding, where the volume of rainwater exceeds the capacity of sewage systems in urban areas, is a universal climate adaption challenge for a major part of Europe, as well as many other regions of the world [6,7]. The United Nations Office for Disaster Risk Reduction [8] defines the disaster risk as a combination of potential hazards, exposure and vulnerability. When aiming to mitigate this risk, it is possible to either focus on one of the components or transform the urban environment by applying an integrated approach. The number of studies related to the resilience of cities increased exponentially during the past decade; from 1–2 papers a year at the beginning of 2000s to 35 annual papers in 2014, increasing to 152 papers in 2020 [9,10]. More specifically, the climate resilience of urban drainage systems was the focus of many recent case studies and research projects, based on which general frameworks were also proposed [11].
One of the solutions for mitigating the flash flood risk in an integrated manner is climate-considerate spatial planning that considers the performance of the urban drainage system (UDS) and changes in the urban environment. Gandini et al. [12] assessed the vulnerability of cities to flooding, concluding that the next steps in ensuring the adequate management of flooding impacts in urban areas is the potential risk identification through the analysis of climate change scenarios. Climate-considerate planning can be conducted on a broader level, adjusting the overall planning philosophy or narrowing the focus to some key factors of the planning process. Albrechts [13] proposed a methodology for the transition from traditional land use planning to strategic planning by integrating stakeholders into the planning process. Coaffee [14] stressed that, to realize urban resilience planners, climate scientists and engineers need to come together to form an integrated urban management nexus.
The literature advocating climate resilience-oriented urban governance manifests a wide range of approaches, suggesting that organizational arrangements and processes can be effective in very different forms. Leichenko [15] suggested that the key to resilience is achieved by combining a variety of social, technical, financial, and political innovations. Planning support systems (PSS) can improve stormwater-resilient urban design through the improved visualization of risk areas, thus simplifying spatial data analysis. Several PSS were developed, with a special focus on improving the integration of nature-based solutions (NBS) [16,17,18] or focusing on the capacity of existing green infrastructure [19], cultural heritage sites risk assessments [20], early warning systems [21,22] and urban storm water management [23,24,25].
Such decision support tools mostly focus on structural measures, proposing and assessing adaptation options that require either investments in the UDS or demand changes in the urban space. Conversely, the continuously changing urban space, with its increasing impervious surfaces and built-up areas, requires a support system for making land use decisions on a routine basis. However, available planning support tools are either purely technical or overly simplified, often only operational as stand-alone applications with limited support after the research project has ended, or focused on a scope that is too narrow to support decision makers.
Despite the supporting policy framework and increasing number of positive examples published in a variety of papers, the current practices in spatial planning that consider climate change are still fragmented. This is most evident in small-scale planning procedures affecting urban land use at the plot, property and land-unit level. Although large-scale spatial plans address climate scenarios, this approach is too generalized to be implemented in small-scale planning. Therefore, in most cases, detailed land-unit development plans do not consider climate risks or address issues within the planned property. Such an approach is clearly insufficient to achieve urban resilience to pluvial flooding, as the planning decisions of land units can significantly affect urban space in the entire catchment. The impact of planning decisions on the catchment can be expressed in both the quantity and in the quality of storm water runoff. As the flow volume correlates to pollutant discharge, flooding increases the rate of pollutants reaching the surrounding water bodies. Shifting from fragmented site-based to integrated catchment-based methodology would enable flood-resilient planning.
In this work, we present a novel approach of how to consider different factors that influence the level of flood risk in urban areas through integrated planning using a PSS named the Extreme Weather Layer (EWL). The EWL combines urban planning with pluvial flood risk assessments in densely populated areas. The layer gives information about the effect of different weather conditions and planning decisions at single properties in the same catchment of the UDS. Furthermore, the plots with a higher flood risk and the need to implement mitigation measures are visible in the graphic output of the layer. The layer also provides an opportunity to assess which technical requirements for a design can be issued for a specific area and how each individual property affects the resilience of the whole urban area and vice versa.

2. Materials and Methods

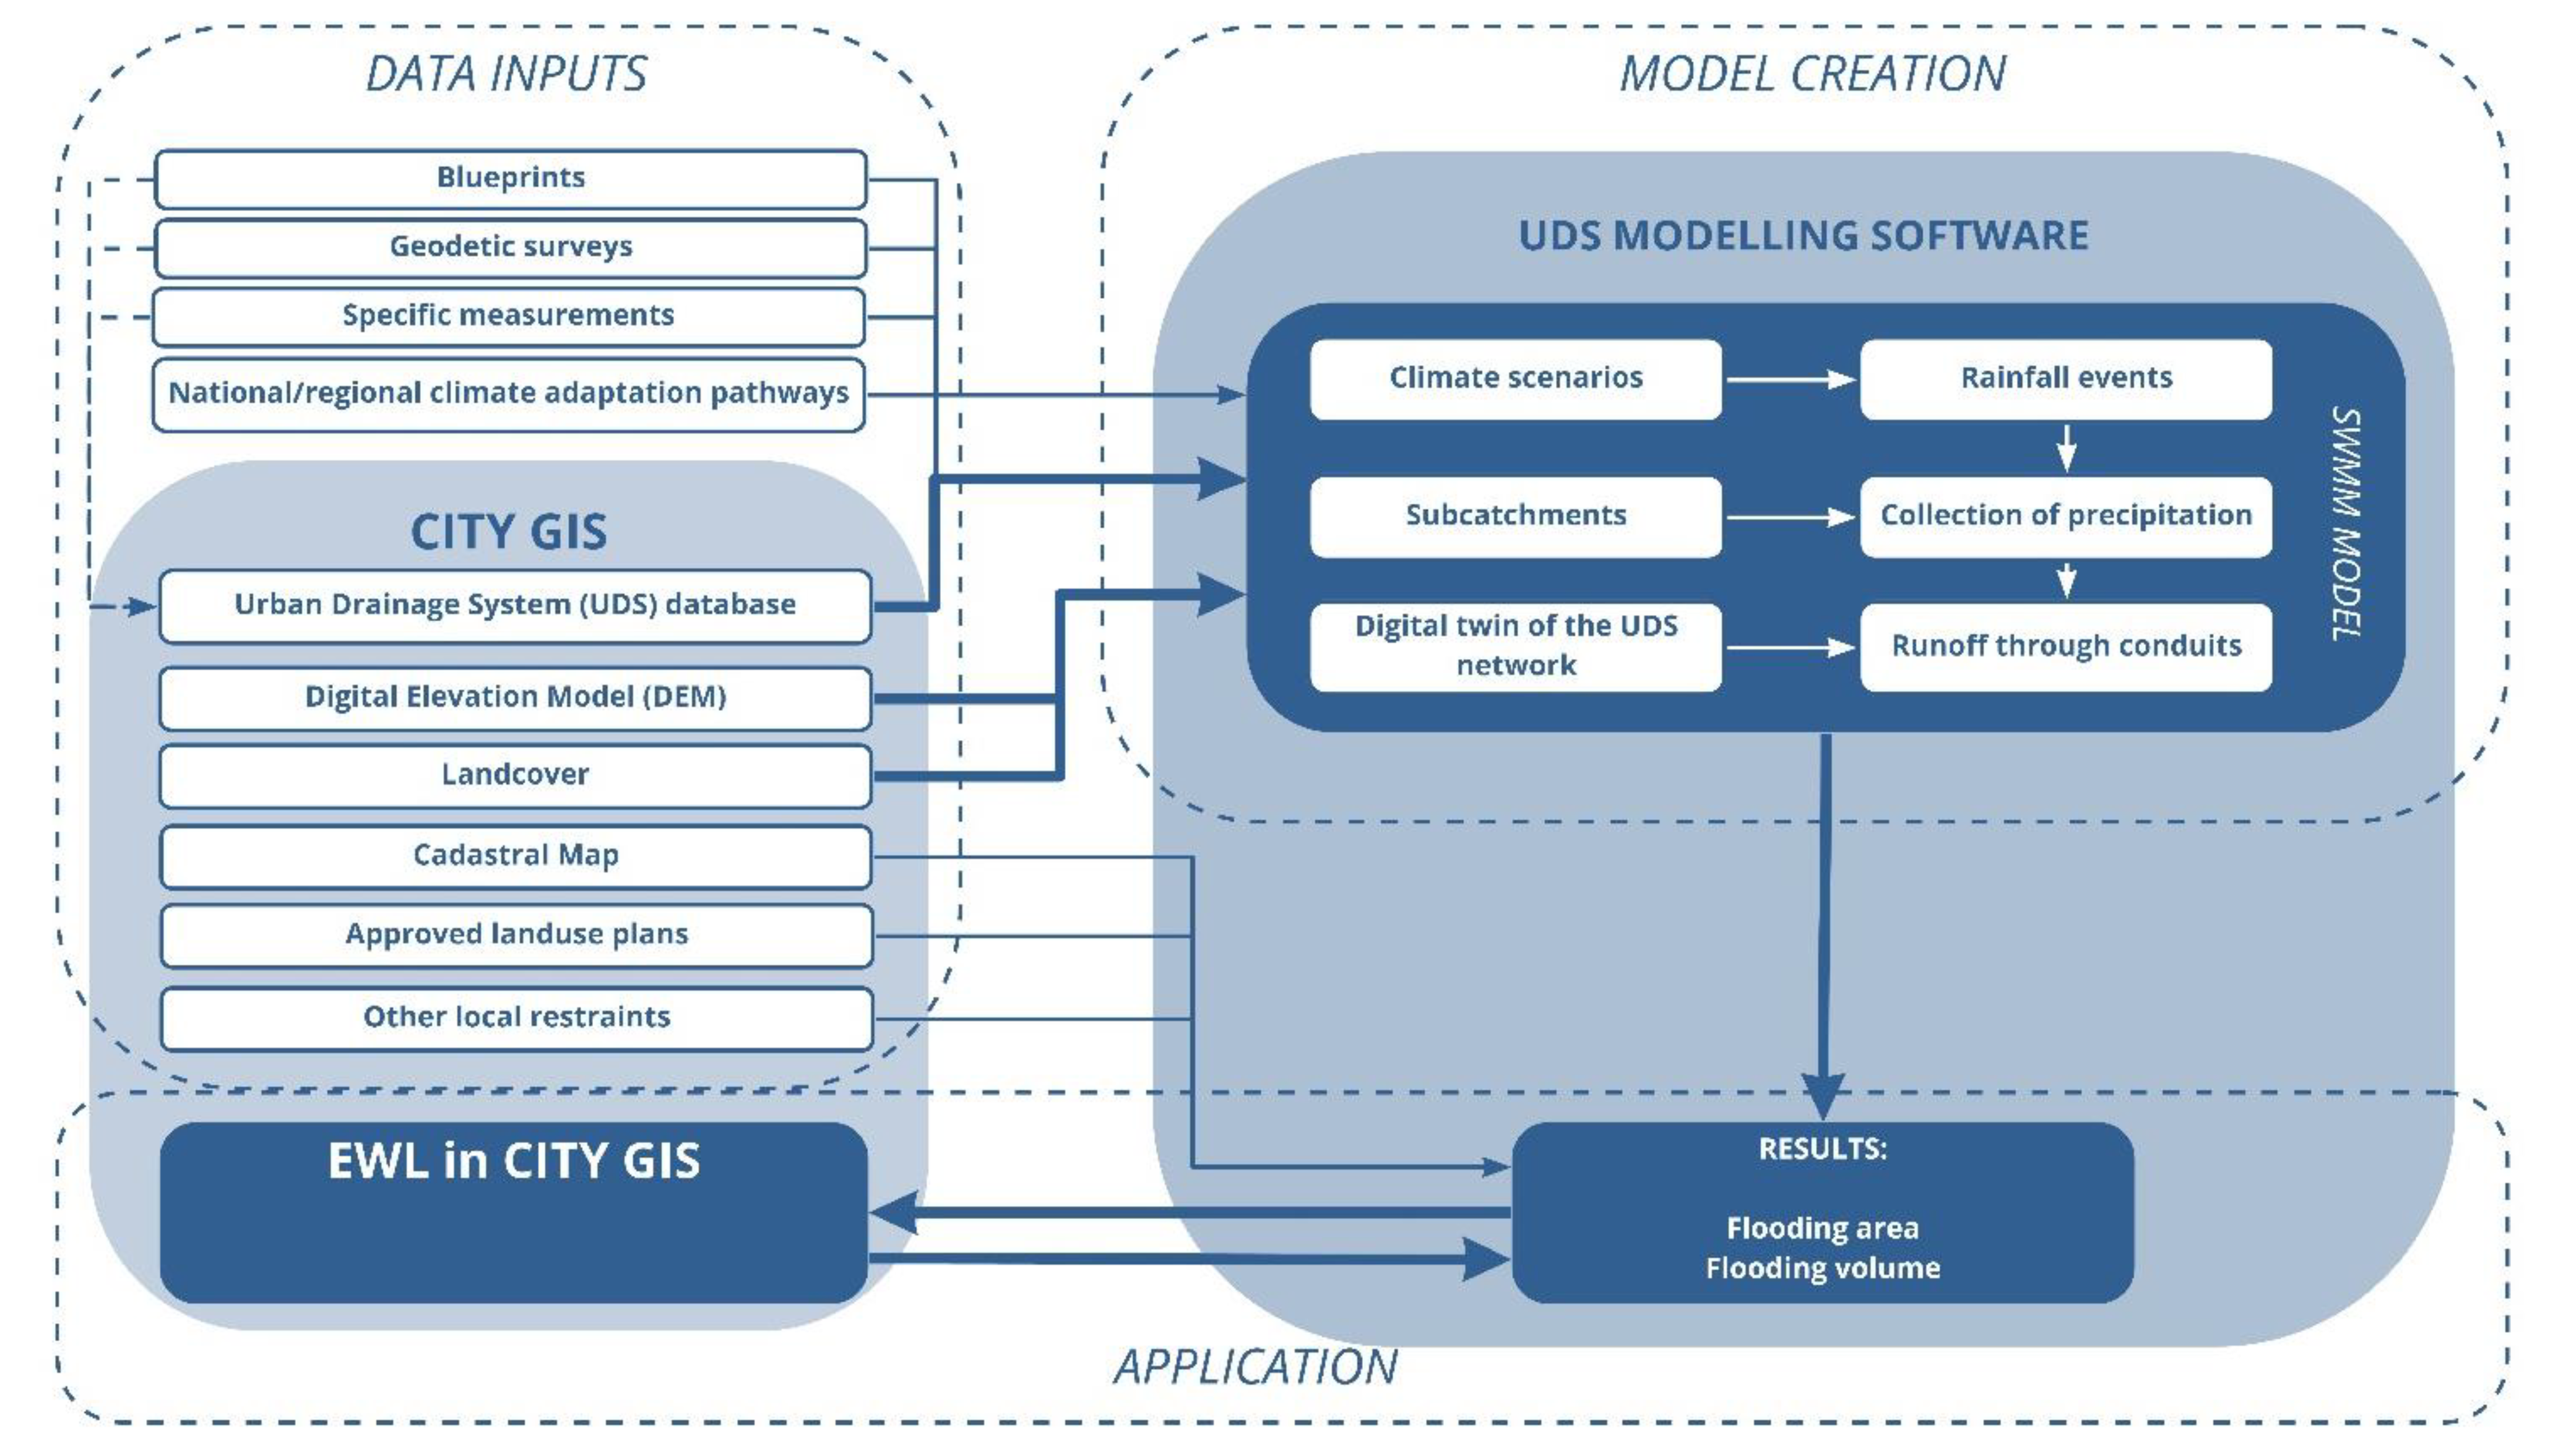
2.1. Concept of the Extreme Weather Layer and Its Prerequisites

The integrated planning layer, EWL, is a dynamic combination of 1D hydraulic modelling; municipal geographic information system (GIS) databases; climate prediction and adaptation plans; approved, detailed and comprehensive plans, and existing cadastral, land cover and digital elevation maps (Figure 1). It connects the outputs of storm water system hydraulic modelling with cadastral maps to visualize the plots in urban areas that are at risk of flooding.
EWL concept was designed for the end-user, with limited expertise on UDS modeling or specific knowledge on climate scenario development. The aimed approach allowed the user to carry out rapid assessments using the GIS-integrated, easy-to-understand tool that visualized the flood prone areas either plot-based or in a catchment view. The proposed traffic light coding displays, how the catchment areas contribute to pluvial floods in various pre-defined climate scenarios, and presents the concurrent flood risk levels in each catchment (low, moderate, high or no risk). Further information on the visualization of the EWL and the applied risk classes is provided in Section 3.1.
The process diagram in Figure 1 shows the interlinkages between the different components that are needed to compile the EWL planning tool. The core engine of the tool is a 1D dynamic rainfall-runoff-subsurface model with high-resolution catchments based on DEM that simulate the flow through catchments and pipelines. The model simulation can be performed separately to analyze flooding risks on a catchment scale for different climate scenarios, or it can be integrated into the GIS. This enables the user to use just one software program, both to simulate the scenarios and present the results. In this study, the simulation model and the GIS were not integrated, but the creation of the EWL layers for different scenarios and presentation forms (catchment-based or plot-based) was automated in the GIS. The main blocks of the EWL are described in the next sections following the logic of the EWL build-up.

2.2. Input Data for the Extreme Weather Layer

The first step in the EWL build-up is defining the available data and potential data gaps. This can be completed using the as-built drawings or the digitalized data of the existing pipeline system, historical geodetic surveys and other information on land use, planned developments, ground elevation data, water level seasonal changes in surrounding water bodies, as well as planning policy and regulations for land use planning and urban runoff management. In order to fill the data gaps, additional measurements should be conducted for critical points in the system.
Today, increasing numbers of municipalities are using GIS for various purposes, including data storage and presentation. The available data on a storm water system can be directly used for model building. This is preferable due to the similar structure and data logic. Building the model from GIS also makes it easier to update the model if any new data become available in GIS. In addition to defining the physical properties of the storm water network, data on land use (e.g., CORINE Landcover or similar) can be used to determine catchments’ imperviousness. A digital elevation model (DEM) was used to automatically determine the shape, slope, area and width for each catchment in order to define the areas connected with each manhole of the UDS. The same catchment areas were later used to define flood-prone zones. Geological data enable the determination of the infiltration rates of permeable areas in each catchment. Cadastral units, represented as polygons with metadata, are needed to identify the urban areas and single plots that are affected by pluvial floods under different climate scenarios.

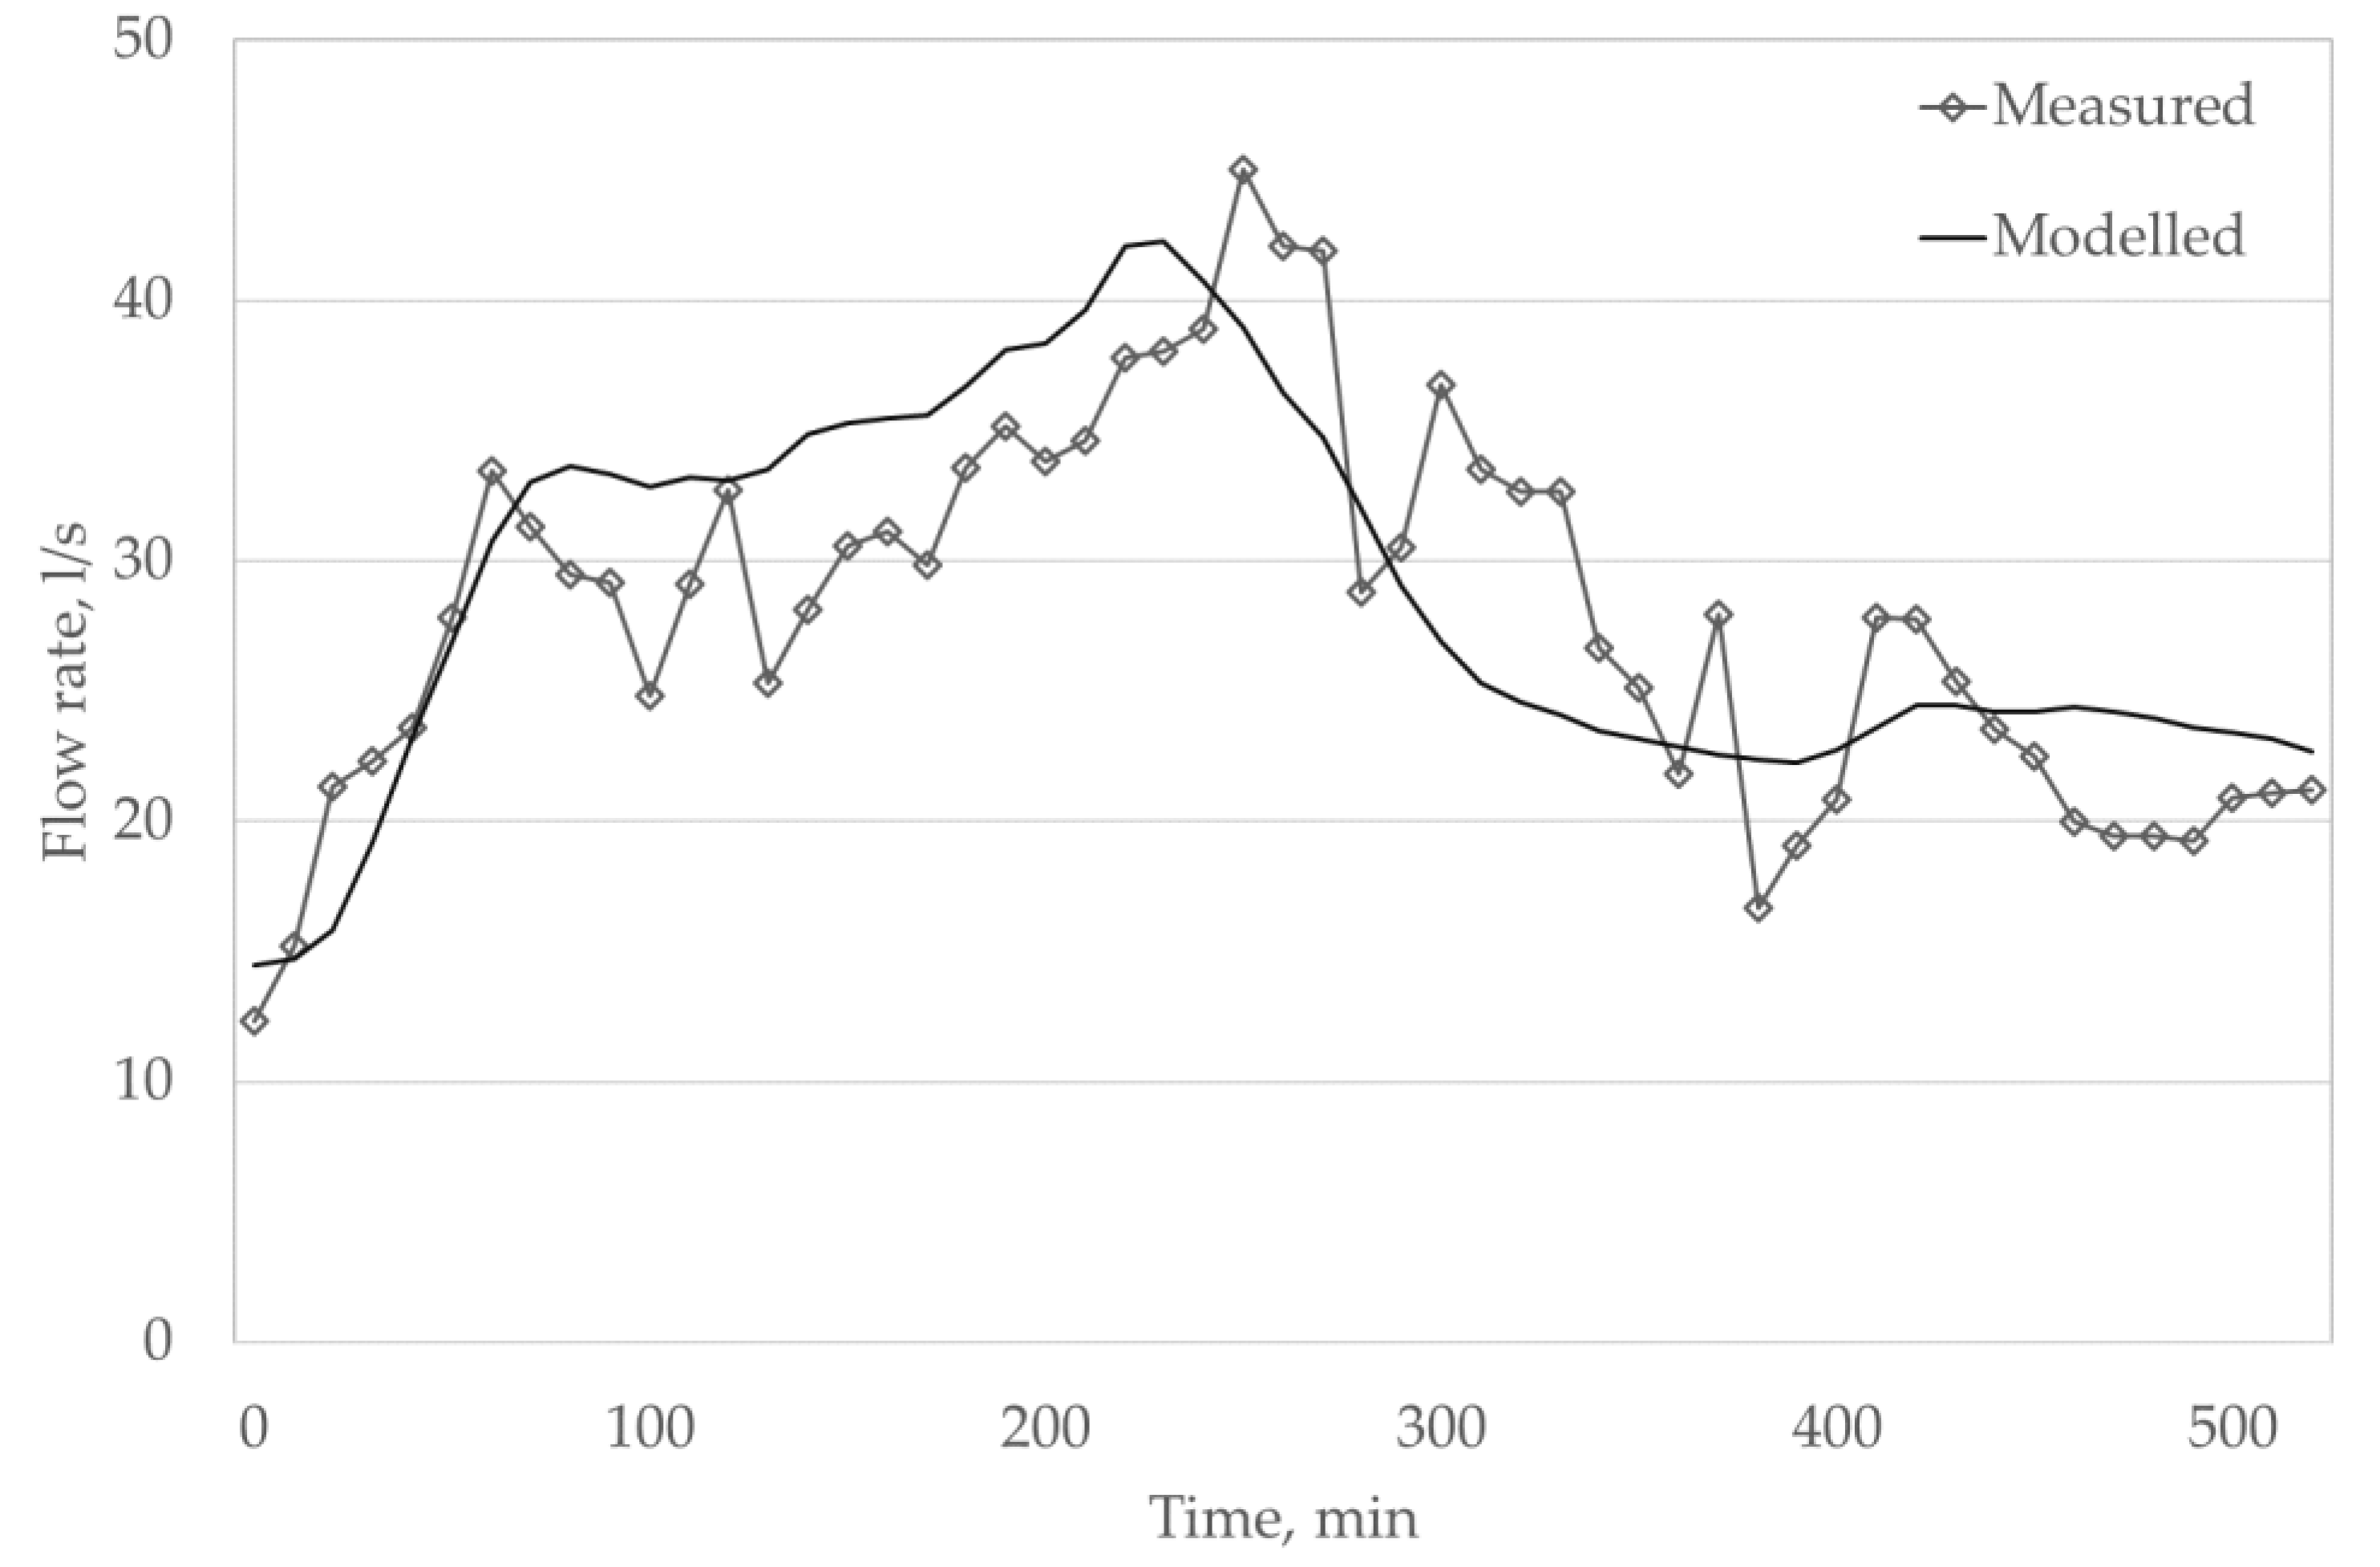
2.3. Modelling Software

2.3.1. Urban Drainage Systems

The EWL was built on the digital twin of the existing storm water system and considered the hydraulic equivalent of the UDS, properties of the catchments and climatic conditions. The hydraulic equivalent of the UDS includes data concerning pipes, manholes, ditches and other technical elements. Land use, topography, and soil types in the urban environment were included in the model in order to simulate how the storm water system and the catchments responded to different rainfall events. In this work, the hydraulic simulation was performed using the software EPA Storm Water Management Model (SWMM 5.1). This is a dynamic model used to simulate the quantity and the quality of rainwater runoff from both one-off and continuous events, mainly in densely populated areas. The software enables the tracking of each quantity of the run-off from each sub catchment and the flow rate and water depth in each pipe and channel during the simulation period at user-defined time steps [26].
In the current study, the dynamic wave routing option was used to consider backflow and correctly calculate flow in pipes with adverse slopes. Ponded areas, defined in SWMM as areas occupied by ponded water atop the junction after flooding, were determined for each node to prevent water escaping from the system during a flood event. Data for the model build-up were acquired from various sources, depending on data availability in the municipalities. Therefore, different fidelity levels were used for the hydraulic models at different pilot sites. In general, it was decided that small-diameter connection pipes from single land parcels were excluded from the models. Although, in some cases, larger buildings and rooftop, runoff pipes were included to ensure the case-specific level of detail in the model.
The hydraulic model must be calibrated prior to use in the decision-making process. Therefore, measured data of rainfall intensities, water flow rate and/or level at critical points of the system were needed to assess the accuracy of the model predictions. Roughness of pipes and catchments, and the percentage of impervious areas were chosen as calibration parameters in this study. Two different rainfall events were used for the model calibration. The parameters were checked and adjusted to ensure that the measured and modelled flow rates and water levels in the system coincided with an acceptable degree of accuracy for the chosen rainfall events. The comparison of the measured and modelled flow rates at the outlet of the storm water system during the first rainfall event for the Haapsalu case study is presented in Figure 2. The average absolute deviation between the measured and modelled flow rates is 14% and the deviation between the peak flow rate is 6%. According to Paule Mercado and Lee [27] the SWMM model is suitable for serving as a good prediction tool when the deviation between the predicted and measured peak flows ranged from −9.3% to 15.7%. The coefficient of determination (R2) between the measured and calculated flow rates ranged between 0.71 and 0.84 in the Haapsalu case and was around 0.82 in the Söderhamn case.
It is essential to recalibrate and validate the hydraulic models for various single and continuous rainfall events to ensure the reliability of the model output. Monitoring devices installed to the pilot sites during the NOAH project enable more necessary data to be acquired for the model validation.
A module to calculate the EWL risk levels was coded in Python language and utilized the pyswmm module for interaction with the SWMM model. The EWL analysis module enabled the simulation to start, detected flood parameters, determined risk levels and exported the list of the flooding nodes with a corresponding risk level to a csv file.

2.3.2. Sub-Catchments

Catchments form a crucial part of urban drainage modelling, as the actual runoff to the underground system is directly dependent on their parameters. Sub-catchments in the present study were delineated for each inlet manhole in the SWMM model, using the automated sub-catchment generation software GisToSWMM5 [28]. This software takes elevation, land use and flow direction information from user-prepared data (i.e., containing land use and DEM maps), creates sub-catchments for the study area, and routes water between the sub-catchments and into the storm water network. Each catchment has unique information about the slope, as well as impervious and pervious surfaces. In the SWMM, an outlet node must be determined for each catchment. In this study, sub-catchments were defined from the DEM maps with a grid size of 5 × 5 to 10 × 10 m for each manhole, enabling the more precise detection of flood-prone areas. The SWMM modeling software requires that the inputs of the catchments are presented as numerical data, while the graphical features of the catchments are represented in the GIS database.

2.3.3. Climate Scenarios

To identify the possible effects and escalation of extreme weather events, different climate scenarios need to be analyzed. Climate scenarios can be based on local (measured) rainfall parameters, climate adaption plans or national standards. In total, three different rainfall events were used in this study to investigate the changes in the EWL in current and future scenarios. The scenarios were selected based on pessimistic future predictions (RCP 8.5), moderate future predictions (RCP 4.5) and the Estonian national design standard for sewer systems outside buildings EVS 848 [29]. This approach to climate scenario selection was case-specific and was concordant between the cities and academies participating in the NOAH project.
For urban areas with separate stormwater systems, the standard EVS848 suggests design rainfall with 2-year return period and 20 min duration. For comparability, the same design rainfall curve was selected for Haapsalu and Söderhamn.
Representative Concentration Pathway (RCP) scenarios were taken as a base for creating future rainfall intensity curves. For the comparability of different hyetographs, the return period and the duration were taken from EVS848. In line with the Estonian ‘Future Climate Scenarios until 2100′ [30], two main scenarios for the climate change adaption plan were taken into account. The first scenario used was RCP 4.5 (main scenario, moderate), which assumes that countries will implement mitigation actions. In this case, the annual average precipitation is expected to increase from 2041 to 2070 (by 10%) and from 2071 to 2100 (by 16%). The second scenario under consideration was RCP 8.5 (pessimistic scenario), which predicted a weak cooperation between countries with mainly carbon-based economies. The increase in annual average precipitation was predicted to be 14% for 2041–2070 and 19% for 2071–2100. The increase in extreme rainfall events was predicted to exceed 30% for both future scenarios. An alternative block method suggested by Jato-Espino et al. [31] was used to define the rainfall hyetographs for each scenario (Figure 3).
For the EVS 848 scenario, standard design rainfall with a return period of two years and a duration of 20 min was applied, resulting in an intensity of 28 mm/h. For RCP 4.5 and RCP 8.5, a 25% and 80% increase in rainfall intensity was applied compared to the national design standard [31].
As the durations of the three scenarios are equal, the graphs can be compared. For example, RCP4.5 scenario in Figure 3 corresponds to EVS848 rainfall with a return period of 20 years. This return period is used to design UDS with a high risk of damage to the buildings caused by the pluvial flood. It is important to notice, that EWL can operate with any rainfall curve, which means that the user should define site and policy specific curves for the risks analysis.

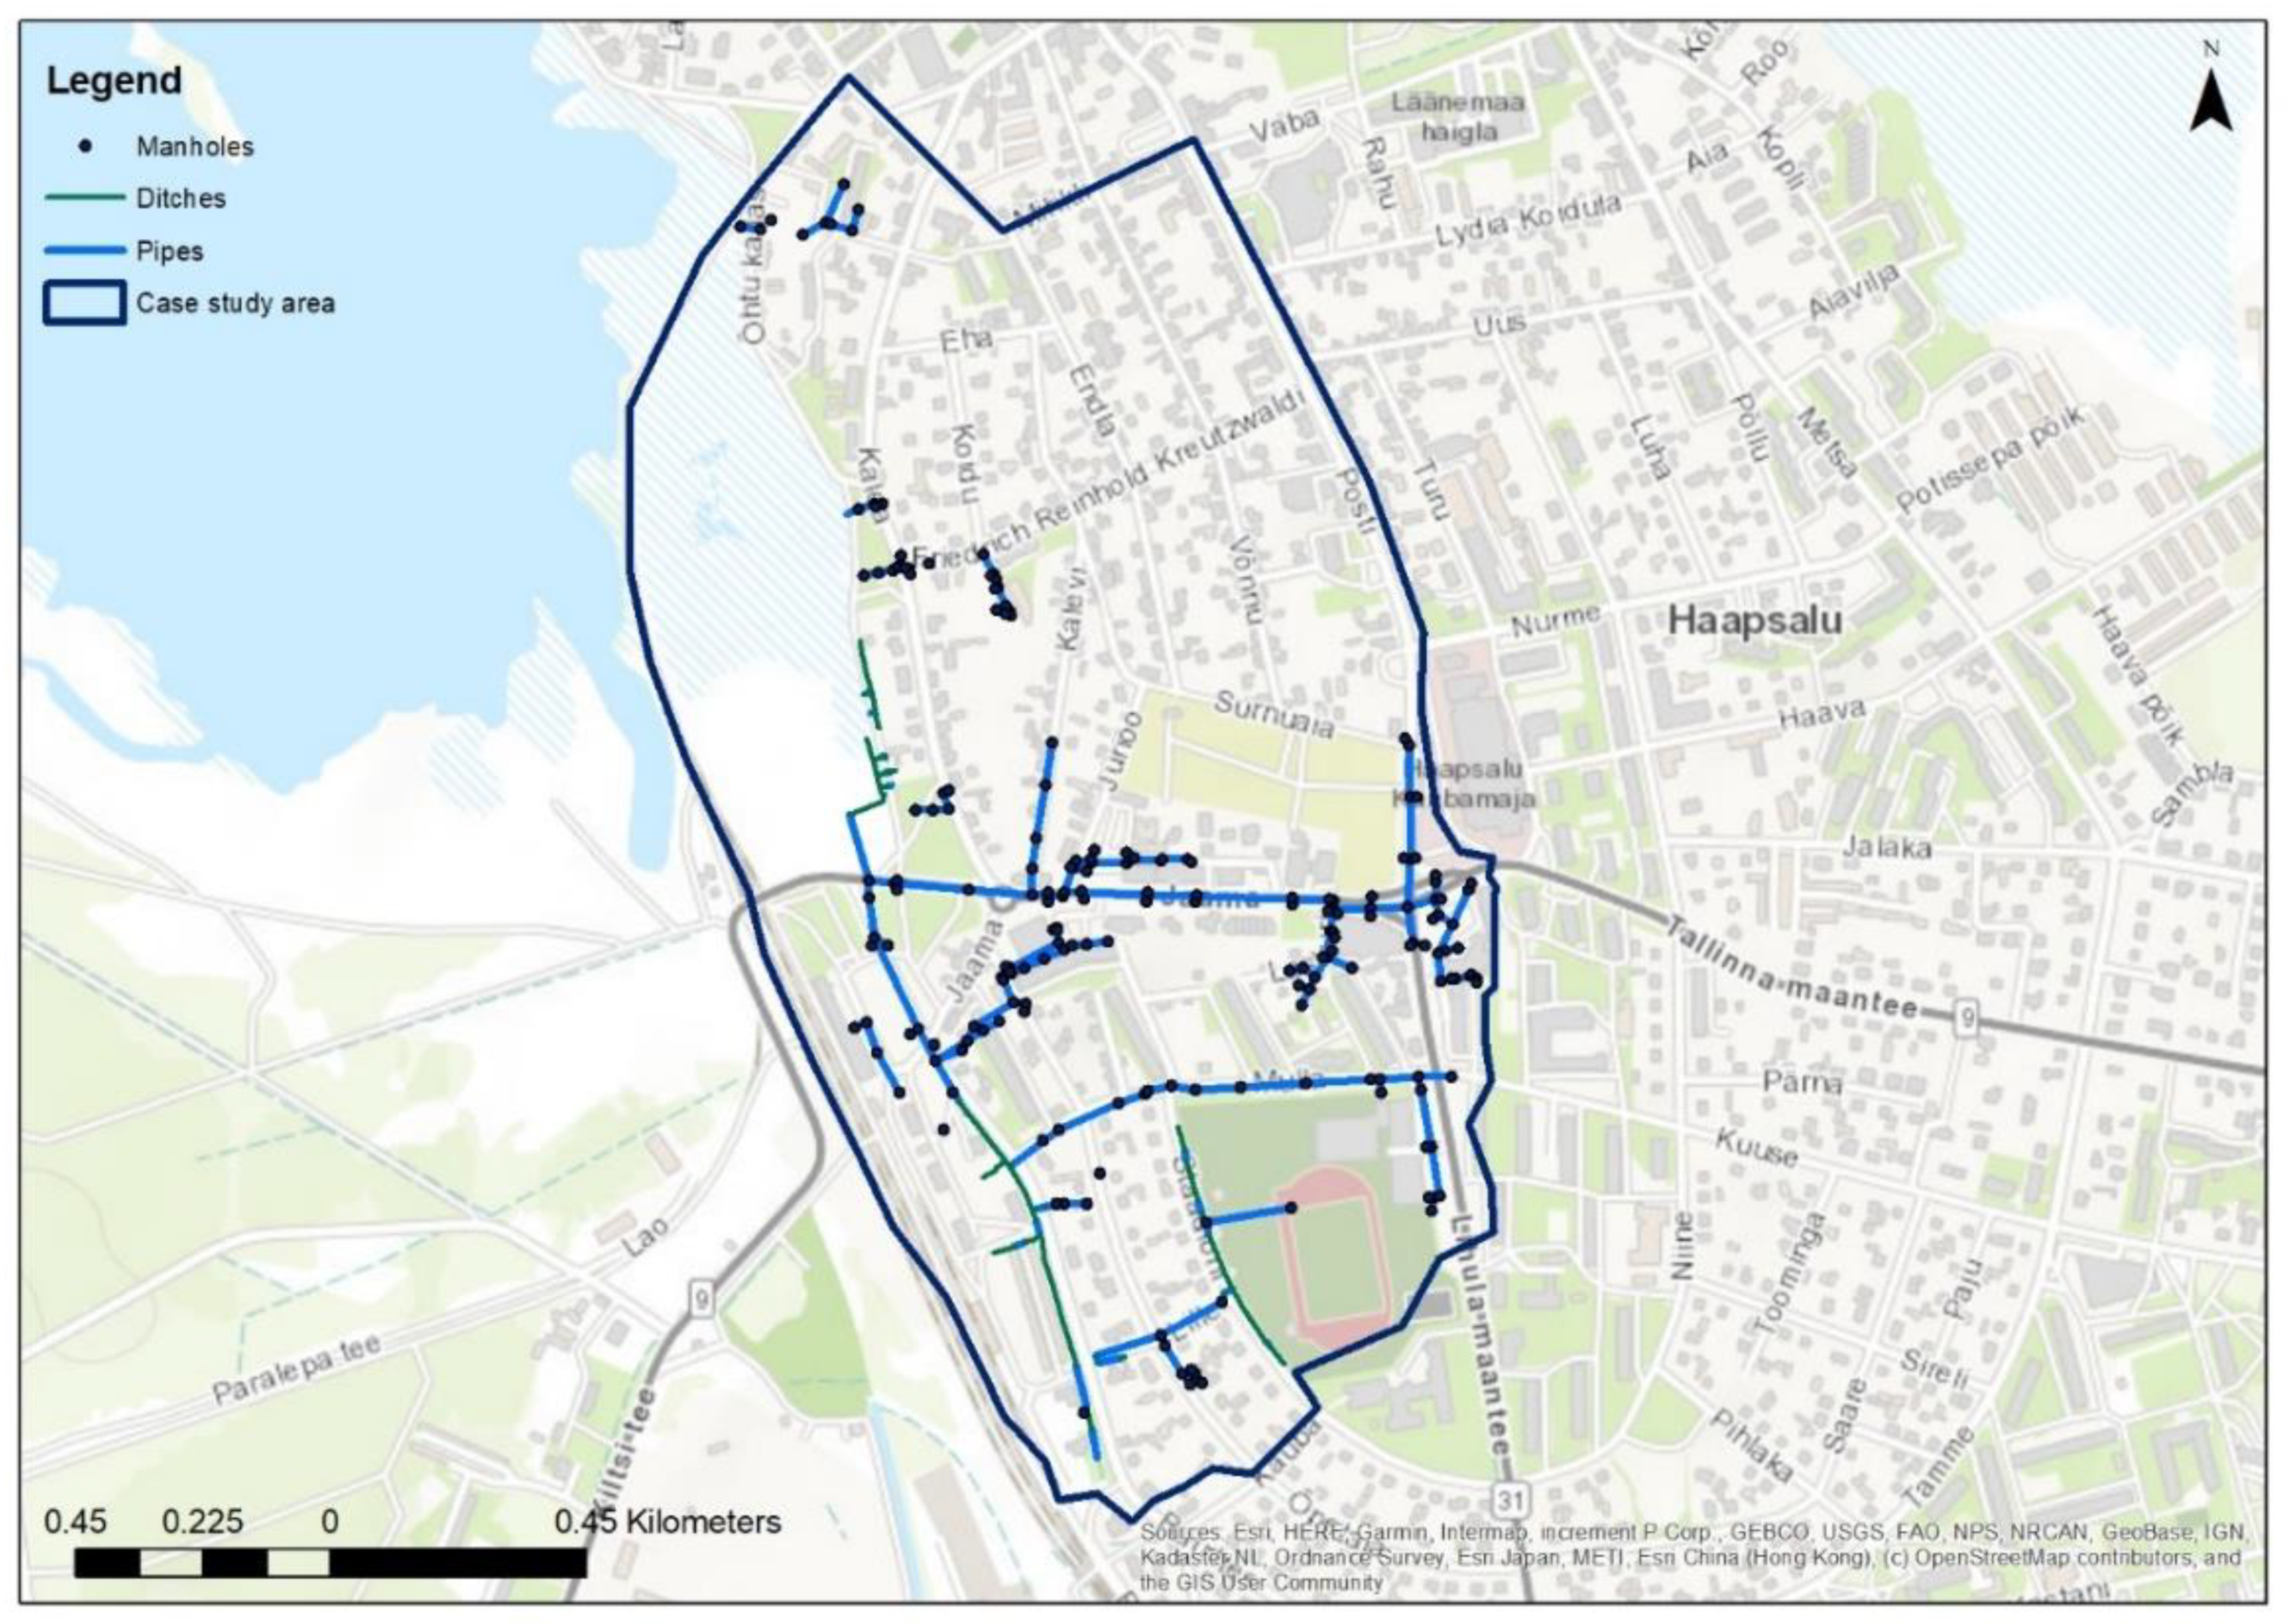
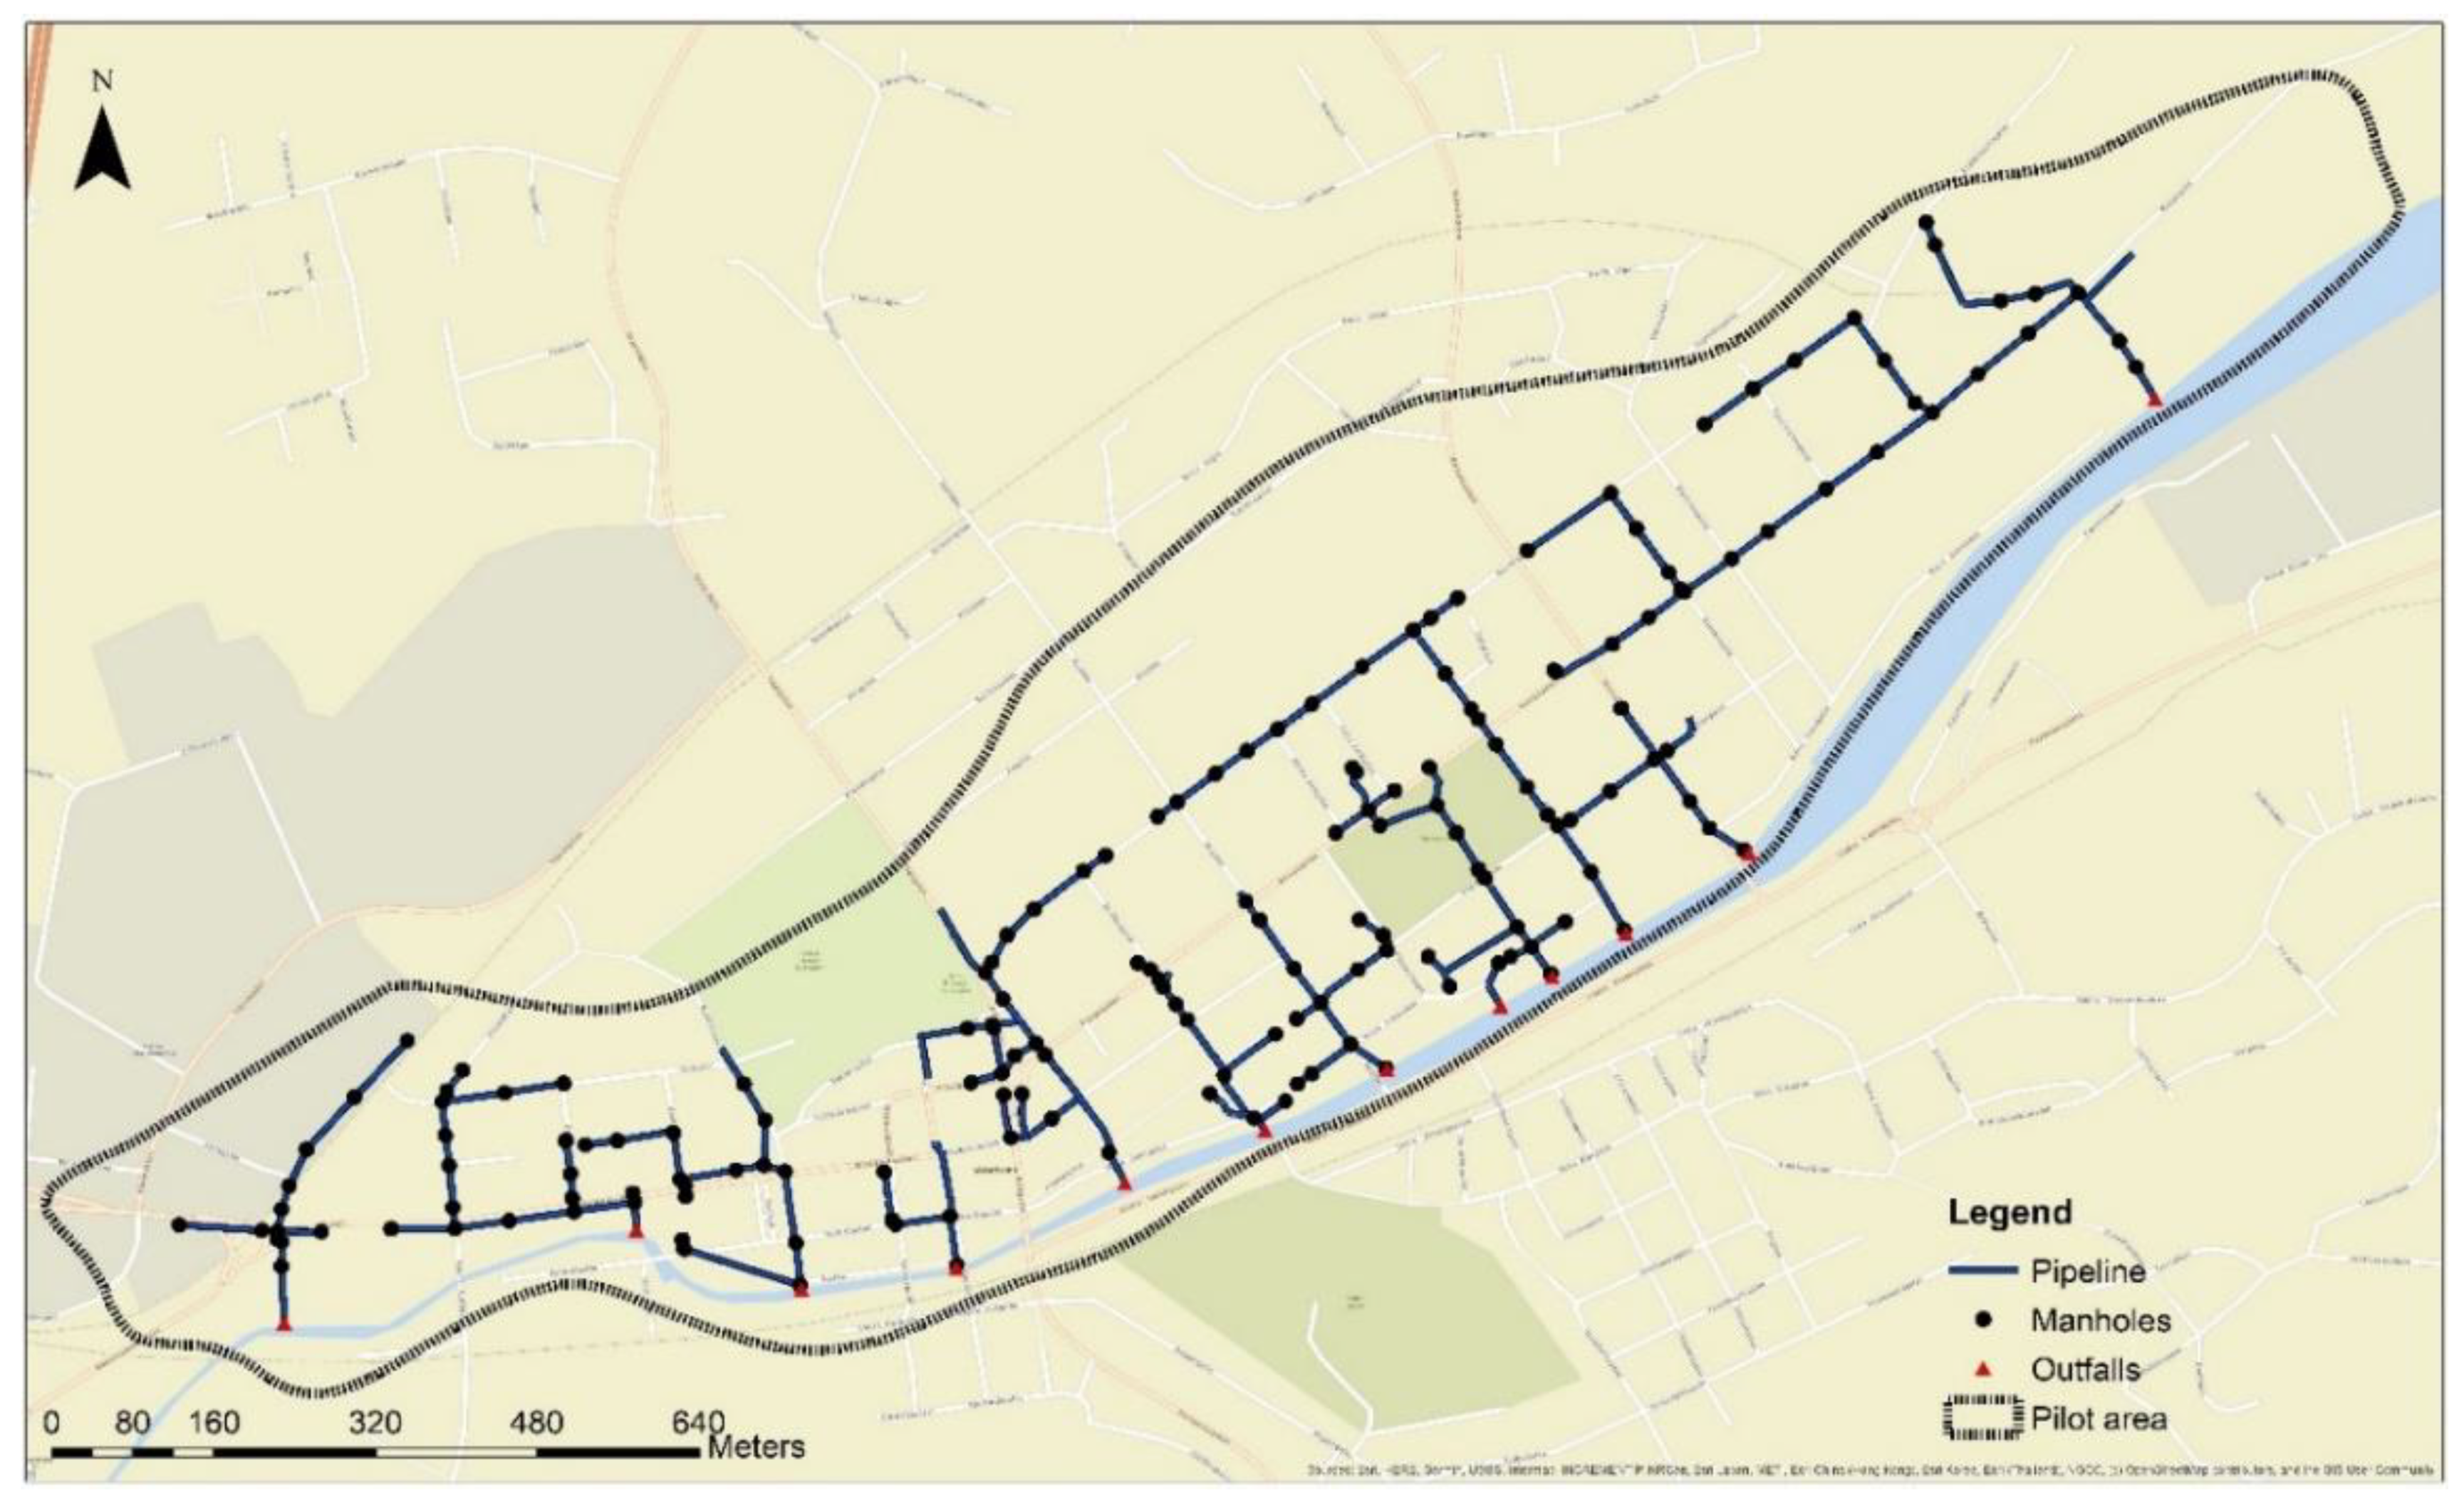
2.4. Case Study Areas

The EWL was developed, implemented and tested during the Interreg Baltic Sea Region NOAH project in 8 different pilot municipalities in 6 countries. This enabled the introduction of site-specific approaches in the application and visualization of the proposed EWL methodology, considering the quality and availability of the data, level of detail in the model build-up and integration of the EWL in the everyday planning procedure. In this study, the implementation of the EWL is presented and the results are analyzed by applying the methodology to a 70-ha urban catchment located in Haapsalu, Estonia and a 100-ha catchment located in Söderhamn, Sweden (Figure 4). The key characteristics of the pilot areas can be found from Table 1.
Haapsalu is situated on the west coast of Estonia (Figure 5). The town’s coastline is 18 km long and its total area is 10.6 km2. Parks and green areas represent more than half of the area. Due to the length of the coastline and the moderate ground elevation, the town is exposed to seawater flooding. The catchment selected as the case study has a separate storm water system consisting of pipelines and open ditches. The pilot area is situated between the town’s main street in the east and Haapsalu Bay in the west. The case study area includes 427 cadastral units, 77% of which are residential areas, mostly owned by private individuals. A large part of the territory is protected as a cultural heritage site, with valuable historical wooden architecture and landmarks.
Old drainage systems, bottlenecks in pipelines, ditches with adverse slopes and overall incomplete information about the town’s drainage system all contribute to pluvial flooding. Storm water outflow from the case study area is a manmade wetland lagoon closed from a shallow bay by a historic railroad maneuver dam, currently used as a promenade and cycling route. The wetland currently acts as a buffer zone and provides a nature-based treatment for the storm water before it reaches the sea. The railroad dam protects surrounding properties from sea-level rise and prevents seawater inflow to the storm water system.
Söderhamn is a coastal town, with total area of 10.5 km2, located near the bay of Bothnia and at the outlet of the river Söderalaån (Figure 6). The town is surrounded by forested mountains. Therefore, the ground slope is quite steep towards the river/bay (over 10%) with a height difference of more than 10 m.
The Söderhamn pilot area consists of 11 sub-catchments with a total area of 100 ha and separate storm water system. Four of the sub-catchments have outlets to the river and the rest have outlets to the narrow bay of the Baltic Sea. Due to the high water levels in the river and in the bay the outlets are typically submerged. Additionally, some of the catchments (e.g., roofs) are connected to the sewer system causing the activation of combined sewer overflows (CSO) during heavy rainfall events.
Part of the pipeline system is replaced with new plastic pipes but there are still bottlenecks where downstream pipeline sections have a considerably smaller diameter than the upstream pipes. Similar to Haapsalu, storm water collected by the UDS is not treated, except for local sand-oil traps in petrol stations and car parks.
Annually, there are temporary floods in the coastal zone, with maximum water levels of up to 2.0 m above the normal level in Haapsalu and 1.4 m in Söderhamn.

3. Results

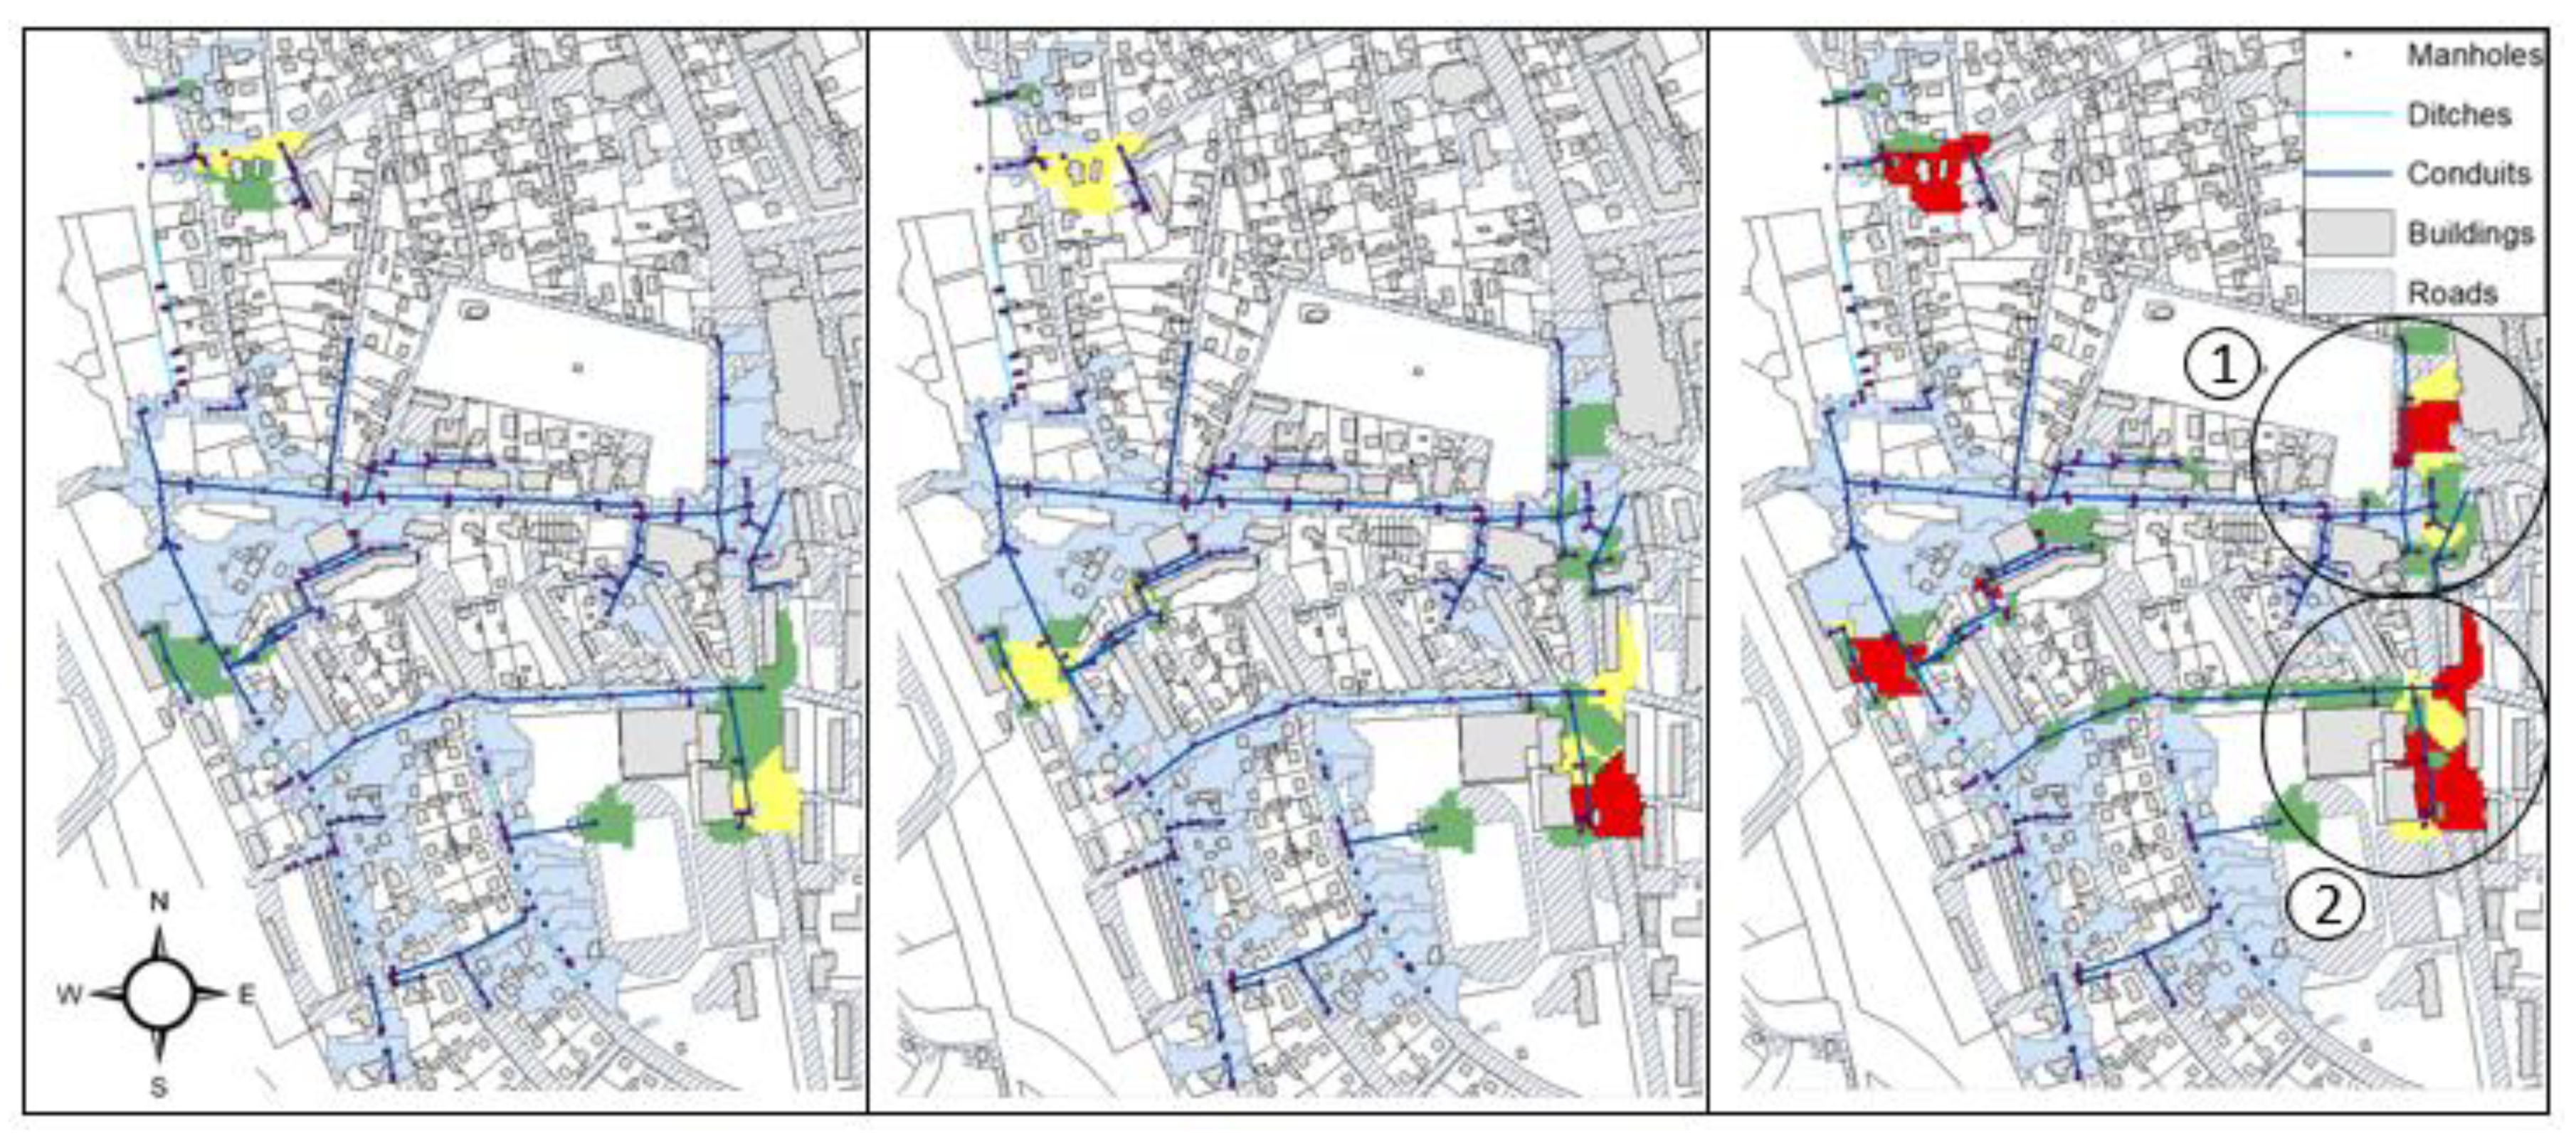
3.1. Mapping of Flood Prone Areas in Case Study Regions

The decision support tool EWL, combining the UDS digital twin with the GIS system, aims to assist city governments in analyzing the impact of climate change and new developments on the existing infrastructure, as well as the concurrent flooding risk at both a single plot and at the city scale. Once the data on UDS, rainfall, land use, topography and soil type are known, the hydraulic modelling software (in this study, SWMM) can be used to ascertain which manholes in the urban area are vulnerable to intensive rainfall and cause flooding on the streets. As the manholes are connected to a specific sub-catchment area, this enables the flood parameters to be exported from nodes to catchments. As a result, all sub-catchments that cause a flooding risk will have a certain risk level based on the modelling results.
Different flood risk levels are shown in traffic light manner, where green indicates low risk, (i.e., risk level 1) yellow indicates moderate risk (i.e., level 2) and red indicates a severe flooding risk (i.e., level 3). This assists a planning specialist, who is unfamiliar with flood modelling, regarding which properties and areas in the city are most affected by pluvial floods. At the same time, the tool can be used to calculate runoff volumes for connecting new developments with the existing UDS and to find suitable technical solutions (real-time control solutions for UDS, NBS, etc.) for flood mitigation, if needed. In addition, the EWL can be used to detect properties where additional requirements are foreseen for buildings (e.g., planning higher plinths and forbidding the planning of basements and underground parking to avoid flooding).
The hydraulic modelling results were used as an input to generate the EWL. The SWMM reporting tool presents information about node flooding in a table format for each junction/manhole, e.g., flooding duration (hours), flooding flow rate (L/s), flooding volume (m3). This enables one to deduce the manholes that were flooded during the analysis period and/or event. The data were used to divide all manholes into four flooding risk categories, with 0 indicating no risk and 3 indicating severe risk. The modelling output data were added to the GIS to connect the flooded areas with single plots in a real urban environment.
Three different climate scenarios in Haapsalu and in Söderhamn were analyzed on the basis of two parameters: flooding flow rate (L/s) and flooding volume (m3). Our analysis revealed that in some cases, high flooding flow rates can be present in some manholes for a very short time period, i.e., seconds. Such results are deemed inconclusive, as they do not reflect the most problematic urban areas where floods persist on the streets for a long time. Therefore, analysis in the pilot areas were based on the flooding volume, indicating the total water volume that flowed from the manhole or the catchment to the street during a rain event. Table 2 presents the number of flooding nodes, total flooded water volume and maximum duration of flooding for each scenario in Haapsalu.
As described above, during the first step of the analysis, SWMM was used to detect the manholes that caused significant flooding during the rain event. This was conducted automatically using the coded EWL analysis module. Subsequently, flood risk levels were assigned to each flooded manhole and the sub-catchment connected with it. All detected flood nodes were sorted and divided into three similar size risk groups by the module. As each pilot area is different, this methodology ensures that different risk levels are equally represented over the area. The results were exported to a csv file, which could be easily imported to GIS software for the visualization.
For example, in Haapsalu the following risk levels were assigned for the EWL (Figure 7):
  • Risk Level 1—low flood risk. In this case, the flooding volume from the manhole is greater than 0.1 m3 and less than 1 m3 during a rainfall event. This usually does not cause any complications to the city or the functioning of its infrastructure. Water remains on the streets in low volumes and only for a few minutes after the rain event. Additional impermeable surfaces are allowed but their impact on the surrounding catchments and properties needs to be analyzed.
  • Risk Level 2—moderate flood risk. The flood volume from a single manhole is between 1 and 7 m3 during a rainfall event. Water on the streets can cause the malfunctioning of urban services and pose a risk to properties. An increase in impermeable surfaces should be restricted. Mitigation measures are required in order to reduce the flooding risk in the sub-catchment and surrounding areas.
  • Risk Level 3—severe flood risk. The flood volume from a manhole exceeds 7 m3 during the rainfall event. Mitigation measures are needed in order to reduce the flooding risk in the area. Additional developments with the increase in impermeable surfaces should not be allowed if runoff to the UDS is not reduced and/or detained at the property/plot level. Flooding causes damage to buildings and private property.
Implementation of the EWL methodology in eight different pilot sites involved in NOAH project indicated that the quantification of the risk levels needed to be completed based on the actual urban area. The flood risk levels in cubic meters introduced in this study were determined for the Haapsalu and Söderhamn cases. Different rainfall events were analyzed in order to find suitable threshold levels for both a visualization and from a system performance perspective. Flooding risks on the properties in Haapsalu and Söderhamn are presented in Table 3 and Table 4, respectively.
Table 3 presents the results of the three main scenarios in Haapsalu. GIS tools were used to derive the properties that overlapped with the sub-catchments of the flooded manholes. The risk class of a single land parcel was calculated automatically using the built-in tools and coded add-ons in GIS software. It was evident that scenario 3 with the highest rainfall intensity had the greatest impact on the district, where a total of 43 properties were affected and 37% of them corresponded to flood risk level 3, meaning that the flood volume in that sub-catchment was more than 7 m3 during the simulated event. Under scenario 2, fewer properties were affected and only 10% of them corresponded to risk level 3. Under scenario 1, 23 properties were affected, seven of which, or approximately 30% were at risk level 2, with a maximum flooding duration of 22 min. Flooding in the rest of the properties was insignificant, lasting only 1–2 min. The EWL visualization in Haapsalu is presented in Figure 6. The lack of capacity of the UDS during the extreme rainfall events is clearly visible in specific areas under all three scenarios (Figure 7). Two of these areas overlap with the town’s most important entrances and exits: major roads connecting Haapsalu with major Estonian cities (Figure 7 areas 1 and 2). The maximum duration of flooding is highest in the case of scenario 3, when the water remains on the streets for about 1 h. For scenario 2, the maximum flooding duration is about 32 min, and for scenario 1 about 22 min. The visual representation of the flood prone areas gives the urban planner an instant overview of the changes in the flood risks during different climate and/or development scenarios.
Similar results are presented for Söderhamn to further exemplify the implementation and presentation of the EWL. The results of the analysis are shown in Table 4 and Table 5 and in Figure 8. In Söderhamn, in the case of scenario 1, 23% of the nodes showed flood volumes greater than 1 m3. The number of flooded nodes increased to 48% in scenario 3 (Table 5). It can be seen that, compared to the Haapsalu case shown in Table 1, the number of flood nodes was significantly larger. This is firstly related to the size of the catchment, i.e., the pilot area in Haapsalu is ca 30% smaller than in Söderhamn and, secondly, the difference in the ground slope, which is several times steeper in Söderhamn, causing faster runoff and propagation of the surcharge front in the system. In addition, ditches form a significant part of the storm water system in Haapsalu, providing an extra accumulation volume that mitigates the flood risks in the area.
Flooding nodes were divided into three risk classes and connected to the catchments and properties overlapping the catchments as described above. The results from the Söderhamn analysis are presented in Table 4.
Dependent on the scenario, 25% (Scenario 1) to 53% (Scenario 3) of the properties in Söderhamn overlap with the catchments that are connected to the flooding nodes. This means that the runoff from these plots most likely causes the flooding of storm water in certain manholes; therefore, applying mitigative measures to these properties lowers the flood risk level in the area. The majority of the properties fall into risk level 1, which means that the runoff from these areas causes flooding with volume less than 1 m3. Dependent on the climate scenario, properties with risk level 3 vary from 10% to 20%. The largest flood volume in the case of scenario 3 is 138 m3, with a duration of 106 min. All the properties falling into risk class 3 should be handled with extra care while planning future developments, i.e., enlarging impermeable surfaces or erecting buildings with a substantial roof area.
Spatial distribution of the land parcels with different risk classes in Söderhamn, in the case of climate scenario 2, are presented in Figure 8, which shows that the properties of a higher flood risk class are situated mostly in the middle of the pilot area. This is the most densely developed district with a high ratio of impermeable surfaces. Despite the relatively steep ground slope (>10%), the pipeline does not have the sufficient capacity to handle the flowrates, and thus the streets are flooded from the surcharged manholes.

3.2. Planning of Mitigation Measures

The developed EWL tool automatically defines single properties that are connected with the catchments that result in the runoff that causes pluvial flooding. The EWL tool automatically calculates the corresponding flood risk level for each property, considering different user-defined climate and development scenarios. The results are presented graphically as a GIS layer, which means that the EWL can be overlapped with other developed GIS layers, e.g., green areas have the potential to accumulate storm water. Through the use of the EWL in GIS, the urban planner has information on whether new developments (especially ones increasing the impermeable surfaces) can be added to the area, or the extent to which different mitigation measures (e.g., different NBS) must be implemented to prevent flooding in the case of extreme rainfall.
EWL as a GIS layer compatible with other feature classes developed for a municipality was tested in Söderhamn pilot area. The town has mapped areas that are firstly owned by the municipality and secondly have potential to implement mitigative solutions for storm water. These solutions, aggregated into a mitigation layer, were divided into rain catching streets, streets covered with gravel, storm flow gutters, wide streets, developed green areas (i.e., areas with some buildings, but still an abundance of permeable surfaces), green areas and non-green areas.
Overlapping this layer with the EWL plot view of scenario 2 (RCP 4.5) reveals properties with a high-risk index and areas with the potential to implement mitigative measures. Figure 9 shows that a property situated in the middle of Söderhamn has the highest flooding risk level. At the same time, the property is owned by the municipality and is defined as a potential green area on the mitigation map. This gives urban planners the necessary information and opportunity to reserve the land for a storm water management unit in order to reduce the risk at this particular catchment and the surrounding areas.
After mapping the potential areas and solutions, technical interventions that are used to create the EWL can be imported into the model, and the impact of the solutions can be analyzed in comparison with the initial EWL. Additionally, major parameters for the technical descriptions of the units can be calculated by the model and exported to the EWL as a separate object. This means that EWL is constantly adaptable to the changes made in the catchment, considering the already constructed objects (tanks, low-impact development solutions, etc.) or solutions that are still in the designing phase. This feature makes EWL a highly efficient tool for the catchment scale planning decision which is considered the most efficient way towards climate resilient urban areas [32].

4. Discussion

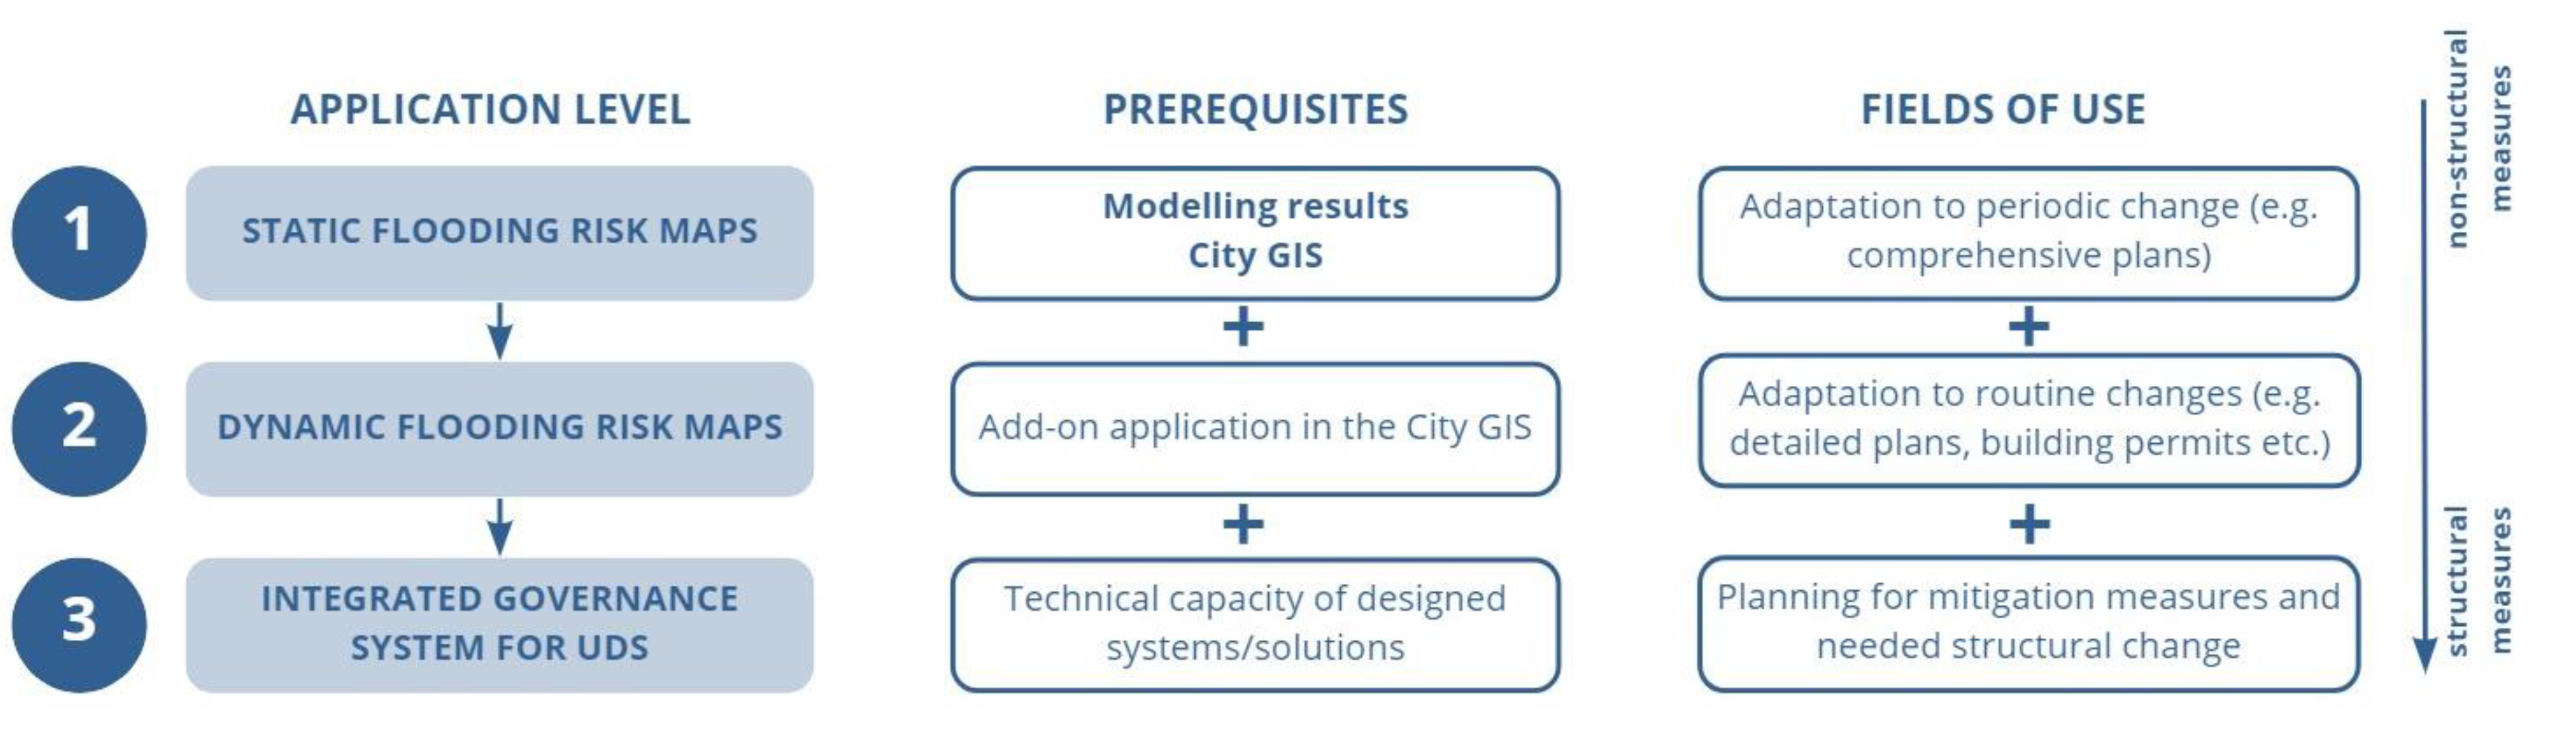
4.1. Further Fields of Use for Extreme Weather Layer

The developed EWL tool takes a step forward from the static flood warning maps and tools that were developed for decision makers and the general public (e.g., for assessment of implementation of Directive 2007/60/EC [33], Handmer and Cartwright [21]). Static water level maps usually consider only the flood risks related to the water level in surrounding water bodies or in low-points. The EWL, by contrast, additionally incorporates risks related to pluvial flooding, representing the results on a 2D map. The implementation of an integrated planning tool shifts the paradigm in urban planning from static, periodic and plot-based planning to dynamic, real-time and catchment scale planning.
This paper demonstrates the first applications of the EWL in Haapsalu and Söderhamn. The risk mapping results were adopted to routine decision-making procedures in municipalities, and, in case of Haapsalu the EWL was integrated into the comprehensive plan of the town [34]. However, as shown in Figure 10, the EWL has a high potential for further uses beyond a static decision tool, as presented in this paper.
The EWL can be used in the planning procedure for various purposes. The expected impact is mainly seen on three levels:
  • Static flooding risk maps: analyzing the flooding risks in the urban area under different climate scenarios. This option enables the urban planner to detect potential flood-prone areas with different risk levels, both at present and in the coming decades. The simple graphical layout can support communication with developers and property owners when explaining the possible constraints regarding changes in land use or the volume of buildings.
  • Dynamic flooding risk maps: analyzing the effects of new developments on the urban areas under different climate scenarios. This option enables the urban planner to graphically present the changes in flood-prone areas caused by changes in land use (e.g., from park to parking lot) and the building volume of a specific plot, compared to the whole catchment area in the urban environment. With this option, EWL represents a decision support tool for the planning specialist, enabling the effect of plot-based changes to be seen in an integrated city-scale manner.
  • Integrated governance system for UDS: selecting the locations for the mitigation measures and defining technical requirements for new developments. EWL is based on a hydraulic modelling tool. Therefore, it can also be used to define technical requirements for single developments (e.g., maximum storm water runoff from the plot to the UDS) in order to reduce flooding risk in downstream areas. The effect of different flood risk mitigation measures (plot-based NBS, tanks, infiltration, etc.) can be analyzed, and concrete solutions can be provided for each development. The impacts of technical and mitigation measures can be analyzed using different present and future climate scenarios. This allows the urban planner to detect the effect of the solutions in short- and long-term plans.
The different levels of intervention in EWL application require different preparations and can be used for different adaptation decisions made by various user groups. Urban planners, authorities issuing design criteria for buildings and landscape designers can apply the tool for a better understanding of the influence of planned developments for pluvial flood resilience. The tool also enables the visualization of the flood risk related to development scenarios for the wider public, making it easier to carry out community engagement and allow the co-design of public space.
This paper presented the concept of the EWL, and therefore focused on the first implementation level. Dynamic flooding risk maps are being developed in other case study areas and further work is set to continue in Haapsalu and Söderhamn. Moreover, after the planned measures, such as LIDs or detention facilities, are embedded into the hydraulic model, a second-round EWL analysis can easily be performed and the impact of the measures on flood risk reduction can be presented to the stakeholders both numerically and visually on the maps. Additionally, several solutions can be compared to seek the most feasible option for the implementation.

4.2. Limitations

The precision in defining the flood risk areas using the EWL depends strongly on the available data regarding the above and underground elements in the urban environment. The level of detail of the UDS model and DEM sets the level of detail for the EWL visualization. The flood prone areas are defined based on the sub-catchments derived for each manhole. Therefore, the inclusion of more manholes in the model provides more detailed information about the flood risk areas. Similarly, the resolution of the digital elevation models determines the spatial resolution of the flood risk areas. In the NOAH project, resolutions from 1 × 1 m to 10 × 10 m were used dependent on the data available in different countries. Therefore, in some cases, the flood risks could be assessed at the property and building level and, in some cases, at the property group level.
The visualization of the flood risk areas is based on the UDS modelling results. The accuracy of the modelling is dependent on the calibration and validation of the UDS model. Although different automatic calibration tools are proposed [35] the calibration of the UDS models remains a challenge and requires a good knowledge of the system, hydraulics and hydrology. In the NOAH project and in the presented case studies the models were calibrated based on two measured rainfall events. In order to ensure the precision of the EWL and reduce the uncertainties of the results the models must be calibrated and validated using different weather patterns, including multiple single and continuous rainfall events. This requires the availability of measured data regarding different rainfall events, concurrent flow rates and water depths in the UDS and, for continuous events, detailed data regarding the soil types, infiltration and ground water fluctuations. Otherwise, the usage of EWL produces somewhat inaccurate results for property level planning or the determination of technical solutions to reduce the flood risks in certain areas.

4.3. Future Work

Previous studies on urban planning mainly focused on flood mitigation measures (flood prevention) through technical solutions. As a result of the Smart Cities concept, we are moving towards multidimensional solutions, where the information yielded from the systems can be monitored, transferred and stored, almost in real time. This means that methods such as smart storm water systems with centralized and decentralized real-time control (RTC), NBS and other solutions can be applied to control and maximize the overall capacity of the storm water system. In the second development phase of the EWL, the planning tool is coupled with UDS development strategies to automatically find feasible technical solutions and optimum locations to reduce pluvial flooding in flood-prone areas. This includes concepts to control the storm water inflow from impermeable catchments to the UDS [36,37]. The prerequisite of such a development is the accurate digital representation of the UDS, e.g., including most or all of the connection pipes from single plots to the UDS within the hydraulic model. Due to a lack of data, this can be challenging. However, at the same time, the adaptation of RTC storm water systems entails additional costs and risks for municipalities related to equipment, installation and maintenance. The cost of installation and maintenance can be especially high in cities with limited available space [38]. The EWL can be used to detect suitable areas for controlled flooding scenarios.
Urban planning is typically related to finding the tradeoff between the ambitions of property owners or developers, and the visions for the urban environment from the perspective of politicians, planning specialists and citizens. Meerow and Newell [9] presented a case study in Los Angeles concerning how the employment of green infrastructure enhanced resilience. They showed that the outcome was crucially dependent on the initialization of the optimization task; therefore, the policies and practices of resilient planning must be critically examined. This enables one to determine the trade-offs, priorities and costs of each solution (i.e., the winners and losers of the solutions). The implementation of the EWL goes a step further by showing direct interlinkages between flooding risks (resilience of the urban environment) and future urban developments. Moreover, the second and third application level of EWL (Figure 10) can be used to predict changes in the urban environment, considering future climate scenarios and a city’s capacity to handle the advances made.
The proposed tool can be further developed to mitigate the flood risks faced by buildings. It can be expanded to analyze how best to design and modify the building envelope in order to promote fast drying and minimize the extent of the necessary renovation works in the case of flooding. The first attempts to couple the SWMM with 3D city models showed potential [22] but lacked the level of detail needed to capture all the dynamic processes during a rainfall event. Similar ideas were tested in the modelling of urban heat islands in cities [39].

5. Conclusions

This paper presented the concept of the EWL planning tool, and thus focused on analyzing flooding risks in urban areas under different climate scenarios. The tool enables the urban planner to detect potential flood-prone areas with different risk levels, both at present and in the coming decades. The EWL has a clear graphical layout presented using a traffic light methodology, which can support communication with developers and property owners when explaining the possible constraints regarding changes in the land use or the volume of buildings.
Hydraulic modelling was used to analyze flooding risks in two urban areas (Haapsalu and Söderhamn) under different climate scenarios and to identify the effects of extreme rainfall events and mitigation measures on the urban environment. The EWL tool presented in this paper enables the analysis of the impact of a single development (e.g., a single building project such as paving a gravel parking lot with asphalt, or a more detailed plan such as turning urban greenery into a shopping center) on UDS performance, and thus on the flooding risk of the whole catchment.
The EWL can be applied in the urban planning process, increasing a city’s resilience to pluvial floods and preventing the potential risks associated with extreme weather events.
The set-up and implementation of the EWL is not a stand-alone process but requires inputs from various databases and parties. Therefore, the main recommendations for urban decision makers to set up the system are as follows:
  • Ensuring that data regarding the existing infrastructure, land use and DEM are available and of a high quality is vital. Data availability regarding (historical) rainfall events, including data about flow rates and depths, are essential.
  • The set up of the GIS system should be checked. It should not only visualize, but also reflect the layout and the characteristic data of the real UDS. Photos of the database should eb included to achieve a better overview of the system.
  • Using future rainfall curves that are in accordance with the strategic climate adaptation plans in the region is important.
  • Innovation is not a standalone process and requires the cooperation between different stake holders, including academia, municipalities and local water companies.
  • One should learn from others who are already using the system, in order to set up procurements and technical descriptions to achieve the original goal.
  • Monitor your systems (precipitation, water quality, performance of the system, etc.). The more accurate data you have, the better your decision support tool is.
The planning tool will be further developed for the dynamic and prompt analysis of the impacts of new developments on an urban catchment under different climate scenarios, in order to define mitigation measures and technical design requirements.

Author Contributions

Conceptualization, I.A., M.T., N.K. and J.R.; methodology, I.A. and N.K.; validation, A.V., I.A. and K.K.; writing—original draft preparation, M.T., I.A. and J.R.; writing—review and editing, M.T., I.A., N.K., A.V. and K.K.; visualization, M.T., J.R., K.K. and N.K. All authors have read and agreed to the published version of the manuscript.

Funding

This work was supported by the Estonian Research Council, grant number PRG667, and European Union (European Regional Development Fund) Interreg Baltic Sea Region Programme, grant number #R093.

Data Availability Statement

The EWL methodology description and implementation results are available in the NOAH project web-site https://sub.samk.fi/projects/noah/ (accessed on 18 November 2021).

Acknowledgments

The authors acknowledge the invaluable insights from the case study areas, we are grateful for the assistance of Ingemar Olofsson and Maria Svensson from Söderhamn and Sirli Vaksmann, Peep Aedviir and Remi Treier from Haapsalu.

Conflicts of Interest

The authors declare no conflict of interest. The funders had no role in the design of the study; in the collection, analyses, or interpretation of data; in the writing of the manuscript, or in the decision to publish the results.

References

  1. European Commission. Forging a Climate-Resilient Europe—The New EU Strategy on Adaptation to Climate Change. Available online: https://eur-lex.europa.eu/legal-content/EN/TXT/HTML/?uri=CELEX:52021DC0082&from=EN (accessed on 19 September 2021).
  2. Santoso, H.B.; Idinoba, M.E.; Imbach, P. Climate scenarios: What we need to know and how to generate them. In Working Paper No. 45; Center for International Forestry Research (CIFOR): Bogor, Indonesia, 2008. [Google Scholar] [CrossRef]
  3. European Commission. Home—Climate-ADAPT. Available online: https://climate-adapt.eea.europa.eu/ (accessed on 24 September 2021).
  4. IPCC. AR5 Climate Change 2014: Impacts, Adaptation, and Vulnerability—IPCC. Available online: https://www.ipcc.ch/report/ar5/wg2/ (accessed on 3 October 2021).
  5. EAA. Urban Adaptation to Climate Change in Europe 2016—Transforming Cities in a Changing Climate—European Environment Agency. Available online: https://www.eea.europa.eu/publications/urban-adaptation-2016 (accessed on 18 August 2021).
  6. Tapia, C.; Abajo, B.; Feliu, E.; Mendizabal, M.; Martinez, J.A.; Fernández, J.G.; Laburu, T.; Lejarazu, A. Profiling urban vulnerabilities to climate change: An indicator-based vulnerability assessment for European cities. Ecol. Indic. 2017, 78, 142–155. [Google Scholar] [CrossRef]
  7. IPCC. 2021: Climate Change 2021: The Physical Science Basis. Contribution of Working Group I to the Sixth Assessment Report of the Intergovernmental Panel on Climate Change; Masson-Delmotte, V., Zhai, P., Pirani, A., Connors, S.L., Péan, C., Berger, S., Caud, N., Chen, Y., Goldfarb, L., Gomis, M.I., et al., Eds.; Cambridge University Press: Cambridge, MA, USA, 2021; in press. [Google Scholar]
  8. Disaster Risk. Available online: https://www.preventionweb.net/understanding-disaster-risk/component-risk/disaster-risk (accessed on 8 October 2021).
  9. Meerow, S.; Newell, J.P. Urban resilience for whom, what, when, where, and why? Urban Geogr. 2019, 40, 309–329. [Google Scholar] [CrossRef]
  10. Document Search—Web of Science Core Collection. Available online: https://www.webofscience.com/wos/woscc/basic-search (accessed on 2 November 2021).
  11. Kourtis, I.M.; Tsihrintzis, V.A. Adaptation of urban drainage networks to climate change: A review. Sci. Total. Environ. 2021, 771, 145431. [Google Scholar] [CrossRef]
  12. Gandini, A.; Garmendia, L.; Prieto, I.; Álvarez, I.; San-José, J.-T. A holistic and multi-stakeholder methodology for vulnerability assessment of cities to flooding and extreme precipitation events. Sustain. Cities Soc. 2020, 63, 102437. [Google Scholar] [CrossRef]
  13. Albrechts, L. Strategic (spatial) planning reexamined. Environ. Plann. B Plann. Des. 2004, 31, 743–758. [Google Scholar] [CrossRef] [Green Version]
  14. Coaffee, J. Towards next-generation urban resilience in planning practice: From securitization to integrated place making. Plan. Pract. Res. 2013, 28, 323–339. [Google Scholar] [CrossRef]
  15. Leichenko, R. Climate change and urban resilience. Curr. Opin. Environ. Sustain. 2011, 3, 164–168. [Google Scholar] [CrossRef]
  16. Bush, J.; Doyon, A. Building urban resilience with nature-based solutions: How can urban planning contribute? Cities 2019, 95, 102483. [Google Scholar] [CrossRef]
  17. La Rosa, D.; Pappalardo, V. Planning for spatial equity—A performance based approach for sustainable urban drainage systems. Sustain. Cities Soc. 2020, 53, 101885. [Google Scholar] [CrossRef]
  18. Simperler, L.; Himmelbauer, P.; Ertl, T.; Stoeglehner, G. Prioritization of stormwater management sites in urban areas. J. Environ. Manage 2020, 265, 110507. [Google Scholar] [CrossRef]
  19. Vartholomaios, A.; Kalogirou, N.; Athanassiou, E.; Papadopoulou, M. The green space factor as a tool for regulating the urban microclimate in vegetation-deprived Greek cities. In Proceedings of the International Conference On “Changing Cities”: Spatial, Morphological, Formal & Socio-Economic Dimensions, Skiathos Island, Greece, 18–21 June 2013. [Google Scholar] [CrossRef]
  20. Sardella, A.; Palazzi, E.; von Hardenberg, J.; Del Grande, C.; De Nuntiis, P.; Sabbioni, C.; Bonazza, A. Risk mapping for the sustainable protection of cultural heritage in extreme changing environments. Atmosphere 2020, 11, 700. [Google Scholar] [CrossRef]
  21. Handmer, J.; Cartwright, W. An Evaluation of the Flood Warning Information System. 2005. Available online: https://www.semanticscholar.org/paper/An-Evaluation-of-the-Flood-Warning-Information-Handmer-Cartwright/4086c44a1bddc4d27a0a759d1fa00b99853ef0a1 (accessed on 3 October 2021).
  22. Shen, J.; Zhou, J.; Zhou, J.; Herman, L.; Reznik, T. Constructing the city GML ADE for the multi-source data integration of urban flooding. ISPRS Int. J. Geo-Inf. 2020, 9, 359. [Google Scholar] [CrossRef]
  23. Bach, P.M.; Kuller, M.; McCarthy, D.T.; Deletic, A. A spatial planning-support system for generating decentralised urban stormwater management schemes. Sci. Total. Environ. 2020, 726, 138282. [Google Scholar] [CrossRef] [PubMed]
  24. Zeng, Z.; Yuan, X.; Liang, J.; Li, Y. Designing and implementing an SWMM-based web service framework to provide decision support for real-time urban stormwater management. Environ. Model. Softw. 2021, 135, 104887. [Google Scholar] [CrossRef]
  25. Mikovits, C.; Tscheikner-Gratl, F.; Jasper-Tönnies, A.; Einfalt, T.; Huttenlau, M.; Schöpf, M.; Kinzel, H.; Rauch, W.; Kleidorfer, M. Decision support for adaptation planning of urban drainage systems. J. Water Resour. Plan. Manag. 2017, 143, 04017069. [Google Scholar] [CrossRef]
  26. Rossman, L.A. Storm Water Management Model User’s Manual Version 5.1. US EPA. Available online: https://www.epa.gov/sites/production/files/2019-02/documents/epaswmm5_1_manual_master_8-2-15.pdf (accessed on 3 October 2021).
  27. Cristina, M.; Paule-Mercado, A.; Lee, C.-H. Calibration of the SWMM for a mixed land use catchment in Yongin, South Korea. Desalin. Water Treat. 2017, 63, 381–388. [Google Scholar] [CrossRef]
  28. Warsta, L.; Niemi, T.J.; Taka, M.; Krebs, G.; Haahti, K.; Koivusalo, H.; Kokkonen, T. Development and application of an automated subcatchment generator for SWMM using open data. Urban Water J. 2017, 14, 954–963. [Google Scholar] [CrossRef]
  29. EVS. EVS 848:2013—Väliskanalisatsioonivõrk. Available online: https://www.evs.ee/et/evs-848-2013 (accessed on 1 September 2021).
  30. Luhamaa, A.; Kallis, A.; Mändla, K.; Männik, A.; Pedusaar, T.; Rosin, K. Eesti Tuleviku Kliimastsenaariumid Aastani 2100. 2014. Available online: https://www.klab.ee/wp-content/uploads/sites/4/2016/04/2016-04-07-KAUR_Lopparuanne.pdf (accessed on 3 October 2021).
  31. Jato-Espino, D.; Sillanpää, N.; Charlesworth, S.M.; Rodriguez-Hernandez, J. A simulation-optimization methodology to model urban catchments under non-stationary extreme rainfall events. Environ. Model. Softw. 2019, 122, 103960. [Google Scholar] [CrossRef] [Green Version]
  32. Anim, D.O.; Fletcher, T.D.; Pasternack, G.B.; Vietz, G.J.; Duncan, H.P.; Burns, M.J. Can catchment-scale urban stormwater management measures benefit the stream hydraulic environment? J. Environ. Manag. 2019, 233, 1–11. [Google Scholar] [CrossRef]
  33. EEA. Climate Change Adaptation and Disaster Risk Reduction in Europe—European Environment Agency. Available online: https://www.eea.europa.eu/publications/climate-change-adaptation-and-disaster (accessed on 8 October 2021).
  34. Üldplaneering—Haapsalu Linnavalitsus. Available online: https://www.haapsalu.ee/uldplaneering (accessed on 12 October 2021).
  35. Annus, I.; Vassiljev, A.; Kändler, N.; Kaur, K. Automatic calibration module for an urban drainage system model. Water 2021, 13, 1419. [Google Scholar] [CrossRef]
  36. Kändler, N.; Annus, I.; Vassiljev, A.; Puust, R. Peak flow reduction from small catchments using smart inlets. Urban Water J. 2020, 17, 577–586. [Google Scholar] [CrossRef]
  37. Kändler, N.; Annus, I.; Vassiljev, A. Controlling peak runoff from plots by coupling street storage with distributed real time control. Urban Water J. 2021. [Google Scholar] [CrossRef]
  38. Sadler, J.M.; Goodall, J.L.; Behl, M.; Bowes, B.D.; Morsy, M.M. Exploring real-time control of stormwater systems for mitigating flood risk due to sea level rise. J. Hydrol. 2020, 583, 124571. [Google Scholar] [CrossRef]
  39. Ignatius, M.; Wong, N.H.; Martin, M.; Chen, S. Virtual Singapore integration with energy simulation and canopy modelling for climate assessment. In IOP Conference Series: Earth and Environmental Science; IOP Publishing: Bristol, UK, 2019; Volume 294, p. 012018. [Google Scholar] [CrossRef]
Figure 1. Layout of the integrated planning layer.
Water 13 03340 g001
Figure 2. Comparison between the measured and modelled flow rates in Haapsalu.
Water 13 03340 g002
Figure 3. Rainfall intensity graphs for selected scenarios.
Water 13 03340 g003
Figure 4. Case study areas are located in the Baltic Sea region. Haapsalu is located on the west coast of Estonia and Söderhamn on the west coast of Bothnia Bay in Sweden.
Water 13 03340 g004
Figure 5. Haapsalu case study area.
Water 13 03340 g005
Figure 6. Söderhamn case study area.
Water 13 03340 g006
Figure 7. Visual presentation of the EWL in Haapsalu for scenarios 1, 2 and 3. The colors indicate the risk levels: green indicates low risk, (i.e., risk level 1) yellow indicates moderate risk (i.e., level 2) and red indicates severe flooding risk (i.e., level 3); light blue indicates no risk.
Water 13 03340 g007
Figure 8. Visual presentation of the EWL. Flooding risk map of Söderhamn; scenario 2.
Water 13 03340 g008
Figure 9. Overlapping EWL with green areas layer to seek for the locations to implement solutions for storm water management.
Water 13 03340 g009
Figure 10. Application potential of EWL to both structural and non-structural measures.
Water 13 03340 g010
Table 1. Key characteristics of the case study areas.
CharacteristicHaapsaluSöderhamn
Size of the case study area70 ha100 ha
Differences in heights7.5 m16.5 m
Length of storm water system4.6 km7.2 km
Pipeline diameters200–1000 mm110–1200 mm
Share of impermeable cover in the catchments55.6%31.4%
Number of land parcels in the case study area427427
Average annual rainfall670 mm670 mm
Average monthly rainfall (winter)32–42 mm37–52 mm
Average monthly rainfall (July/August)75 mm83 mm
Table 2. Flooding indicators for different scenarios in Haapsalu.
Climate ScenariosDescriptionNumber of Flooding NodesTotal Water Volume, m3Max Duration, min
12-year EVS 8481917.2022
22-year RCP 4.53645.9532
32-year RCP 8.568179.160
Table 3. Number of related properties and their risk levels for scenarios 1, 2 and 3 in Haapsalu.
Climate ScenariosNumber of Land Parcels AffectedRisk Level 1, %Risk Level 2, %Risk Level 3, %
12370300
229385210
343261437
Table 4. Number of related properties and their risk levels for scenarios 1, 2 and 3 in Söderhamn.
Climate ScenariosNumber of Land Parcels AffectedRisk Level 1, %Risk Level 2, %Risk Level 3, %
1108761410
2168701812
3230611920
Table 5. Flooding indicators for different scenarios in Söderhamn.
Climate ScenariosDescriptionNumber of Flooding NodesTotal Water Volume, m3Max Duration, min
12-year EVS 848841731141
22-year RCP 4.51151356108
32-year RCP 8.51782705154
Publisher’s Note: MDPI stays neutral with regard to jurisdictional claims in published maps and institutional affiliations.

