Article

Laboratory and Numerical Study of Saltwater Upconing in Fractured Coastal Aquifers

1
School of Natural and Built Environment, Queen’s University Belfast, Belfast BT9 5AG, UK
2
College of Engineering, Design and Physical Sciences, Brunel University, London UB8 3PH, UK
*
Author to whom correspondence should be addressed.
Water 2021, 13(23), 3331; https://doi.org/10.3390/w13233331
Submission received: 21 October 2021 / Revised: 21 November 2021 / Accepted: 22 November 2021 / Published: 24 November 2021
(This article belongs to the Special Issue Coastal Aquifers: Seawater/Saltwater Intrusion)

Abstract

:
This study investigated the saltwater upconing mechanism in fractured coastal aquifers. Head-induced saline intrusion was initiated into three narrow sandbox aquifers containing individual horizontal discontinuities placed on different positions. Subsequently, using a peristaltic pump, freshwater was abstracted from the aquifers’ center, triggering saltwater upconing. Progressively larger pumping rates were applied until critical conditions, resulting in the wells’ salinization, were achieved. Advanced image analysis algorithms were utilized to recreate the saltwater concentration fields and quantify the extent of the saline wedges with a high accuracy. A numerical model was successfully employed to simulate the laboratory results and conduct a comprehensive sensitivity analysis, further expanding the findings of this investigation. The impact of the fractures’ length, permeability and position on the upconing mechanism was identified. It was established that the presence of high permeability discontinuities significantly affected aquifer hydrodynamics. The conclusions of this study could constitute a contribution towards the successful management of real-world fractured coastal aquifers.

1. Introduction

Freshwater overexploitation is the main cause of saltwater intrusion (SWI) in coastal aquifers across the globe [1,2,3]. When excessive freshwater is abstracted from coastal hydrological systems, the saltwater–freshwater interface may move further landward, reaching the location of the pumping wells. This physical mechanism, called saltwater upconing [4], can lead to the eventual salinization of abstraction wells. Since mixing freshwater with only 1 percent of seawater makes it unfit for drinking [5], pumping-induced saline intrusion could potentially threaten the access to freshwater for one half of the global population which currently resides less than 200 km from the coast [6].
Approximately two billion people rely on freshwater abstracted from fractured aquifers [7], and because of that, their hydrogeological attributes have been investigated extensively over the years [8,9,10,11,12]. Coastal fractured aquifers are generally more vulnerable to saltwater intrusion than other hydrological systems [13]. This vulnerability was the driving force behind multiple studies, utilizing both field scale experimental observations [14,15,16,17,18] and numerical modelling [19,20] to quantify SWI in real-word fractured aquifers. Freshwater abstraction has been recognized as the root cause of saline intrusion in the fractured coastal aquifer in the island of Crete in Greece [21] as well as the carbonate aquifer in southern Tuscany, Italy [22]. Park et al. [23] studied the impact of freshwater abstraction on a tidally influenced fractured bedrock aquifer in Korea, while Romanazzi et al. [24] and Steikakis et al. [25] modelled the potential impact of climate change on pumping-induced saline intrusion in two karstic coastal aquifers in southern Italy and Greece, respectively. Similarly, freshwater abstraction constitutes a primary threat to the phreatic limestone aquifer, upon which the city of Tampa, Florida, in the United States, depends to abstract freshwater [26].
Real-world fractured aquifers are complex systems, and their hydrodynamics are affected by a series of factors whose impact cannot be easily quantified [27]. Therefore, regional-scale investigations of SWI do not constitute the ideal approach towards identifying the fundamental physical mechanisms influencing pumping-induced saline intrusion in fractured hydrological systems. Laboratory sandbox setups offer an idealized physical approximation of groundwater flow and have been successfully utilized over the years to study specific aspects of aquifer SWI, such as the freshwater-saltwater interface [28,29], the impact of tides [30,31,32,33], variations in saltwater density [34] and in applied hydraulic gradients [35], alongside the suitability of various SWI prevention approaches [36,37,38]. It has been established that aquifer heterogeneity significantly affects groundwater flow; thus, saline intrusion in heterogeneous [39,40,41] and more specifically stratified coastal aquifers [36,42,43,44,45,46,47] has been studied extensively utilizing laboratory-scale experiments. Nevertheless, sandbox investigations of groundwater flow in fractured porous media are relatively rare. Etsias et al. [48] conducted the first ever laboratory study of saltwater intrusion in fractured coastal aquifers. Through a series of experimental measurements, the study demonstrated that the presence of high permeability aquifer discontinuities can significantly alter saltwater flow dynamics, leading to a saline intrusion front fundamentally different from the traditional wedge-shaped front, observed in homogeneous and stratified hydrological systems.
Werner et al. [49] conducted one of the first sandbox studies of saltwater upconing utilizing an axisymmetric laboratory model. In their laboratory study of the freshwater lenses, usually present in small islands, Stoeckl and Houben [50] demonstrated that the saltwater upconing mechanism is less sensitive to horizontal than vertical pumping wells. Mehdizadeh et al. [51] considered an inclined freshwater-saltwater interface to validate a sharp interface analytical approach, while Noorabadi et al. [52] utilized a similar experimental setup to quantify the impact of well depth and saltwater concentration on the critical abstraction rate—that is, the flowrate in which well salinization occurs. Abdelgawad et al. [53] introduced the first experimental saltwater upconing investigation incorporating automated image processing, while Abdoulhalik and Ahmed [54] examined the impact of aquifer permeability on saltwater upconing, demonstrating that less-permeable hydrological systems are more vulnerable to pumping-induced saline intrusion. Stoeckl et al. [55] utilized laboratory testing to introduce the novel concept of post-pumping saline intrusion, which is the phenomenon of seawater intruding further inland than the location of a well after pumping has ceased. While all these studies assumed homogenous aquifer structures, Abdoulhalik et al. [56] performed the only experimental study investigating pumping well salinization in heterogeneous-stratified coastal aquifers. Since the hydrodynamics of fractured porous media vary significantly from those of granular aquifers, the fundamental mechanisms of pumping-induced saline intrusion in fractured aquifers are far from understood.
To the best of the authors’ knowledge, this is the first ever laboratory scale study of saltwater upconing in fractured coastal aquifers. Experimental measurements were conducted in a series of synthetic aquifers with high permeability discontinuities. Freshwater was abstracted from the porous medium, applying increasing pumping flowrates, until the saltwater upconing mechanism was clearly observed and pumping well salinization was established. The ensuing laboratory data demonstrated the impact of individual fractures on pumping-induced saline intrusion. Moreover, numerical modeling was employed to contact a rigorous sensitivity analysis further expanding the experimental findings. As it is common with sandbox investigations [57], the two-dimensional nature of the presented experiments does not permit the straightforward association of the study’s conclusions to three-dimensional aquifers. Nevertheless, the presented results could have implications for the successful management of real-world coastal fractured aquifers, preventing the occurrence of pumping-induced saline intrusion.

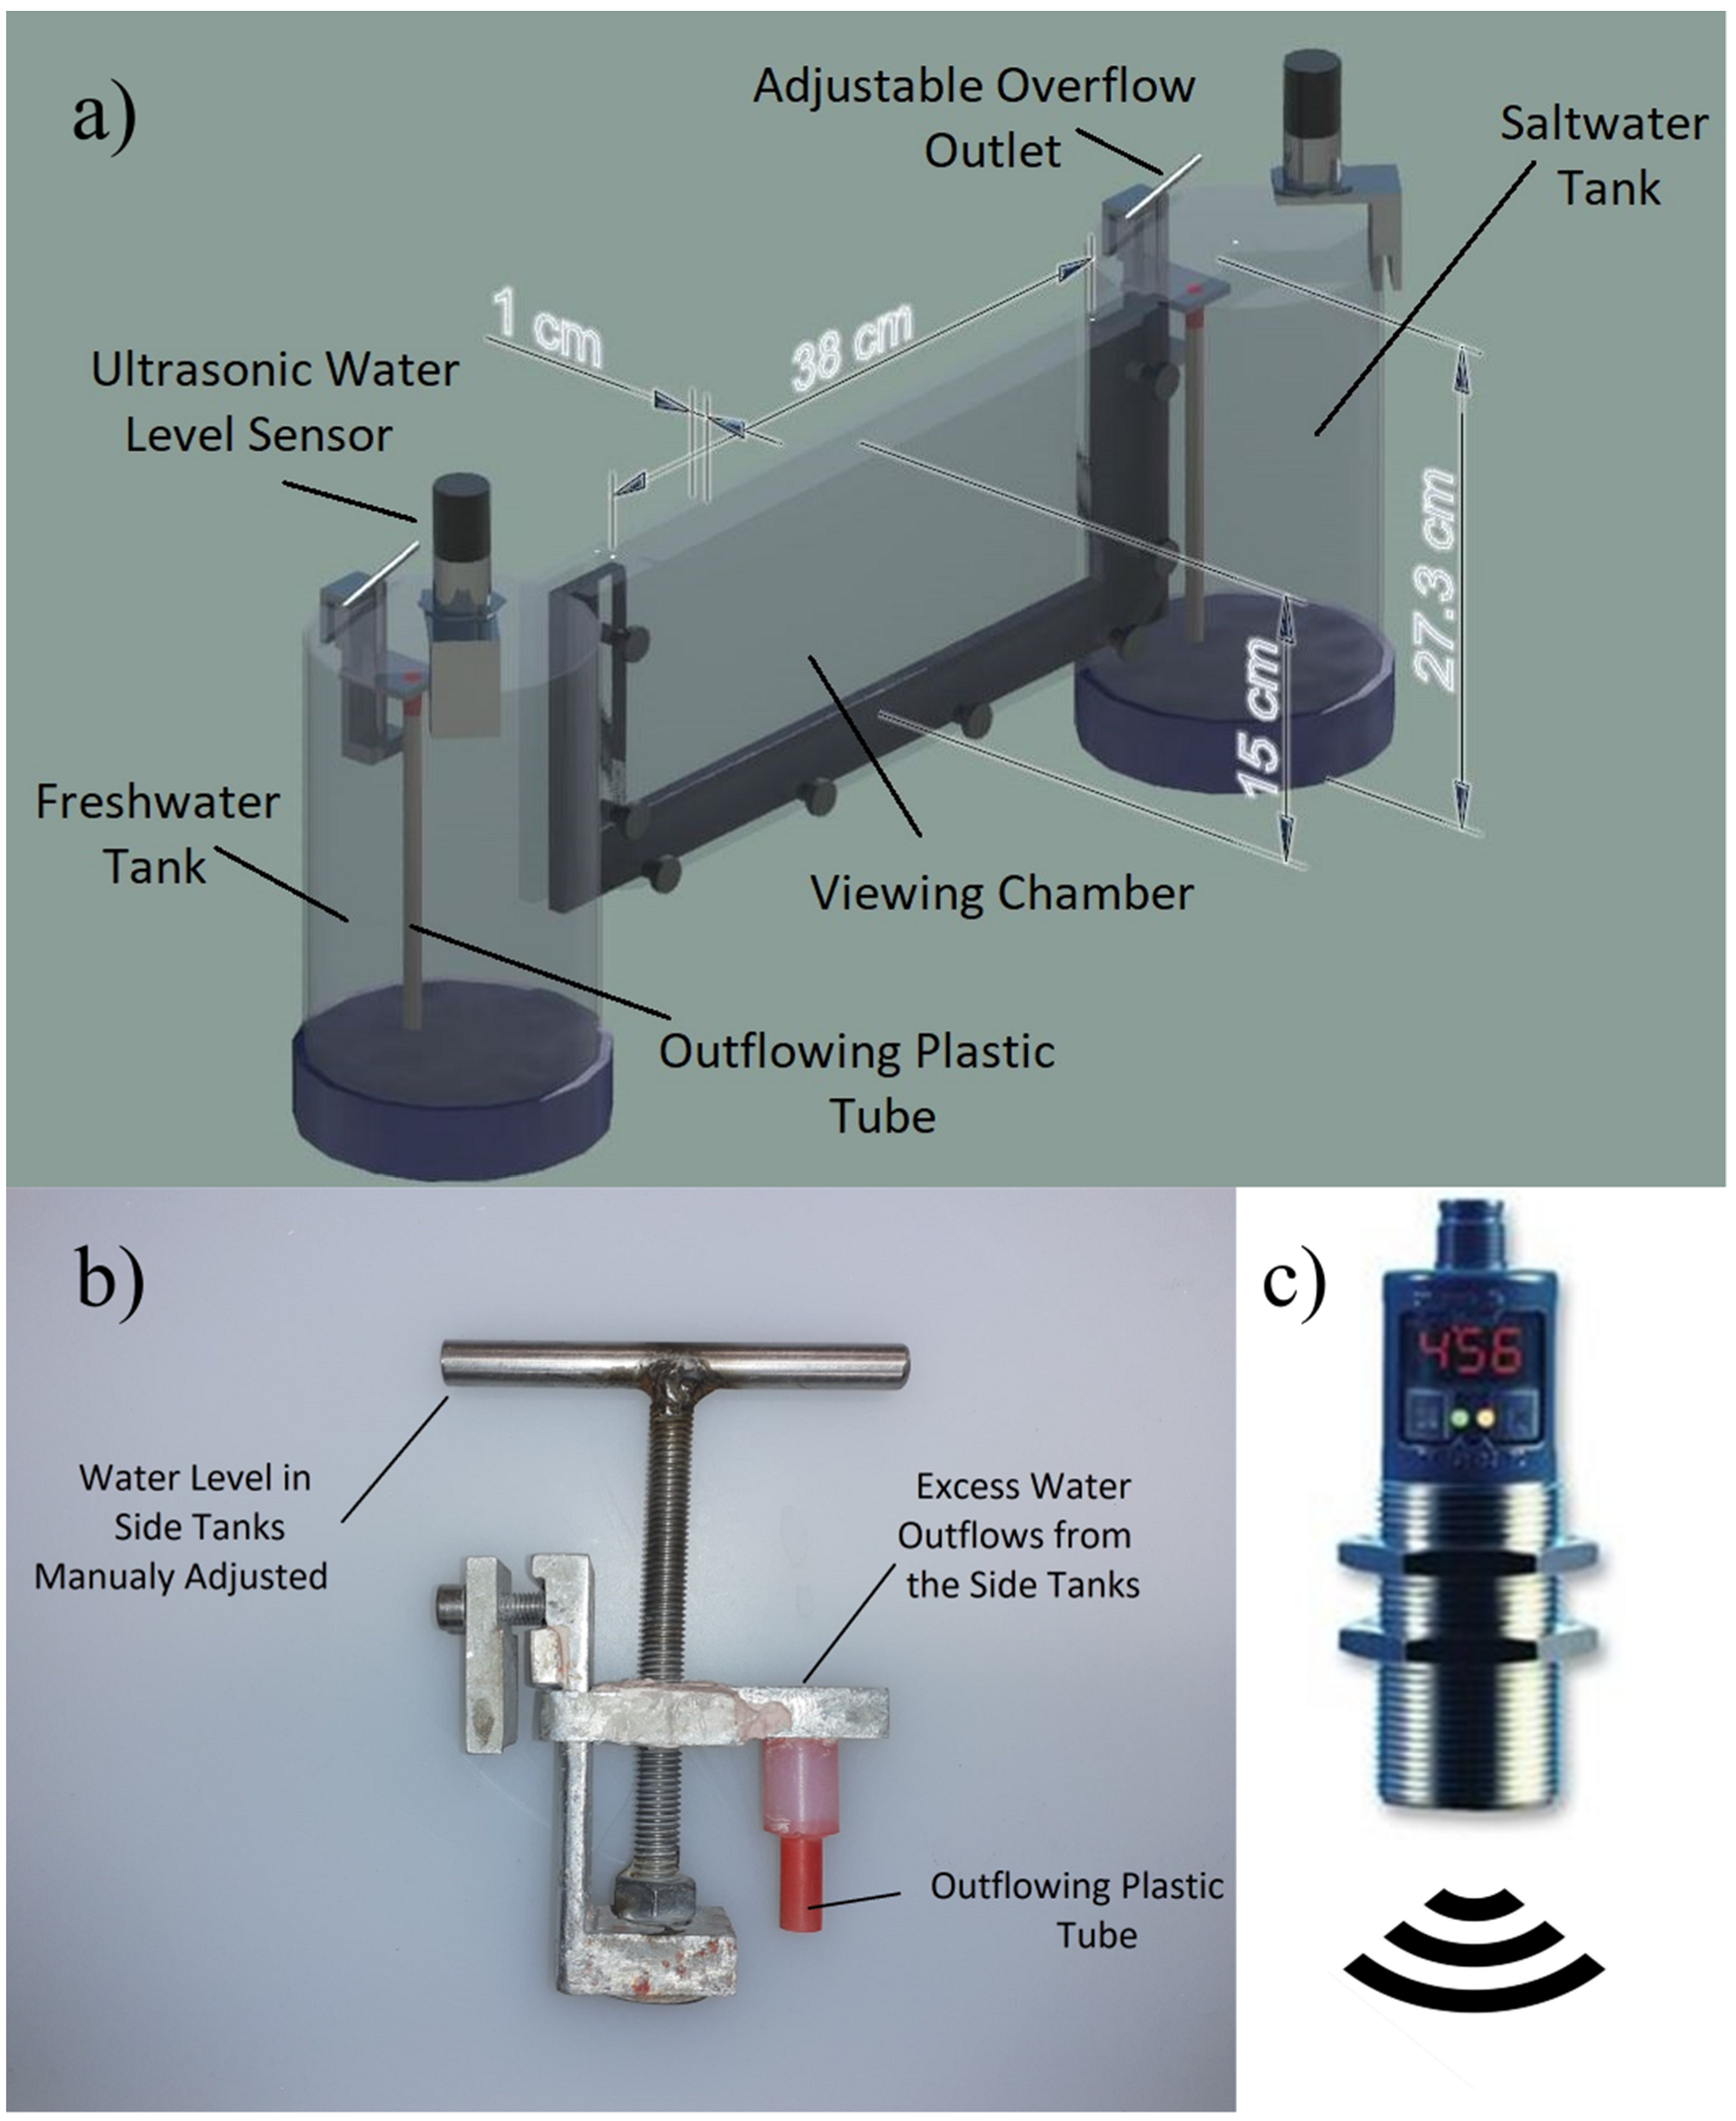
2. Experimental Setup

The laboratory setup employed in this investigation was presented in detail by Robinson et al. [58] and Etsias et al. [48]. The sandbox (Figure 1a) comprised a thin rectangular viewing chamber (0.38 m × 0.15 m × 0.01 m) bounded by two cylindrical tanks at each side. The synthetic porous medium was recreated by siphoning pre-sieved, clear glass spheres, with a diameter of 1090 μm, into the central sand tank without being further compacted. Two acrylic mesh screens, with 0.5 mm apertures, positioned at the sides of the viewing chamber, secured the glass beads within, while also enabling water flow between the central chamber and the side-tanks. The left side-chamber was filled with freshwater (1000 kg/m3), while the right one with saltwater with a density of 1025 kg/m3. To visualize groundwater flow inside the porous medium, saltwater was mixed with red food coloring (Allura-red) at a concentration of 0.15 g/L. Water was continuously supplied from the bottom of the two side-reservoirs. The water level of each tank was fine-tuned using two adjustable-height overflow outlets (Figure 1b) positioned at the top of each reservoir, while it was monitored with high accuracy (0.2 mm) using two ultrasonic sensors (Figure 1c). Measurements were conducted in a dark room with two LED panels (Camtree® 600) placed at the back of the sandbox apparatus constituting the only source of illumination. High resolution experimental images were captured at 1-min intervals, using a Nikon D850 Digital SLR Camera equipped with a Nikkor FX 60 mm lens.
A 15 cm long by 0.8 cm wide hollow cylinder with a volume of 30.16 cm3, fabricated from a stainless-steel wire mesh, with 0.7 mm openings, was employed to simulate the high permeability laboratory discontinuities. In total, three synthetic aquifers were created, where the cylinder was horizontally placed either in the middle, or adjacent to the right and left boundaries of the viewing chamber. For ease of reference, the investigated experimental aquifers will henceforth be identified as fractured-right (Figure 2a), fractured-center (Figure 2b) and fractured-left (Figure 2c). It is worth noticing that the fracture’s size is relatively big in comparison to the surrounding porous medium, resembling more the layout of caves found in real-world karst aquifers. This larger size was deliberately chosen by the authors to help visualize more vividly the impact of high permeability discontinuities on saltwater hydrodynamics. Porous medium permeability, without the fractures, was experimentally determined at 1.83 × 10⁻⁹ m2 via an in-situ test on the laboratory flow domain using Darcy’s law, while porosity was equal to 0.385.
To simulate the pumping well, a 50 mm long Terumo Neolus hypodermic needle with an internal and external diameter of 0.7 mm and 1.1 mm, respectively, was inserted vertically into the glass bead porous medium from the open surface of the viewing chamber. The needle was connected to an auto-control peristaltic pump (Verderflex peristaltic, electric-operated, positive displacement pump) using a rubber hose with an internal diameter of 4.8 mm. The hypodermic needle was firmly stabilized so that its tip was located 8.5 cm from the bottom of the tank and at an equal distance of 19 cm from viewing chamber’s left (freshwater) and right (saltwater) side boundaries. The same abstraction point position was applied for all three experimental aquifers. A similar laboratory pumping setup was employed by Abdelgawad et al. [53] and Abdoulhalik et al. [56].
Experimental measurements comprised three distinct phases. In the first stage, saline intrusion was initiated in all three synthetic aquifers by applying a hydraulic head difference (dH) of 6 mm between the freshwater and saltwater boundaries (Table 1). The resulting hydraulic gradients were comparable to those reported for various real-world coastal aquifers [59,60]. To ensure that salt concentration in the right cylinder was not affected by the outflow of freshwater through the glass bead porous medium, water salinity was measured at 5-min intervals using a YSI Professional Plus Instrument (Pro Plus) water quality meter. Once the freshwater-saltwater interface reached steady state, water abstraction was initiated through the needle. The salinity of the pumped water was measured with the aforementioned water quality meter. In cases where the abstracted freshwater was mixed with more than 1% of saltwater, critical abstraction rate was deemed to have been reached. The initial pumping rate was equal to 0.5 ml/sec. This value was identified, through trial and error, as the lowest one to cause salinization in one of the three test cases (fractured-right). Progressively larger pumping rates (Table 2 and Table 3) were applied in the remaining two synthetic aquifers until the critical salinity was reached. The utilized pumping step (0.3 ml/sec) was deemed to strike an acceptable compromise between the experimental accuracy and the total duration of the measurements. During the last experimental stage, pumping was terminated, and the saltwater–freshwater interface retreated further seaward. Every abstraction rate was applied for a total of 50 min—this was also the duration of the initial intrusion and the final saltwater retreat phases. This time period was proven sufficient to ensure that the aquifer hydrodynamics reached steady state in each one of the experimental stages.
The current study utilized the automated image processing tools developed and validated at Queen’s University Belfast [58,61,62]. The monochromatic green light intensity values of the experimental photos were imported into a pre-trained shallow Artificial Neural Network (ANN), consisting of a single hidden layer with ten neurons, in order to derive the saltwater (SW) concentration fields inside the viewing chamber (Figure 2). This enabled the quantification of variations in the fundamental SWI characteristics such as the toe length (TL) of the saline wedge, the volume of the intruding saltwater and the extent of the mixing zone, with a high temporal and spatial precision. TL was calculated as the horizontal distance between the right (seawater) aquifer boundary and the point where the 50% concentration isoline intersects the viewing chamber’s bottom, while saline volume fraction expressed the percentage of image pixels with a saline concentration of 75% or more. Previous studies using a similar laboratory setup [58] calculated the width of the mixing zone as the vertical distance between the 25% and 75% saltwater concentration isolines. Nevertheless, the presence of fractures in combination with saltwater upconing resulted in uniquely shaped saltwater–freshwater interfaces, as well as the formation of distinct saline enclaves inside the experimental aquifers, which made explicit calculations of the width of the mixing zone problematic. Instead, an alternative variable—the mixed concentration volume fraction—was utilized to successfully quantify the extent of the mixing zone. Similar to the saline volume fraction, it was equal to the percentage of image pixels with a saltwater concentration varying between 25% and 75%.

3. Numerical Modelling

Due to the relatively large size and well-defined shape of the experimental discontinuities, a two-dimensional, saturated-unsaturated, finite element, variable-density, groundwater flow model was created in SUTRA [63] to simulate SWI inside the three sandbox fractured aquifers. The aquifers were represented by a rectangular, 38 cm long by 13.4 cm wide, 2-dimensional flow area which was uniformly discretized using a structured rectangular mesh. The utilized element size (1.22 mm) complied with the Peclet number criterion established by Voss and Souza [64], while the applied dispersivity values (Table 1) were within the range formulated by Abarca and Clement [65]. As mentioned in the previous section, porous medium permeability and porosity values used in the numerical models were experimentally determined. Through a rigorous sensitivity analysis, it was established that the laboratory fractures were 25 times more permeable than the surrounding glass bead porous medium. Since the steel mesh cylinders were hollow, discontinuity porosity was set equal to 1. The image analysis tools introduced by Etsias et al. [62] enabled the high precision identification of the position and shape of the experimental discontinuities inside the aquifer. Using these tools each individual element of the numerical model was assigned the hydrological characteristics of either the fracture or the porous medium. The van Genuchten equation [66] was employed to simulate unsaturated flow; the utilized parameters (Table 1) were similar to those obtained from previous laboratory testing on glass beads of comparable diameter [67,68].
Hydrostatic freshwater (C = 0%) and saltwater (C = 100%) boundary conditions, where C equals to the saltwater concentration, were applied to the left and right sides of the porous medium domain. It is worth noticing that, even though head induced saltwater intrusion is commonly studied in laboratory scale investigations, hydraulic head is not defined in variable density systems as it was highlighted by Post et al. [69]. The simulation timestep was set equal to 1 s. Stress phases identical with those recreated in the sandbox setup were applied to numerical aquifers. An initial head-induced saline intrusion phase was followed by a period of freshwater abstraction, where one, two and three distinct pumping rates were applied to the fractured-right, fractured-center and fractured-left aquifers, respectively. Finally, pumping was terminated, and the saltwater–freshwater interface receded. Similar to the laboratory experiments, the stress periods for each numerical aquifer were 50 min long. All the numerical model parameters are listed in Table 1. The near perfect match between the experimental and the numerical saltwater concentration fields, demonstrated in Figure 2 and Figures 4–6, confirms the successful simulation of groundwater flow dynamics within the three laboratory test aquifers.
Apart from simulating the experimental data, the numerical model was employed to conduct a detailed sensitivity analysis, further expanding the study’s findings. In total, six distinct sensitivity scenarios were created to quantify the impact of the individual fracture position and length, alongside the depth of the pumping wells, the applied hydraulic head difference, and the aquifer’s porous medium and discontinuity permeability values on the saltwater upconing mechanism. To better assess the understanding of this study, these scenarios are presented alongside their corresponding results in Section 4.2.

4. Results and Discussion

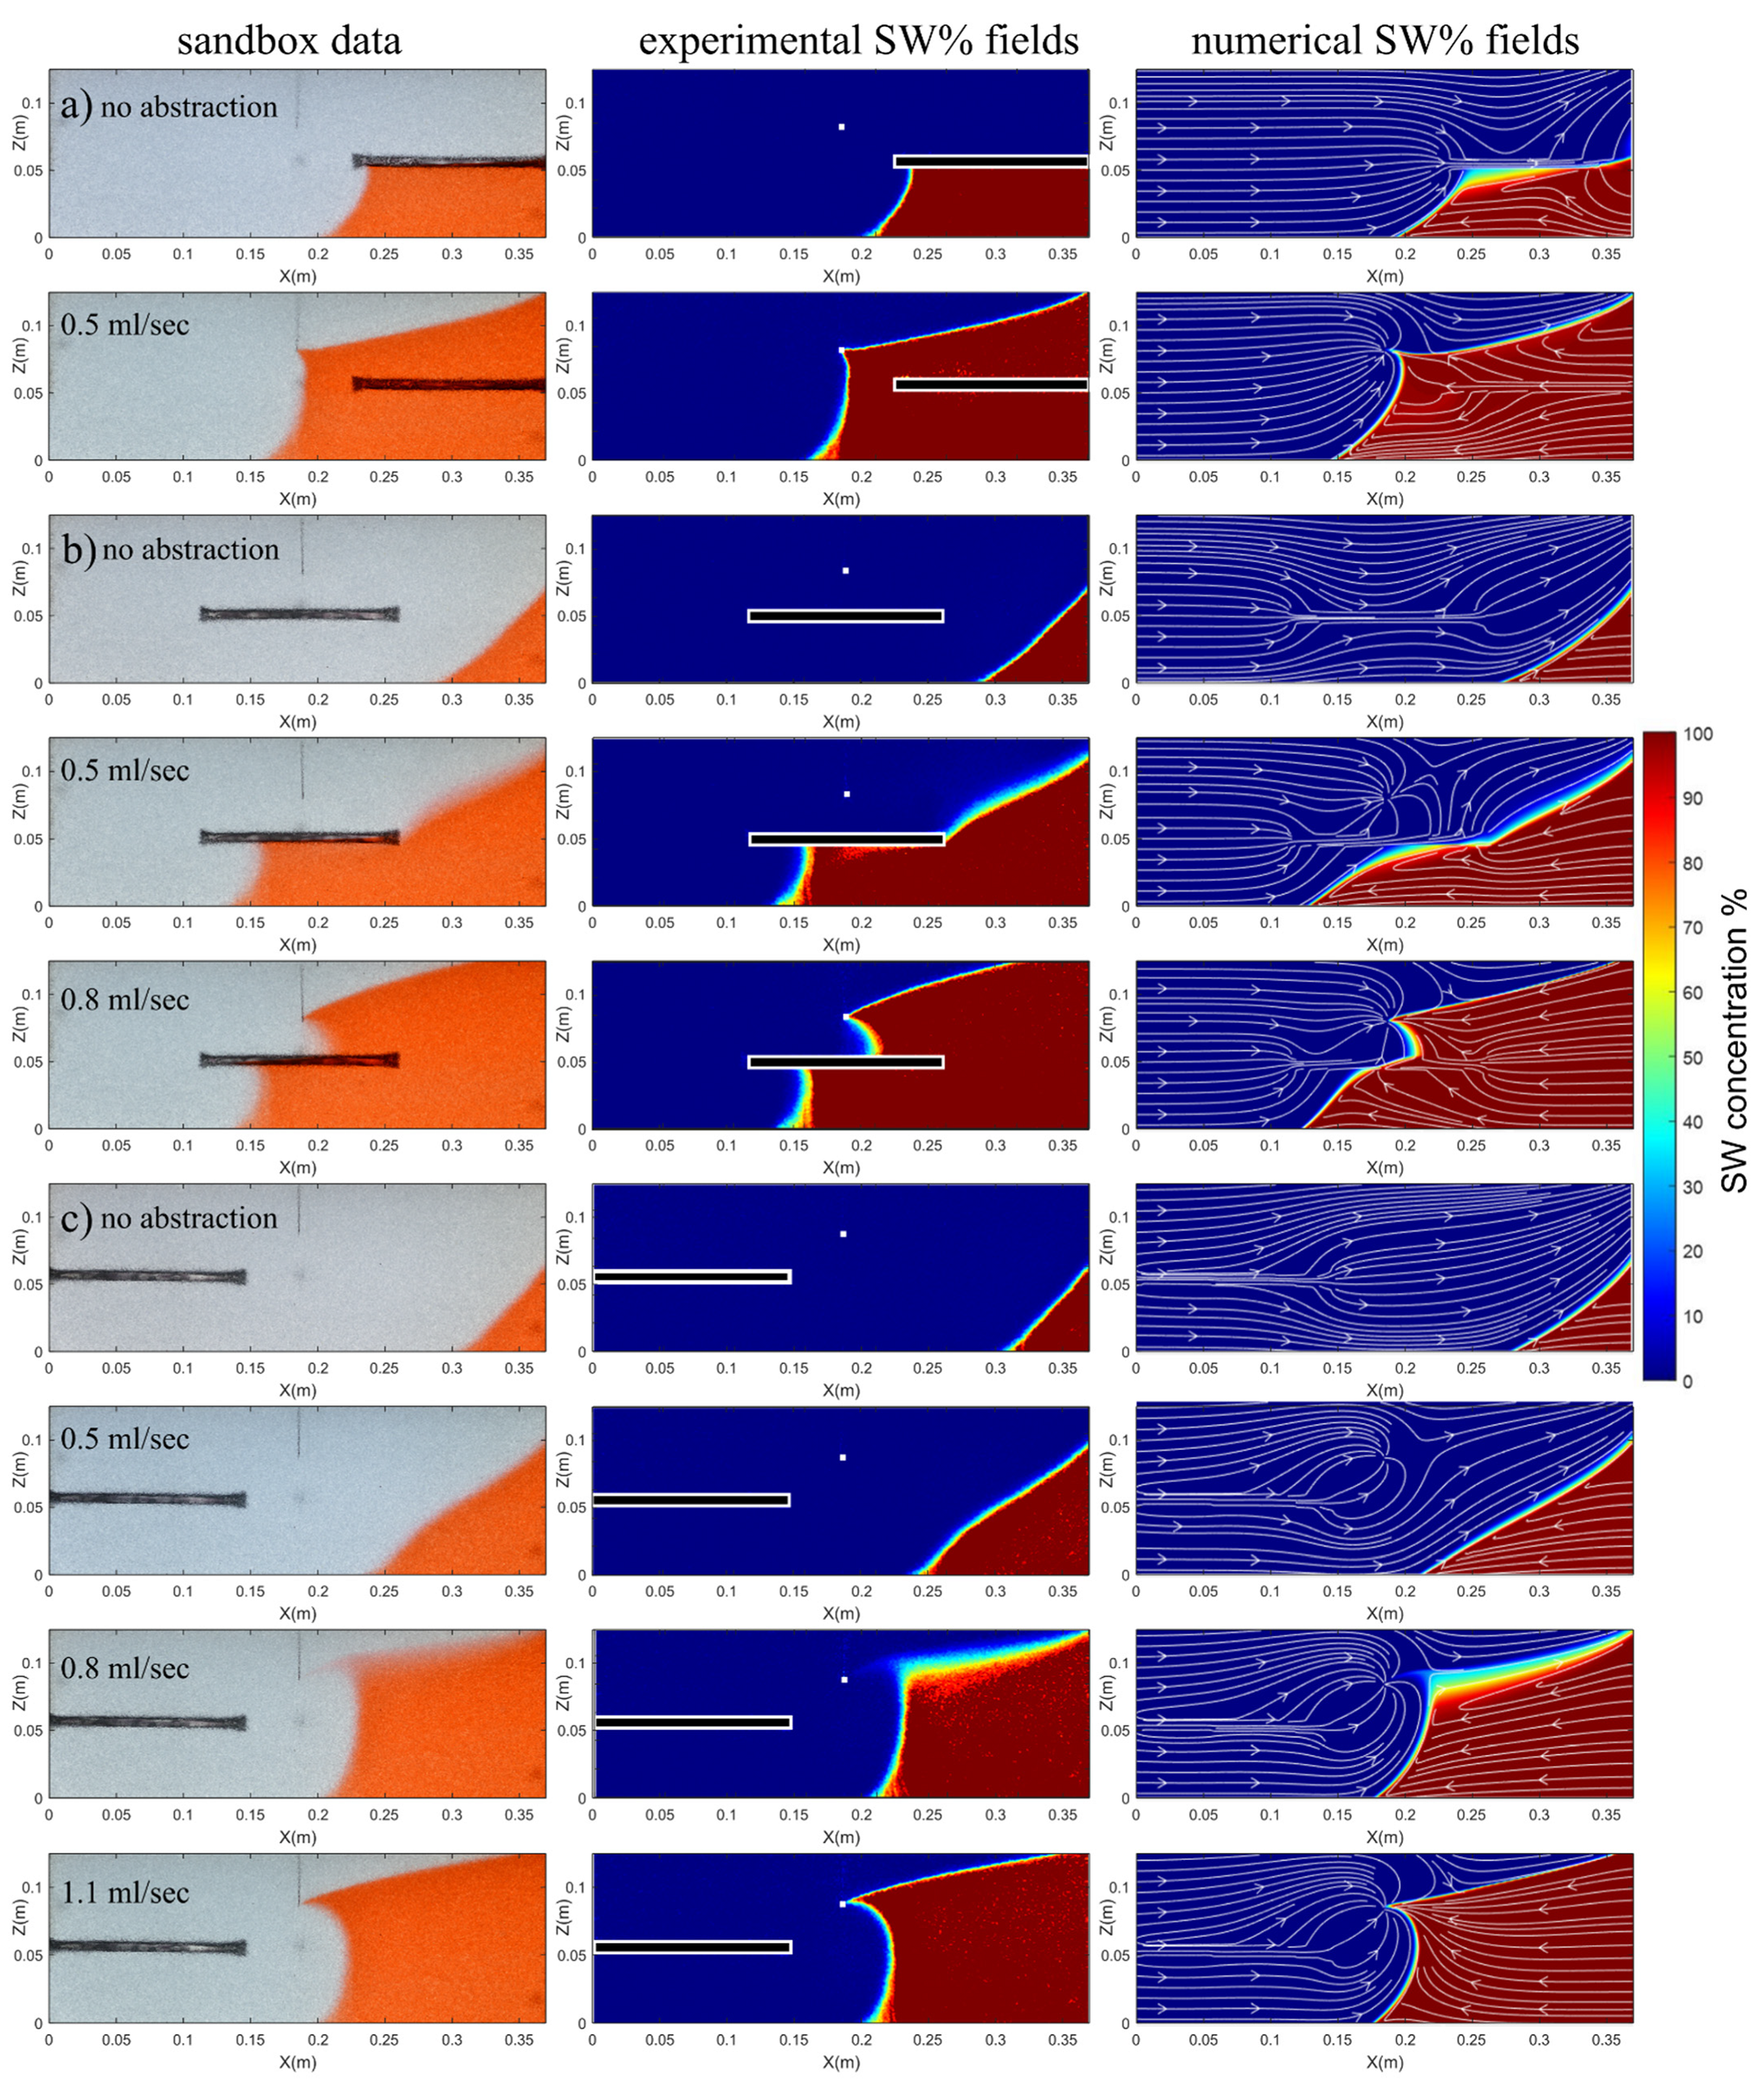
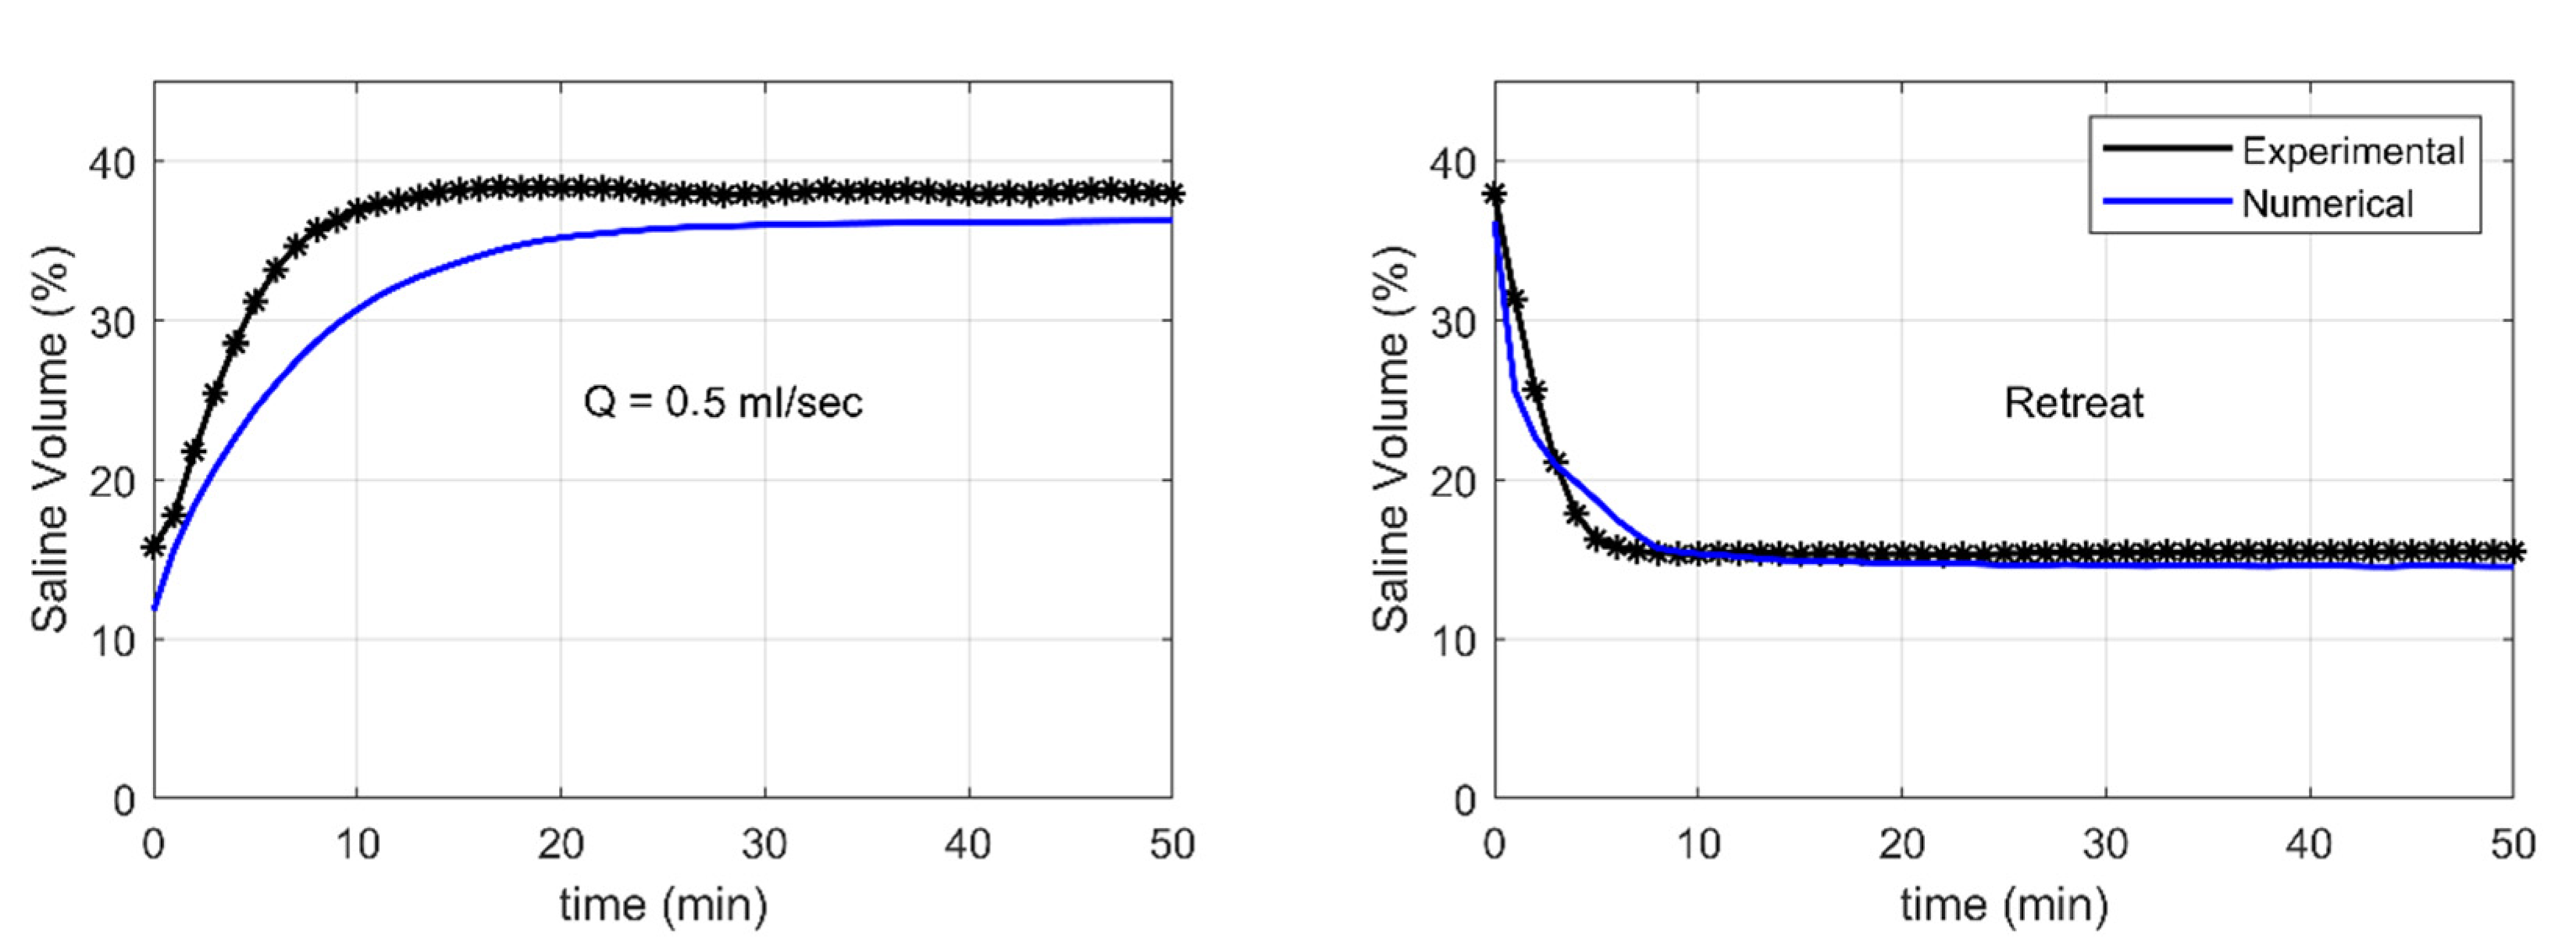
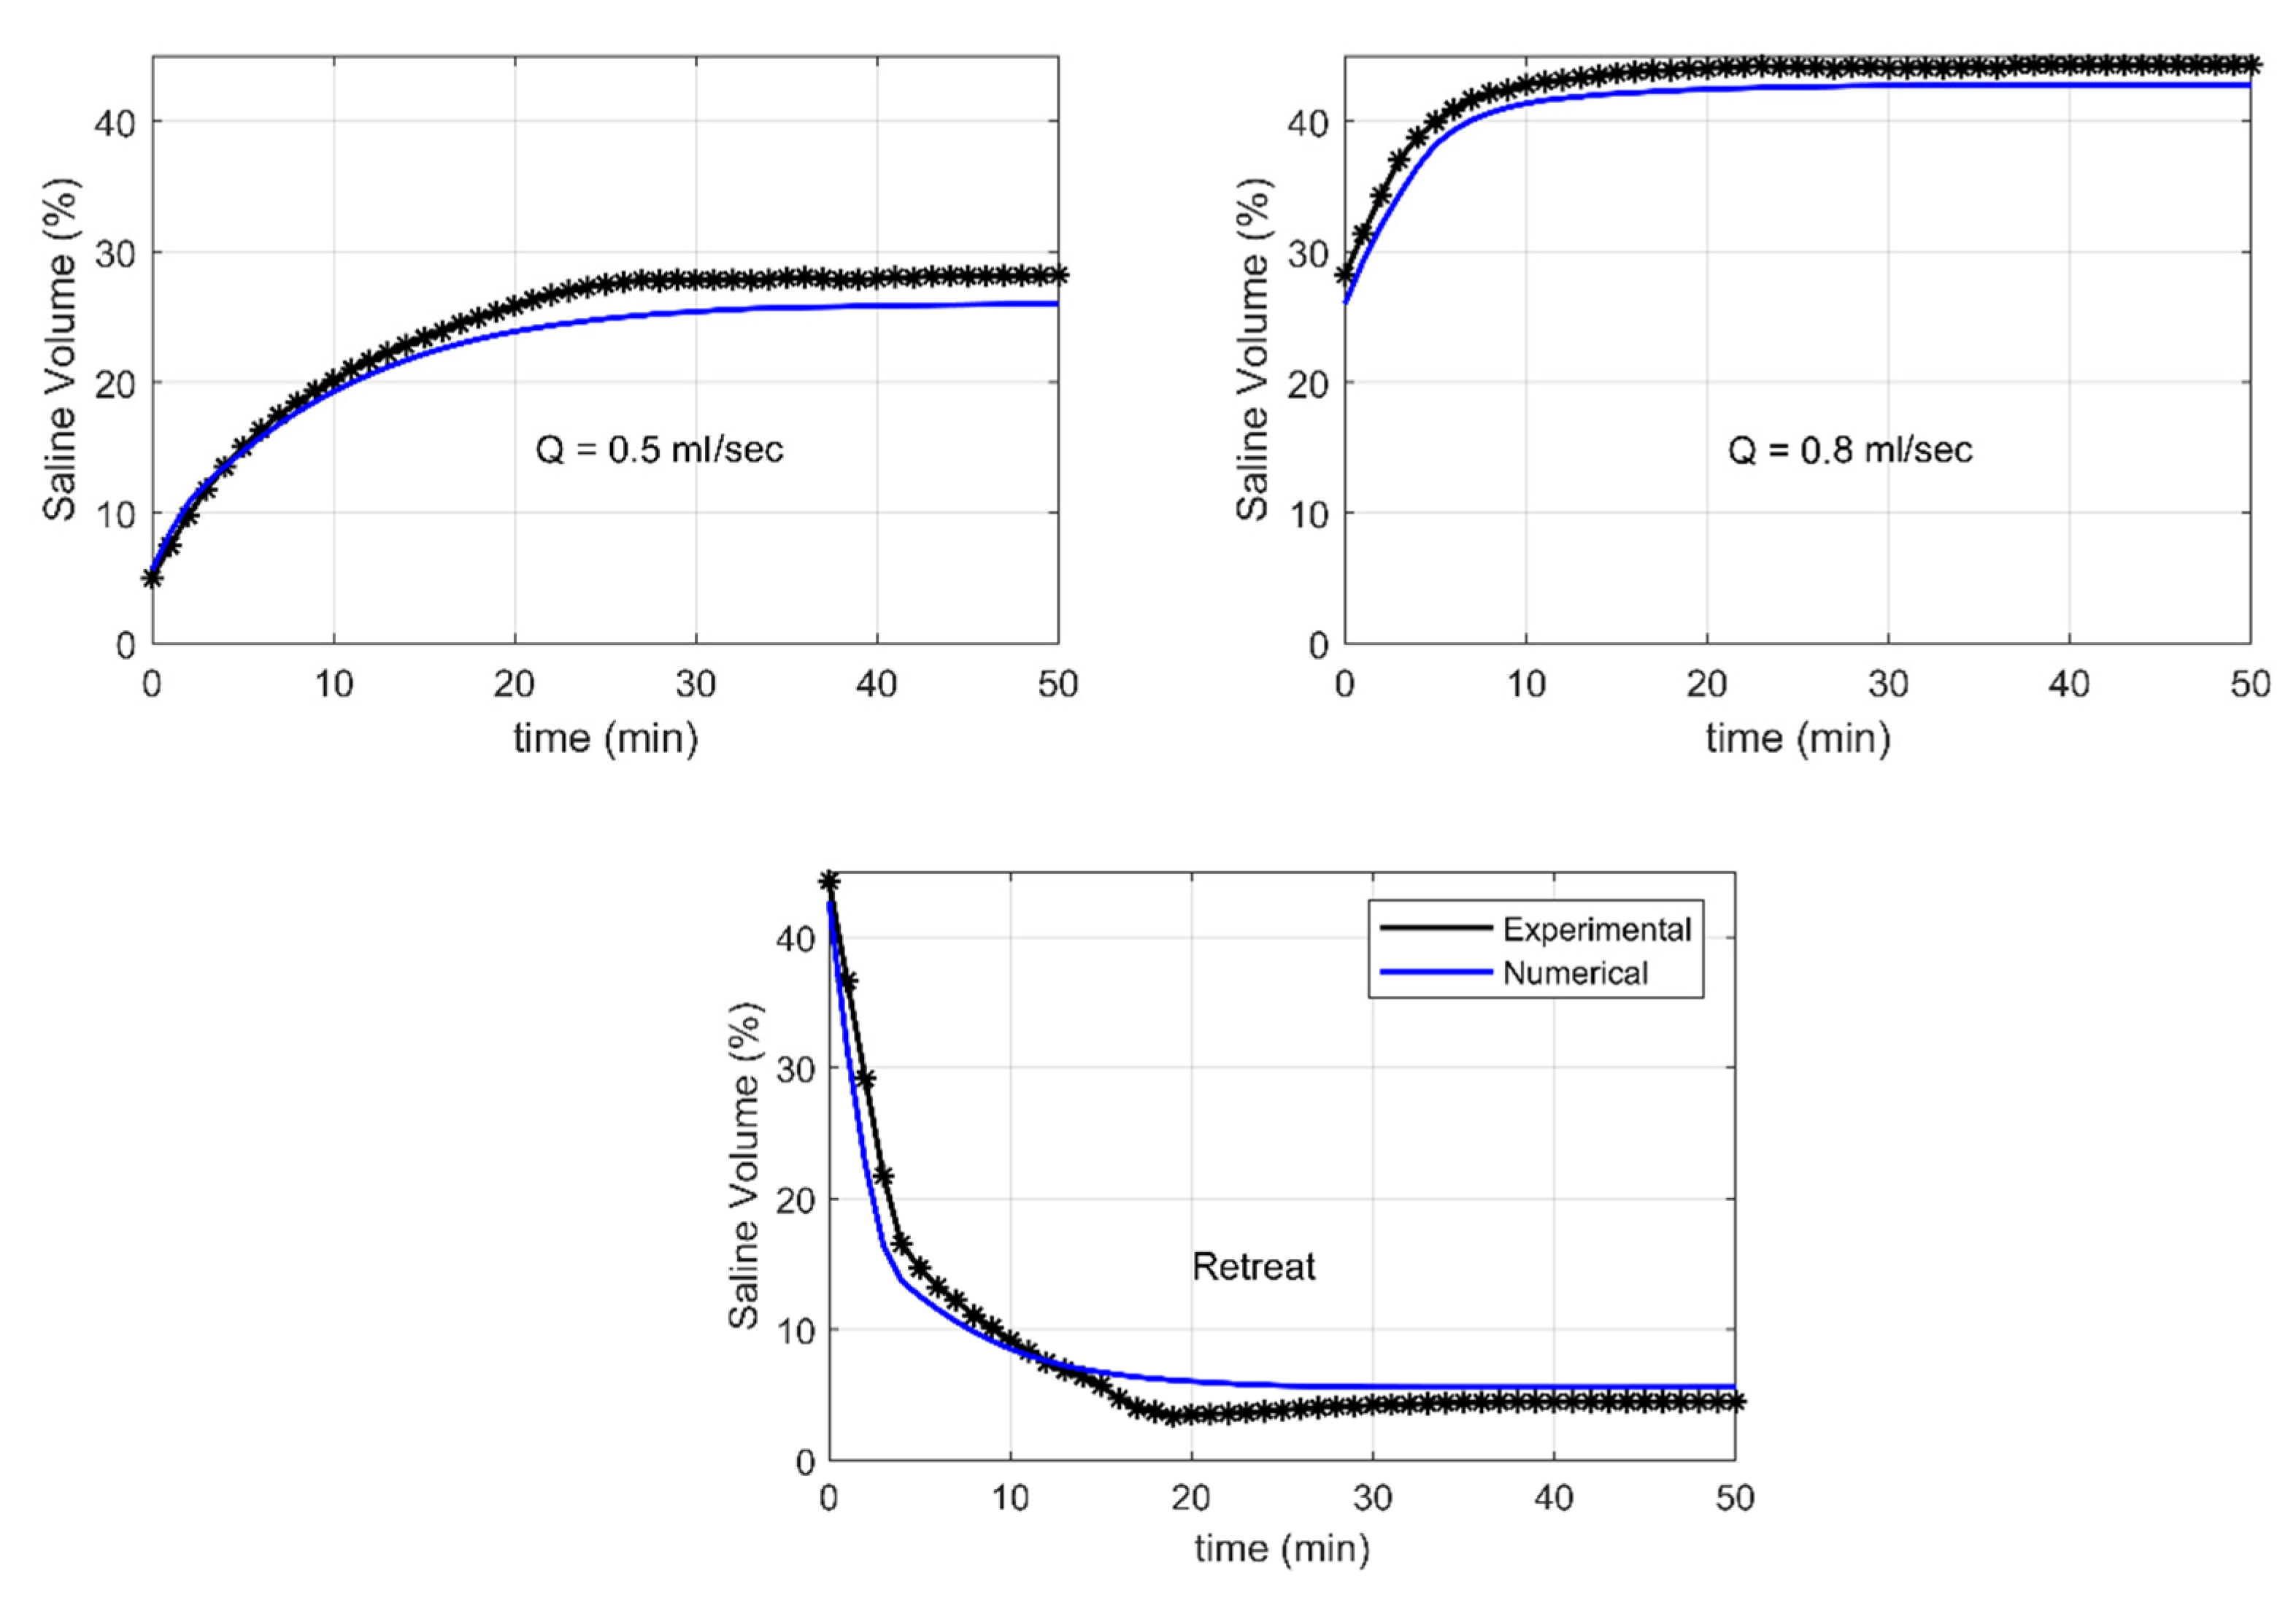
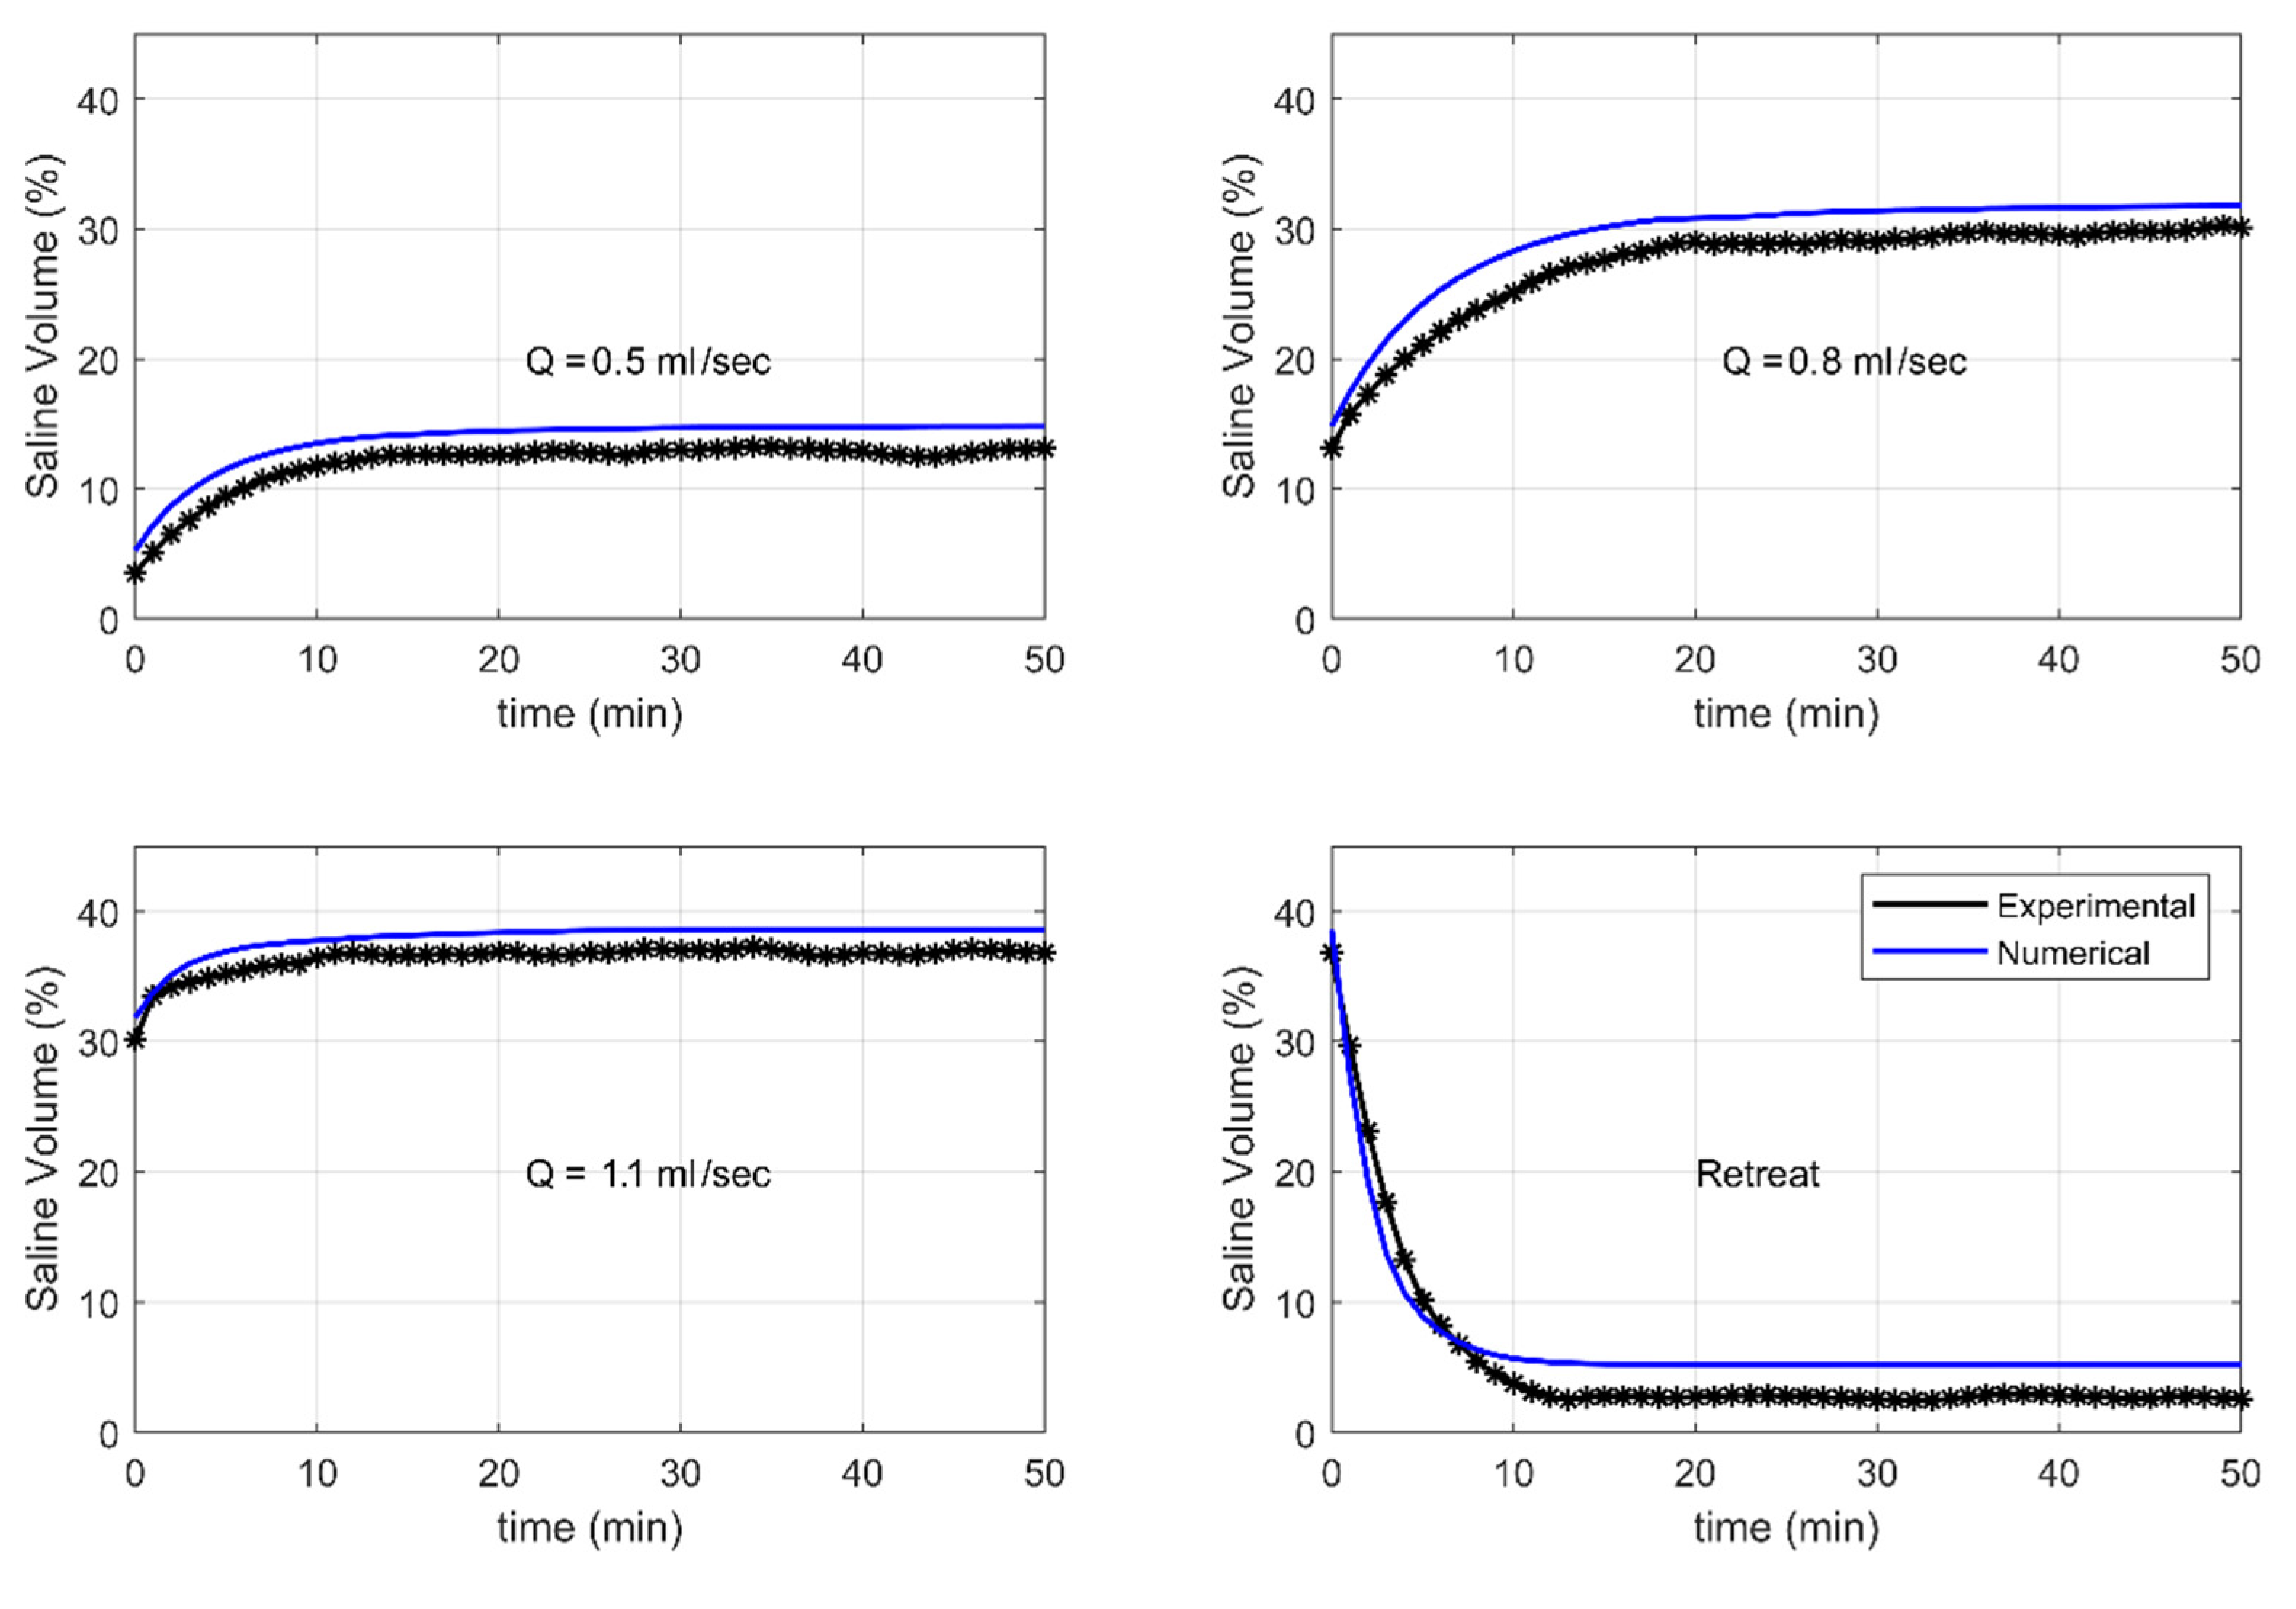
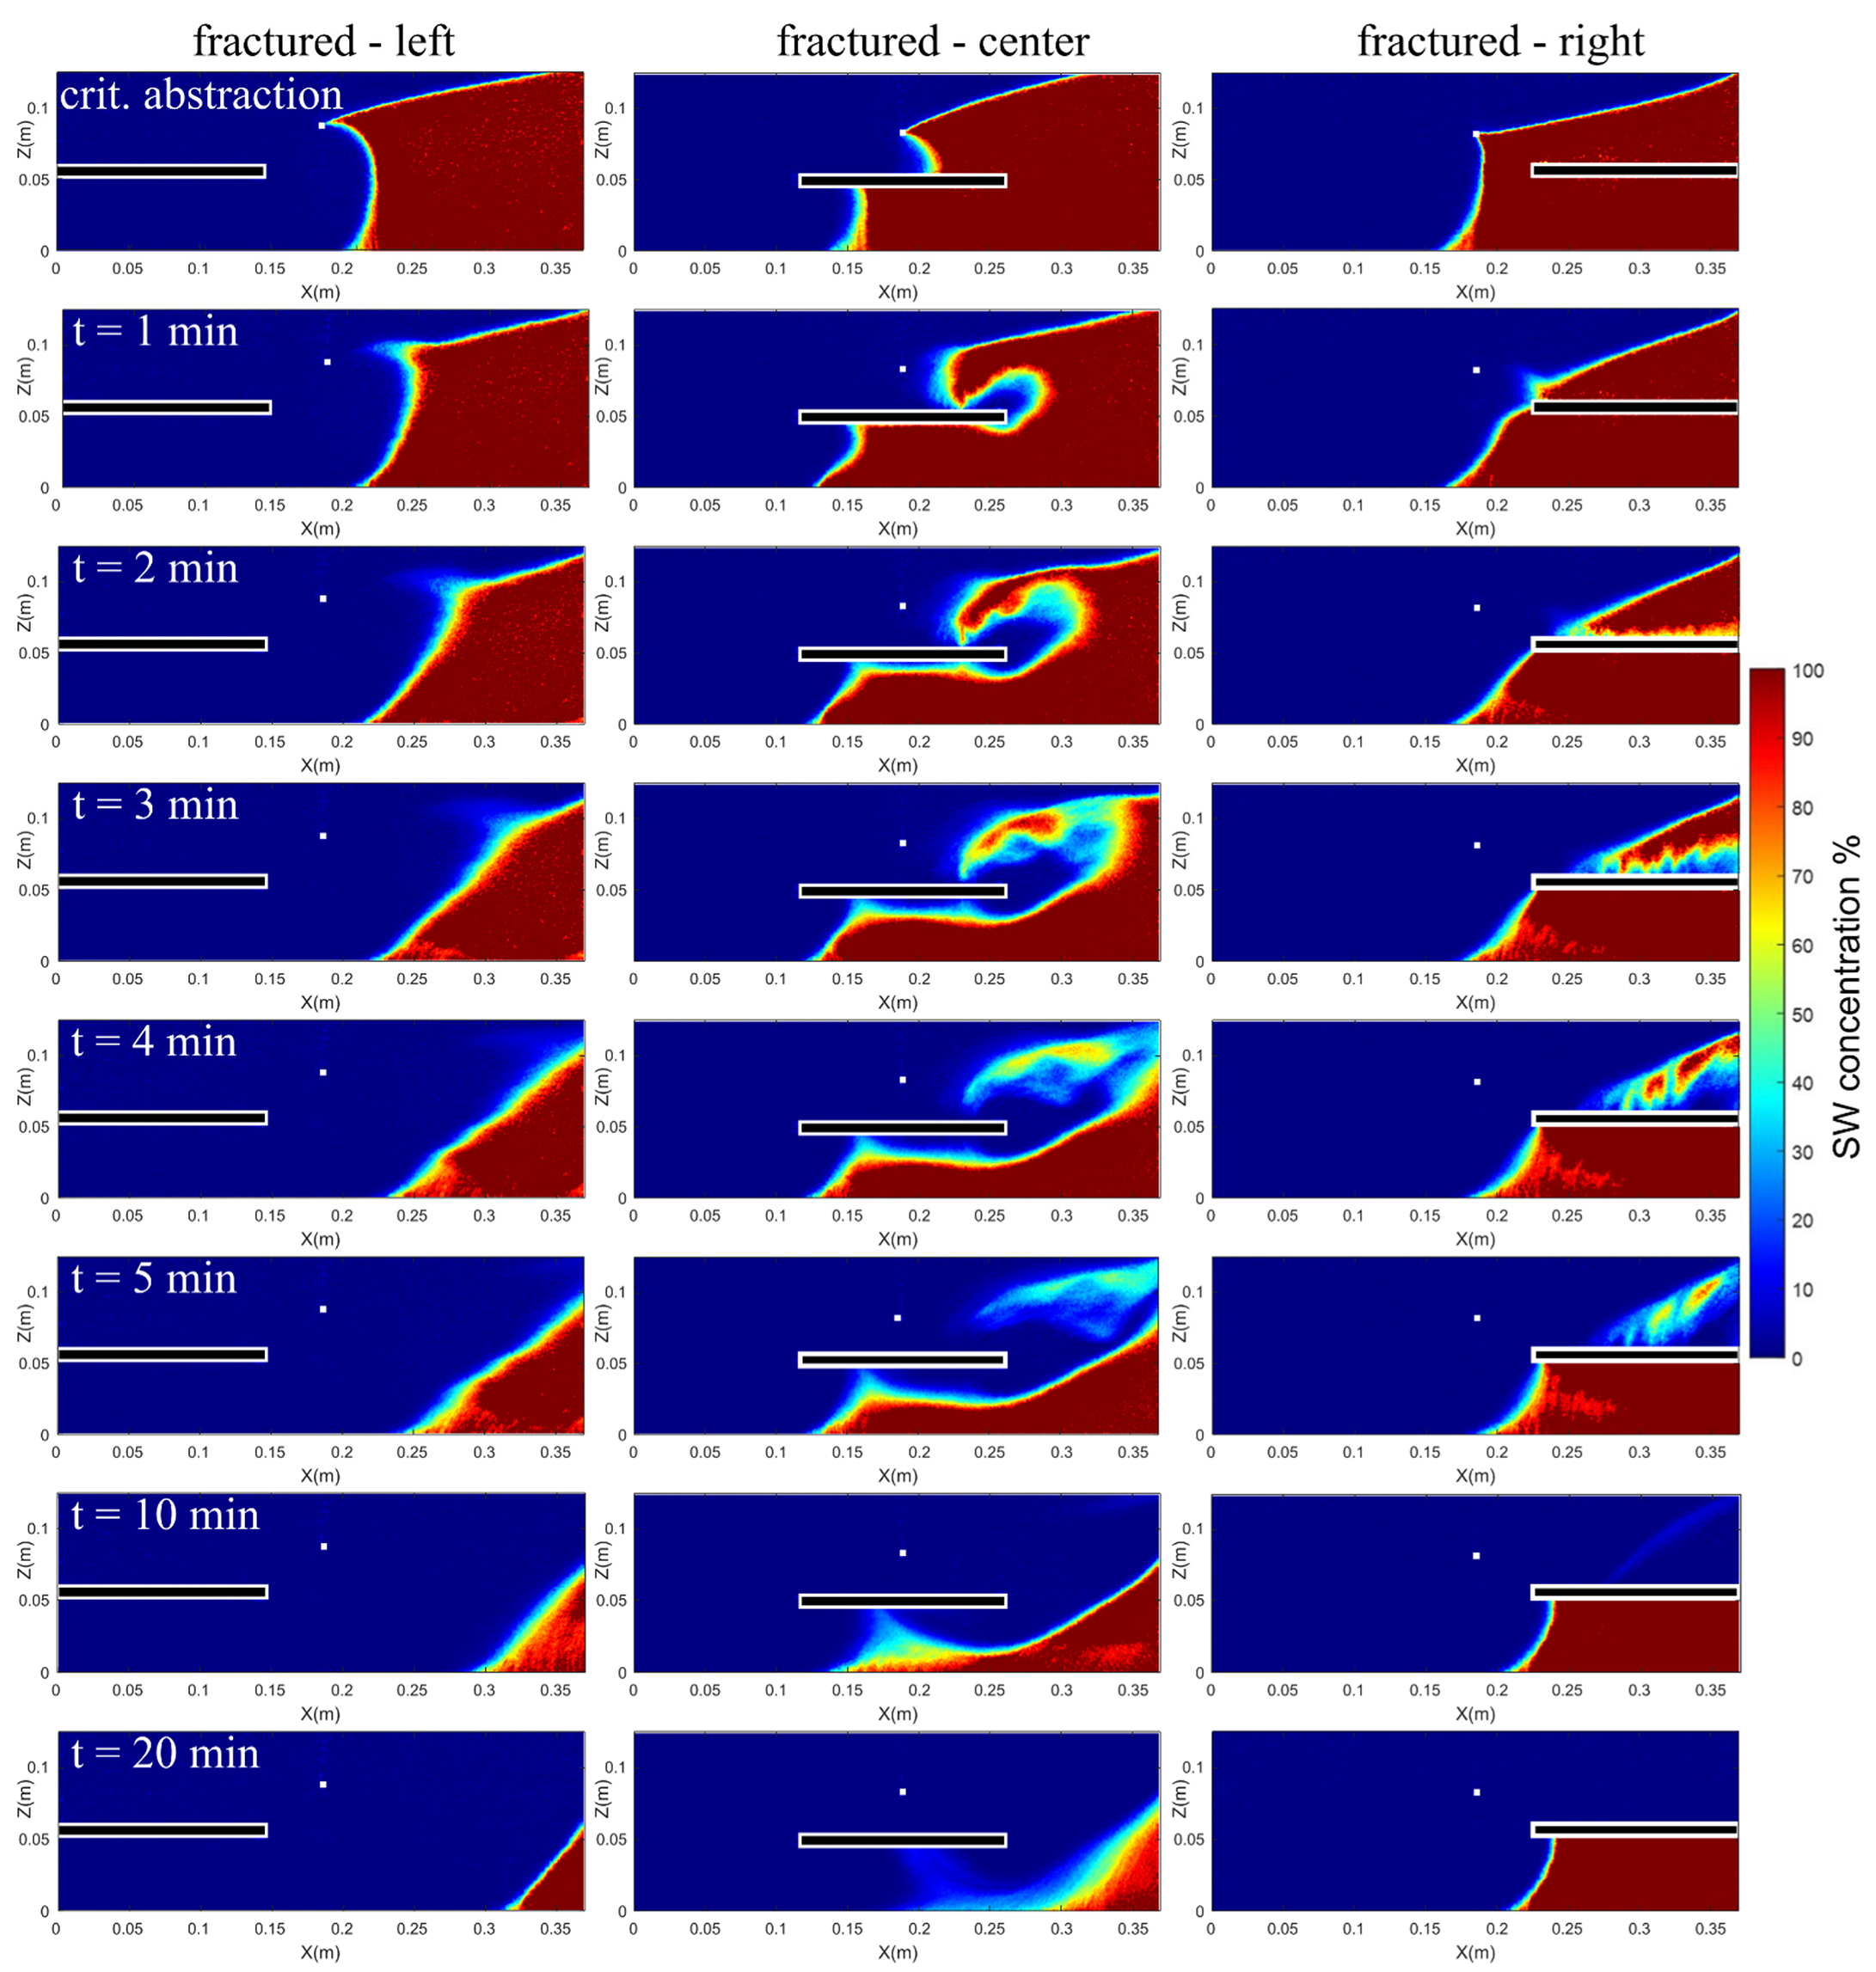
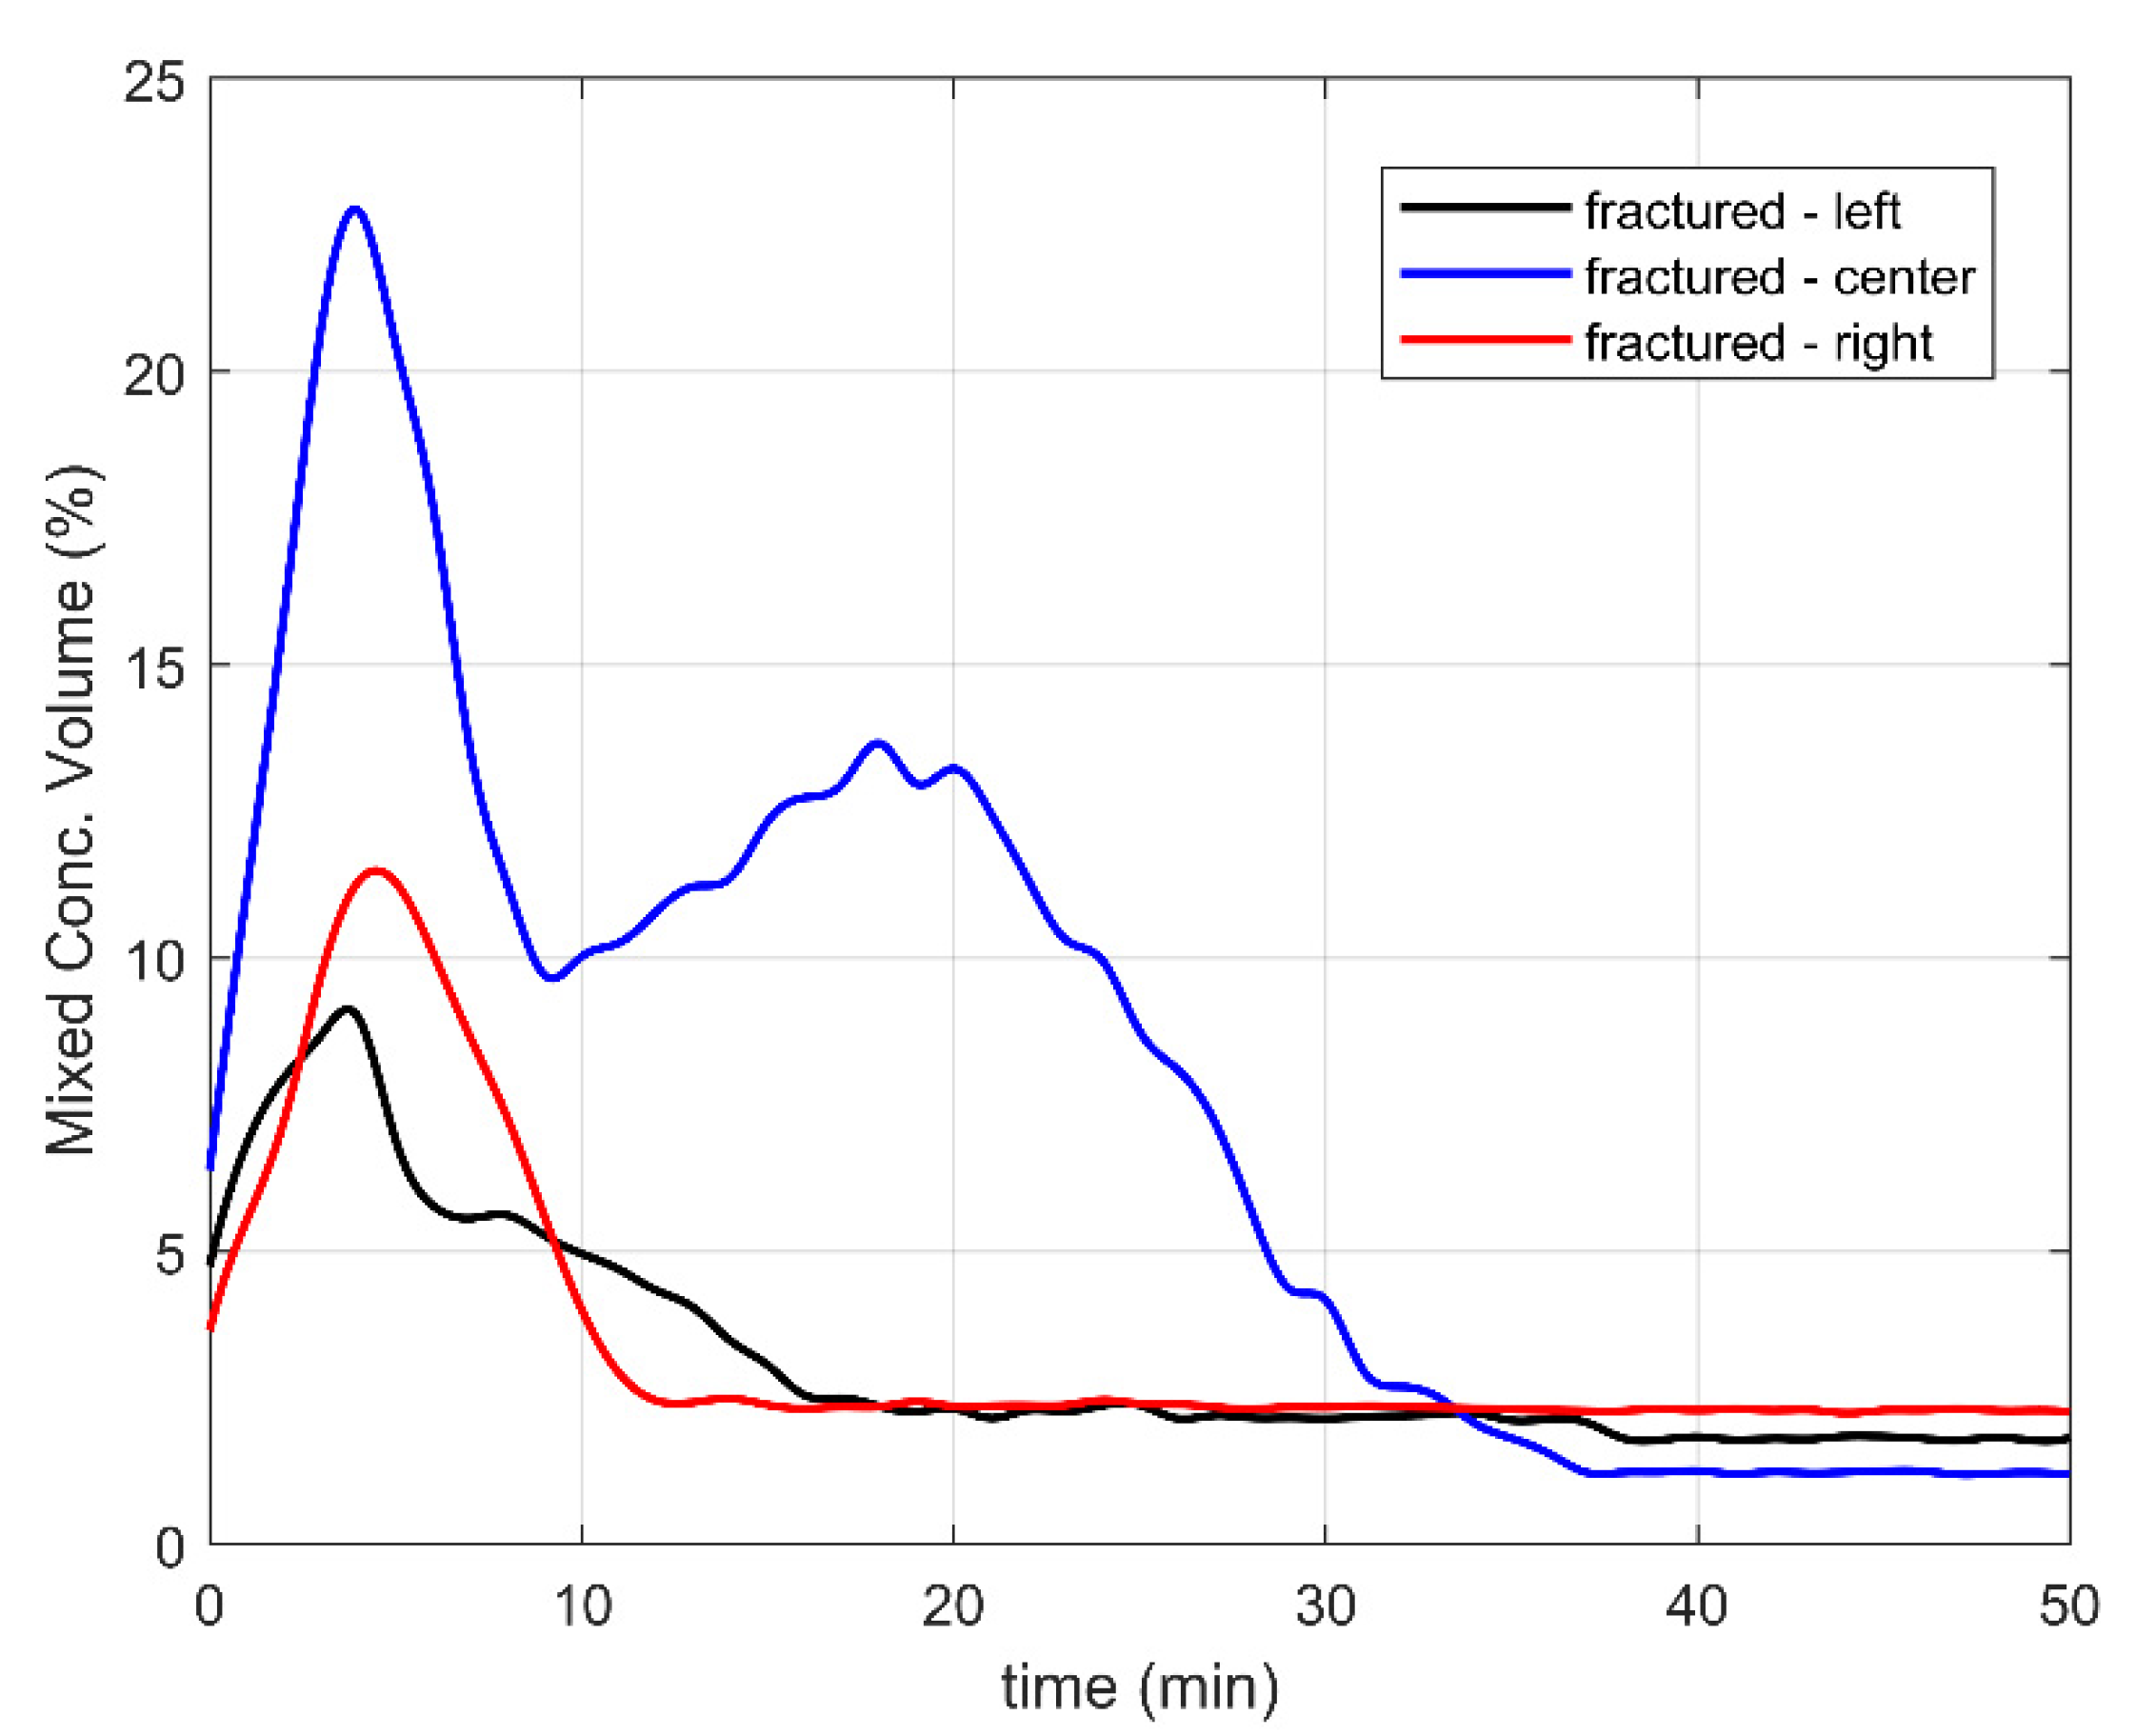
4.1. Experimental Results

The images of the quasi-steady state experimental flow fields, generated by the different abstraction rates applied in the three synthetic fractured aquifers, are presented in the left column of Figure 2. The saltwater concentration fields derived by laboratory image processing (center column) and numerical modelling in SUTRA (right column) are displayed alongside them. As described in Section 2, an initial abstraction rate of 0.5 ml/sec was applied in each aquifer. If a critical abstraction rate was not achieved, the pumping rate was increased by 0.3 ml/sec and the procedure was repeated. A single pumping rate (0.5 ml/sec) was applied in the fractured-right aquifer, two pumping rates in the fractured-center system (0.5 ml/sec and 0.8 ml/sec), while the critical abstraction rate was the largest (1.1 ml/sec) for the fractured-left case. The measured salinity values of the abstracted water, expressed in parts per thousand (ppt), for each critical pumping rate are presented in Table 2. Since for the fractured-left aquifer, the saltwater–freshwater interface generated by an abstraction rate of 0.8 ml/sec included a higher salinity concentration zone protruding towards the pumping well, the measured salinity of this case was also included in Table 2 to assure that no critical abstraction was reached during that stage.
The fracture’s position significantly affected the pre-pumping saltwater concentration fields. The initial TL was the longest (16.1 cm) in the fractured-right aquifer, where the presence of a high permeability structure in close proximity to the seawater boundary augmented saline intrusion, while it was the shortest (5.9 cm) in the fractured-left case, where the discontinuity was positioned in the opposite end of the hydrological system. Similarly, the fracture’s distance from the left (seaward) boundary was positively correlated to the observed saline volume fraction (Table 3). These results, highlighting the impact of high permeability structures in the physics of head induced saline intrusion, agree with the main laboratory findings of Etsias et al. [48].
Even though the three synthetic aquifers were recreated by the exact same glass bead porous medium, included the same steel mesh discontinuity, and had the same boundary conditions (dH = 6 mm), critical abstraction rates varied significantly between them. It is evident that the position of the discontinuity was the crucial factor determining the magnitude of the critical abstraction rate. In the fractured-right aquifer, TL under critical abstraction rate was approximately 27% longer than in the pre-pumping steady state. Nevertheless, saline water occupied up to 38% of the total aquifer volume, instead of just 15.7% before pumping, an increase of 141.7% in the intruding saline volume. A similar trend was observed in the fractured-center and fractured-left aquifers. In both systems, TL tripled under critical water abstraction conditions, while the saline volume fraction became approximately 8 to 10 times larger. Even though greatly affecting the saltwater–freshwater interface, an increase in pumping rate did not always lead to a comparable increase of the TL. Toe length in the fractured-center aquifer was equal to 23 cm during the initial pumping phase (0.5 ml/sec), while it became 4% shorter when the pumping rate was increased to 0.8 ml/sec. A comparable variation in TL was observed in the fractured-left aquifer. While an increase in the applied pumping rate from 0 ml/sec to 0.5 ml/sec and 0.8 ml/sec resulted in a similar increase of the TL from 5.9 cm to 12.6 cm and then to 15.9 cm, further pumping rate increase during the final abstraction phase (1.1 ml/sec) did not result in any significant variation in the observed TL (16.1 ml/sec). Despite toe length being the most commonly used variable in expressing the extent of saline intrusion in the majority of laboratory studies, it is evident in the experimental data presented here that the total saline volume fraction better quantified the impact of the saltwater upconing mechanism on groundwater hydrodynamics in fractured aquifers.
Under critical abstraction, the SW fields in all three experimental aquifers demonstrated 1.5 to 5 times larger values of mixed concentration volume fraction in comparison to their pre-pumping state. This was expected due to the difference in the extent of saline wedge between the aforementioned cases. Nevertheless, the largest mixing zones were observed in the fractured-center aquifer for a pumping rate of 0.5 ml/sec, where mixed concentration volume attributed for 7.6% of the total aquifer, and in the fractured-left system under a pumping rate of 0.8 ml/sec, with a distinctively wide mixing zone occupying approximately 1/10 of the aquifer volume. This indicated that the correlation between pumping rates and the amount of mixing between the two liquids is not as straightforward as that observed in the total intruding saline volume.
The SW concentration fields recreated by the numerical model presented a high-quality fit with the equivalent experimental results. The critical abstraction rates of the laboratory aquifers were also critical for the corresponding numerical cases. In general, the shape of the numerical saltwater–freshwater interface was comparable, if not identical, to the interface in the experimental aquifers. The numerical model marginally under-predicted the extent of the saline wedge in the fractured-right and the fractured-center aquifer, where the numerical saline volume fraction was on average 4.8% and 6.1% smaller than the equivalent experimental values. On the other hand, the numerical saline volume was slightly over-predicted in the fractured-left aquifer, being between 3.8% and 11.4% larger than the values derived for the sandbox experiment. Moreover, the numerical model successfully recreated the distinct widening of the mixing zone observed for the fractured-center and the fractured-left experimental aquifers under a pumping rate of 0.5 ml/sec and 0.8 ml/sec, respectively.
Previously documented experimental errors [28,47] could be responsible for the difference between the acquired laboratory and numerical results. In relatively small sandbox setups, such as the one employed in the current study, errors can be potentially introduced by flaws in the sandbox leveling and the adjustment of the hydraulic head difference, as well as slight variations in the density of the saline solution and uneven water flow between the side cylindrical tanks and the main viewing chamber, or the fracture and the glass beads. Moreover, due to the two-dimensional nature of the experiment, the cone of depression hits the impermeable walls of the sandtank very soon leading to its deformation. In a real-life three-dimensional aquifer, the cone could propagate without this effect into the x and y direction. Supplementary to that, even though the numerical model assumed a perfectly homogeneous porous medium surrounding the discontinuities, small variations in glass bead diameters and bead packing can introduce heterogeneities into the synthetic laboratory aquifers. The difference between the numerical and laboratory SWI characteristics was well within the range defined by Robinson et al. [28]; thus, the utilized numerical model was considered a reliable tool for the study of saltwater upconing in fractured coastal aquifers.
To better evaluate the main driving forces behind the experimental saltwater upconing observed in Figure 2, the velocity vector fields of the various steady states generated by the different abstraction rates applied in all three synthetic fractured aquifers are presented in Figure 3c–k. Supplementary to that, the benchmark case of a homogeneous, non-fractured aquifer with a porous media permeability equal to that of the glass bead medium was incorporated (Figure 3a,b). The selected abstraction rate for the benchmark aquifer (0.5 ml/sec) was identified through numerical sensitivity analysis. To assess vector field evaluation, the magnitude of flow velocities was expressed with varying colors instead of varying vector lengths.
Figure 3a presents the well-studied mechanism of head-induced saltwater intrusion in a homogeneous aquifer. The density difference between the two fluids caused the overtopping of saline water by the less dense freshwater, leading to the traditional wedge-shaped saltwater–freshwater interface, while water outflowed from the upper right part of the aquifer. As expected, the flow velocity of the much denser saltwater was slower than that of the freshwater in all investigated cases. The pre-pumping velocity vector fields of the fractured-right (Figure 3c), fractured-center (Figure 3e) and fractured-left (Figure 3h) aquifers vividly highlight the impact of high permeability discontinuities on saltwater hydrodynamics. Etsias et al. [48] identified that the presence of horizontal fractures generates three distinct flow velocity zones: a high velocity area around the left edge of the discontinuity, where freshwater streamlines converge into the fracture; a similar region at the vicinity of the right edge, where the freshwater outflows fast into the porous medium; and a low velocity zone directly underneath the discontinuity. These zones are clearly observed in Figure 3. In the fractured-center and fractured-left aquifers, the high velocity outflow zone at the right edge of the discontinuity resulted in the suppression of saltwater further seaward. On the other hand, in the fractured-right case, the convergence of freshwater towards the left edge of the discontinuity’s left edge, led to the occupation of the space directly underneath the fracture by saltwater, resulting in an overall longer saline wedge.
Understanding the upconing mechanism in homogeneous hydrological setups is a prerequisite for understanding pumping induced SWI in fractured media. Abdoulhalik and Ahmed [54], in their study of saltwater upconing in homogeneous synthetic aquifers, classified the flow domain into three distinct zones; the first located on the landward side (upstream) of the pumping well, the second on its seaward side (downstream) directly above the saline wedge, and the third being in the direct vicinity of the pumping point. These three zones are easily identified in Figure 3b. The applied abstraction rate (0.5 ml/sec) generated flow velocities of up to 0.2 cm/s in a circular zone around the pumping well and an increase of approximately 50% in the flow velocities on the landward side, while it resulted in the reduction of freshwater velocities of up to 70% in the upper right part of the aquifer. The limited inflow of freshwater in this aquifer zone was responsible for the eventual upward move of the saltwater–freshwater interface at this position.
The velocity vector fields of the benchmark homogeneous and the fractured-right aquifer (Figure 3b,d) are comparable to each other. With the exception of the relatively larger saltwater velocities inside the fracture (light blue arrows), the remaining vectors both inside and outside the saline wedge had similar magnitude and direction. Even though the presence of the discontinuity significantly affected the saltwater–freshwater interface in the pre-pumping SWI phase, its effect on the saltwater upconing mechanism was limited. This limited impact can be reasonably attributed to the fact that in this specific fractured aquifer, the whole of the discontinuity was located downstream of the pumping point, indicating that critical abstraction rates are predominantly determined by the flow regime upstream (freshwater zone) of the pumping well. This hypothesis is supported by the vector fields observed for the remaining two fractured aquifers (Figure 3e–k).
In the fractured-center aquifer, freshwater converged towards two distinct points; the pumping well and the left edge of the high permeability discontinuity. Under an abstraction rate of 0.5 ml/sec, only a fraction of the of the freshwater flowing into the discontinuity was pumped towards the abstraction well, as indicated by the red arrows directly underneath it, while the rest flowed out of the right edge of the discontinuity into the glass medium and towards the upper right edge of the aquifer. Because of that, the discontinuity acted as a high permeability barrier, limiting the slower-moving saltwater at the lower part of the aquifer. In contrast to this, when the critical abstraction rate (0.8 ml/sec) was applied to the system, the majority of freshwater present inside the discontinuity was pumped towards the well. This resulted in the inflow of saltwater into the left part of the fracture, as well as the migration of the saltwater–freshwater interface towards the upper portion of the aquifer, triggering the well’s salinization.
It is evident from Figure 3h–k that the bulk of the freshwater entered the fractured-left aquifer through the discontinuity. Due to the position of the high permeability fracture larger quantities of freshwater flowed into the hydrological system. Irrespective of the differences in the shape of their corresponding saline wedges, saltwater upconing in the fractured-left case demonstrated considerable similarities with the flow mechanism described for the fractured-center aquifer. Only a fraction of the freshwater outflowing from the right edge of the fracture was intercepted by the well for the first two abstraction rates (0.5 ml/sec and 0.8 ml/sec). The remaining freshwater volume flowed towards the upper-right aquifer corner, suppressing the saline wedge further inward, thus preventing the salinization of the well. In the final phase of the experiment, the majority of the freshwater inflowing into the aquifer was pumped towards the abstraction well. This is evident by the relatively large high-velocity zone upstream of the pumping point, as well as by the extremely small velocity vectors observed in the upper-right part of the hydrological system. These vectors demonstrate the limited freshwater outflow in this region, which triggered the upward movement of the saline wedge, resulting in the eventual salinization of the well.
The analysis of the velocity vector fields in the previous paragraphs constitutes a first attempt in understanding how the presence of high permeability discontinuities, and their position relative to an abstraction well, affect the saltwater upconing mechanism under quasi-steady state conditions. Nevertheless, the utilized experimental procedure enabled the acquisition of data under both steady state and transient conditions. Since the saline volume fraction was deemed the most appropriate variable in quantifying pumping-induced SWI, the transient experimental saline volume values for the various pumping phases, as well as during the final saltwater retreat (SWR) phase in the fractured-right, fractured-center and fractured-left aquifer are presented in Figure 4, Figure 5 and Figure 6, respectively. To assess direct comparison between the three experimental aquifers, the limits of the y-axes were kept the same in all the subplots. As expected, every increase in the abstraction rate was followed by a rapid increase in the total saline volume. In most cases the saltwater–freshwater interface stabilized after approximately 20 to 40 min, nevertheless the experimental procedure lasted 50 min to assure that quasi-steady state was achieved in every case. The transient numerical results (blue line) demonstrated a time-dependent variance that was similar to the variation in the experimental values. Nevertheless, due to the idealized numerical flow conditions, steady state was achieved slightly faster in the SUTRA flow fields.
The data in Figure 5 indicated that during SWR in the fractured-center aquifer the saline volume fraction momentarily demonstrated values that were lower than that of the final quasi-state, obtained 50 min after the termination of pumping. A selection of seven experimental SW concentration fields for each experimental aquifer, obtained at different intervals during the SWR phase are presented in Figure 7 to further investigate this phenomenon. Since the variation in the saltwater–freshwater interface was more rapid immediately after the change in the applied boundary conditions, the first five SW concentration fields were obtained between 1 to 5 min after the pausing of the peristaltic pump, while the final two were obtained after 10 and 20 min, respectively. In their study of saline intrusion in homogeneous aquifers, Chang and Clement [70] proved that during SWR, the flow direction inside the saline wedge is reversed, resulting in both freshwater and saltwater flowing towards the sea. The switch from an opposing to a unidirectional fluid flow regime significantly disturbs the flow field leading to a transient widening of the mixing zone. This mechanism applies in the fractured aquifers of this study (Figure 8); nevertheless, the different relative position of the discontinuity in each one of them resulted in significantly divergent transient SW concentration fields.
The fractured-left aquifer was the only case where the saline wedge did not occupy any portion of the discontinuity, under critical pumping conditions. As a result, the saline front retreated without any significant interface shape distortion, closely resembling the shape of retreating saline wedges documented for homogeneous aquifers [54]. The mixing zone was the widest at 5 min into the saltwater retreat phase, where the mixed concentration volume fraction was equal to 9%.
Under critical abstraction, the saline wedge in the fractured-center aquifer occupied approximately half of the discontinuity. When pumping was terminated, the saline interface retreated rapidly from the direct vicinity of the well (t = 1 min). The pausing of water abstraction resulted in the fast outflow of freshwater from the right edge of the fracture; this can be clearly observed in the SW concentration fields generated 1 and 2 min after the start of the retreat (Figure 7). The faster flowing freshwater resulted in the separation of the saline wedge in two parts; a main part located on the bottom right section of the aquifer, and a distinct saline plume located directly above the fracture, that outflowed from the porous medium after approximately 10 min. Similar to the previous case, peak mixing zone values were observed 5 min after pumping was stopped, where 22.7% of the total aquifer volume had a saltwater concentration between 25% and 75%. It is evident in Figure 8 that the mixed concentration volume fraction had a second peak value (13.2%) 20 min into the SWR phase. During the first 10 min of the saltwater retreat, there was little variation in the TL and the shape of the saline wedge in the lower part of the fractured-center aquifer (Figure 7). Only after the saline plume was flushed out of the porous medium did the TL start becoming progressively shorter. The two distinct peaks in the observed mixing zone (Figure 8) should thus be respectively attributed to the outflow of the saline plume and the subsequent shortening of the TL.
Finally, in the fractured-right aquifer, the discontinuity was located entirely inside the saline wedge under critical pumping conditions. Stopping water abstraction generated two distinct outflow zones, in the upper-right part of the aquifer and at the right edge of the fracture. This resulted in the continuous retreat of the lower portion of the saline wedge towards its pre-pumping position, while the uppermost section of the saline wedge outflowed towards the upper-right part of the aquifer, in a similar way to what was observed for the saline plume in the fractured-center case. The largest mixed concentration volume fraction (11.3%) was yet again observed five minutes after the termination of pumping. This time-lagging between the end of the freshwater abstraction and the peak mixing zone values is in agreement with previous laboratory investigations on SWR in homogeneous [28] and stratified [47] coastal aquifers. The mixing zone data indicate that steady-state was achieved in the fractured-left and fractured-right aquifers 20 min after the cessation of pumping, while an extra 20 min (Figure 8) were needed for the fractured-center case.
The analysis of the SW concentration fields generated during the saltwater retreat phase demonstrated that the presence of high permeability structures can significantly impact the shape of the saltwater–freshwater interface, generating extended mixing zones and distinct saline plumes at the upper portion of the aquifers. The mechanisms observed here, under idealized 2-dimensional laboratory conditions, could have a significant impact in the successful management of real-world coastal fractured aquifers, where the variation in freshwater abstraction rates, precipitation or the impact of tides can lead to aquifers which are constantly under transient conditions, fluctuating between saltwater intrusion and retreat.

4.2. Sensitivity Analysis

The experimental data highlighted the significant impact that high-permeability discontinuities have on the saltwater upconing in coastal hydrological systems. The numerical model, introduced in Section 3 (Table 1), was employed to conduct a detailed sensitivity analysis. It comprised six distinct scenarios, one of them included in the Supplementary Materials, that investigated the impact of the length and horizontal position of the fracture, as well as the pumping well’s depth, the applied hydraulic head difference and the permeability values of both the discontinuity and the surrounding porous medium have on the critical abstraction rates and the shape of the saltwater–freshwater interface in fractured coastal aquifers. Below is a summary description of the utilized numerical setup:
  • The aquifers in five of the six scenarios contained individual horizontal fractures consisting of 123 × 7 elements, corresponding to the actual size of the utilized experimental mesh cylinders (15 cm × 0.8 cm).
  • Unlike the numerical models simulating the three laboratory synthetic aquifers, where the discontinuity’s outline was derived through image analysis of the experimental photographs for accurate model validation, all the numerical fractures presented in this section had an idealized rectangular shape.
  • Except for the wo scenarios in Section 4.2.4 and Section 4.2.5, numerical fracture permeability was equal to the experimental value reported for the steel cylinder, while the permeability of the surrounding porous medium was equal to that of the utilized glass beads.
  • In five of the test cases, saline intrusion was initiated into the numerical aquifers by a hydraulic head difference of 6 mm between the landward and seaward side boundaries.
  • After the initial intruding wedge reached steady state, freshwater abstraction was applied for a stress period of 50 min, assuring that all hydrological systems achieved steady state. In all but one scenario (Section 4.2.3), the location of the pumping point was identical to the needle’s tip in the laboratory setup.
In the experimental saltwater concentration fields, the mixing zone was relatively thin, the mixed concentration volume being just a fraction of the saline volume. Nevertheless, this did not apply to many of SW fields presented in the following sub-sections, where wider mixing zones of a much larger extent were identified. To further assess the analysis of the results, an alternative variable the non-fresh volume fraction, representing the parts of the aquifer where saltwater concentration was more than 25% was introduced.

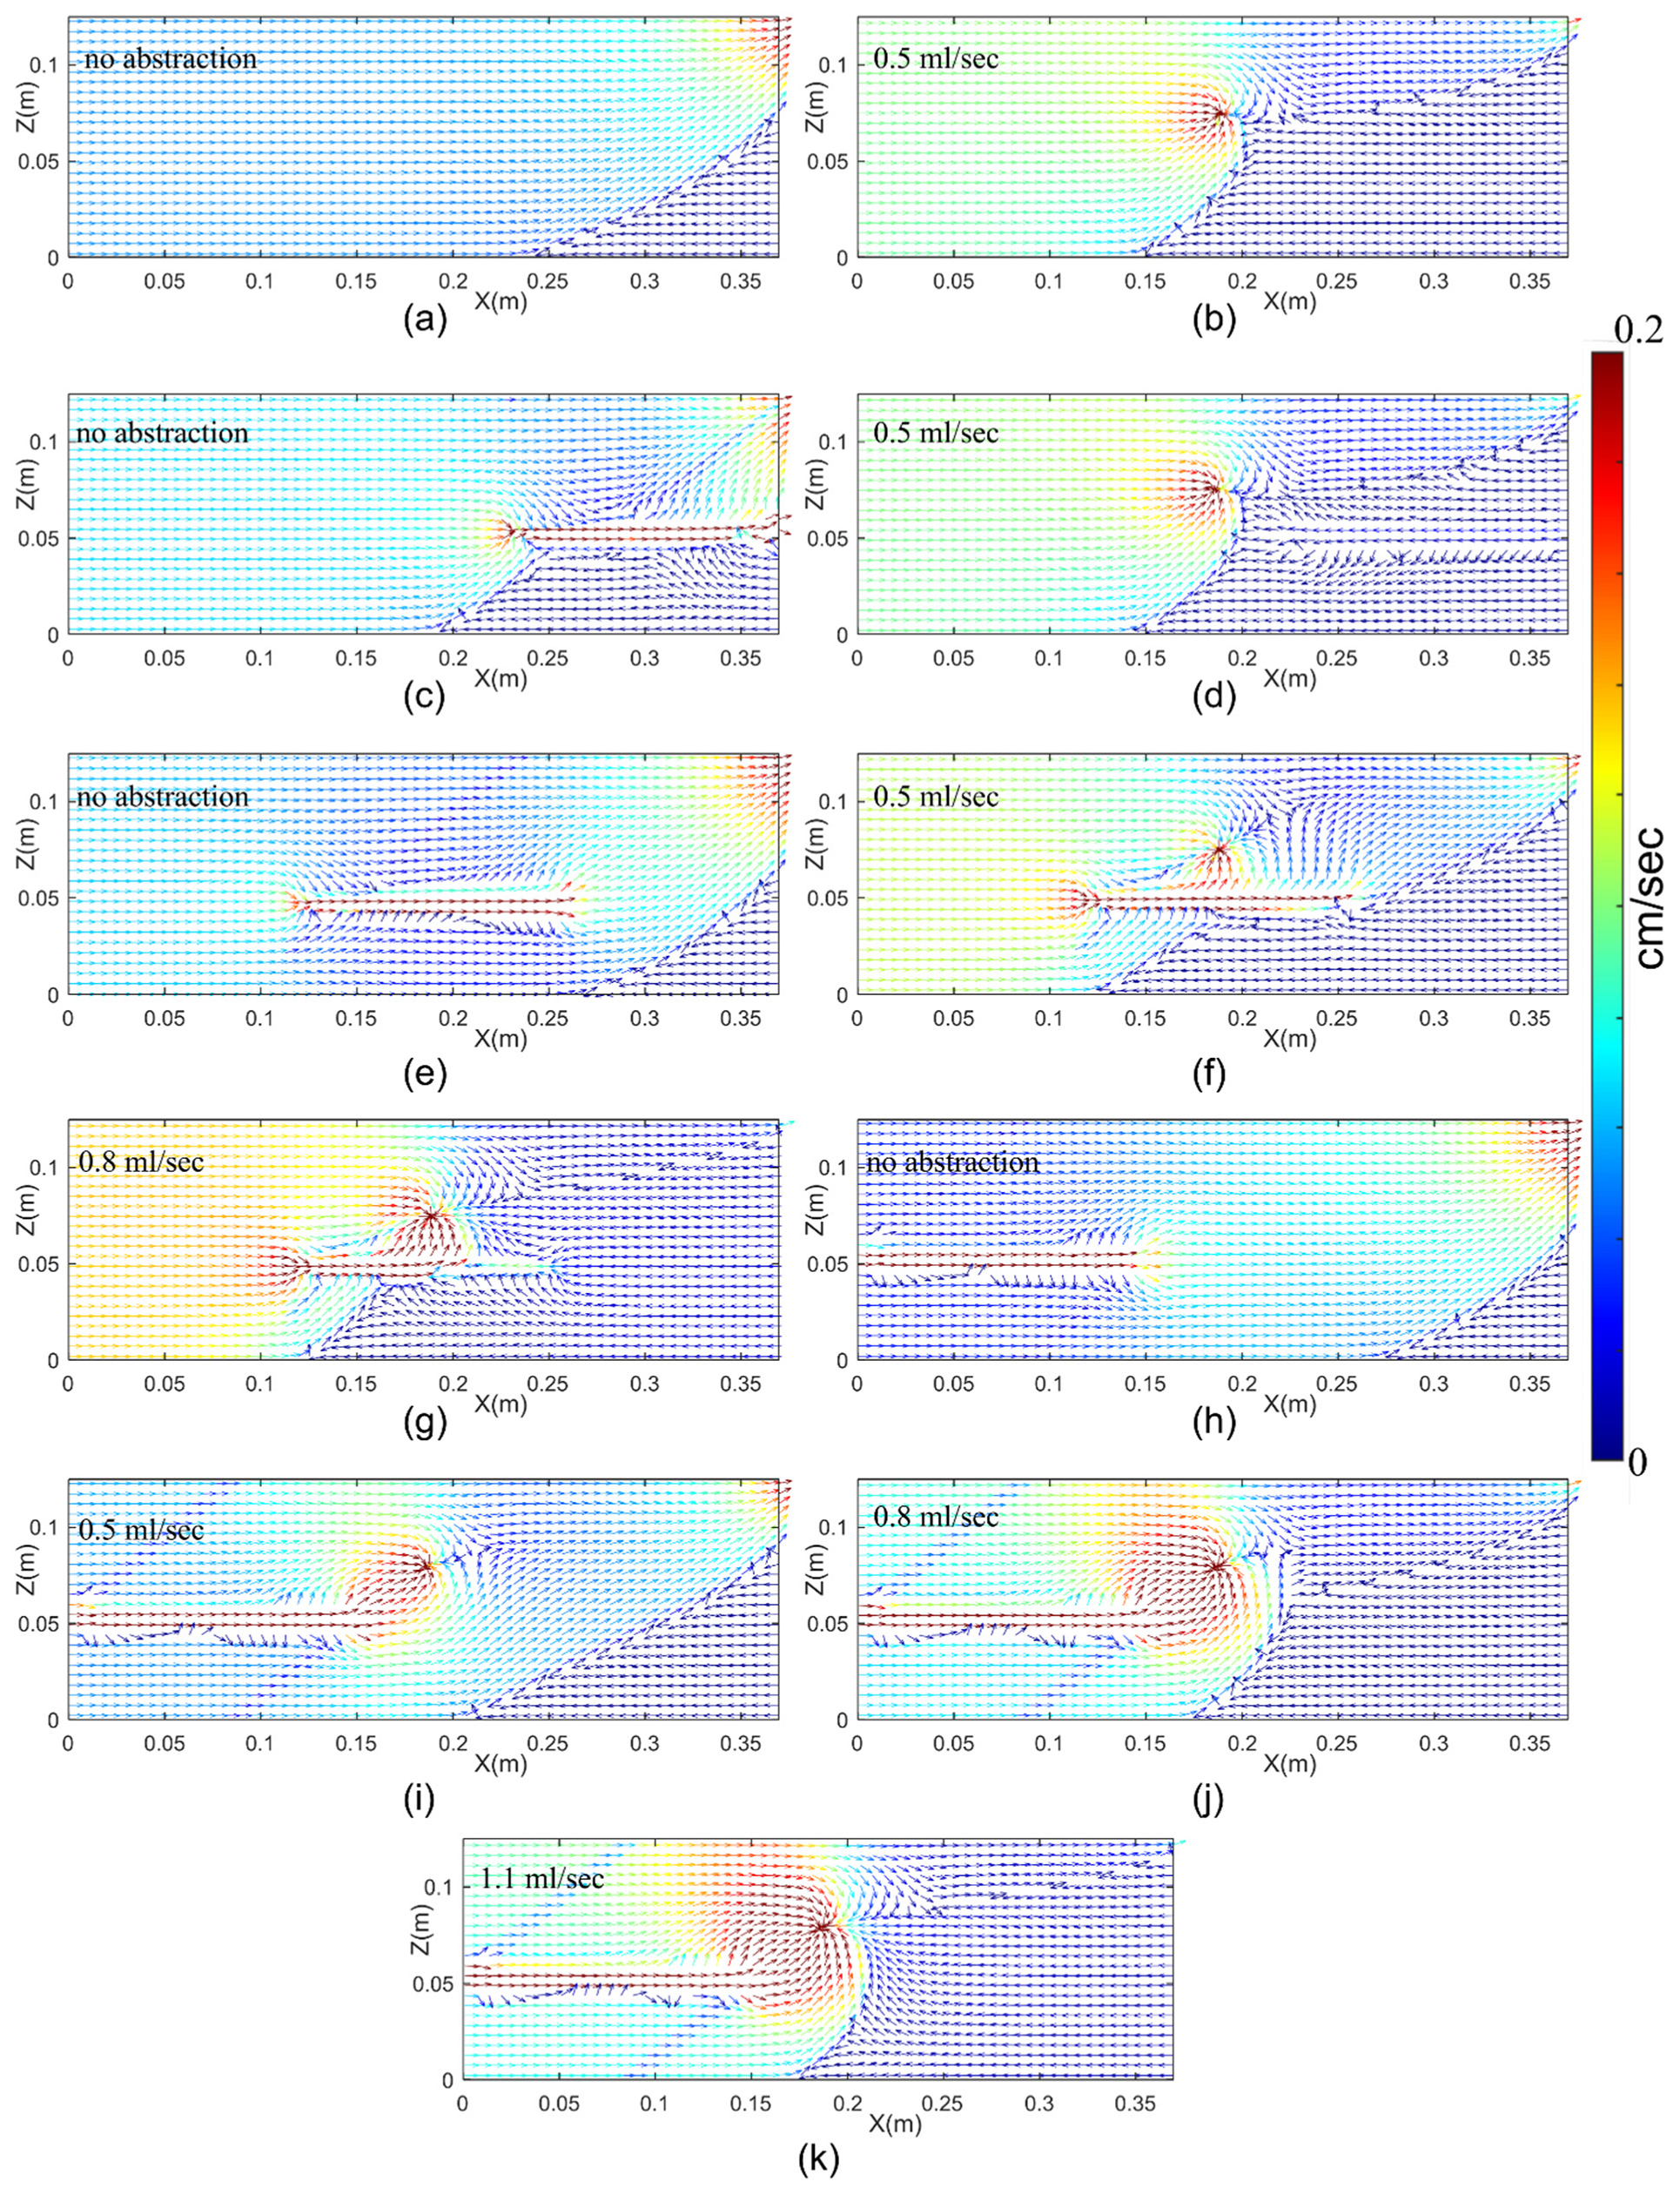
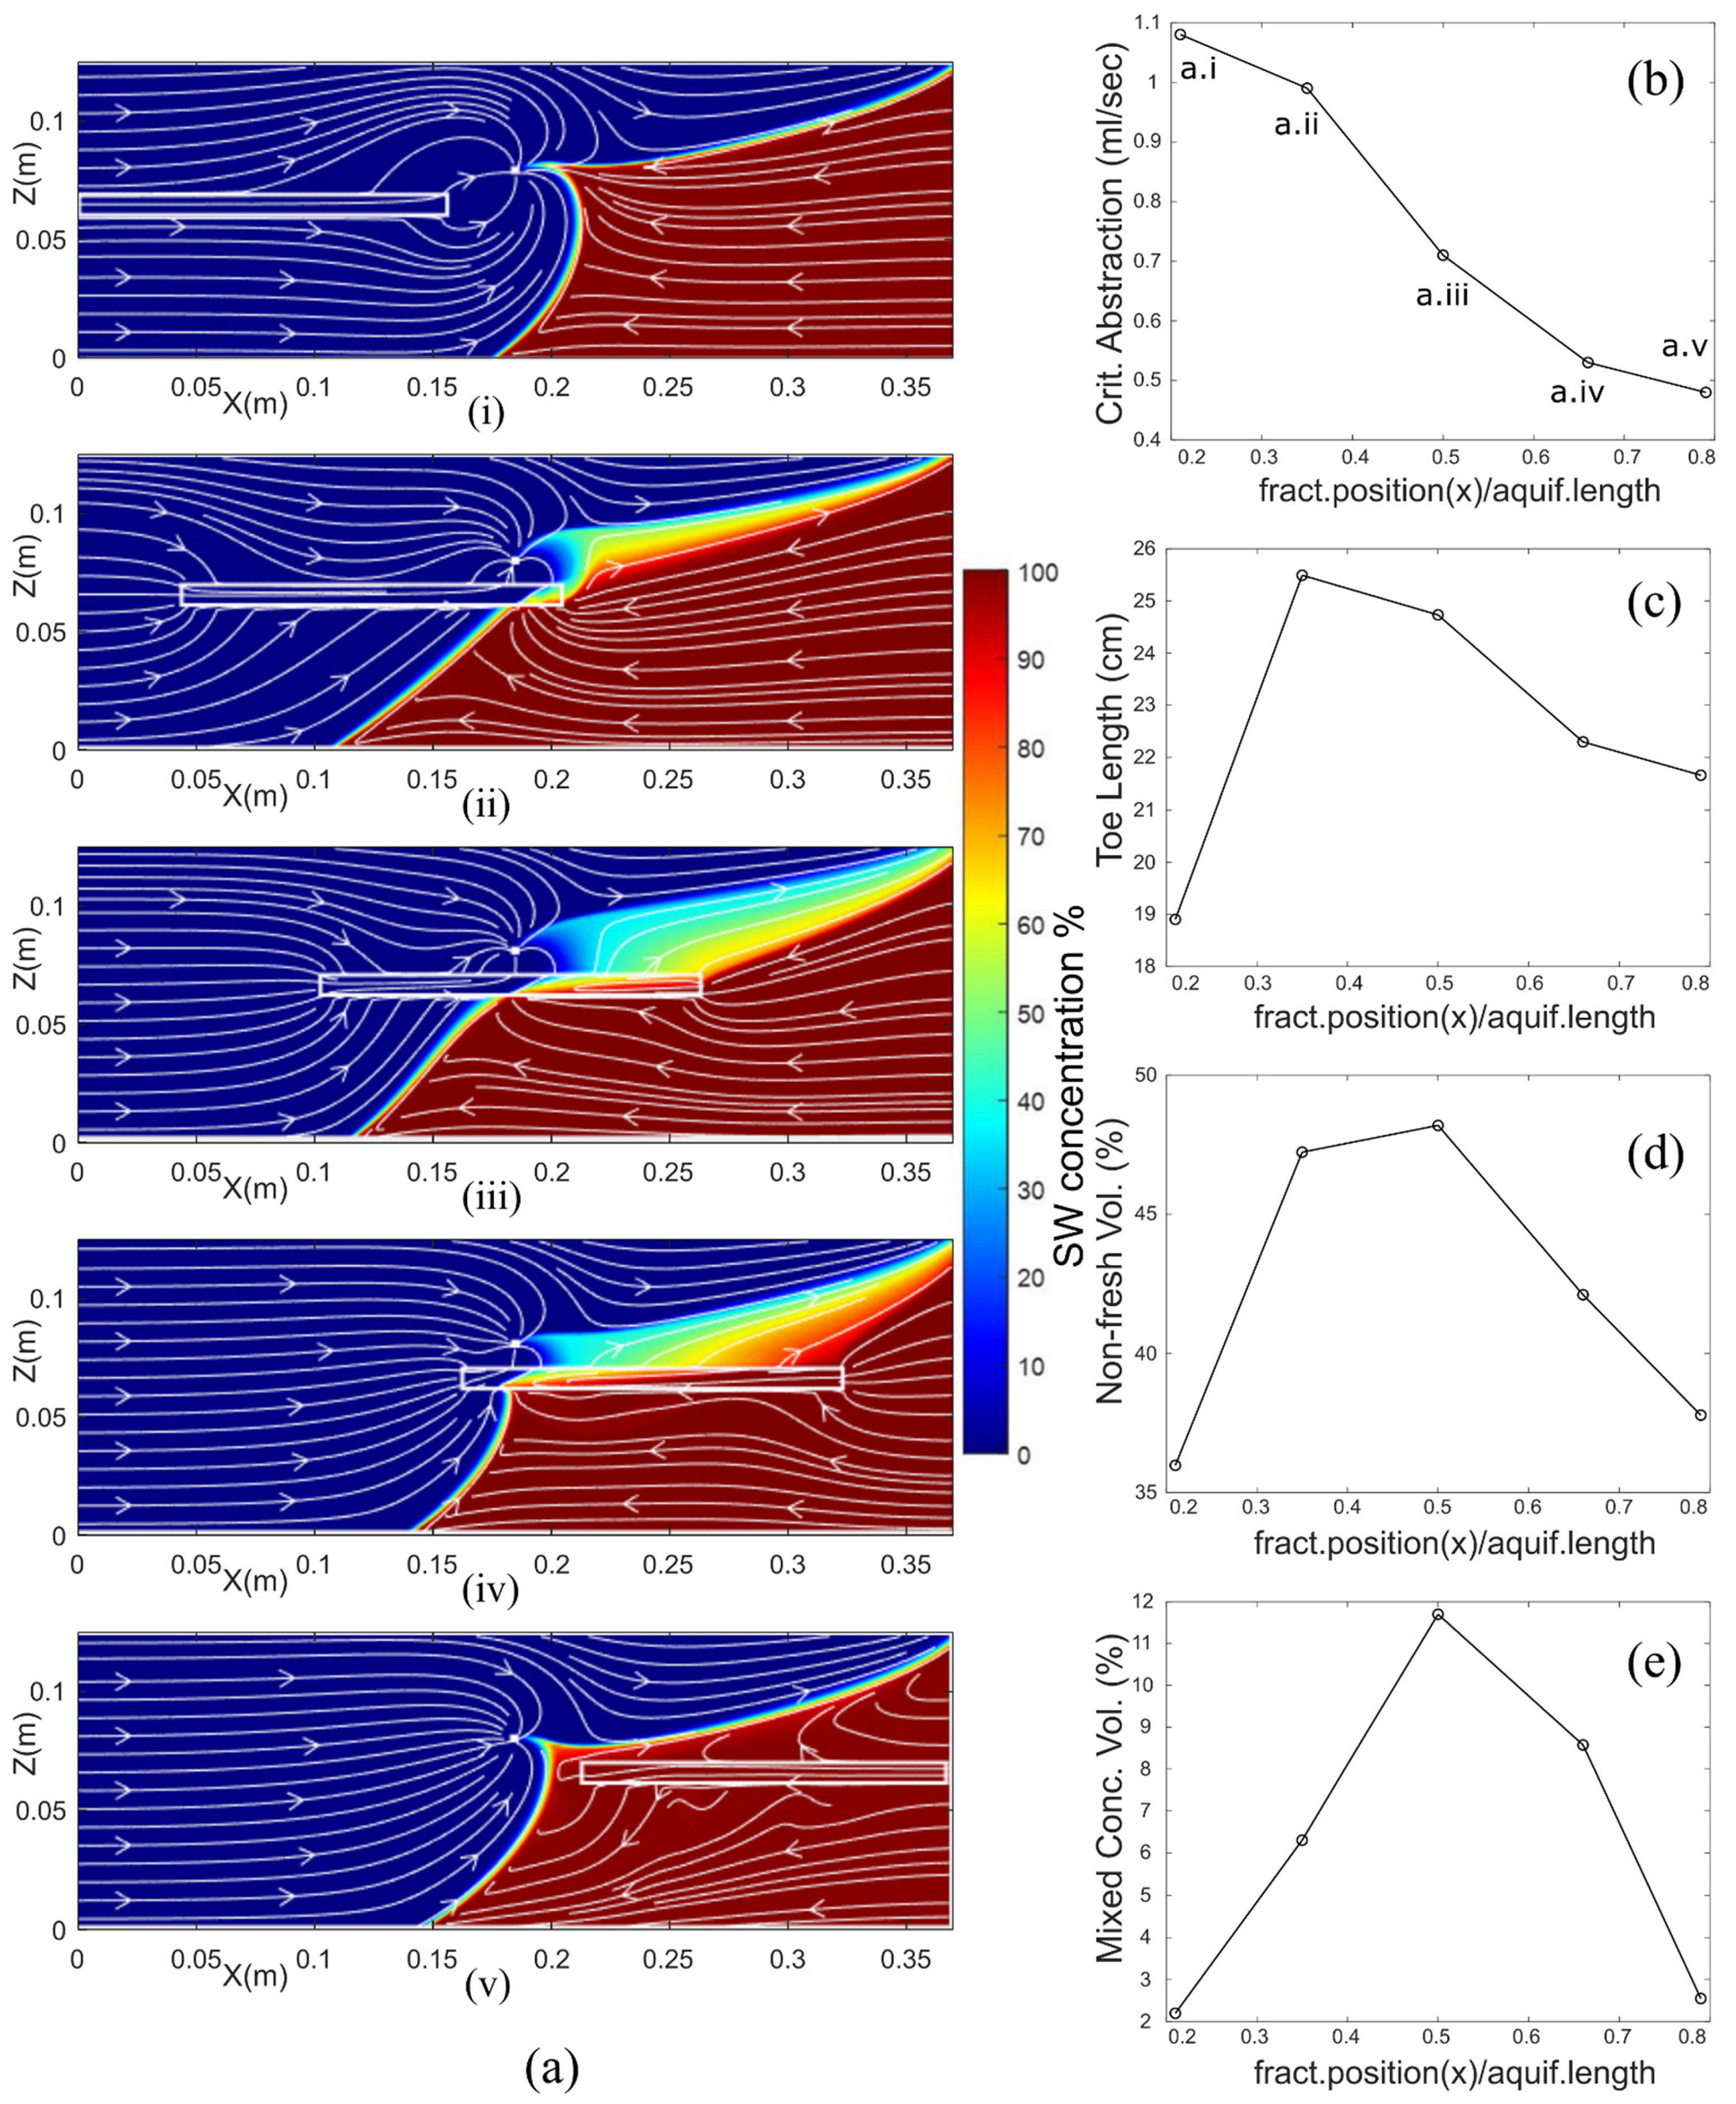
4.2.1. Impact of the Horizontal Position of the Fracture

The impact of the fracture’s relative position on saline intrusion hydrodynamics was investigated in this scenario. In total, five aquifers containing a single discontinuity located at the middle depth of the aquifer, and at different horizontal distances from its side boundaries, were investigated (Figure 9). As seen in Figure 9b, the critical abstraction rates were positively correlated to the fractures’ distance from the seaward aquifer boundary, measured from the discontinuity’s center. This is in agreement with the trend observed in the experimental data. It is worth noticing that the generated SW concentration fields of the fractured-left and fractured-right numerical aquifers were comparable to the concentration distribution generated during the sandbox experiment, while this did not apply for the fractured-center case. This variation can be attributed to the higher accuracy (0.01 ml/sec) utilized in the identification of critical abstraction rates during the sensitivity analysis. The numerical critical pumping rates for the fractured-left and fractured-right aquifers were equal to 1.08 ml/sec and 0.48 ml/sec, respectively, while it was equal to 0.71 ml/sec for the fractured-center case, significantly less than the experimental value of 0.8 ml/sec.
With the exception of the fractured-right case, where the presence of the discontinuity significantly suppressed the landward intrusion of the saline wedge (TL = 18.9 cm), the toe length was positively correlated with the discontinuity’s distance from the left side boundary. Since Etsias et al. [48], in their study of head induced SWI intrusion in fractured aquifers, identified a reverse trend between TL and the fracture’s horizontal position, it is evident that the current results were predominantly dictated by the different values of pumping rate applied in each numerical case. The total non-fresh volume fraction and the extent of the mixing zone presented a similar correlation with the discontinuity’s horizontal (x) position. In the two aquifer cases where the fracture was placed directly next to the aquifer’s left or right-side boundary, the intruding saline volume and the corresponding mixing zones were limited. On the other hand, the fractured-center case exhibited the largest non-saline volume fraction (37.8%) while the mixing zone attributed for up to 12% of the total aquifer area.

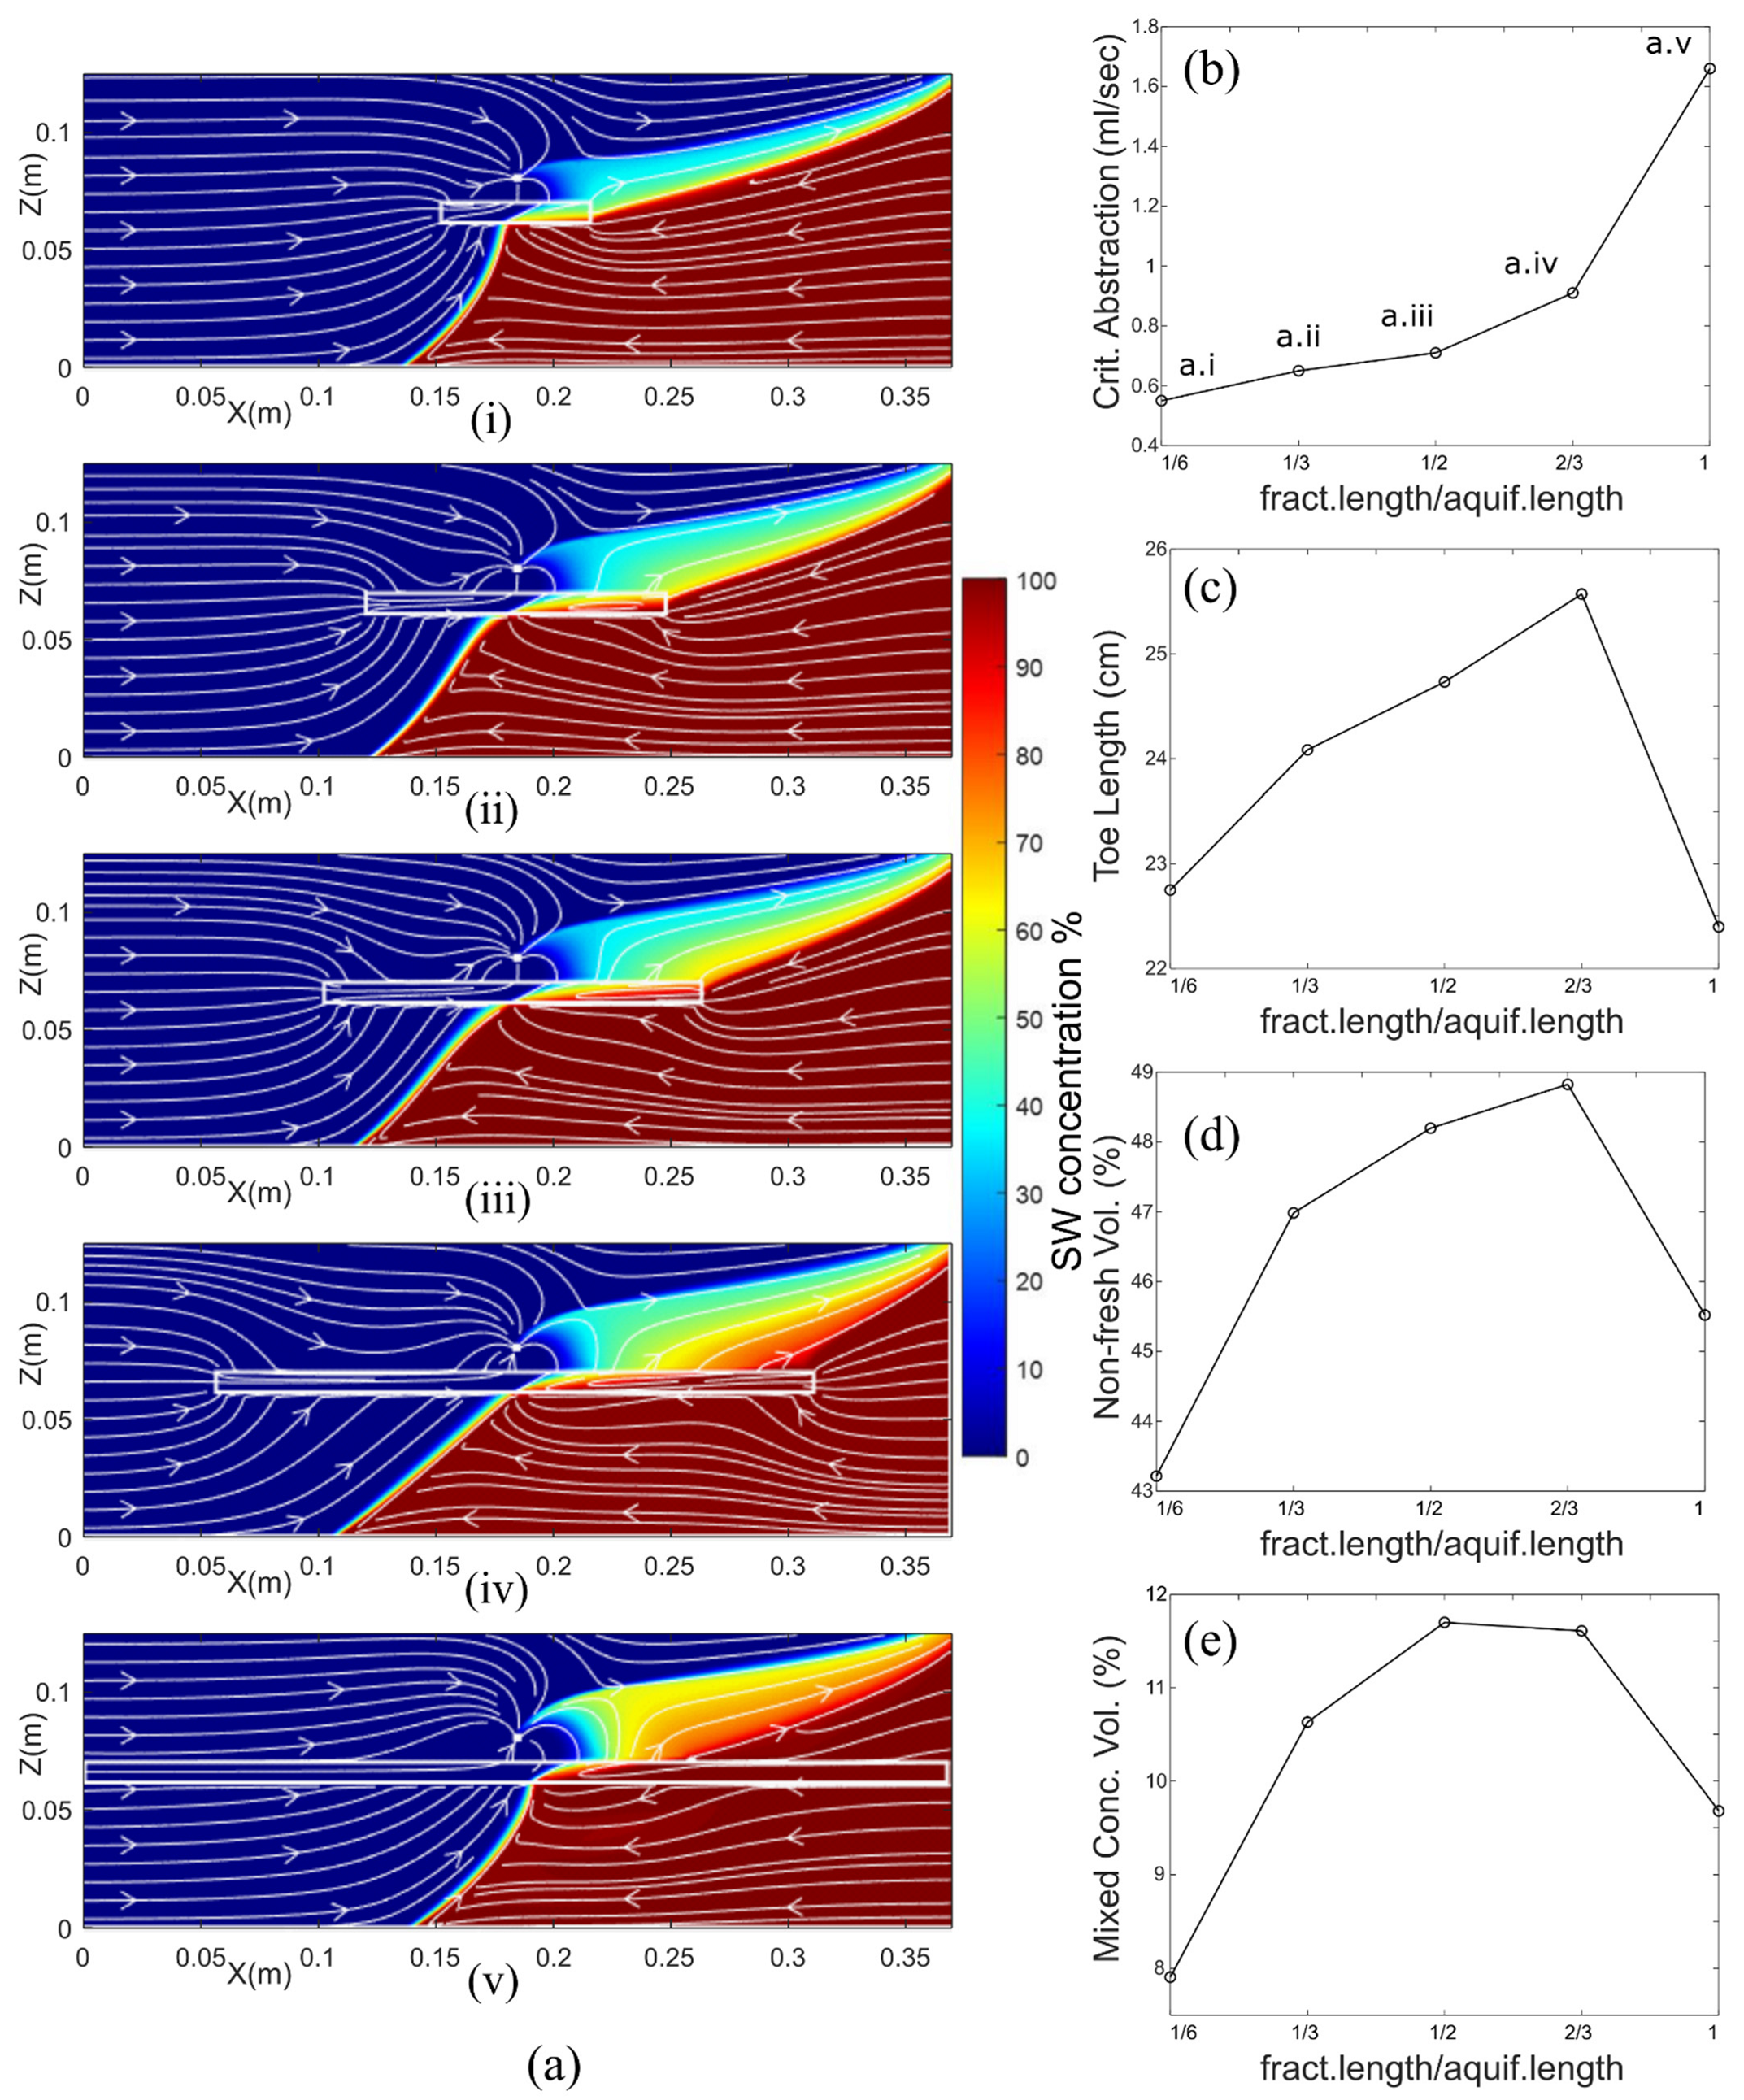
4.2.2. Impact of the Fracture’s Length

The impact of fracture length on the saltwater upconing mechanism was quantified in the second sensitivity analysis setup. In total, five aquifers were created containing horizontal discontinuities of varying lengths, spanning either the whole 38 cm or a fraction (1/6, 1/3, 1/2 and 2/3) of the total aquifer width (Figure 10a). A positive correlation between the length of the discontinuity and the critical abstraction rate was identified (Figure 10b). The critical pumping rate was distinctively larger for the aquifer containing the longest fracture (1.66 ml/secec), being at least two times larger than the values observed in the remaining four cases. With the exception of the last numerical aquifer, both the TL the non-fresh and the mixed concentration volume fractions were positively correlated to the length of the discontinuity (Figure 10c–e). It is evident that the presence of a high-permeability, high-porosity fracture spanning the whole width of the aquifer resulted in the majority of the mass transport occurring through it, thus significantly altering the saltwater upconing mechanism and the values of the corresponding SWI characteristics. The maximum difference between the identified critical abstraction rates was 85% larger than the pumping rate variation observed in the previous scenario, while on the other hand, the TL values range (3.17 cm) was significantly smaller than the range in the first sensitivity analysis setup (6.58 cm).

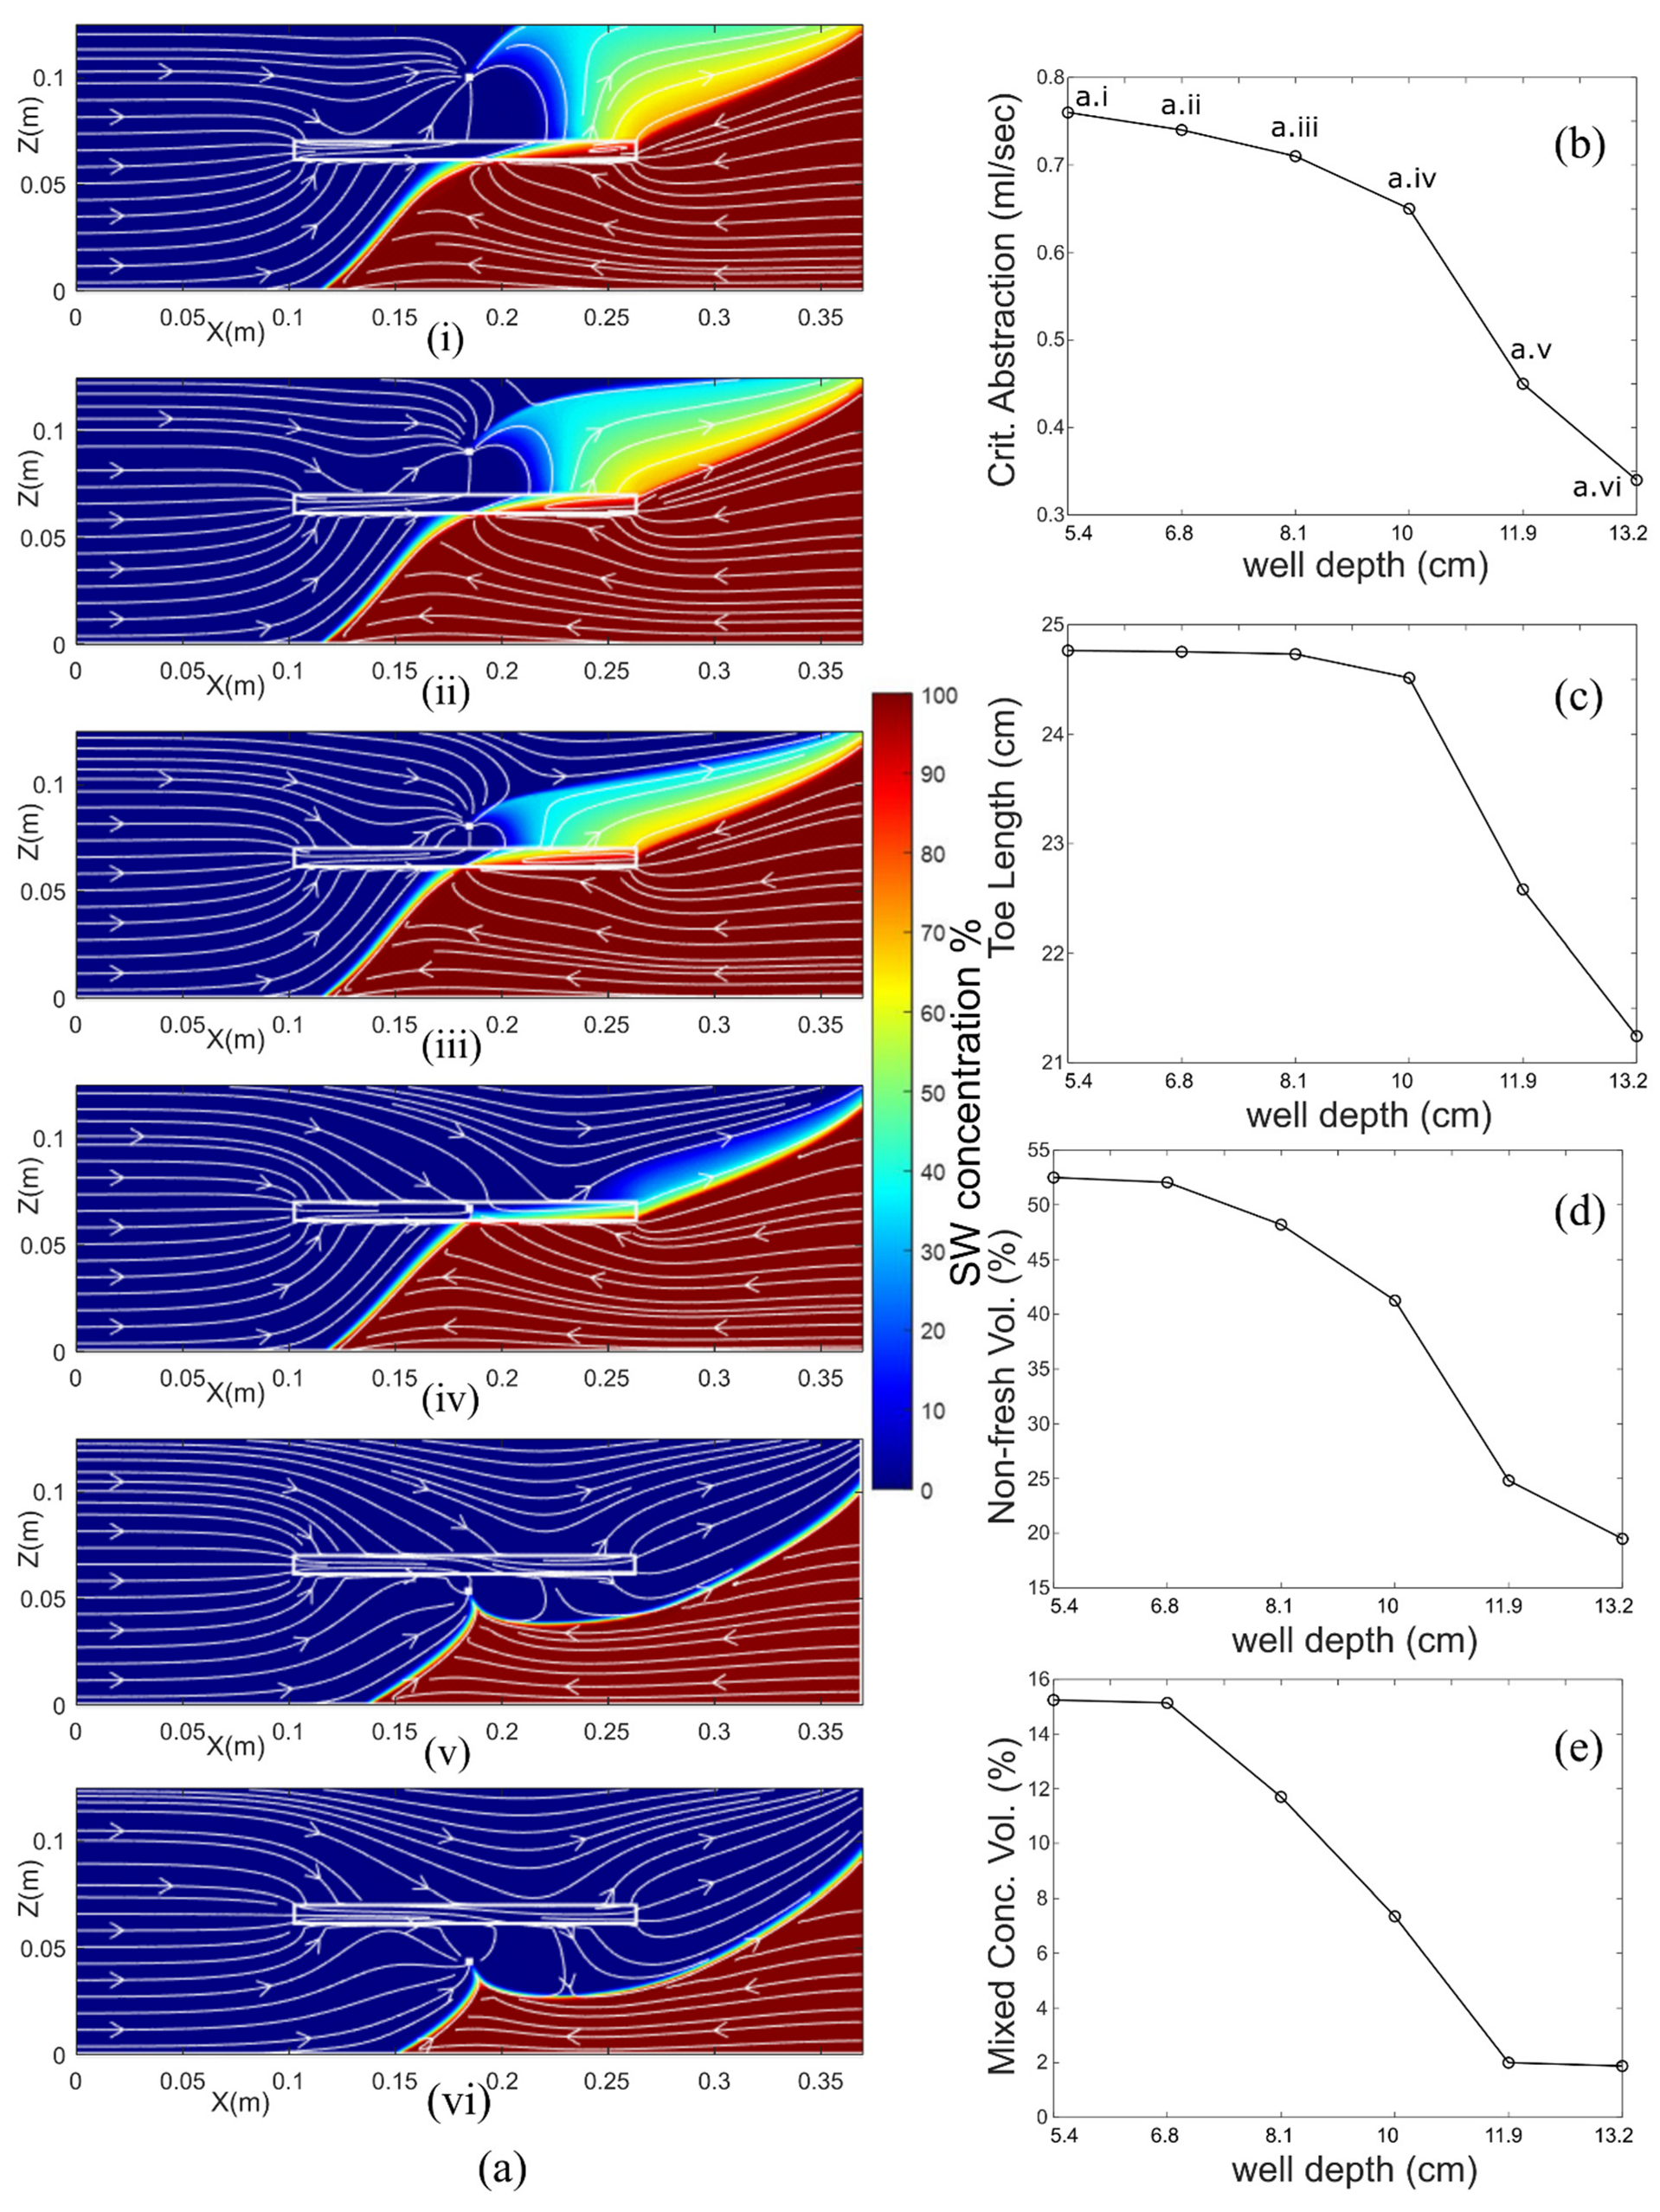
4.2.3. Impact of the Abstraction Well’s Depth

A centrally fractured numerical aquifer was employed in the third sensitivity analysis scenario. As depicted in Figure 11a, freshwater was pumped from six distinct positions in order to quantify the impact of well depth on critical abstraction rates. Three of the abstraction points were located above the discontinuity, at a depth of 5.4 cm, 6.8 cm and 8.1 cm, respectively, the fourth one was placed inside the discontinuity (y = 10 cm), while in the remaining two setups, freshwater was pumped from further deeper into the aquifer (11.9 cm and 13.2 cm). As expected, pre-pumping saline wedge occupied the lower-most part of the aquifers, and as a result, the well depth was negatively correlated to the critical abstraction rate (Figure 11b). It is worth noting, though, that in the final two cases (Figure 11(av,vi)), the critical pumping values were between 44.7% and 59.2% smaller than the critical rates in the other four cases, highlighting that when located between the abstraction well and the intruding saline wedge, fractures act as high-permeability flow barriers, allowing for the abstraction of significantly larger quantities of freshwater, without the danger of aquifer salinization. Similar negative correlations between the abstraction depth and the other three SWI intrusion variables (Figure 11c–e) were identified.
A distinctively wide mixing zone (11.7–15.3%) directly above the discontinuity was observed in the SW concentration fields for the three cases with the shortest abstraction wells. On the other hand, the extent of the saline wedge at the aquifer’s bottom (TL) presented little variation between the three cases (24.73 cm–24.76 cm), indicating the limited impact that progressively larger abstraction rates (0.71 ml/sec–0.76 ml/sec) had on saltwater hydrodynamics in the zone underneath the discontinuity. In the fourth aquifer, the shape of the intruding saline wedge was comparable to the shape in the three previous numerical setups with the exception of the wide mixing zone. The saltwater–freshwater interface in the final two aquifers resembled the saline interface initiated by the presence of deep abstraction wells in stratified aquifers [56]. This illustrated the relatively minor influence that the discontinuities, located further above, had on the saltwater upconing mechanism.

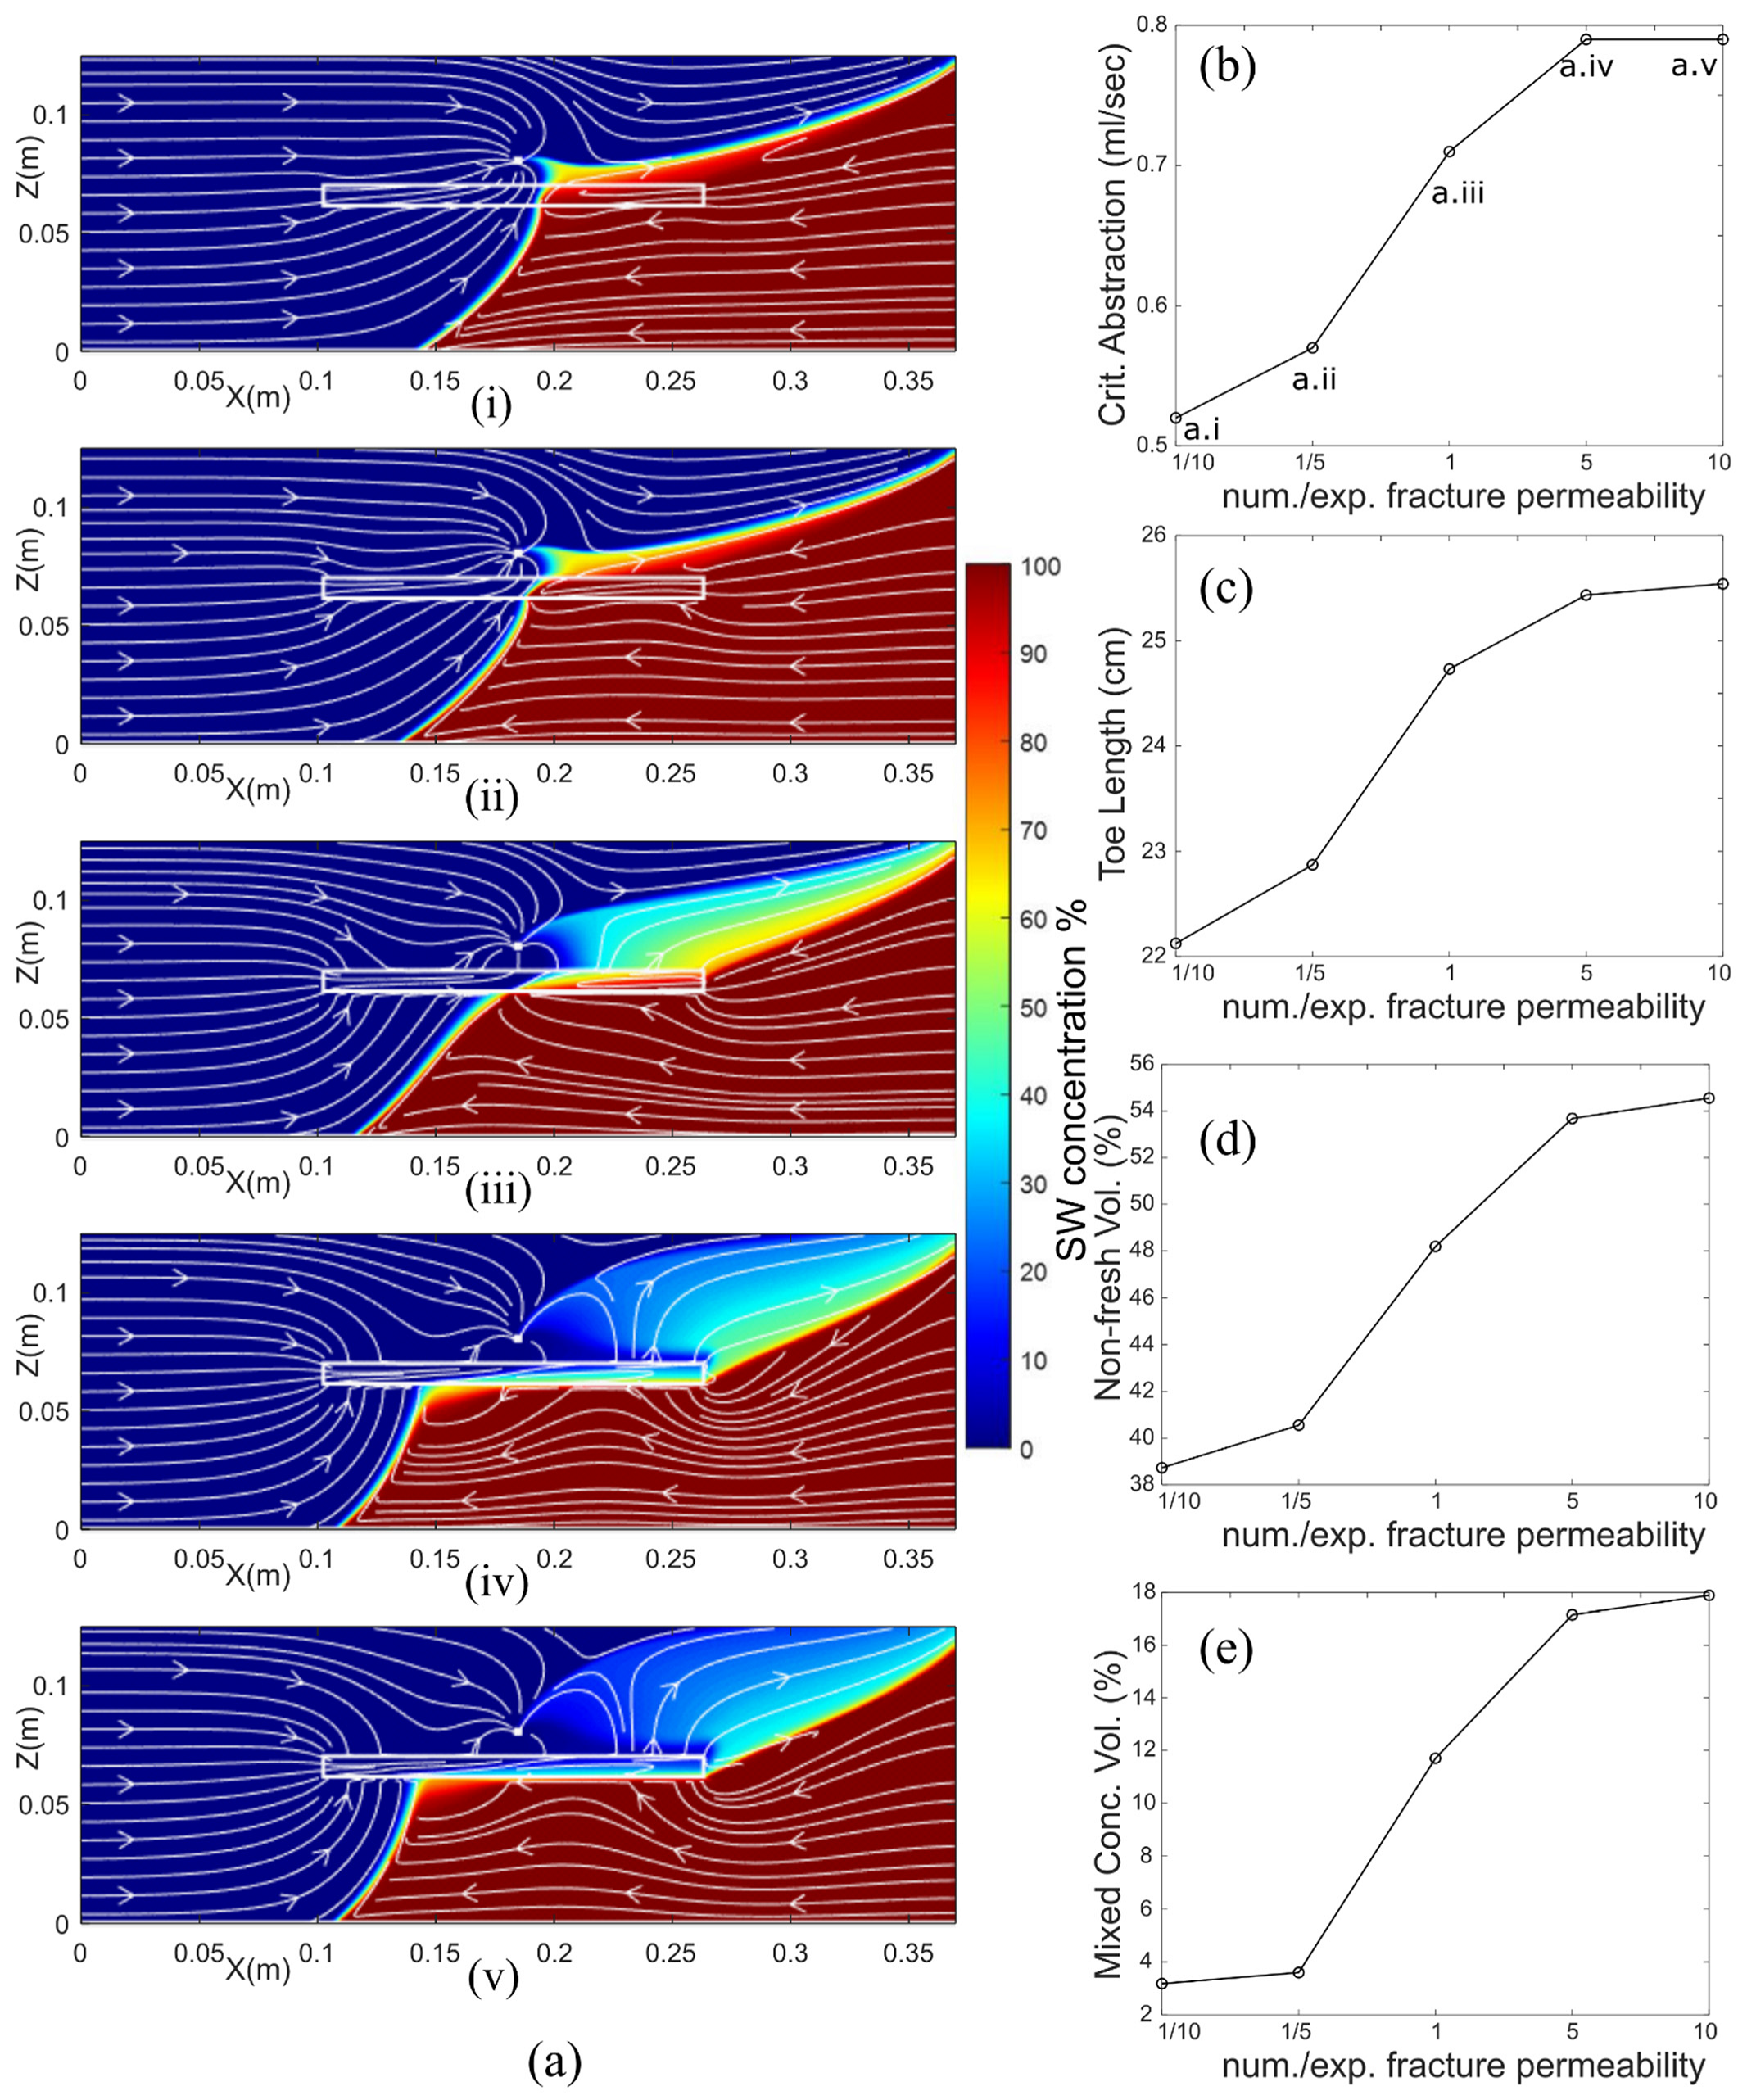
4.2.4. Impact of Fracture Permeability

The impact of fracture permeability on the saltwater upconing mechanism was quantified in the fourth sensitivity analysis scenario. Five numerical fractured aquifers, containing a single horizontal fracture at their center, were created (Figure 12a). The corresponding discontinuity permeabilities became progressively larger from the top to the bottom aquifer, being equal to 0.1, 0.2, 1, 5 and 10 times the experimental permeability of the utilized steel mesh cylinder presented in Section 2. Critical abstraction rate was positively correlated to the fracture’s permeability (Figure 12b). Critical pumping rate was equal to 0.52 ml/secec in the first case, a slightly bigger value than the reported 0.5 ml/sec for the benchmark homogeneous aquifer with the same porous media permeability. On the other hand, the critical abstraction rate was equal to 0.79 ml/sec for both the final two cases, indicating that there is an upper limit on the impact of fracture permeability on the saltwater upconing mechanism, and that progressively larger permeability values do not result in considerable variations in the generated saltwater concentration fields. The larger applied abstraction rates initiated longer TL values (Figure 12c), resulting in a maximum toe length variation between the five numerical cases of approximately 3.4 cm. The presence of more permeable discontinuities generated significantly wider mixing zones; the mixed concentration volume fractions measured in the final two aquifers (17.1% and 17.9%) being the largest ones documented in all six sensitivity analysis scenarios presented in the current investigation.

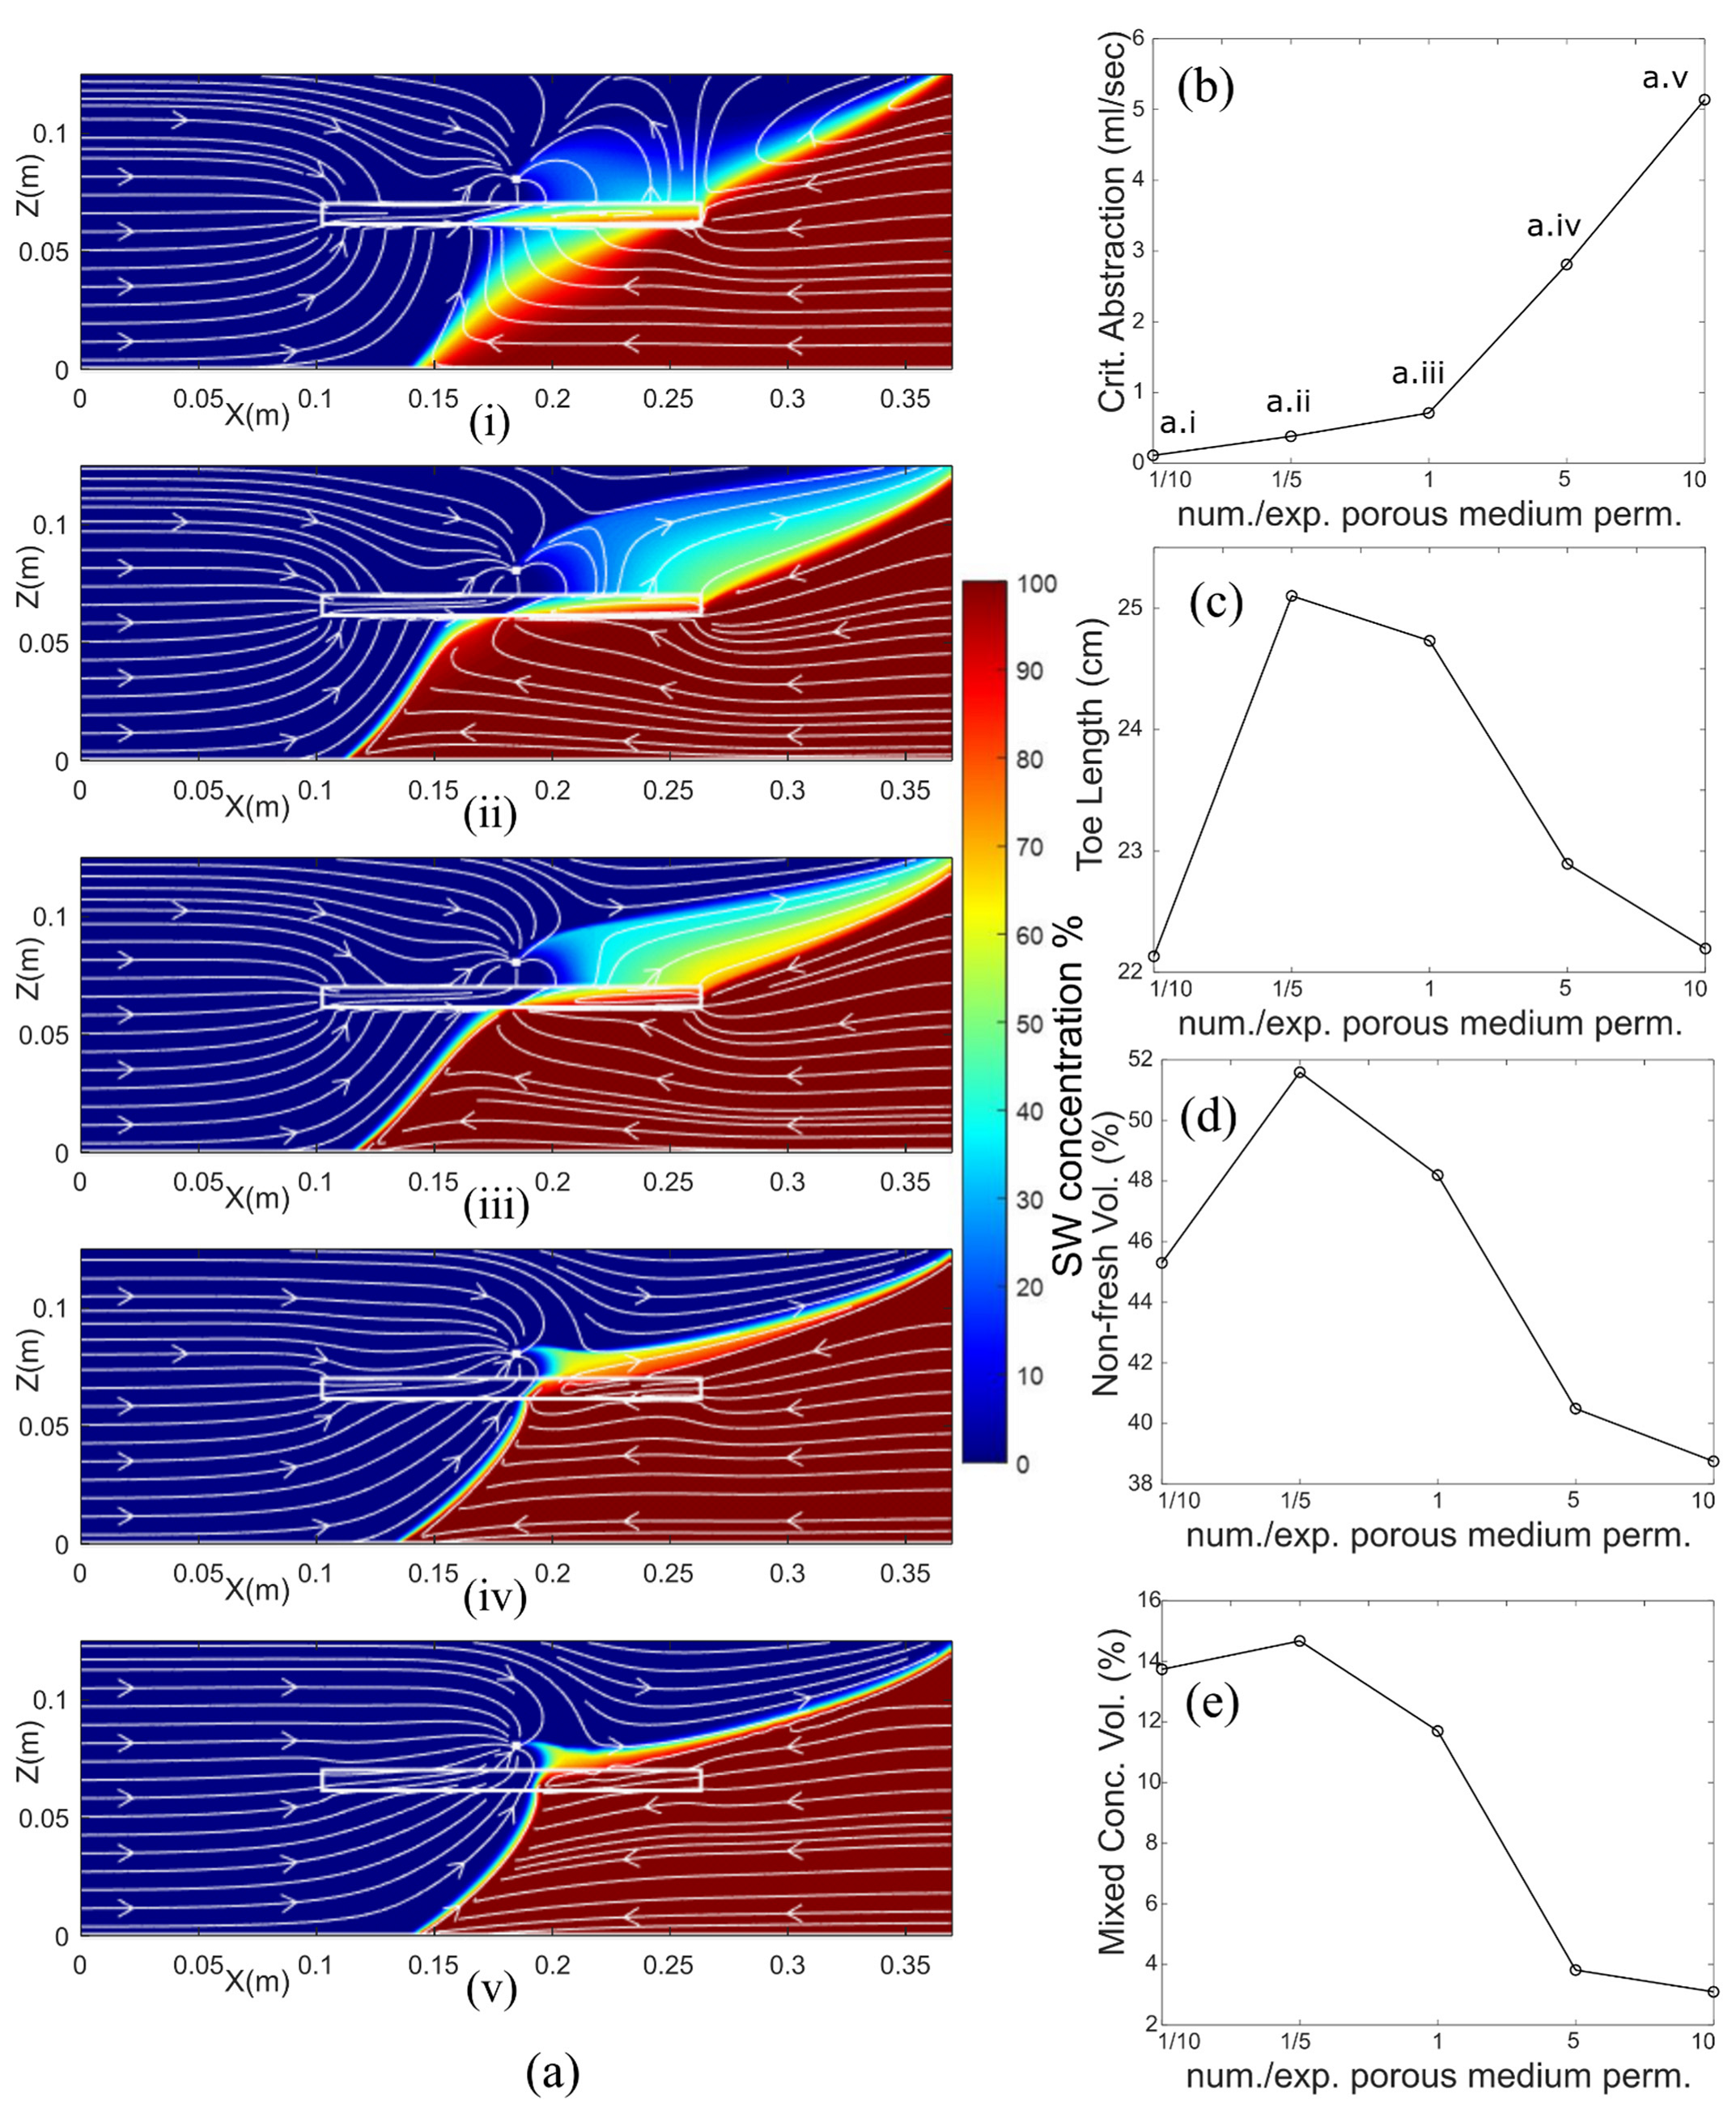
4.2.5. Impact of Porous Media Permeability

A sensitivity analysis setup, comparable with the one presented in the previous sub-section, was employed to investigate the impact of porous medium permeability on saltwater upconing in fractured coastal aquifers. Pumping induced saline intrusion was initiated into five numerical aquifers, consisting of a single horizontal fracture, of standardized size and permeability, and a surrounding homogeneous porous medium with different values of permeability, equal to 0.1, 0.2, 1, 5 and 10 times the experimental permeability measured for the glass bead medium in the sandbox setup. The saltwater concentration field for the less permeable aquifer is presented in Figure 13(ai), while saline distribution for the most permeable one is depicted in Figure 13(av). Porous medium permeability was positively correlated to the critical abstraction rate (Figure 13b). This is in agreement with the conclusions of Abdoulhalik et al. [54] on saltwater upconing in homogeneous aquifers of varying permeability. The value range between the five acquired critical abstraction rates (5.03 ml/sec) was the largest one observed in all six sensitivity analyses, highlighting the crucial impact of porous medium permeability on the potential of well salinization due to freshwater over-abstraction. Except for the first case, with the lowest permeability, all three investigated SWI variables (Figure 13c–e) were negatively correlated to aquifer porous medium permeability. In the extremely low porous medium permeability (1.83 × 10⁻¹⁰ m2) aquifer, there was no saline intrusion before the introduction of saltwater pumping, this resulted in a uniquely shaped saltwater–freshwater interface.
It is worth noticing that the critical saltwater concentrations of the final two aquifers (Figure 13(aiv,v)) closely resembled the SW concentration fields of the aquifers containing the less permeable fractures (Figure 12(ai,ii)) presented in the previous sensitivity analysis scenario. Even though total aquifer permeability was significantly different between the four aquifers, they shared the exact same permeability contrast between their discontinuity and its surrounding porous medium, that was equal to 5 for the cases presented in Figure 12(ai) and Figure 13(av), and equal to 2.5 for the ones depicted in Figure 12(aii) and Figure 13(aiv). This resemblance is exhibited in the values of the three SWI variables presented in Table 4. The maximum TL difference between these aquifer pairs was equal to just 0.8 mm, while the maximum deviation in the total non-fresh and the mixed concentration volume fractions were equal to 0.06% and 0.21%, respectively. The permeability contrast between various layers has been identified as defining factor of the saline intrusion dynamics in stratified hydrological systems [47,71,72]. This study expands on this observation, showing for the first time the importance of the permeability contrast on the saltwater upconing mechanism in fractured coastal aquifers.
The sensitivity analysis results presented here, agreed with, and further expanded the laboratory findings of the previous section. Critical abstraction rates were positively corelated to the horizontal fracture’s length, permeability and distance from the seaward boundary, as well as to the permeability of the surrounding porous medium, while being negatively correlated to the abstraction well’s depth and the hydraulic head difference applied to the fractured 2-dimensional aquifers. Moreover, the resulting saltwater concentration fields revealed interesting relationships between the various discontinuity characteristics and the toe length, the total volume of the intruding saline wedge as well as the mixing zone in the investigated aquifers.
A sixth sensitivity analysis scenario, presented in the Supplementary Materials, identified the impact of applied hydraulic head difference, indicating that smaller hydraulic head differences lead to significantly smaller critical abstraction rates.

5. Conclusions

Pumping-induced saline intrusion in fractured coastal aquifers was investigated for the first time on a laboratory scale. Three synthetic aquifers were created in a thin sandbox setup, each one containing a single horizontal discontinuity placed in a different position. Freshwater was abstracted from the center of the aquifers using a peristaltic pump, initiating the saltwater upconing mechanism. Progressively larger pumping rates were applied into the systems until a critical state, that resulted in well salinization, was achieved. Automated image analysis was employed to visualize the experimental saltwater concentration fields and to quantify the extent of both the intruding saline wedges and the corresponding mixing zone with high accuracy. A finite element numerical model, performed using the SUTRA code, successfully simulated the laboratory results and was subsequently utilized to conduct a comprehensive sensitivity analysis, expanding the experimental findings.
Before the introduction of pumping, discontinuities acted in a similar manner to high permeability barriers, confining the saline wedge at the lower most part of the aquifer. As a result, the presence of fractures permitted the abstraction of relatively larger volumes of freshwater without the occurrence of well salinization. The following key relationships, regarding head-controlled systems, were identified for the critical abstraction rates and the various fractured aquifer characteristics:
  • Critical abstraction rates were positively correlated to the distance of the discontinuities from the seaward aquifer boundary.
  • The presence of longer horizontal fractures corresponded to progressively larger critical pumping rates.
  • Since the pre-pumping saltwater–freshwater interface was located in the lower part of the aquifers, deeper pumping wells resulted in more rapid well salinization.
  • Smaller hydraulic head differences corresponded to longer pre-pumping intruding wedges, thus leading to significantly smaller critical abstraction rates.
  • Critical pumping rates were positively correlated to the permeabilities of both the discontinuity and the surrounding porous medium. Nevertheless, the impact of the porous medium was far more significant.
In all three experimental setups, the cessation of pumping resulted in the rapid retreat of the saline wedge, where a noticeable transient widening of the mixing zone was observed. Moreover, in cases where the discontinuity was located between the pumping well and the seaward aquifer boundary, the saline front was segmented into two distinct saline plumes that retreated separately towards the sea.
Under critical pumping conditions, fractured aquifers with different total permeabilities but the same permeability contrast between their discontinuity and the surrounding porous medium, demonstrated comparable distributions of saltwater concentrations, and comparable TL and mixing zone values. This indicated that, similar to what applies with stratified coastal aquifers, permeability contrast has a crucial impact on saltwater hydrodynamics in fractured media.
The current investigation quantified the impact of high permeability, high porosity fractures on pumping-induced saline intrusion hydrodynamics. The simplified nature of the laboratory setup enabled the formulation of relationships between the critical abstraction rates and the various aquifer characteristics, while minimizing the impact of unknowns present in most field scale studies. Even though formulated under idealized conditions, these findings could be a valuable contribution towards the sustainable management of real world fractured coastal aquifers. Moreover, the large amount of high-quality experimental data could be successfully utilized to benchmark future numerical models or analytical solutions investigating SWI dynamics in fractured porous media.

Supplementary Materials

The following are available online at https://www.mdpi.com/article/10.3390/w13233331/s1.

Author Contributions

Conceptualization, G.E. and G.A.H.; methodology, G.E.; software, G.E.; validation, G.E. and G.A.H.; formal analysis, G.E.; investigation, G.E., C.T. and S.K.; resources, J.F.Á., E.M.B. and M.C.M.; data curation, G.E., C.T. and S.K.; writing—original draft preparation, G.E.; writing—review and editing, G.A.H., E.M.B., J.F.Á., M.C.M., R.F. and A.A.A.; visualization, G.E.; supervision, G.A.H. and R.F.; project administration, G.A.H.; funding acquisition, G.A.H. All authors have read and agreed to the published version of the manuscript.

Funding

This research was funded by EPSRC Standard Research (Grant No. EP/R019258/1).

Data Availability Statement

The relevant data arising from this research are listed in the tables, and figures contained herein. Any additional details may be obtained from the corresponding author ([email protected]).

Conflicts of Interest

The authors declare no conflict of interest. The funders had no role in the design of the study; in the collection, analyses, or interpretation of data; in the writing of the manuscript, or in the decision to publish the results.

References

  1. Werner, A.D.; Bakker, M.; Post, V.E.A.; Vandenbohede, A.; Lu, C.; Ataie-Ashtiani, B.; Simmons, C.T.; Barry, D.A. Seawater intrusion processes, investigation and management: Recent advances and future challenges. Adv. Water Resour. 2013, 51, 3–26. [Google Scholar] [CrossRef]
  2. Shi, L.; Jiao, J.J. Seawater intrusion and coastal aquifer management in China: A review. Environ. Earth Sci. 2014, 72, 2811–2819. [Google Scholar] [CrossRef]
  3. Michael, H.A.; Post, V.E.A.; Wilson, A.M.; Werner, A.D. Science, society, and the coastal groundwater squeeze. Water Resour. Res. 2017, 53, 2610–2617. [Google Scholar] [CrossRef]
  4. Reilly, T.E.; Goodman, A.S. Analysis of saltwater upconing beneath a pumping well. J. Hydrol. 1987, 89, 169–204. [Google Scholar] [CrossRef]
  5. WHO. Guidelines for Drinking-Water Quality; World Health Organization: Geneva, Switzerland, 2011; Volume 216, pp. 303–304. [Google Scholar]
  6. Neumann, B.; Vafeidis, A.T.; Zimmermann, J.; Nicholls, R.J. Future coastal population growth and exposure to sea-level rise and coastal flooding—A global assessment. PLoS ONE 2015, 10, e0118571. [Google Scholar] [CrossRef] [Green Version]
  7. Ford, D.; Willimas, P. Karst Hydrogeology and Geomorphology; John Wiley & Sons Ltd.: Chichester, UK, 2007. [Google Scholar]
  8. Bakalowicz, M.; El Hakim, M.; El-Hajj, A. Karst groundwater resources in the countries of eastern Mediterranean: The example of Lebanon. Environ. Geol. 2008, 54, 597–604. [Google Scholar] [CrossRef]
  9. Custodio, E. Coastal aquifers of Europe: An overview. Hydrogeol. J. 2010, 18, 269–280. [Google Scholar] [CrossRef]
  10. Chen, Z.; Auler, A.S.; Bakalowicz, M.; Drew, D.; Griger, F.; Hartmann, J.; Jiang, G.; Moosdorf, N.; Richts, A.; Stevanovic, Z.; et al. The World Karst Aquifer Mapping project: Concept, mapping procedure and map of Europe. Hydrogeol. J. 2017, 25, 771–785. [Google Scholar] [CrossRef] [Green Version]
  11. Montiel, D.; Dimova, N.; Andreo, B.; Prieto, J.; García-Orellana, J.; Rodellas, V. Assessing submarine groundwater discharge (SGD) and nitrate fluxes in highly heterogeneous coastal karst aquifers: Challenges and solutions. J. Hydrol. 2018, 557, 222–242. [Google Scholar] [CrossRef]
  12. Giese, M.; Barthel, R. Review: Saltwater intrusion in fractured crystalline bedrock. Hydrogeol. J. 2021, 29, 2313–2328. [Google Scholar] [CrossRef]
  13. Arthur, J.D.; Wood, H.A.R.; Baker, A.E.; Cichon, J.R.; Raines, G.L. Development and Implementation of a Bayesian-based Aquifer Vulnerability Assessment in Florida. Nat. Resour. Res. 2007, 16, 93–107. [Google Scholar] [CrossRef]
  14. Lim, J.-W.; Lee, E.; Moon, H.S.; Lee, K.-K. Integrated investigation of seawater intrusion around oil storage caverns in a coastal fractured aquifer using hydrogeochemical and isotopic data. J. Hydrol. 2013, 486, 202–210. [Google Scholar] [CrossRef]
  15. Perriquet, M.; Leonardi, V.; Henry, T.; Jourde, H. Saltwater wedge variation in a non-anthropogenic coastal karst aquifer influenced by a strong tidal range (Burren, Ireland). J. Hydrol. 2014, 519, 2350–2365. [Google Scholar] [CrossRef]
  16. Arfib, B.; Charlier, J.-B. Insights into saline intrusion and freshwater resources in coastal karstic aquifers using a lumped Rainfall–Discharge–Salinity model (the Port-Miou brackish spring, SE France). J. Hydrol. 2016, 540, 148–161. [Google Scholar] [CrossRef] [Green Version]
  17. Xu, Z.; Bassett, S.W.; Hu, B.; Dyer, S.B. Long distance seawater intrusion through a karst conduit network in the Woodville Karst Plain, Florida. Sci. Rep. 2016, 6, 32235. [Google Scholar] [CrossRef]
  18. MacAllister, D.J.; Jackson, M.D.; Butler, A.P.; Vinogradov, J. Remote Detection of Saline Intrusion in a Coastal Aquifer Using Borehole Measurements of Self-Potential. Water Resour. Res. 2018, 54, 1669–1687. [Google Scholar] [CrossRef] [Green Version]
  19. De Filippis, G.; Foglia, L.; Giudici, M.; Mehl, S.; Margiotta, S.; Negri, S.L. Seawater intrusion in karstic, coastal aquifers: Current challenges and future scenarios in the Taranto area (southern Italy). Sci. Total Environ. 2016, 573, 1340–1351. [Google Scholar] [CrossRef] [PubMed]
  20. Khadra, W.M.; Stuyfzand, P.J. Simulation of saltwater intrusion in a poorly karstified coastal aquifer in Lebanon (Eastern Mediterranean). Hydrogeol. J. 2018, 26, 1839–1856. [Google Scholar] [CrossRef]
  21. Dokou, Z.; Karatzas, G.P. Saltwater intrusion estimation in a karstified coastal system using density-dependent modelling and comparison with the sharp-interface approach. Hydrol. Sci. J. 2012, 57, 985–999. [Google Scholar] [CrossRef]
  22. Nocchi, M.; Salleolini, M. A 3D density-dependent model for assessment and optimization of water management policy in a coastal carbonate aquifer exploited for water supply and fish farming. J. Hydrol. 2013, 492, 200–218. [Google Scholar] [CrossRef]
  23. Park, H.-Y.; Jang, K.; Ju, J.W.; Yeo, I.W. Hydrogeological characterization of seawater intrusion in tidally-forced coastal fractured bedrock aquifer. J. Hydrol. 2012, 446–447, 77–89. [Google Scholar] [CrossRef]
  24. Romanazzi, A.; Gentile, F.; Polemio, M. Modelling and management of a Mediterranean karstic coastal aquifer under the effects of seawater intrusion and climate change. Environ. Earth Sci. 2015, 74, 115–128. [Google Scholar] [CrossRef]
  25. Steiakakis, E.; Vavadakis, D.; Kritsotakis, M.; Voudouris, K.; Anagnostopoulou, C. Drought impacts on the fresh water potential of a karst aquifer in Crete, Greece. Environ. Earth Sci. 2016, 75, 507. [Google Scholar] [CrossRef]
  26. Scharping, R.J.; Garman, K.M.; Henry, R.P.; Eswara, P.J.; Garey, J.R. The fate of urban springs: Pumping-induced seawater intrusion in a phreatic cave. J. Hydrol. 2018, 564, 230–245. [Google Scholar] [CrossRef]
  27. Koohbor, B.; Fahs, M.; Ataie-Ashtiani, B.; Belfort, B.; Simmons, C.T.; Younes, A. Uncertainty analysis for seawater intrusion in fractured coastal aquifers: Effects of fracture location, aperture, density and hydrodynamic parameters. J. Hydrol. 2019, 571, 159–177. [Google Scholar] [CrossRef]
  28. Robinson, G.; Ahmed, A.A.; Hamill, G.A. Experimental saltwater intrusion in coastal aquifers using automated image analysis: Applications to homogeneous aquifers. J. Hydrol. 2016, 538, 304–313. [Google Scholar] [CrossRef] [Green Version]
  29. Memari, S.S.; Bedekar, V.S.; Clement, T.P. Laboratory and Numerical Investigation of Saltwater Intrusion Processes in a Circular Island Aquifer. Water Resour. Res. 2020, 56, e2019WR025325. [Google Scholar] [CrossRef]
  30. Kuan, W.K.; Jin, G.; Xin, P.; Robinson, C.; Gibbes, B.; Li, L. Tidal influence on seawater intrusion in unconfined coastal aquifers. Water Resour. Res. 2012, 48. [Google Scholar] [CrossRef] [Green Version]
  31. Liu, S.; Tao, A.; Dai, C.; Tan, B.; Shen, H.; Zhong, G.; Lou, S.; Chalov, S.; Chalov, R. Experimental Study of Tidal Effects on Coastal Groundwater and Pollutant Migration. Water Air Soil Pollut. 2017, 228, 163. [Google Scholar] [CrossRef]
  32. Kuan, W.K.; Xin, P.; Jin, G.; Robinson, C.E.; Gibbes, B.; Li, L. Combined Effect of Tides and Varying Inland Groundwater Input on Flow and Salinity Distribution in Unconfined Coastal Aquifers. Water Resour. Res. 2019, 55, 8864–8880. [Google Scholar] [CrossRef]
  33. Yu, X.; Xin, P.; Lu, C. Seawater intrusion and retreat in tidally-affected unconfined aquifers: Laboratory experiments and numerical simulations. Adv. Water Resour. 2019, 132, 103393. [Google Scholar] [CrossRef]
  34. Na, J.; Chi, B.; Zhang, Y.; Li, J.; Jiang, X. Study on the influence of seawater density variation on sea water intrusion in confined coastal aquifers. Environ. Earth Sci. 2019, 78, 669. [Google Scholar] [CrossRef]
  35. Abdoulhalik, A.; Ahmed, A.A. Transience of seawater intrusion and retreat in response to incremental water-level variations. Hydrol. Process. 2018, 32, 2721–2733. [Google Scholar] [CrossRef]
  36. Abdoulhalik, A.; Ahmed, A.A. The effectiveness of cutoff walls to control saltwater intrusion in multi-layered coastal aquifers: Experimental and numerical study. J. Environ. Manag. 2017, 199, 62–73. [Google Scholar] [CrossRef] [PubMed] [Green Version]
  37. Shen, Y.; Xin, P.; Yu, X. Combined effect of cutoff wall and tides on groundwater flow and salinity distribution in coastal unconfined aquifers. J. Hydrol. 2020, 581, 124444. [Google Scholar] [CrossRef]
  38. Chang, Q.; Zheng, T.; Zheng, X.; Zhang, B.; Sun, Q.; Walther, M. Effect of subsurface dams on saltwater intrusion and fresh groundwater discharge. J. Hydrol. 2019, 576, 508–519. [Google Scholar] [CrossRef]
  39. Konz, M.; Younes, A.; Ackerer, P.; Fahs, M.; Huggenberger, P.; Zechner, E. Variable-density flow in heterogeneous porous media—Laboratory experiments and numerical simulations. J. Contam. Hydrol. 2009, 108, 168–175. [Google Scholar] [CrossRef]
  40. Dose, E.J.; Stoeckl, L.; Houben, G.J.; Vacher, H.L.; Vassolo, S.; Dietrich, J.; Himmelsbach, T. Experiments and modeling of freshwater lenses in layered aquifers: Steady state interface geometry. J. Hydrol. 2014, 509, 621–630. [Google Scholar] [CrossRef]
  41. Houben, G.J.; Stoeckl, L.; Mariner, K.E.; Choudhury, A.S. The influence of heterogeneity on coastal groundwater flow—physical and numerical modeling of fringing reefs, dykes and structured conductivity fields. Adv. Water Resour. 2018, 113, 155–166. [Google Scholar] [CrossRef]
  42. Vithanage, M.; Engesgaard, P.; Jensen, K.H.; Illangasekare, T.H.; Obeysekera, J. Laboratory investigations of the effects of geologic heterogeneity on groundwater salinization and flush-out times from a tsunami-like event. J. Contam. Hydrol. 2012, 136–137, 10–24. [Google Scholar] [CrossRef]
  43. Mehdizadeh, S.S.; Werner, A.D.; Vafaie, F.; Badaruddin, S. Vertical leakage in sharp-interface seawater intrusion models of layered coastal aquifers. J. Hydrol. 2014, 519, 1097–1107. [Google Scholar] [CrossRef]
  44. Liu, Y.; Mao, X.; Chen, J.; Barry, D.A. Influence of a coarse interlayer on seawater intrusion and contaminant migration in coastal aquifers. Hydrol. Process. 2014, 28, 5162–5175. [Google Scholar] [CrossRef]
  45. Abdoulhalik, A.; Ahmed, A.A. How does layered heterogeneity affect the ability of subsurface dams to clean up coastal aquifers contaminated with seawater intrusion? J. Hydrol. 2017, 553, 708–721. [Google Scholar] [CrossRef] [Green Version]
  46. Guo, Q.; Huang, J.; Zhou, Z.; Wang, J. Experiment and Numerical Simulation of Seawater Intrusion under the Influences of Tidal Fluctuation and Groundwater Exploitation in Coastal Multilayered Aquifers. Geofluids 2019, 2019, 2316271. [Google Scholar] [CrossRef] [Green Version]
  47. Etsias, G.; Hamill, G.A.; Águila, J.F.; Benner, E.M.; McDonnell, M.C.; Ahmed, A.A.; Flynn, R. The impact of aquifer stratification on saltwater intrusion characteristics. Comprehensive laboratory and numerical study. Hydrol. Process. 2021, 35, e14120. [Google Scholar] [CrossRef]
  48. Etsias, G.; Hamill, G.A.; Campbell, D.; Straney, R.; Benner, E.M.; Águila, J.F.; McDonnell, M.; Ahmed, A.A.; Flynn, R. Laboratory and numerical investigation of saline intrusion in fractured coastal aquifers. Adv. Water Resour. 2021, 149, 103866. [Google Scholar] [CrossRef]
  49. Werner, A.D.; Jakovovic, D.; Simmons, C.T. Experimental observations of saltwater up-coning. J. Hydrol. 2009, 373, 230–241. [Google Scholar] [CrossRef]
  50. Stoeckl, L.; Houben, G. Flow dynamics and age stratification of freshwater lenses: Experiments and modeling. J. Hydrol. 2012, 458–459, 9–15. [Google Scholar] [CrossRef]
  51. Mehdizadeh, S.S.; Vafaie, F.; Abolghasemi, H. Assessment of sharp-interface approach for saltwater intrusion prediction in an unconfined coastal aquifer exposed to pumping. Environ. Earth Sci. 2015, 73, 8345–8355. [Google Scholar] [CrossRef]
  52. Noorabadi, S.; Nazemi, A.H.; Sadraddini, A.A.; Delirhasannia, R. Laboratory investigation of water extraction effects on saltwater wedge displacement. Glob. J. Environ. Sci. Manag. 2017, 3, 21–32. [Google Scholar] [CrossRef]
  53. Abdelgawad, A.M.; Abdoulhalik, A.; Ahmed, A.A.; Moutari, S.; Hamill, G. Transient Investigation of the Critical Abstraction Rates in Coastal Aquifers: Numerical and Experimental Study. Water Resour. Manag. 2018, 32, 3563–3577. [Google Scholar] [CrossRef] [Green Version]
  54. Abdoulhalik, A.; Ahmed, A.A. Transient investigation of saltwater upconing in laboratory-scale coastal aquifer. Estuar. Coast. Shelf Sci. 2018, 214, 149–160. [Google Scholar] [CrossRef]
  55. Stoeckl, L.; Walther, M.; Morgan, L.K. Physical and Numerical Modelling of Post-Pumping Seawater Intrusion. Geofluids 2019, 2019, 7191370. [Google Scholar] [CrossRef]
  56. Abdoulhalik, A.; Abdelgawad, A.M.; Ahmed, A.A. Impact of layered heterogeneity on transient saltwater upconing in coastal aquifers. J. Hydrol. 2020, 581, 124393. [Google Scholar] [CrossRef]
  57. Bear, J. Dynamics of Fluids in Porous Media; Elsevier: New York, NY, USA, 1972. [Google Scholar]
  58. Robinson, G.; Hamill, G.A.; Ahmed, A.A. Automated image analysis for experimental investigations of salt water intrusion in coastal aquifers. J. Hydrol. 2015, 530, 350–360. [Google Scholar] [CrossRef] [Green Version]
  59. Attanayake, P.; Sholley, M. Evaluation of the hydraulic gradient at an island for low-level nuclear waste disposal. In Proceedings of the Symposium HS1001 at IUGG2007, Perugia, Italy, 2–13 July 2007. [Google Scholar]
  60. Ferguson, G.; Gleeson, T. Vulnerability of coastal aquifers to groundwater use and climate change. Nat. Clim. Chang. 2012, 2, 342–345. [Google Scholar] [CrossRef]
  61. Etsias, G.; Hamill, G.; Benner, E.; Aguila, J.F.; McDonnell, M.; Flynn, R. The effect of colour depth and image resolution on laboratory scale study of aquifer saltwater intrusion. In Proceedings of the Civil Engineering Research Irealand 2020, Cork Institute of Technology, Cork, Ireland, 27–28 August 2020; pp. 577–581. [Google Scholar]
  62. Etsias, G.; Hamill, G.A.; Benner, E.M.; Águila, J.F.; McDonnell, M.C.; Flynn, R.; Ahmed, A.A. Optimizing Laboratory Investigations of Saline Intrusion by Incorporating Machine Learning Techniques. Water 2020, 12, 2996. [Google Scholar] [CrossRef]
  63. Voss, C.; Provost, A. SUTRA—A Model for Saturated–Unsaturated, Variabledensity Ground-Water Flow with Solute or Energy Transport; Water-Resources Investigations Report; US Geological Survey: Reston, VA, USA, 2010. [Google Scholar]
  64. Voss, C.; Souza, W.R. Variable density flow and solute transport simulation of regional aquifers containing a narrow freshwater-saltwater transition zone. Water Resour. Res. 1987, 23, 1851–1866. [Google Scholar] [CrossRef]
  65. Abarca, E.; Clement, T.P. A novel approach for characterizing the mixing zone of a saltwater wedge. Geophys. Res. Lett. 2009, 36. [Google Scholar] [CrossRef] [Green Version]
  66. van Genuchten, M.T. A Closed-form Equation for Predicting the Hydraulic Conductivity of Unsaturated Soils. Soil Sci. Soc. Am. J. 1980, 44, 892–898. [Google Scholar] [CrossRef] [Green Version]
  67. Benson, C.H.; Chiang, I.; Chalermyanont, T.; Sawangsuriya, A. Estimating van Genuchten Parameters α and n for Clean Sands from Particle Size Distribution Data. In Soil Behavior Fundamentals to Innovations in Geotechnical Engineering; ASCE: Atlanta, GA, USA, 2014. [Google Scholar] [CrossRef]
  68. Sweijen, T.; Aslannejad, H.; Hassanizadeh, S.M. Capillary pressure–saturation relationships for porous granular materials: Pore morphology method vs. pore unit assembly method. Adv. Water Resour. 2017, 107, 22–31. [Google Scholar] [CrossRef]
  69. Post, V.; Kooi, H.; Simmons, C. Using hydraulic head measurements in variable-density ground water flow analyses. Ground Water 2007, 45, 664–671. [Google Scholar] [CrossRef] [PubMed]
  70. Chang, S.W.; Clement, T.P. Experimental and numerical investigation of saltwater intrusion dynamics in flux-controlled groundwater systems. Water Resour. Res. 2012, 48. [Google Scholar] [CrossRef]
  71. Lu, C.; Chen, Y.; Zhang, C.; Luo, J. Steady-state freshwater–seawater mixing zone in stratified coastal aquifers. J. Hydrol. 2013, 505, 24–34. [Google Scholar] [CrossRef]
  72. Shi, W.; Lu, C.; Ye, Y.; Wu, J.; Li, L.; Luo, J. Assessment of the impact of sea-level rise on steady-state seawater intrusion in a layered coastal aquifer. J. Hydrol. 2018, 563, 851–862. [Google Scholar] [CrossRef]
Figure 1. (a) Three-dimensional representation of the sandbox setup and photos of its (b) adjustable overflow outlet and (c) ultrasonic sensor components [48].
Water 13 03331 g001
Figure 2. Photos of the pumping-induced laboratory saline intrusion (left) alongside experimental (middle) and numerical (right) saltwater concentration fields in the (a) fractured-right, (b) fractured-center and (c) fractured-left synthetic aquifers.
Water 13 03331 g002
Figure 3. Flow velocity vector fields, generated during the initial pre-pumping experimental phase and for the various abstraction rates applied in the fractured-right (c,d), fractured-center (eg) and fractured-left (hk) laboratory aquifers and in a benchmark homogeneous case (a,b) with the same porous medium characteristics.
Water 13 03331 g003
Figure 4. Transient experimental and numerical values of the saline volume fraction in the fractured-right aquifer, under an abstraction rate of 0.5 ml/sec (left) and during the saltwater retreat phase (right).
Water 13 03331 g004
Figure 5. Transient experimental and numerical values of the saline volume fraction in the fractured-center aquifer, under an abstraction rate of 0.5 ml/sec (top left) and 0.8 ml/sec (top right) as well as during the final saltwater retreat phase (bottom).
Water 13 03331 g005
Figure 6. Transient experimental and numerical values of the saline volume fraction in the fractured-left aquifer, under an abstraction rate of 0.5 ml/sec (top left), 0.8 ml/sec (top right) and 1.1 ml/sec (bottom left) as well as during the final saltwater retreat phase (bottom right).
Water 13 03331 g006
Figure 7. Experimental saline concentration fields generated during the saltwater retreat phase in the fractured-left, the fractured-center and the fractured-right synthetic aquifers.
Water 13 03331 g007
Figure 8. Transient experimental values of mixed concentration volume fraction (saltwater concentration between 25% and 75%) obtained for the three laboratory aquifers during the saltwater retreat phase. Critical water abstraction, Q = 0.5 ml/sec (red), Q = 0.8 ml/sec (blue) and Q = 1.1 ml/sec (black), was terminated at t = 0 s.
Water 13 03331 g008
Figure 9. Simulated (a) critical SW concentration fields alongside their corresponding values of (b) critical abstraction rates, (c) toe length, (d) non-fresh and (e) mixed-concentration volume fractions, demonstrating the impact of fracture position (x) on the saltwater upconing mechanism.
Water 13 03331 g009
Figure 10. Simulated (a) critical SW concentration fields alongside their corresponding values of (b) critical abstraction rates, (c) toe length, (d) non-fresh and (e) mixed-concentration volume fractions, demonstrating the impact of fracture length on the saltwater upconing mechanism.
Water 13 03331 g010
Figure 11. Simulated (a) critical SW concentration fields alongside their corresponding values of (b) critical abstraction rates, (c) toe length, (d) non-fresh and (e) mixed-concentration volume fractions, demonstrating the impact of well depth on the saltwater upconing mechanism.
Water 13 03331 g011
Figure 12. Simulated (a) critical SW concentration fields alongside their corresponding values of (b) critical abstraction rates, (c) toe length, (d) non-fresh and (e) mixed-concentration volume fractions, demonstrating the impact of the fracture permeability on the saltwater upconing mechanism.
Water 13 03331 g012
Figure 13. Simulated (a) critical SW concentration fields alongside their corresponding values of (b) critical abstraction rates, (c) toe length, (d) non-fresh and (e) mixed-concentration volume fractions, demonstrating the impact of the porous medium permeability on the saltwater upconing mechanism.
Water 13 03331 g013
Table 1. Numerical model parameters.
Input ParametersValues
Domain length (m)0.38
Domain height (m)0.15
Element size (m)1.22 × 10⁻³
Longitudinal dispersivity (m)10−3
Transverse dispersivity (m)3.75 × 10⁻⁵
Porous medium
Permeability (m2)1.83 × 10⁻⁹
Porosity0.385
Fracture
Permeability (m2)4.575 × 10⁻⁸
Porosity1
Van Genuchten parameters
α (1/Pa)8.45 × 10−4
n4.5
Freshwater density (kg/m3)1000
Saltwater density (kg/m3)1025
Freshwater head (m)0.134
Saltwater head (m)0.128
Time step (sec)1
Stress period (min)50
Abstraction rate (ml/sec)0.5–1.1
Table 2. Salinity values of water pumped from the three fractured synthetic aquifers, measured with a YSI Professional Plus Instrument (Pro Plus) water quality meter, expressed in parts per thousand (ppt), and as a fraction of the seawater concentration (SW conc), determining if well salinization (Crit. abstraction) occurred.
AquiferAbstraction Rate (ml/sec)Salinity (ppt)SW Conc (%)Crit. Abstraction
fractured-right0.52.637.5yes
fractured-center0.84.4512.7yes
fractured-left0.80.210.6no
fractured-left1.11.474.2yes
reference salinitypure saltwater35.0100-
Table 3. Experimental quasi-steady values of TL, saline volume fraction and mixed concentration volume fraction, for the various abstraction rates applied in the three synthetic fractured aquifers.
AquiferAbstraction Rate (ml/sec)TL (cm)Saline Vol. (%)Mixed Conc. Vol. (%)
fractured-right016.115.72.28
fractured-right0.520.438.03.63
fractured-center07.75.01.23
fractured-center0.523.028.27.60
fractured-center0.822.144.35.75
fractured-left05.93.51.82
fractured-left0.512.613.13.74
fractured-left0.815.930.19.15
fractured-left1.116.137.14.74
Table 4. SWI intrusion characteristics generated by critical abstraction in numerical aquifers having the same permeability contrast between their discontinuity and the surrounding homogeneous porous medium.
ScenarioAquiferk.fract/k.porousTL (cm)Non-Fresh Vol (%)Mixed Conc. Vol (%)
5i522.1238.733.19
6v522.2038.753.10
5ii2.522.8740.553.60
6vi2.522.9040.493.81
Publisher’s Note: MDPI stays neutral with regard to jurisdictional claims in published maps and institutional affiliations.

