Article

Rice Straw as a Natural Sorbent in a Filter System as an Approach to Bioremediate Diesel Pollution

by
Siti Hajar Taufik
1,
Siti Aqlima Ahmad
1,2,
Nur Nadhirah Zakaria
1,
Noor Azmi Shaharuddin
1,3,
Alyza Azzura Azmi
4,
Farah Eryssa Khalid
1,
Faradina Merican
5,
Peter Convey
6,7,
Azham Zulkharnain
8 and
Khalilah Abdul Khalil
9,*
1
Department of Biochemistry, Faculty of Biotechnology and Biomolecular Sciences, Universiti Putra Malaysia, Serdang 43400, Malaysia
2
Laboratory of Bioresource Management, Institute of Tropical Forestry and Forest Products (INTROP), Universiti Putra Malaysia UPM, Serdang 43400, Malaysia
3
Institute of Plantation Studies, Universiti Putra Malaysia, Serdang 43400, Malaysia
4
Faculty of Science and Marine Environment, Universiti Malaysia Terengganu, Kuala Nerus, Terengganu 21030, Malaysia
5
School of Biological Sciences, Universiti Sains Malaysia, Pulau Pinang 11800, Malaysia
6
British Antarctic Survey, NERC, High Cross, Madingley Road, Cambridge CB3 0ET, UK
7
Department of Zoology, University of Johannesburg, P.O. Box 524, Auckland Park 2006, South Africa
8
Department of Bioscience and Engineering, Shibaura Institute of Technology, Saitama-shi 337-8570, Japan
9
School of Biology, Faculty of Applied Sciences, Universiti Teknologi MARA, Shah Alam 40450, Malaysia
*
Author to whom correspondence should be addressed.
Water 2021, 13(23), 3317; https://doi.org/10.3390/w13233317
Submission received: 9 October 2021 / Revised: 6 November 2021 / Accepted: 8 November 2021 / Published: 23 November 2021
(This article belongs to the Special Issue Plant- and Microbial-Based Novel Biosorbents)

Abstract

:
Rice straw, an agricultural waste product generated in huge quantities worldwide, is utilized to remediate diesel pollution as it possesses excellent characteristics as a natural sorbent. This study aimed to optimize factors that significantly influence the sorption capacity and the efficiency of oil absorption from diesel-polluted seawater by rice straw (RS). Spectroscopic analysis by attenuated total reflectance infrared (ATR-IR) spectroscopy and surface morphology characterization by variable pressure scanning electron microscopy (VPSEM) and energy-dispersive X-ray microanalysis (EDX) were carried out in order to understand the sorbent capability. Optimization of the factors of temperature pre-treatment of RS (90, 100, 110, 120, 130 or 140 °C), time of heating (10, 20, 30, 40, 50, 60 or 70 min), packing density (0.08, 0.10, 0.12, 0.14 or 0.16 g cm−3) and oil concentration (5, 10, 15, 20 or 25% (v/v)) was carried out using the conventional one-factor-at-a-time (OFAT) approach. To eliminate any non-significant factors, a Plackett–Burman design (PBD) in the response surface methodology (RSM) was used. A central composite design (CCD) was used to identify the presence of significant interactions between factors. The quadratic model produced provided a very good fit to the data (R2 = 0.9652). The optimized conditions generated from the CCD were 120 °C, 10 min, 0.148 g cm−3 and 25% (v/v), and these conditions enhanced oil sorption capacity from 19.6 (OFAT) to 26 mL of diesel oil, a finding verified experimentally. This study provides an improved understanding of the use of a natural sorbent as an approach to remediate diesel pollution.

1. Introduction

Sorbents are either adsorbent or absorbent materials. Their purpose is to bind target substances, such as liquid oil, in a solid or semisolid matrix. Sorbents are often used to eliminate the last vestiges of oil pollution that have leaked into wetlands or along coastlines. Generally, sorbents can be classified as natural or synthetic materials. Despite being fully commercialized, synthetic sorbents are mostly made from polypropylene fibers that are not environmentally friendly and often lead to secondary contamination [1]. Natural organic materials such as moss, straw, sawdust, coco peat, cogon grass, cotton and hay can be used as sorbents [2,3,4,5]. A novel natural oil sorbent, nonwoven cotton batting, was reported both to have a much better oil sorption capacity than synthetic products, and to be environmentally sustainable and simple to employ in practical applications [1]. The high levels of generation of agricultural wastes strengthen the relevance of using natural sorbents to remediate contaminated sites, particularly in the case of diesel contamination.
Rice (Oryza sativa) is a staple food across Asia. It is vital to the Malaysian diet, with 70% of the national demand being produced nationally, especially in Kedah [6,7]. In South-East Asia, rice is the most significant crop [8]. Rice production has rapidly increased over time, also resulting in increased generation of non-edible ‘waste’ biomass [5]. After harvesting, mature rice grain is separated from the non-grain material, known as rice straw (RS), which remains as an agricultural residue. RS is chemically composed of lignin (22%), cellulose (38%), hemicellulose (35%) and some nutrients (5%) and serves as an excellent natural sorbent [9,10]. RS is commonly used in animal feed and also in improving soil fertility. Given the scale of its production and its low cost, investigation of its utilization as a natural diesel adsorbent is appropriate and timely.
Previous studies have reported excellent performance by several elements of rice waste, such as husks and RS, in remediating pollutants including heavy metals, dyes and phenolic compounds [11,12,13]. Due to their low cost and efficiency and the minimal production of by-products that may cause further pollution, natural sorbent materials are considered to be an effective and ideal technology [14,15]. However, studies of oil spill remediation using RS remain scarce. Before ex situ remediation, treatment of RS is essential to minimize the risk of non-native species introduction. Physical pre-treatment, often known as heat treatment, uses a range of temperatures depending on the material being treated. A number of studies have proposed that RS can be physically pre-treated to improve sorption capacity [10,16,17,18].
The current study focused on the use of RS as a natural sorbent to remediate diesel-polluted seawater in a designed filter system, optimizing the conditions of its use through the conventional one-factor-at-a-time (OFAT) approach followed by the response surface methodology (RSM). The surface morphology of RS was characterized using scanning electron microscopy (SEM), while spectroscopic analysis was carried out using attenuated total reflectance infrared (ATR-IR) spectroscopy to clarify elements of chemical composition.

2. Materials and Methods

2.1. Materials

2.1.1. Sample Preparation

Rice straw (RS) was purchased from Kampung Agong, Penaga, Pulau Pinang, Malaysia (5.5407° N, 100.3801° E). RS is harvested annually in July or August. The RS was cut to approximately 4–5 cm in length from the base throughout the length of the stalk. It was washed twice thoroughly with tap water to remove debris and sun dried for 7 d (minimum 5 h per day) until it reached a constant mass. Diesel (PETRONAS Dynamic Diesel) was purchased from a petrol station in Serdang, Selangor, while 70 L seawater was retrieved from Port Klang and stored at room conditions (25 °C ± 2 °C) until use. Generally, seawater is composed of water (H2O), carbon dioxide (CO2), potassium (K), magnesium (Mg) and silica (Si) [19]. A wire mesh net (10 cm height × 5 cm diameter) was prepared to form a cylindrical holder to accommodate the prepared RS sample. Finally, 400 mL plastic bottles (25 cm height × 5 cm diameter) were purchased, and an opening cut was created approximately 3 cm from the base to allow placement of the holder within the bottle and allow the diesel–seawater mixture to flow through it.

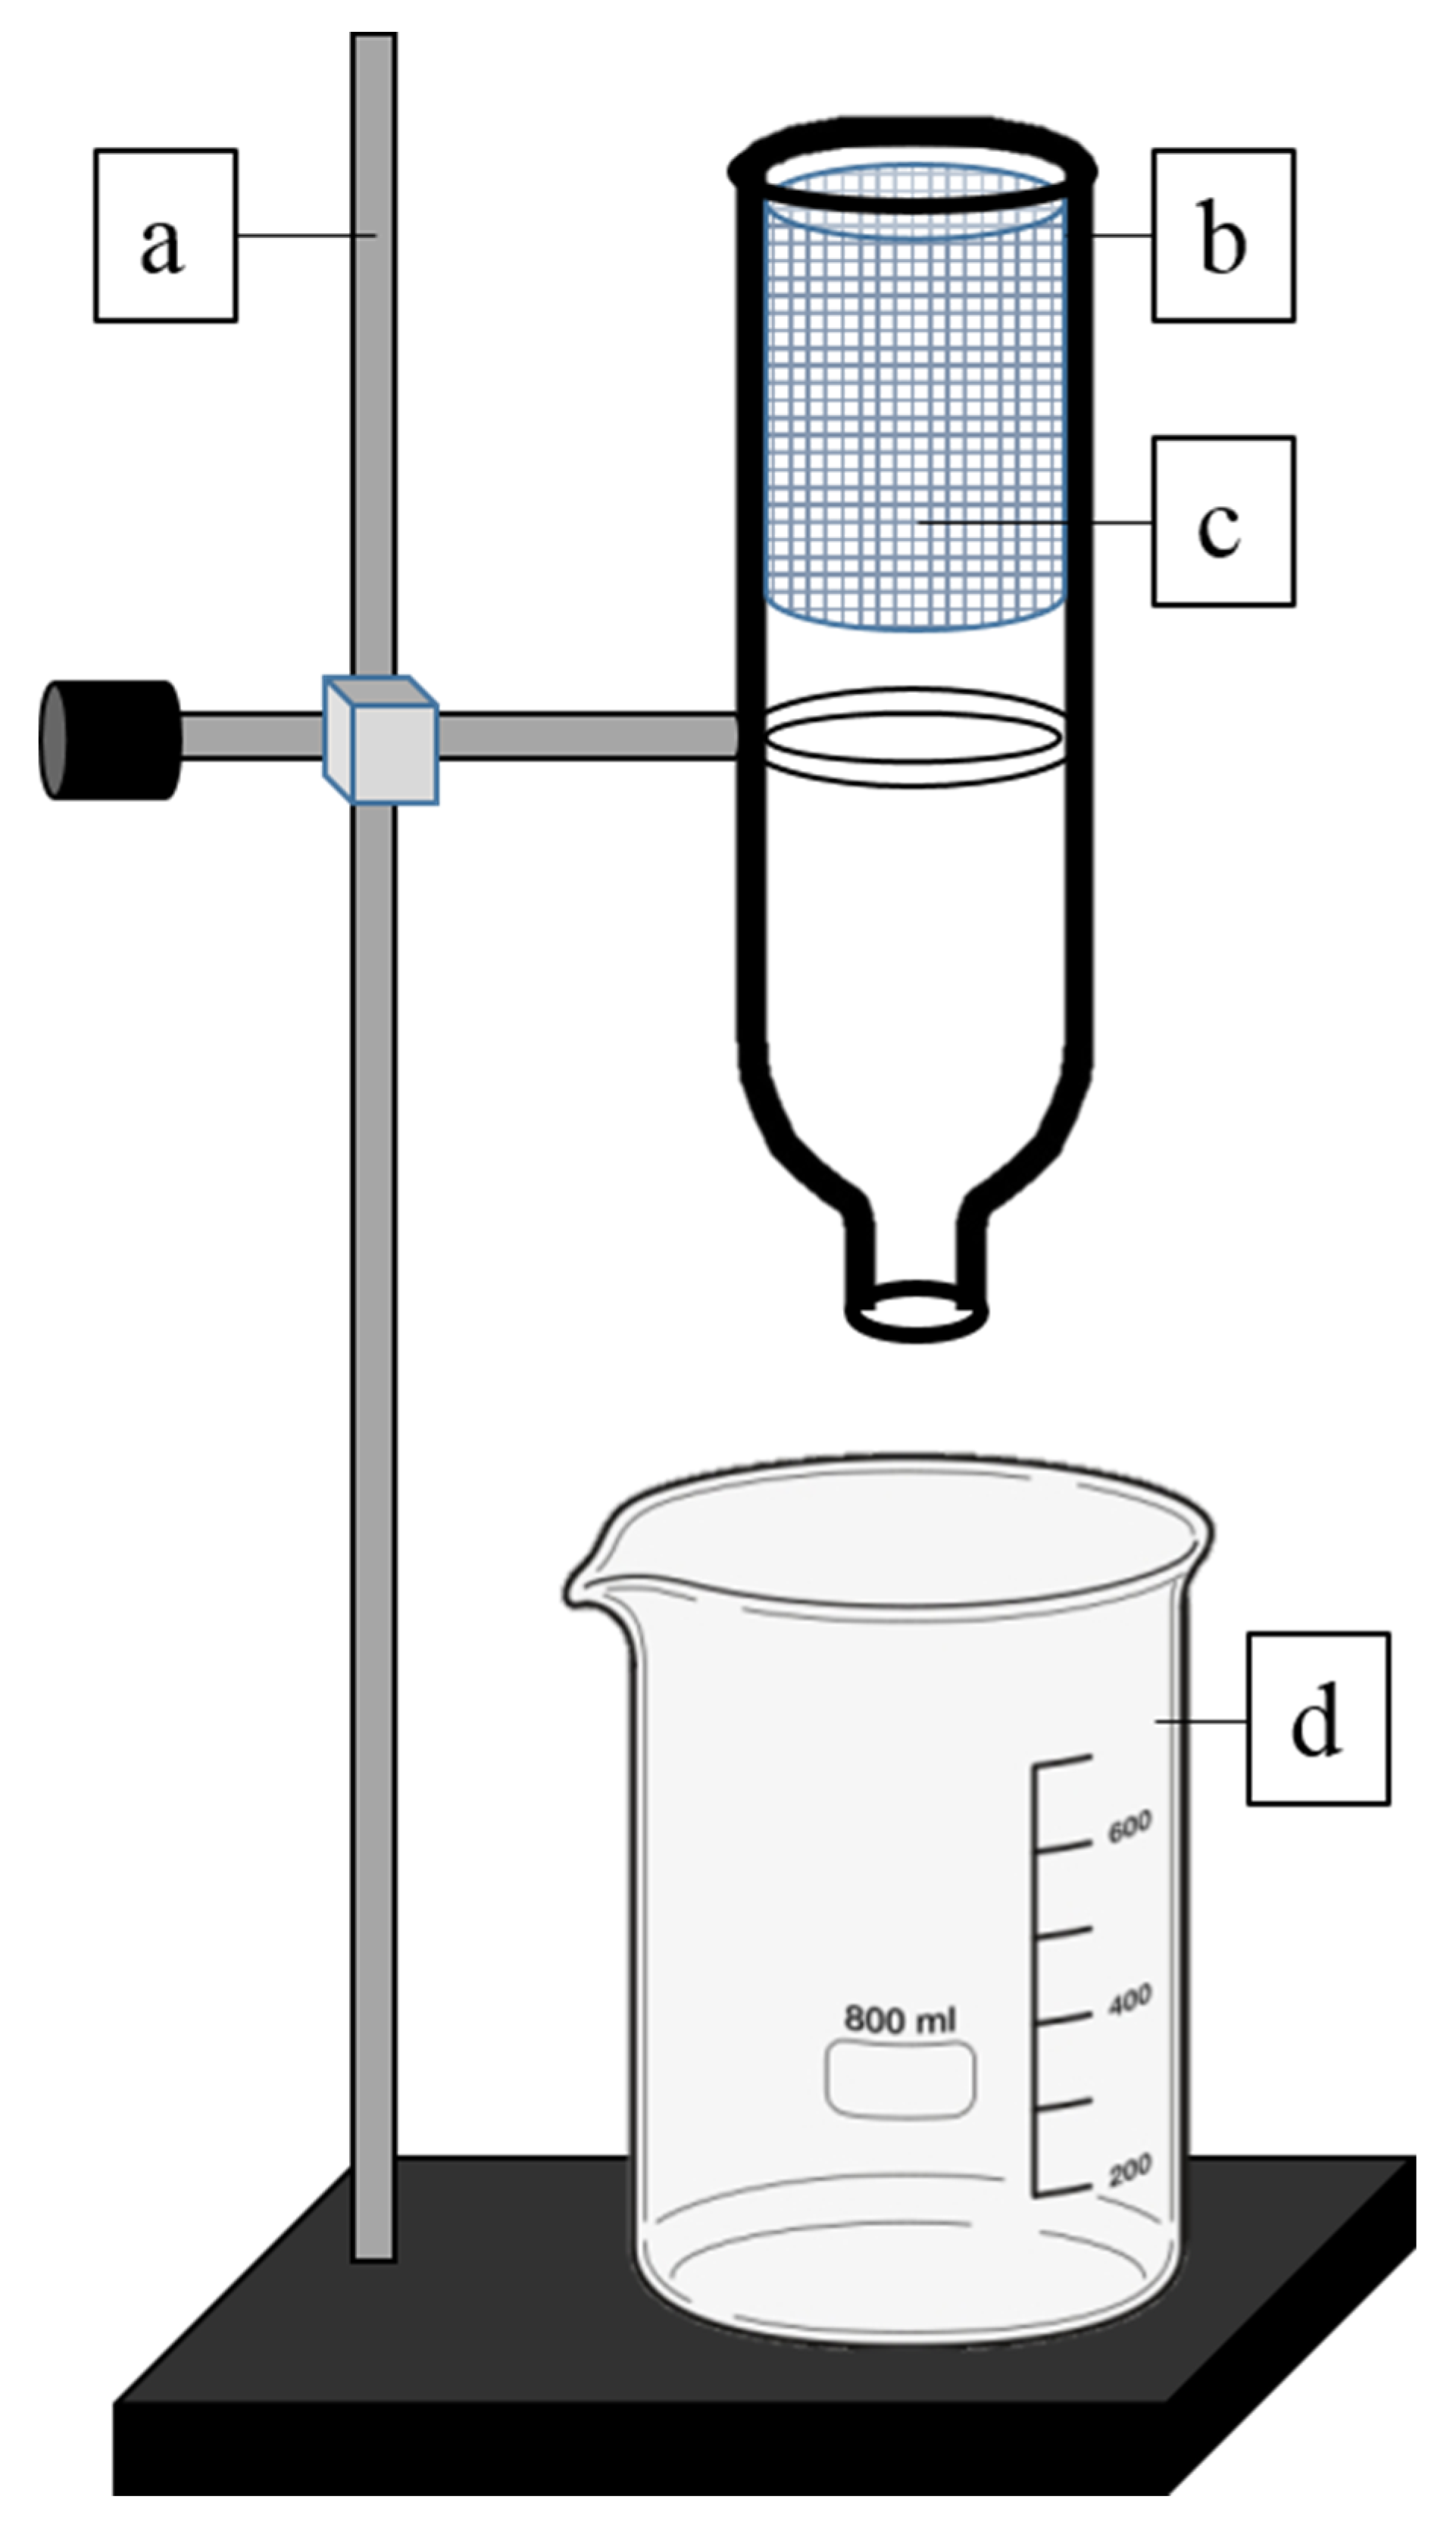
2.1.2. Experimental Setup

The prepared materials were assembled in a filter system (Figure 1). The plastic bottles were clamped inverted to retort stands to allow the diesel–seawater mixture to flow through. The cylinder accommodating the RS was placed inside the hollowed bottle. A measuring cylinder was placed below the bottle to collect the oil/water effluent. Forty milliliters of diesel mixed with 400 mL of seawater was poured into the bottle. This procedure was repeated for each replicate.

2.2. Sorption Capacity and Efficiency Evaluations

Sorption capacity was determined under laboratory conditions (25 °C ± 1 °C), following the method F 726-99 (ASTM, 1998), with slight modifications [20]. The sorption capacity values were calculated as shown in Equation (1).
Oil   sorption   capacity   ( g / g ) = X f X i X i
where X f represents the total mass (g) of the wet sample after immersion, and X i is the mass (g) of the sample before immersion. All experiments were carried out in triplicate, with the mean value and standard error of the mean (SEM) calculated.
The efficiency of diesel absorption (%) was calculated as shown in Equation (2).
Efficiency   of   diesel   absorption   ( % ) = E i E E i
where E i represents the initial concentration (v/v) of diesel oil, and E is the concentration of diesel oil after reaching equilibrium.
Sorption capacity and the efficiency of oil absorption were determined as follows, with all studies carried out in triplicate. Twelve grams of RS sample was placed in the holder, which was then placed in the plastic bottle. The mixture of diesel (40 mL) and seawater (400 mL) was then poured into the bottle. The mass of each RS sample was measured after 10 min contact time. The oil/water effluent was also measured and analyzed using Equation (2). One-way analysis of variance (ANOVA) was used to test the influence of each parameter on sorption capacity and percentage of diesel removal. If there were significant differences, Tukey’s post hoc pairwise tests were carried out.

2.3. Screening of Samples

Approximately 12 g of untreated or treated RS was packed and prepared in each experimental setup. The chosen temperature was the most common temperature when working with fibers based on published studies [21]. The final RS sample mass and amount of effluent (seawater and diesel mixture) were recorded for each trial.

2.4. Attenuated Total Reflectance Infrared (ATR-IR) Spectroscopy

The chemical structures of untreated and pre-treated RS (before and after wetting with the oil–seawater mixture) were analyzed using ATR-IR spectroscopy over a spectral range of 4000–500 cm−1. At each position of the sample on the crystal area, 16 scans were averaged. Each sample was thoroughly dried beforehand using Na2SO4 [22,23,24].

2.5. Surface Morphology Characterization by Scanning Electron Microscopy (SEM)

A variable pressure scanning electron microscope (VPSEM) (Zeiss LEO 1455, Carl Zeiss AG, Oberkochen, Germany) was used to analyze the composition of RS. The RS samples were sputter coated with gold and attached to round stainless-steel sample holders with double-sided conductive adhesive tapes. SEM images were examined using an accelerating voltage of 15 kV [25]. An elemental analysis using an energy-dispersive X-ray microanalyzer (EDX) was carried out following SEM analysis. For EDX analysis, the beam optimization applied cobalt as a standard; thus, all records of Co were discounted from the analysis.

2.6. Ex Situ Experiment via Statistical Optimization

2.6.1. One-Factor-at-a-Time (OFAT)

To determine the sorption capacity of RS and its ability to absorb diesel effectively, various factors were taken into account in OFAT. These included heat pre-treatment (90, 100, 110, 120, 130 or 140 °C), time of heating (10, 20, 30, 40, 50, 60 or 70 min), packing density (0.08, 0.10, 0.12, 0.14 or 0.16 g cm−3) and oil concentration (5, 10, 15, 20, 25 or 30% (v/v)). All factors were assessed individually in triplicate.

2.6.2. Response Surface Methodology (RSM)

Plackett–Burman Design (PBD)

Aligned factors from OFAT were further analyzed using Design-Expert software version 13.0 under the Factorial Miscellaneous Design (standard design) [26], with slight modifications. With a minimum of 11 horizontal factors, 6 center points were chosen. Eighteen runs were provided by the Design-Expert software with randomized points in all factors (in range) to generate two responses: oil absorbed and seawater absorbed (mL) (Table 1). Eighteen randomized runs were therefore carried out in the experimental setup. The responses were analyzed using ANOVA. The PBD follows the first-order model provided by Equation (3) [27].
Y = β 0 + i = 1 k β i x i
where Y represents the response variable, x is the independent factors that influence Y , β0 is the intercept, k is the number of involved factors and βi is the ith linear coefficient.
All the parameters were analyzed using Design-Expert 13.0 (Stat—Ease Inc., San Diego, CA, USA) software at minimum (−1) and maximum (+1) levels [28,29]. The significant parameters identified using the PBD were then further optimized using a central composite design (CCD).

Central Composite Design (CCD)

Aligned factors from the PBD were further analyzed in the Design-Expert software version 13.0 under the Response Surface Central Composite Design (standard design). With three numeric factors, six center points were chosen. Twenty runs were provided from the Design-Expert software with randomized points in all factors (in range) to generate two responses: oil absorbed and seawater absorbed (mL) (Table 2). Twenty randomized runs were therefore run in the experimental setup. The quadratic mathematical model used is shown in Equation (4) [27].
Y = β 0 + i = 1 k β i x i + i = 1 k β i i x i 2 + 1 = i j k β i j x i x j   ,   i j
where Y represents the response variable, χ is the independent factors that influence Y , β0 is the intercept, κ is the number of involved factors, i is the ith linear coefficient, ii is the quadratic coefficient, and ij is the coefficient of the interaction effect when i < j, with i and j = 1, 2, 3 and ij. All experiments were performed in triplicate.
The interactions of the significant parameters on the efficiency of oil–seawater absorption were analyzed to identify the optimum responses. This design was then verified using ANOVA. The selected interactions between the response value and factors were represented in three-dimensional response surface plots [30].

Model Validation

The statistical models were further validated experimentally using the model-predicted optimum values. In all analyses, p < 0.05 was accepted as significant [31].

3. Results and Discussion

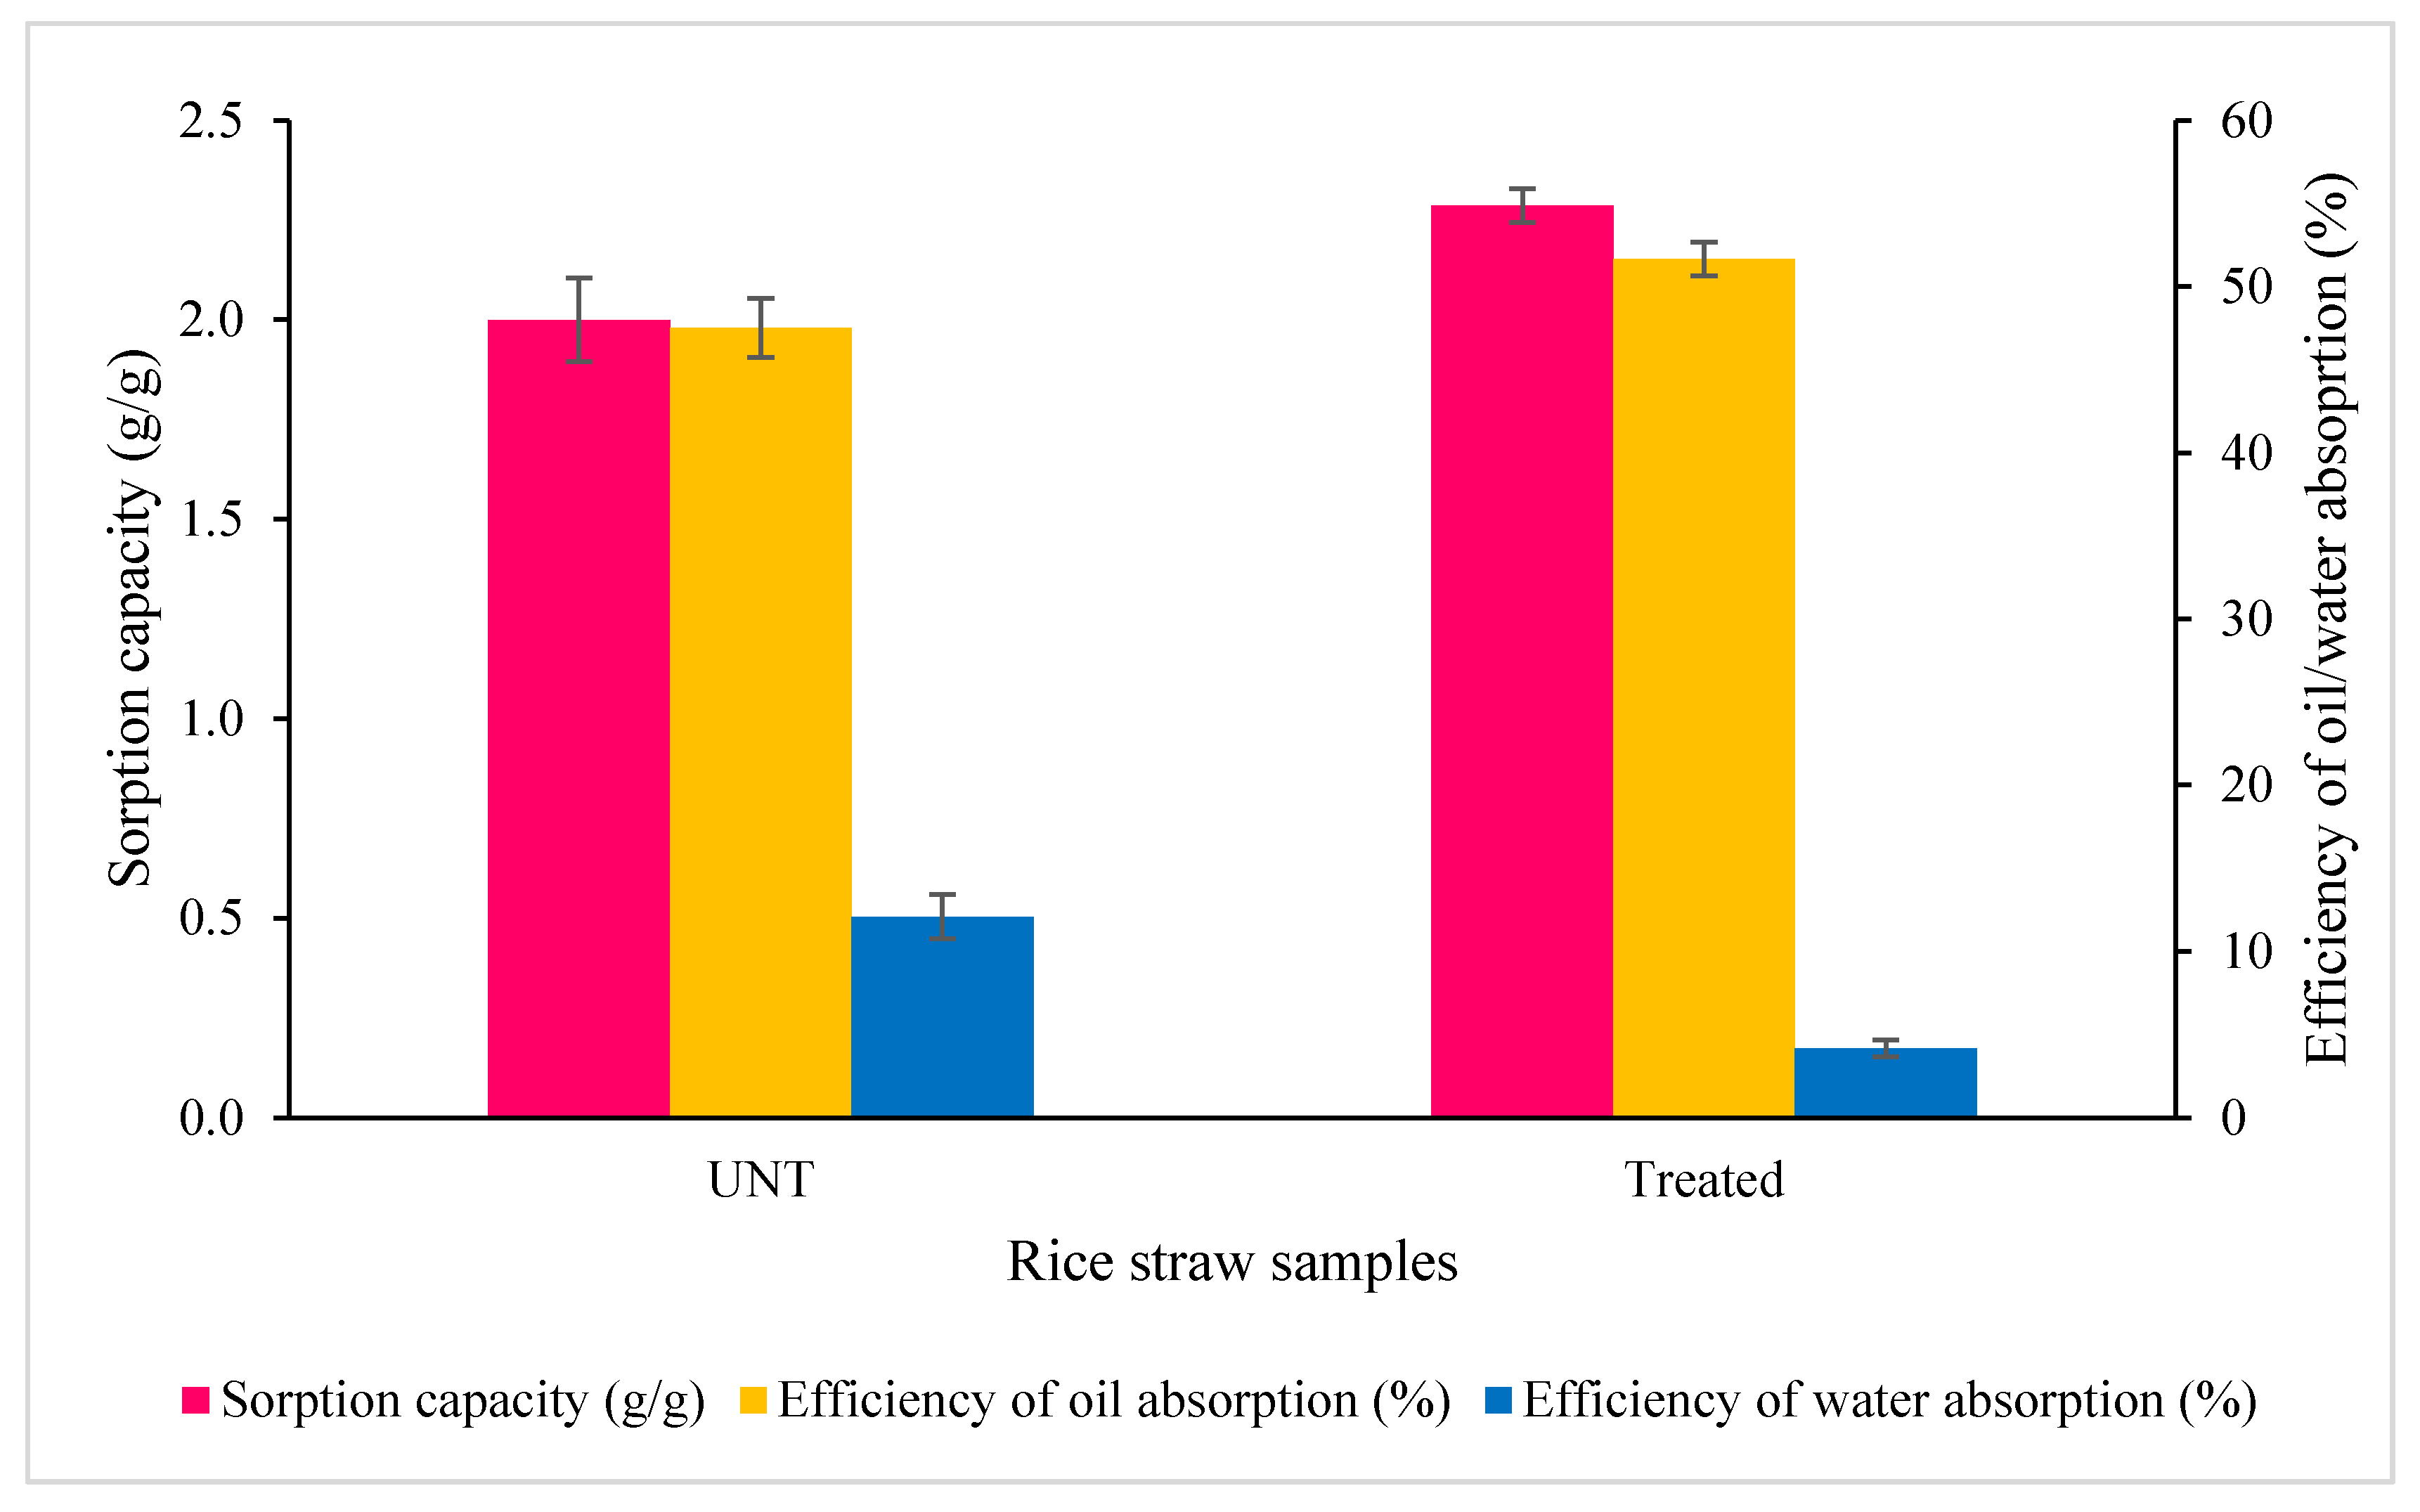
3.1. Screening of Rice Straw Samples

The screening step involved two sets of untreated and pre-treated (120 °C) RS samples (n = 3 in each set). The pre-treated RS samples displayed the highest level of sorption capacity (2.3 g/g ± 0.04) and also the most efficient oil absorption (51.67% ± 1.02) (Figure 2). Pre-treated RS was therefore selected for further study. Water absorption by pre-treated RS was lower (4.17% ± 0.51) than that by untreated RS (12.08% ± 1.35). As lower water absorption is preferable, this further supports the selection of pre-treated RS.
Fiber surface modification can enhance the tensile properties of RS in concrete-like composites by improving fiber–matrix interfacial bonding, hardness, wettability and the hydrophilic nature, and decreasing moisture absorption. Impurities and waxy substances on the surface, on the other hand, can cause poor outer layer wetting and impair fiber–matrix bonding. The waxy layer and associated impurities can be removed by heat treating the RS, thereby enhancing biosorption efficiency [18,32,33].

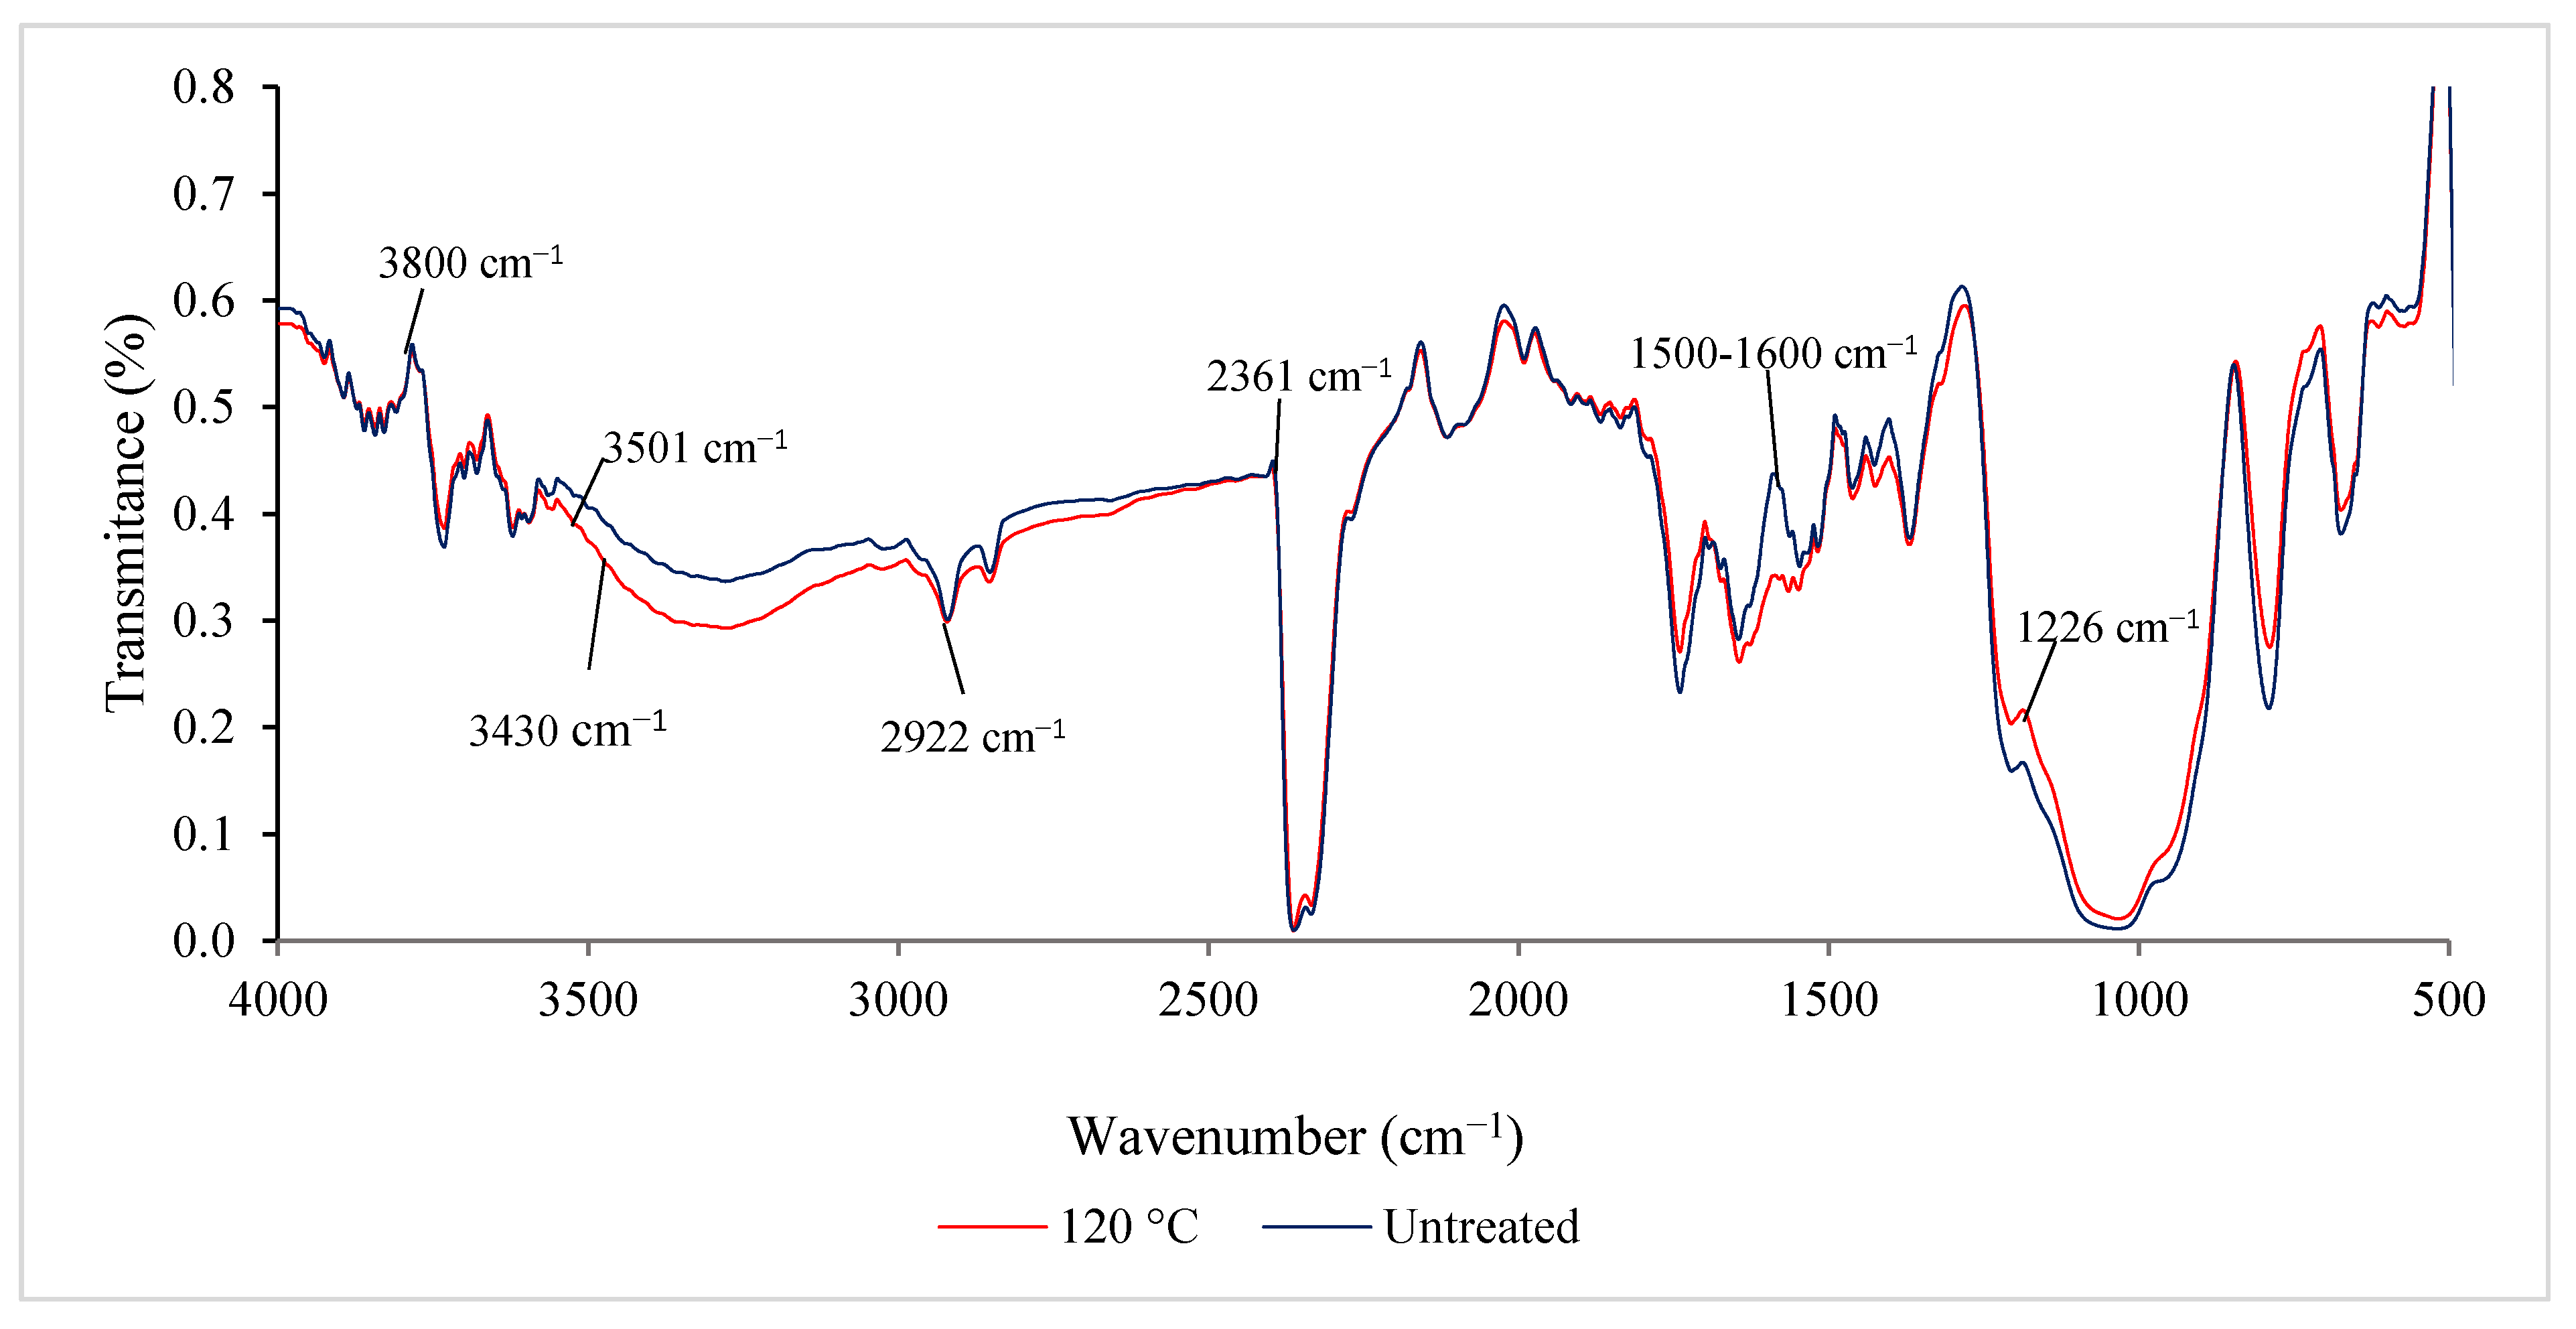
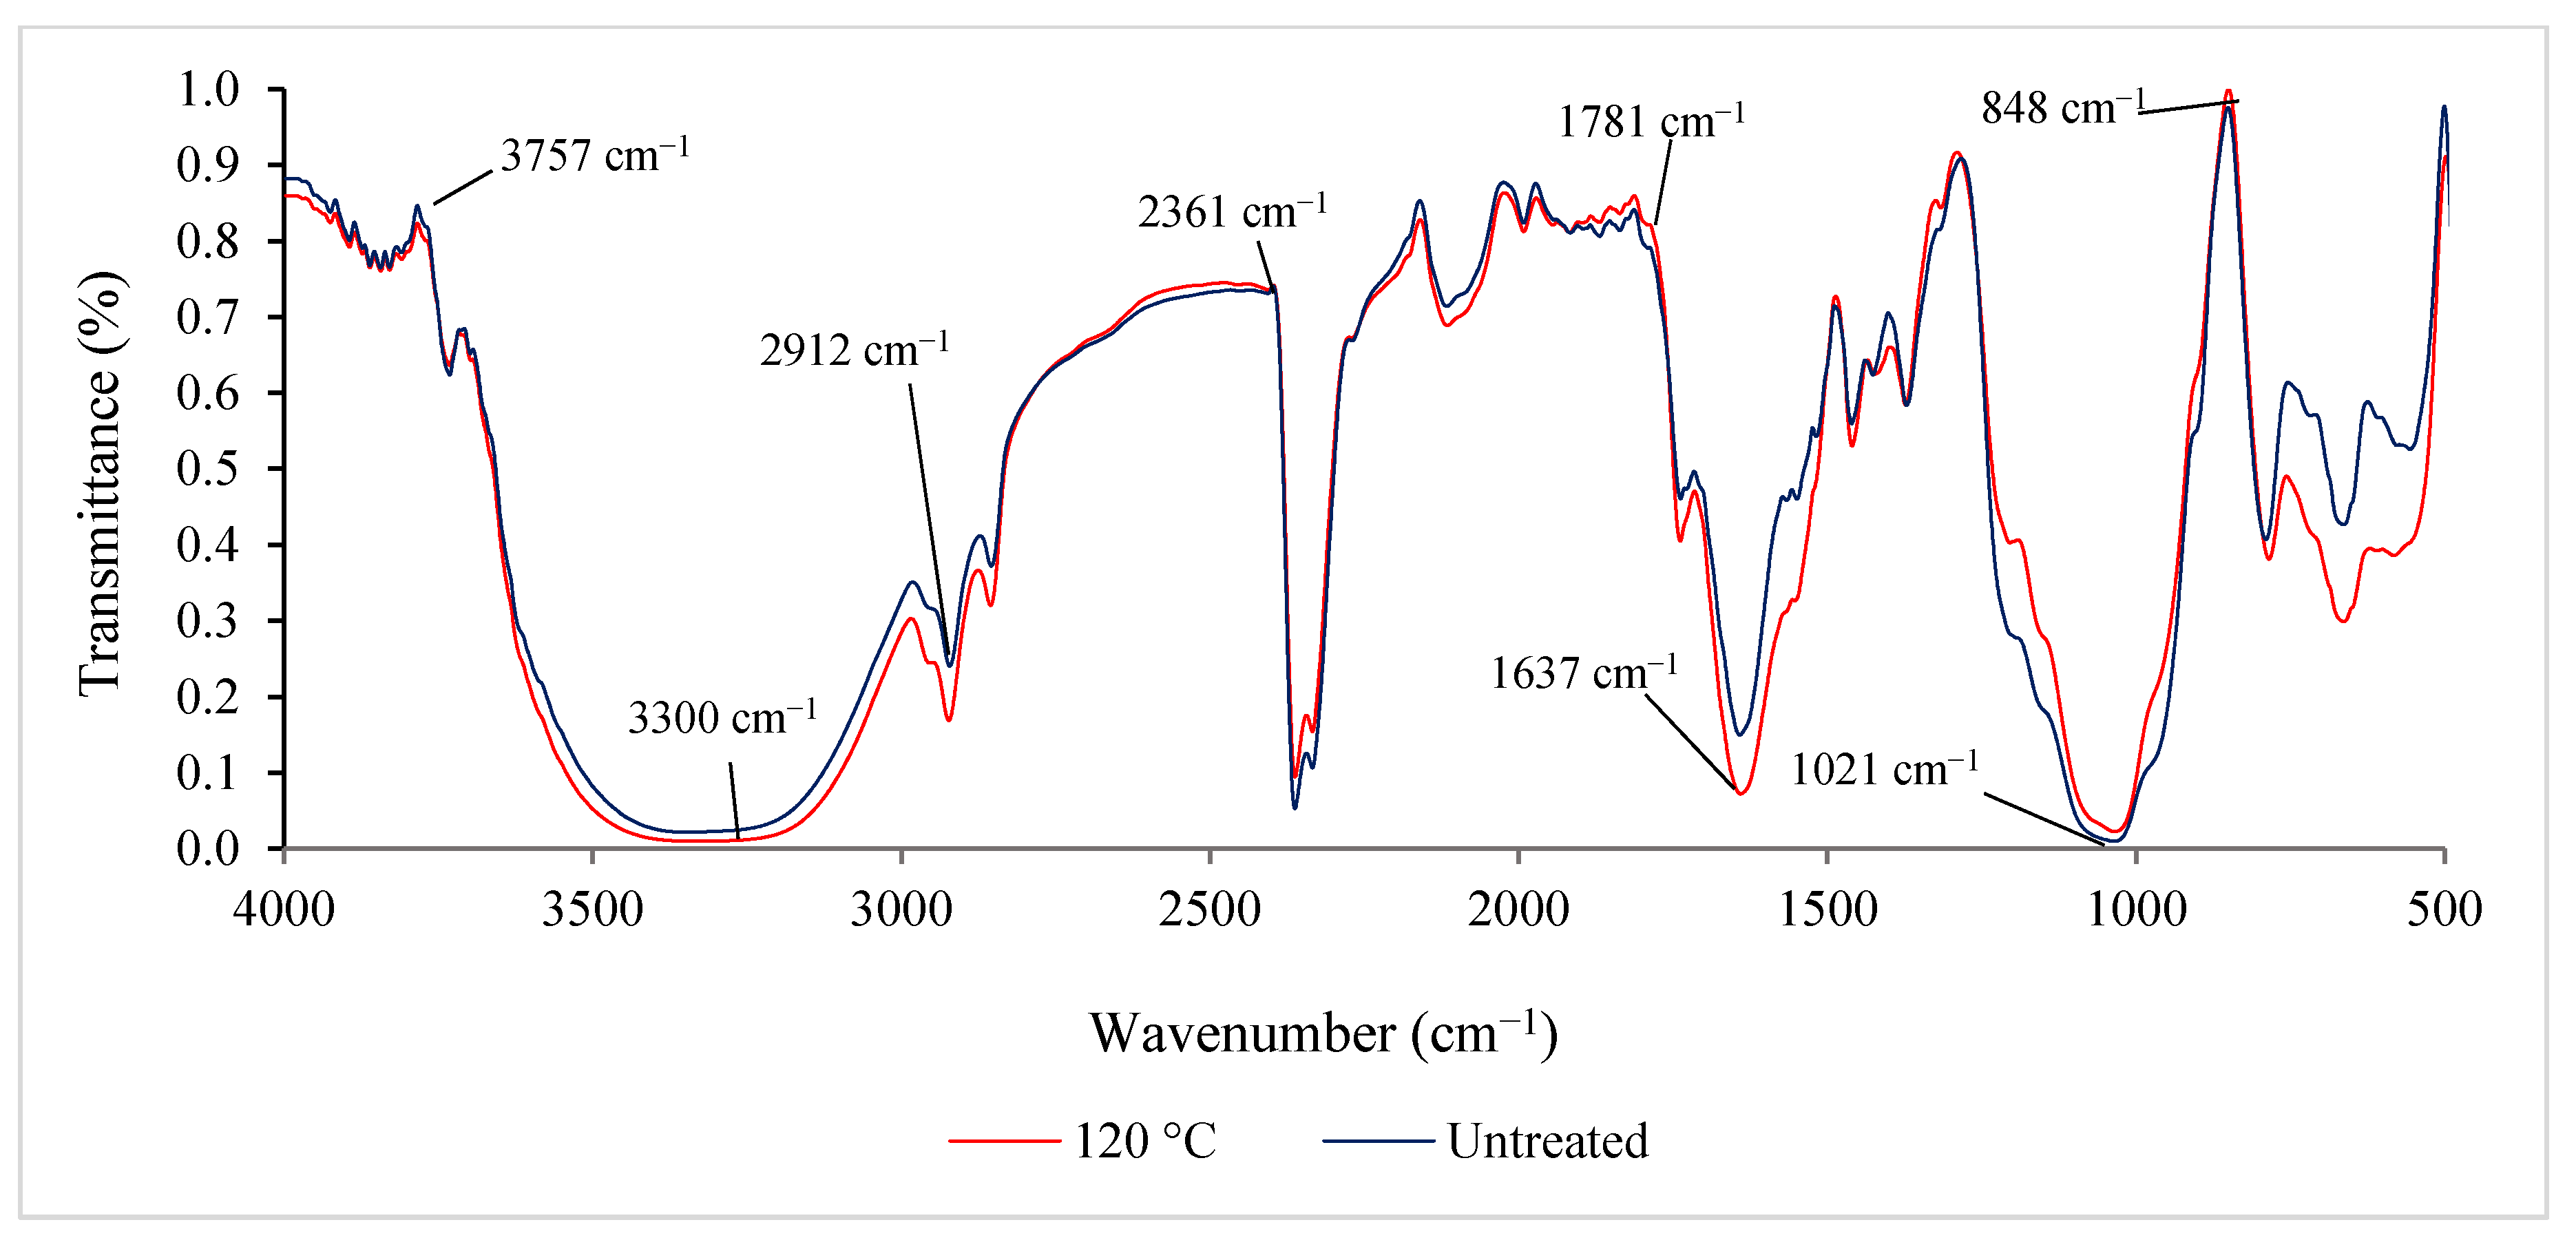
3.2. Spectroscopic Analysis by Attenuated Total Reflectance Transform Infrared (ATR-IR) Spectroscopy

In order to understand the movement of functional groups in the macromolecules present in RS, a non-destructive analysis, ATR-IR, was conducted. Infrared spectroscopy analysis of RS has been used to show that ionizable functional groups such as amino, carboxyl and hydroxyl groups are present and able to interact and chelate with diesel oil [11]. This analysis determines any changes in the vibrational frequency of numerous functional groups before and after wetting with diesel oil [13]. The presence of polar groups on the surface of the adsorbent is likely to give it a high cation exchange capacity [21].
A comparison of IR spectra between untreated and pre-treated RS is presented in Figure 3. The broad peak observed at 3430 cm−1 corresponds to O-H stretching vibration, possibly contributed by the hydroxyl group in cellulose. Fingerprint stretching vibrations at 2922 cm−1 and 2850 cm−1 were consistent with the presence of C-H alkyl groups in the cellulose backbone. The distinct peak at 1721 cm−1 in the untreated RS represents the ester linkage of the carboxylic group of lignin. Peak intensities decreased for pre-treated samples due to the reduction in hemicellulose and lignin contents after being heated to 120 °C. The peaks at 1547 cm−1 and 1458 cm−1 represent C=C stretching of the aromatic ring of lignin, which reduced in intensity after the pre-treatment. The peak in the region of 1260–900 cm−1 corresponds to the C-O deformation band, present in hemicellulose, cellulose or lignin.
Figure 4 presents a comparison of the IR spectra of untreated and pre-treated RS after wetting with oil. All readings obtained were correlated with the presence of diesel oil. Contrasting with the dry RS spectra, the broader peak at 3000 to 3500 cm−1 indicates intense O-H stretching vibration contributed by the hydroxyl group of cellulose. This suggests that cellulose in both samples absorbed the oil/water mixture. At 1500–1600 cm−1, the sharper and deeper slope in the wetted sample indicates the presence of C=C stretching vibration between alkenes and aromatic functional groups which are naphthenes (CH2) in diesel oil [34,35,36]. At 2912 cm−1, the deeper slope in the wetted sample suggests C-H stretching vibration with the presence of alkane groups (CH) or long-chain alkyl groups (CH3) in diesel oil. RS wetted with the oil/water mixture was able to absorb both diesel and water, as shown at 1637 cm−1, with water absorption indicated by the stretching vibration of H-O-H. The stretching of pre-treated RS was slightly greater than that of untreated RS. This indicates that the heat treatment lowers water absorption and fulfils the goal of minimizing water uptake. Major peaks detected in ATR-IR spectroscopic analysis of untreated and pre-treated RS were summarized in Table 3.

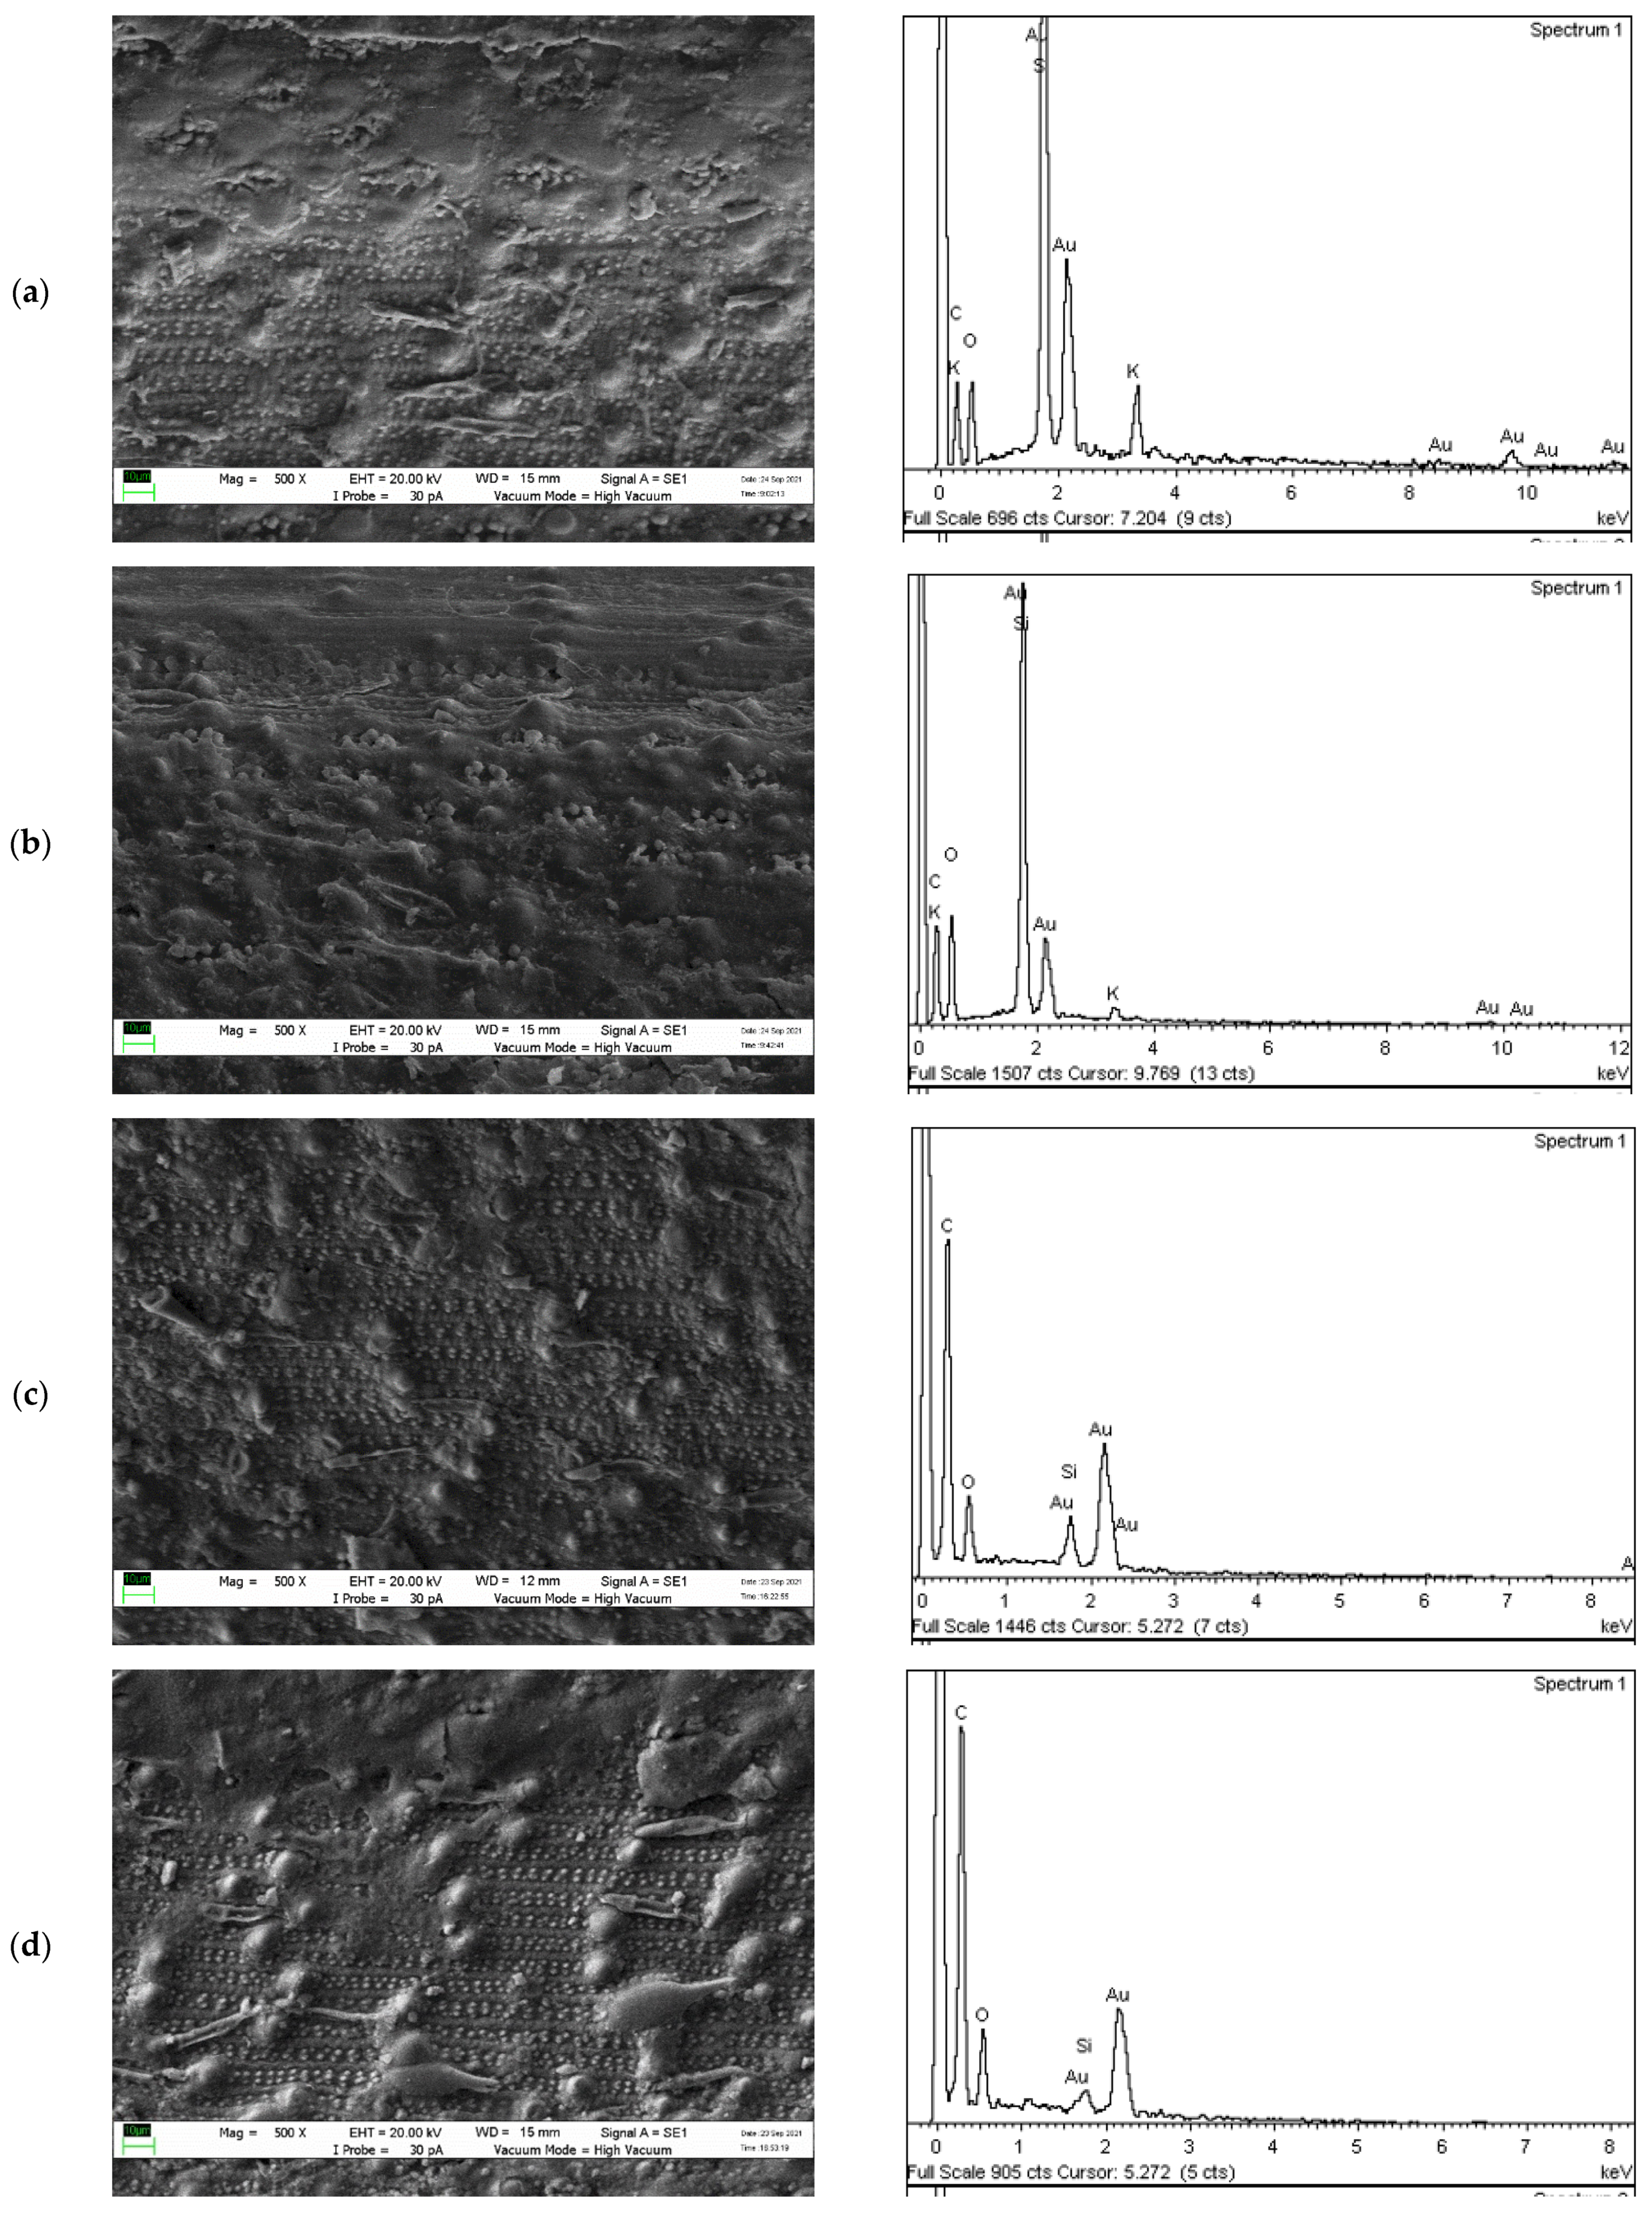
3.3. Surface Morphology Characterization by Scanning Electron Microscopy (SEM)

The detail of the rough surface of RS was clear in the SEM micrographs. The EDX microanalyzer revealed the molecules present on the RS surface. Untreated RS (Figure 5a,b) had more silica grooves than pre-treated RS (Figure 5c,d). Pore spaces were seen abundantly in the treated RS (Figure 5c). The observed features were visible under low magnification (500×).
The major components of RS are hemicellulose, cellulose, lignin, silica and potassium. Exposure to heat accelerates the degradation of both lignin and silica in RS [38]. SEM of the treated rice straw (Figure 5c,d) revealed that the surface structure was loose, a feature facilitating diesel absorption [11].
Heat treatment led to the RS surface becoming roughened with various wrinkles, grains and grooves. Previous studies [22,37,39] have suggested that this roughening increases the available surface area, which is important for absorption [40]. The main elements in cellulose and hemicellulose, oxygen (O) and carbon (C), were more abundant in the EDX analyses, with the pre-treated RS sample having 60% carbon and 22% oxygen, while the untreated RS sample had 29% and 19%, respectively. The minimal presence of potassium (K) in the EDX analysis of untreated RS was due to the dissolved fertilizer during planting and reduced after diesel–seawater filtration [41].

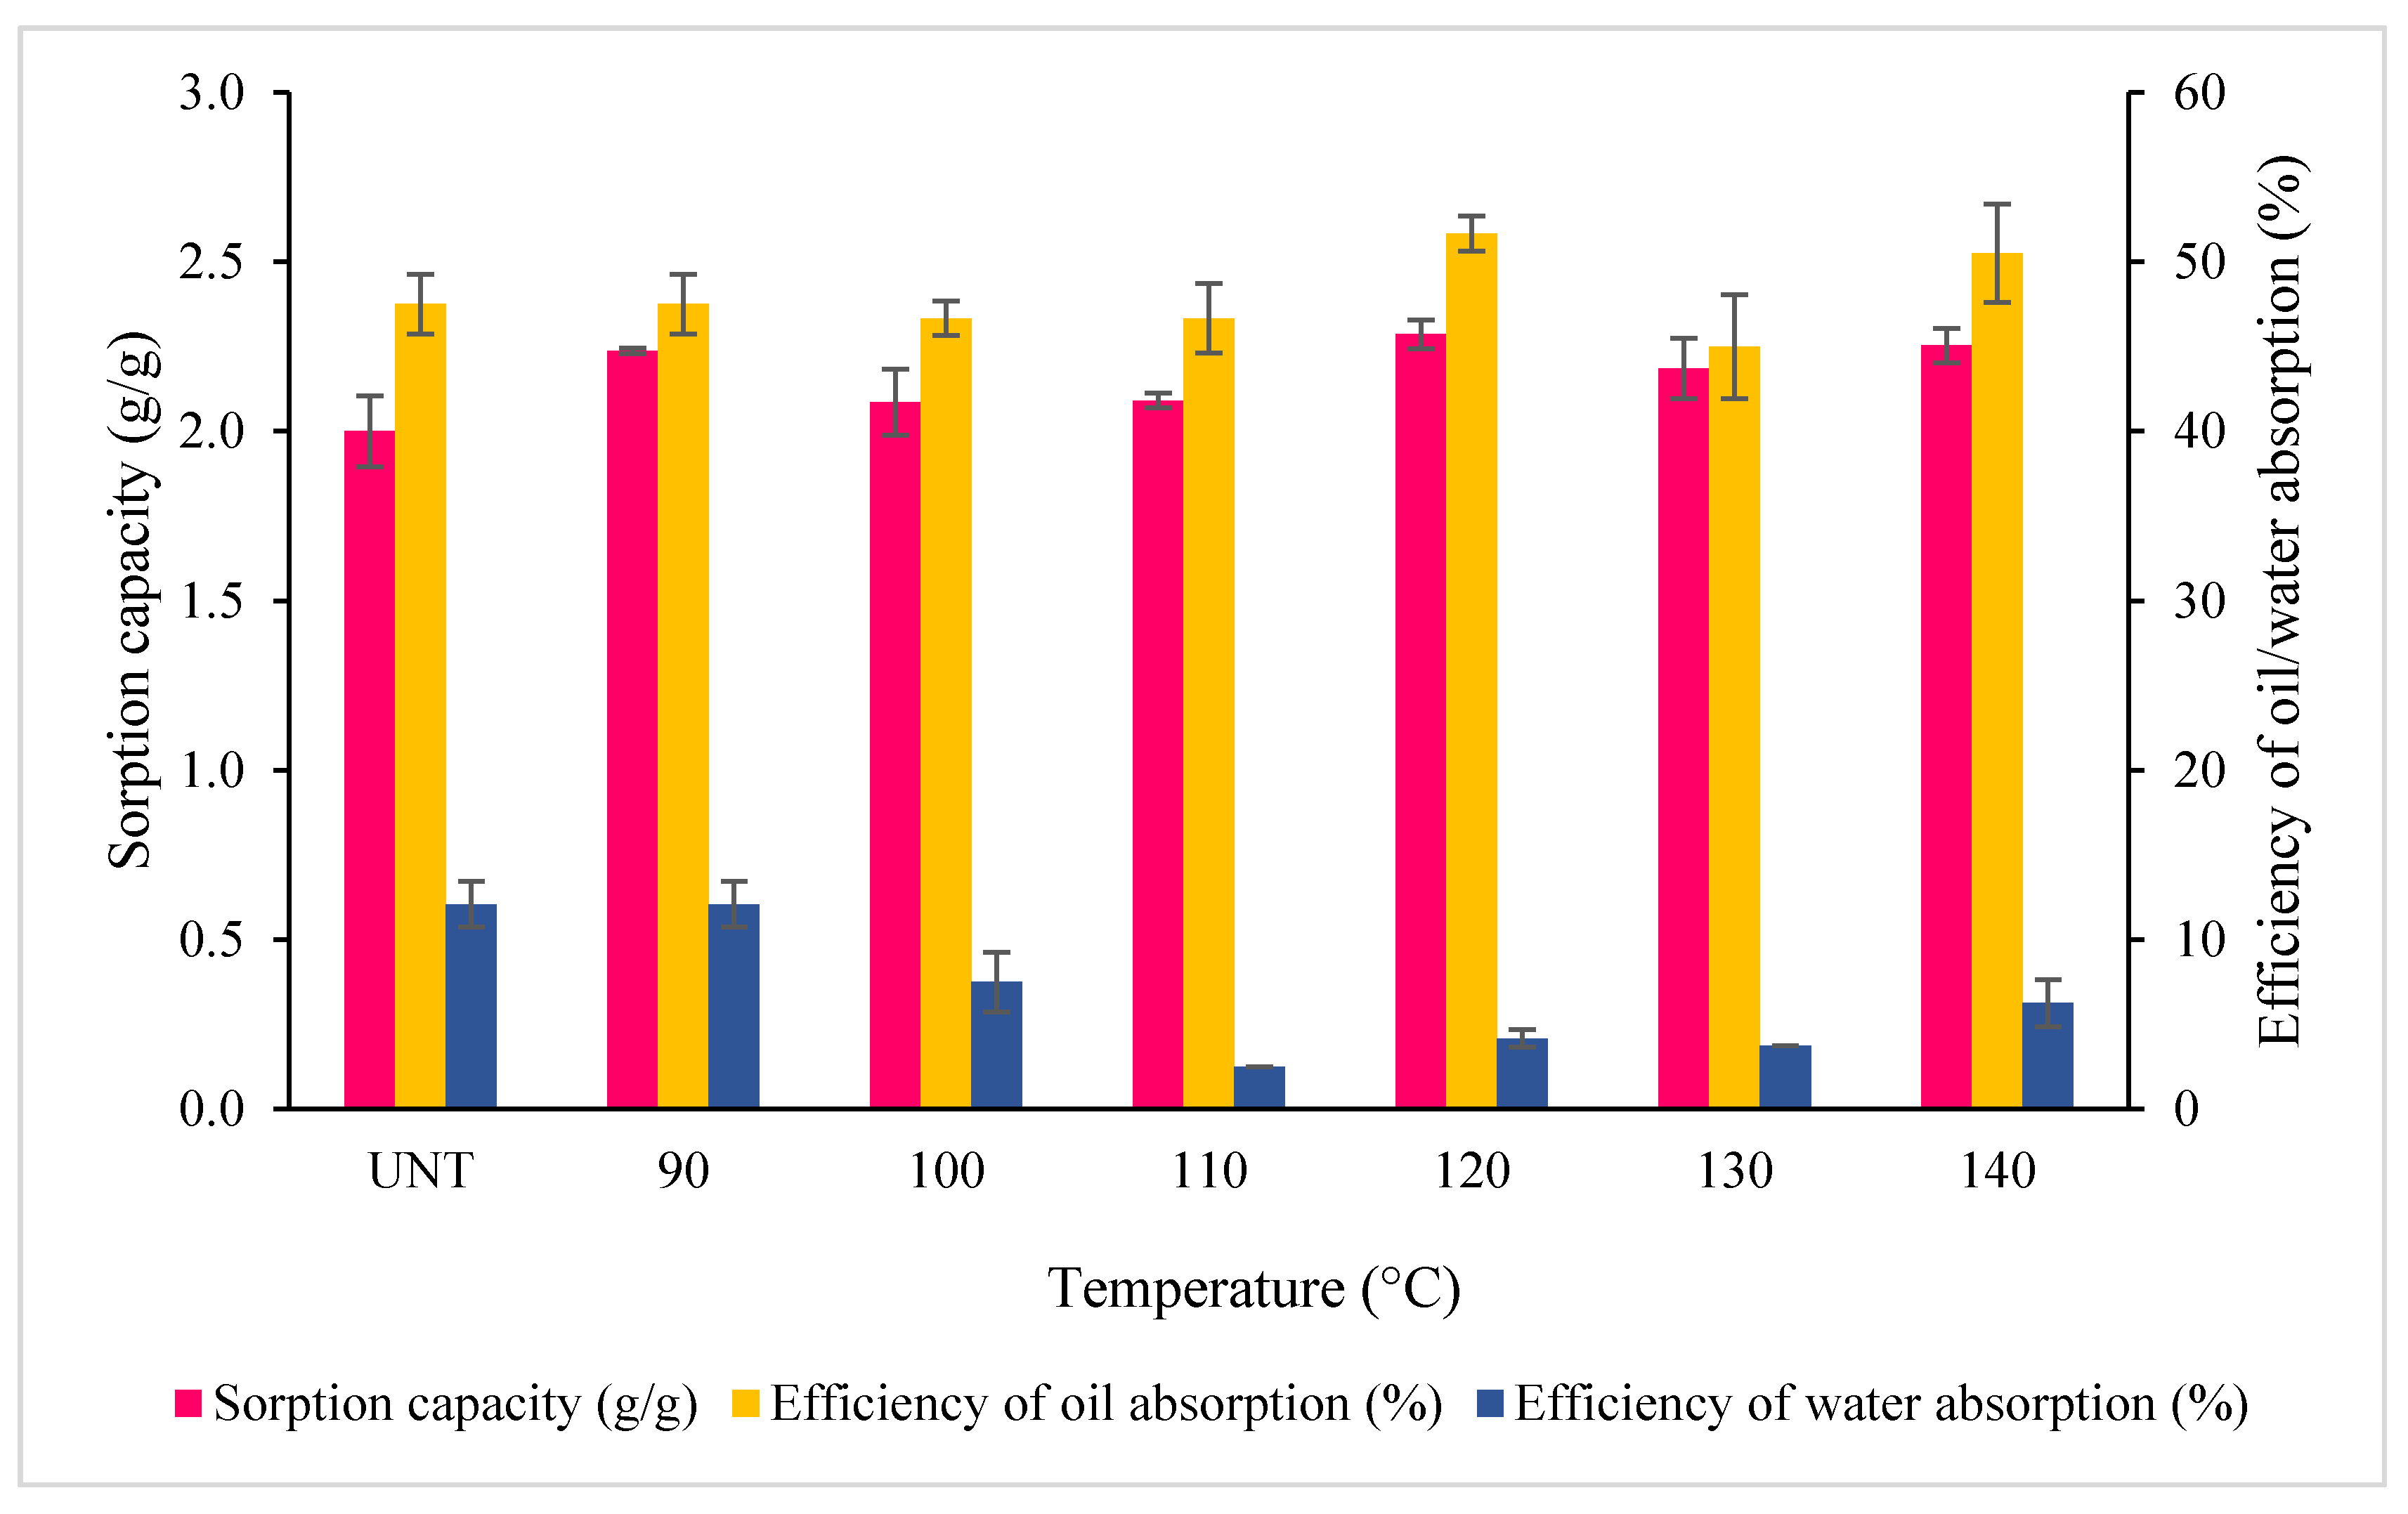
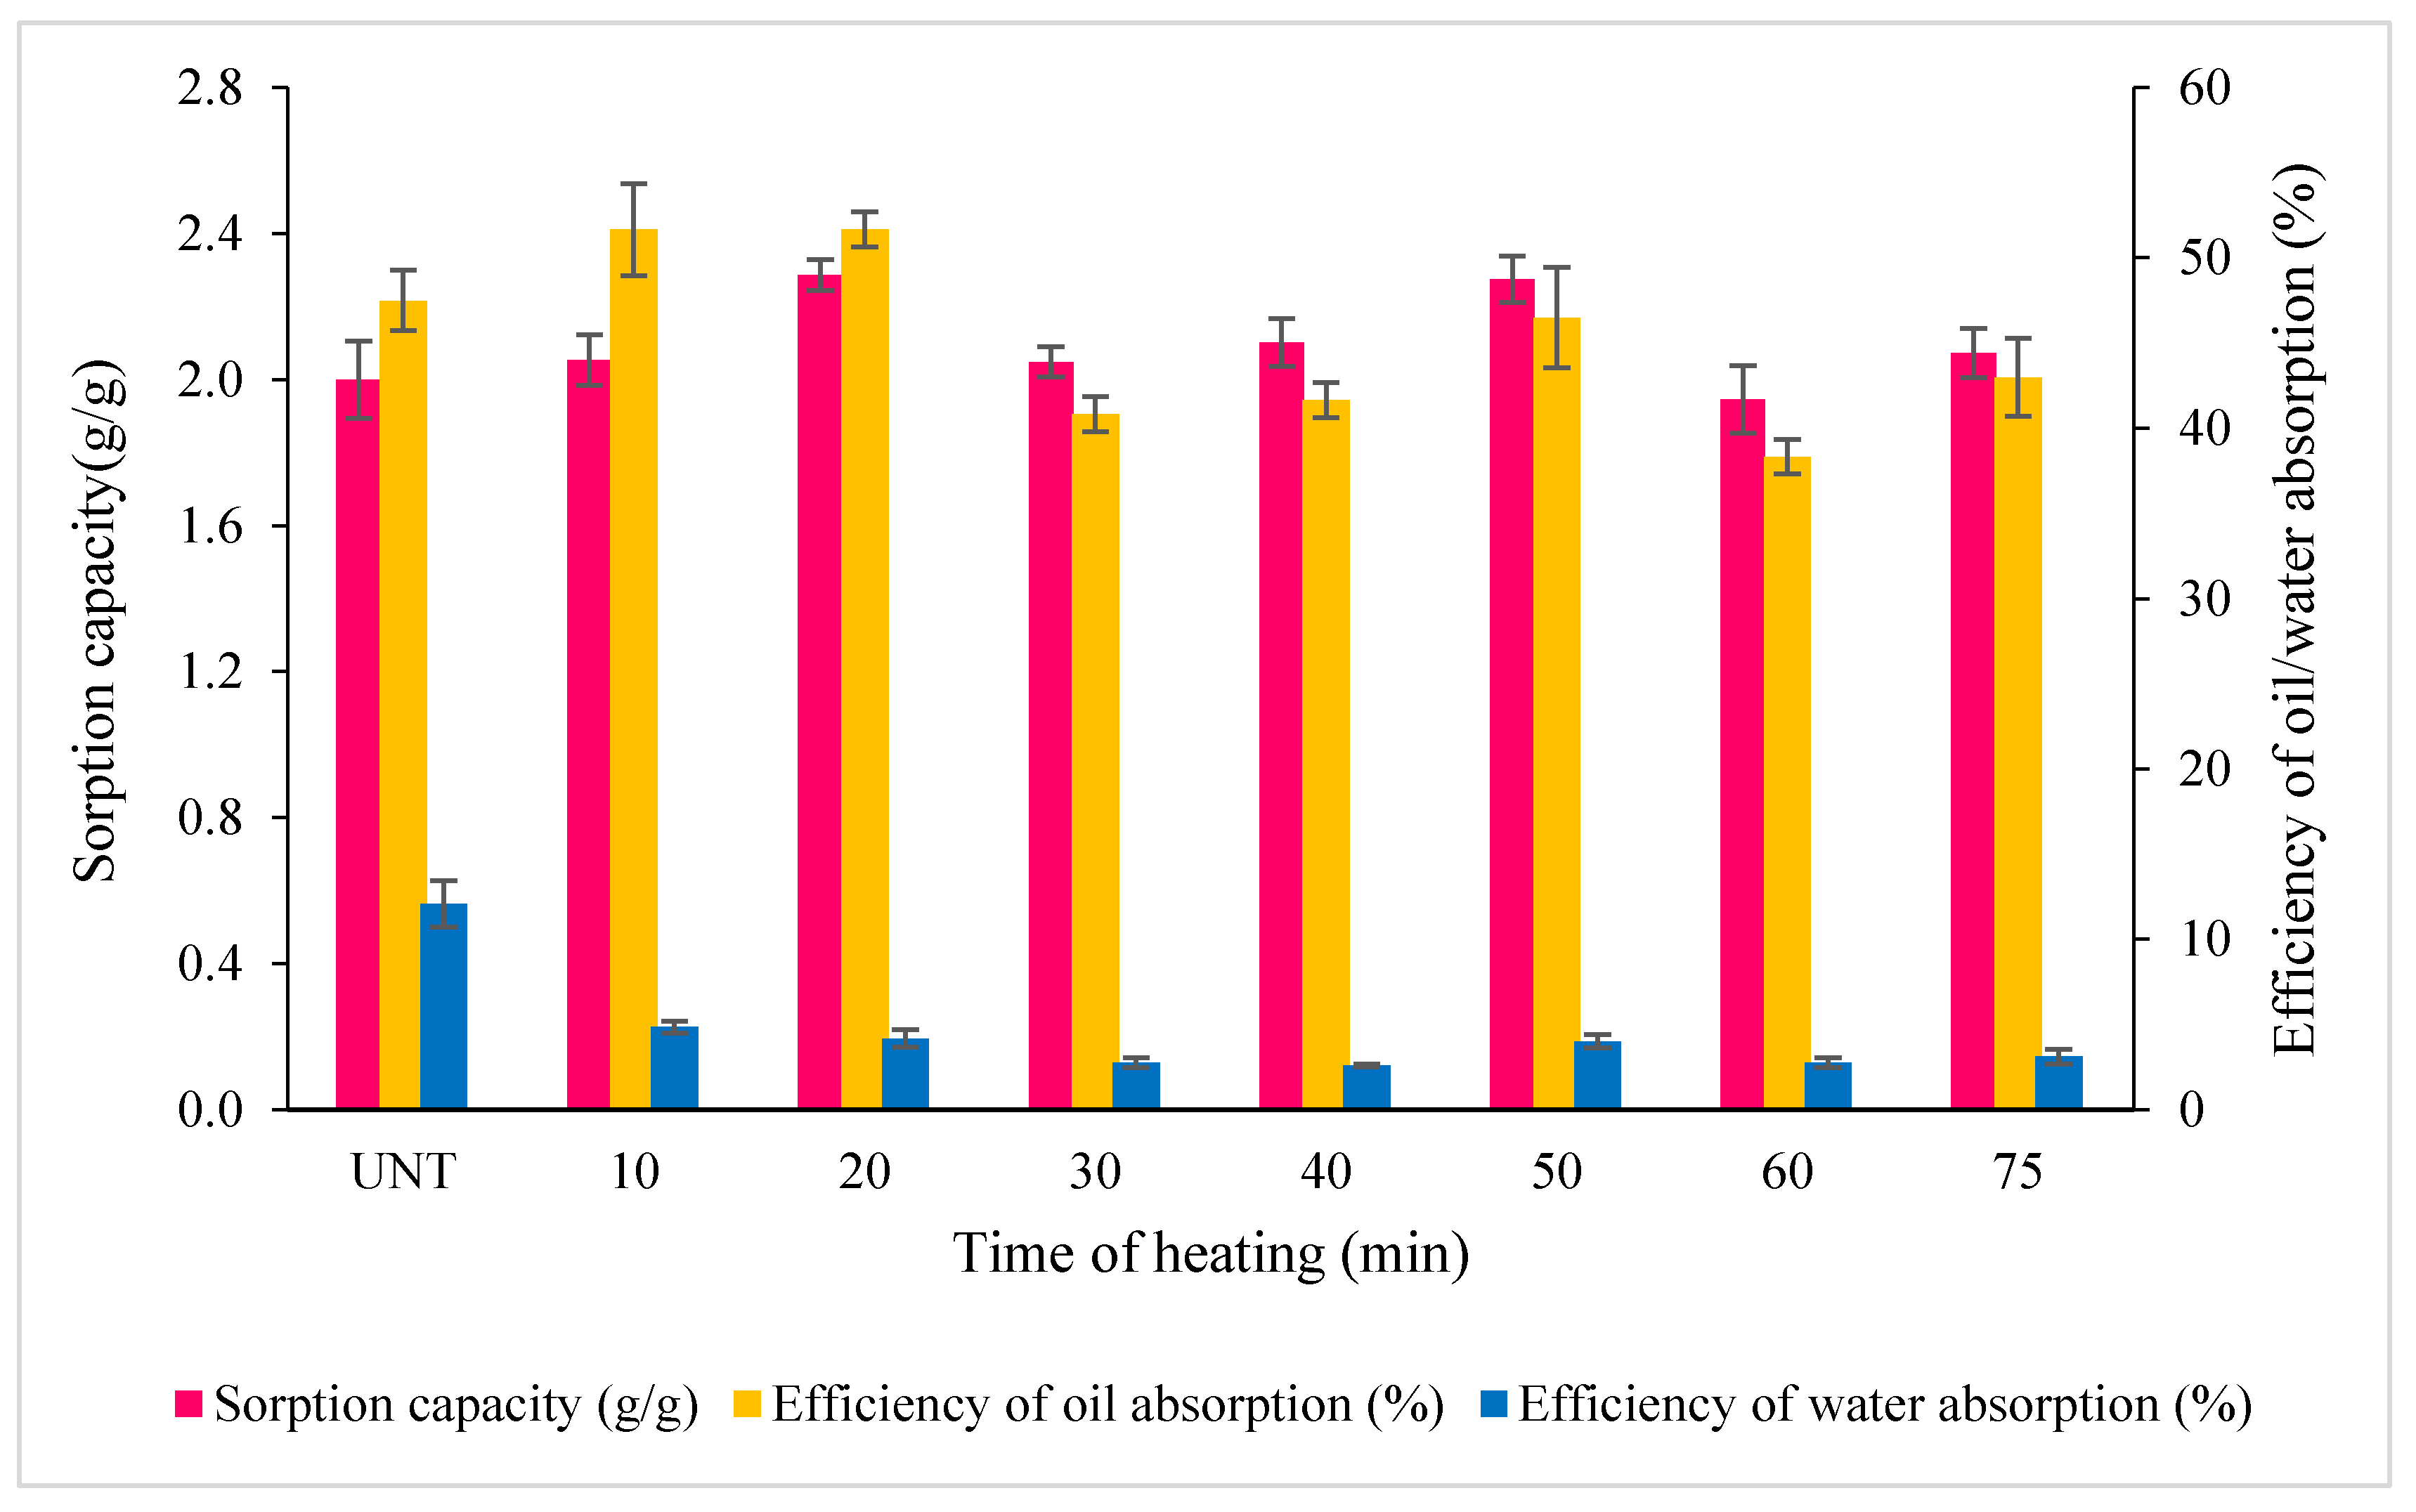
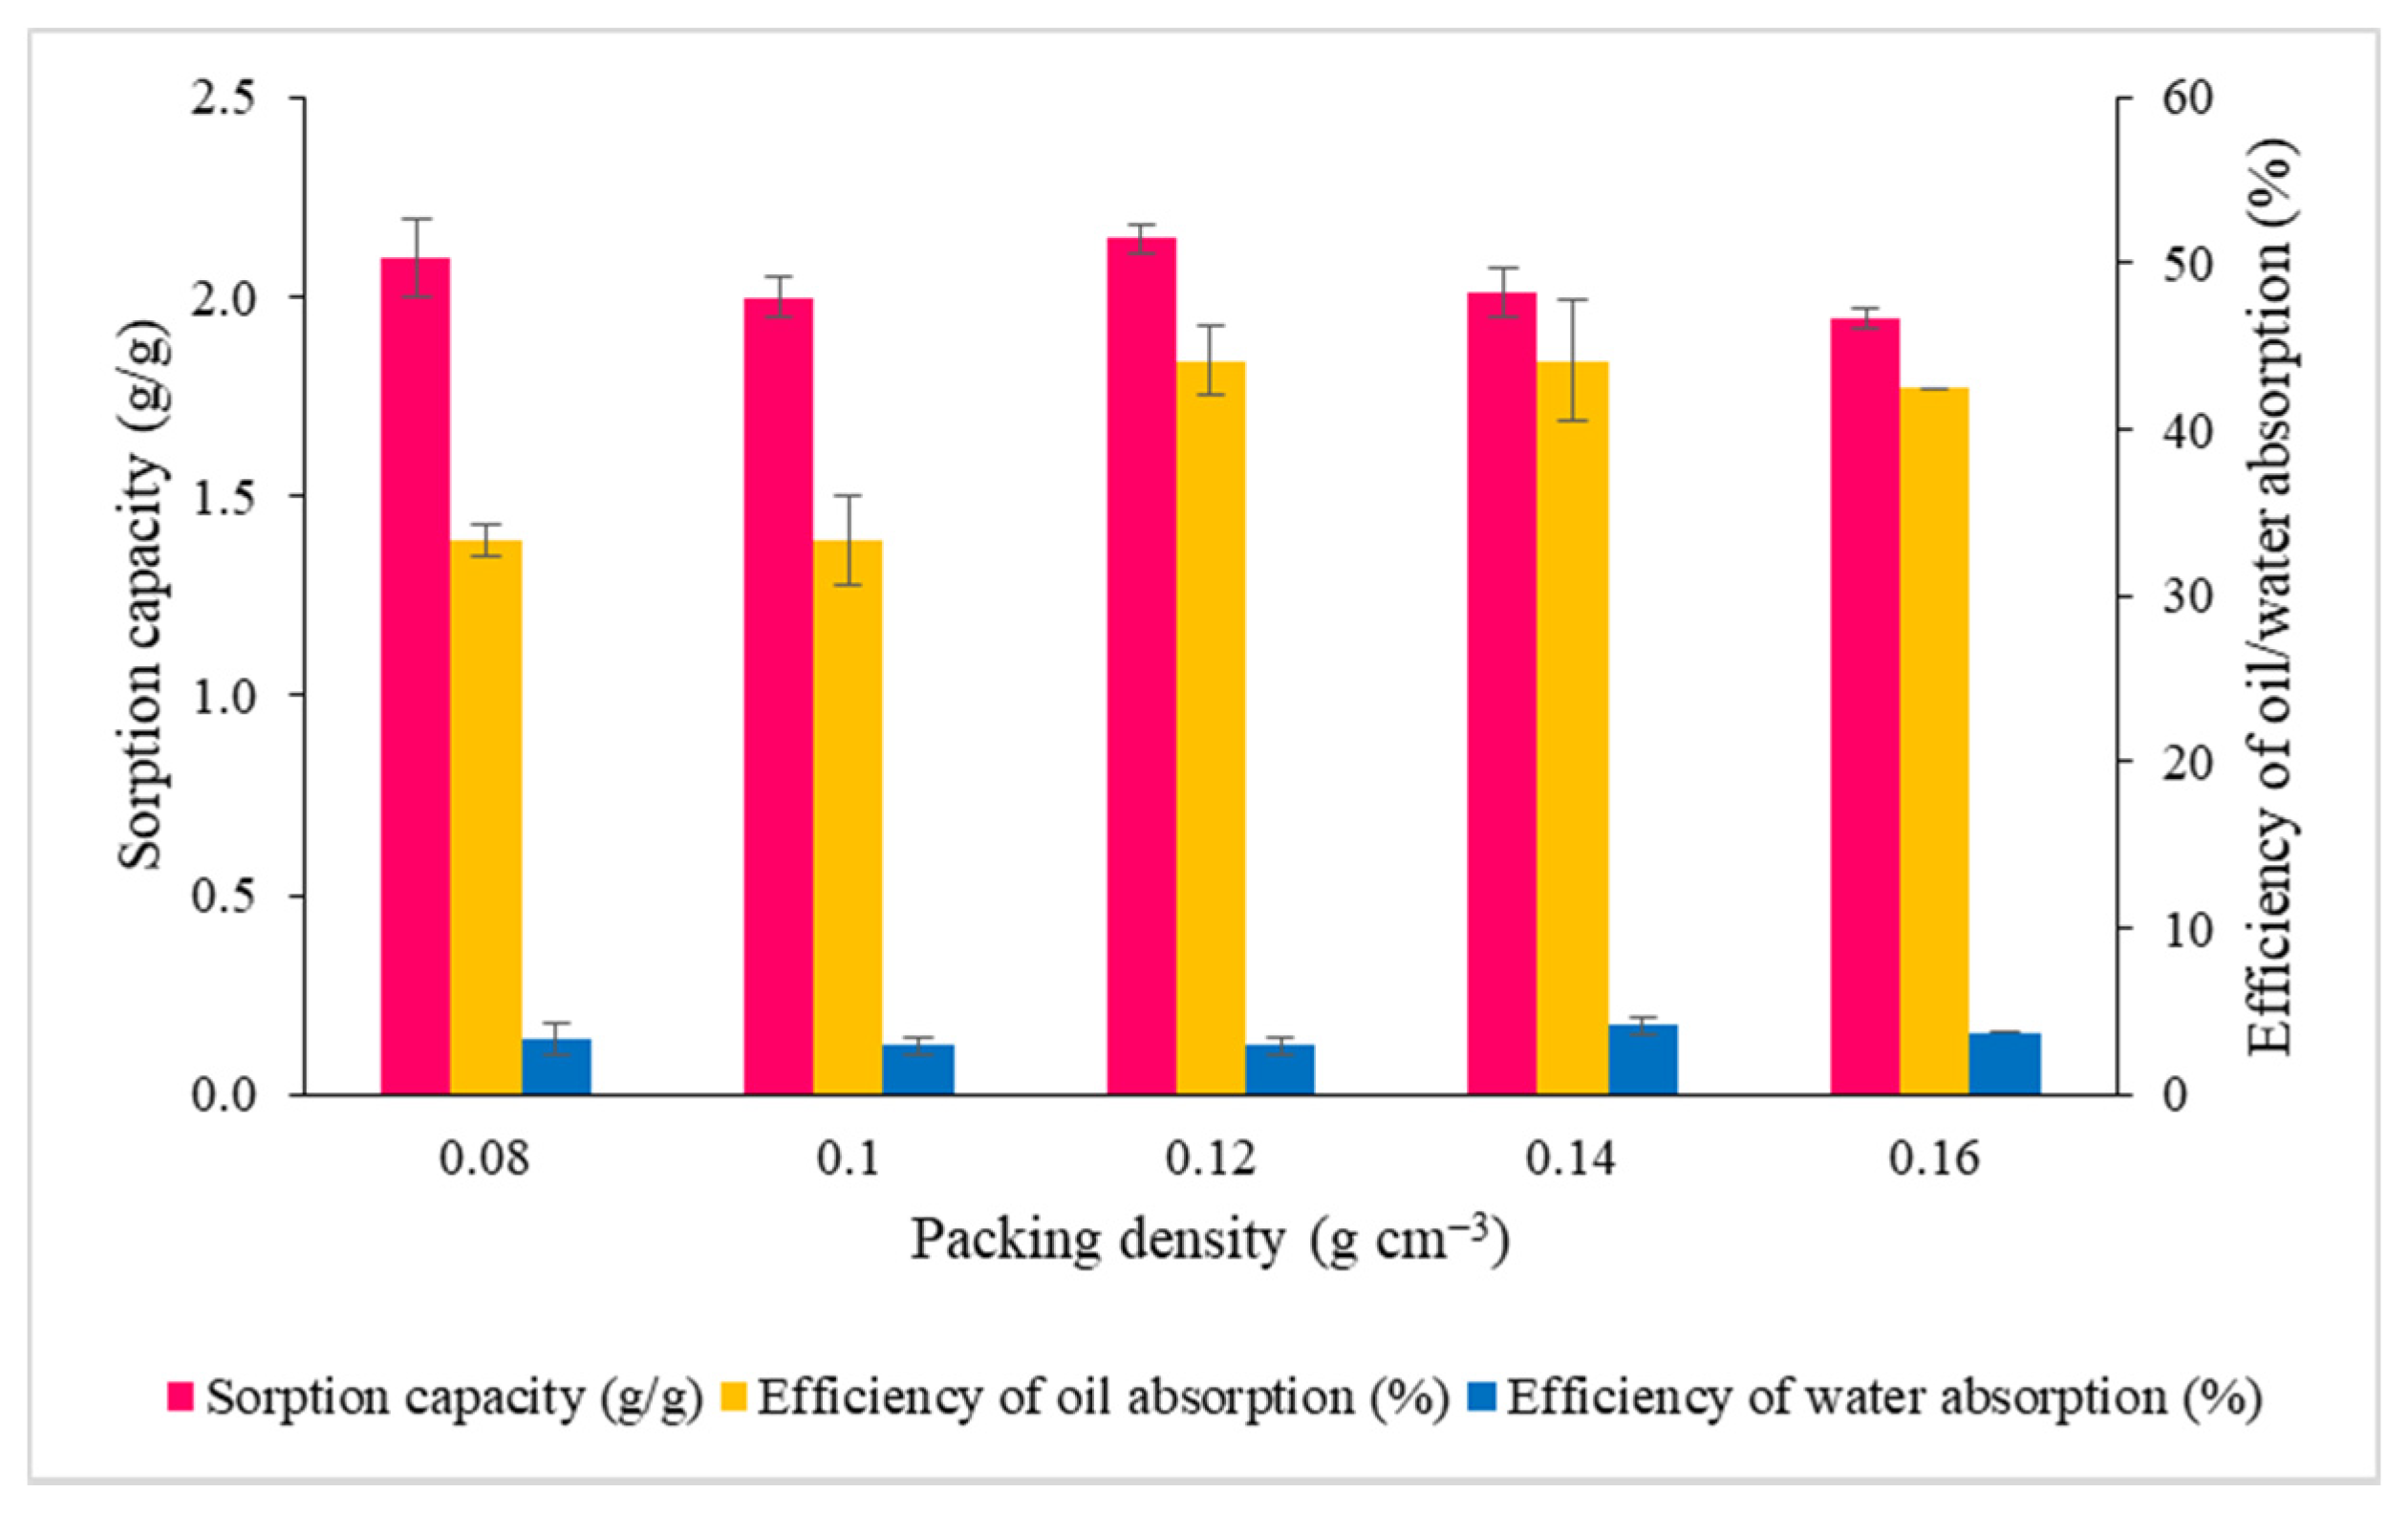
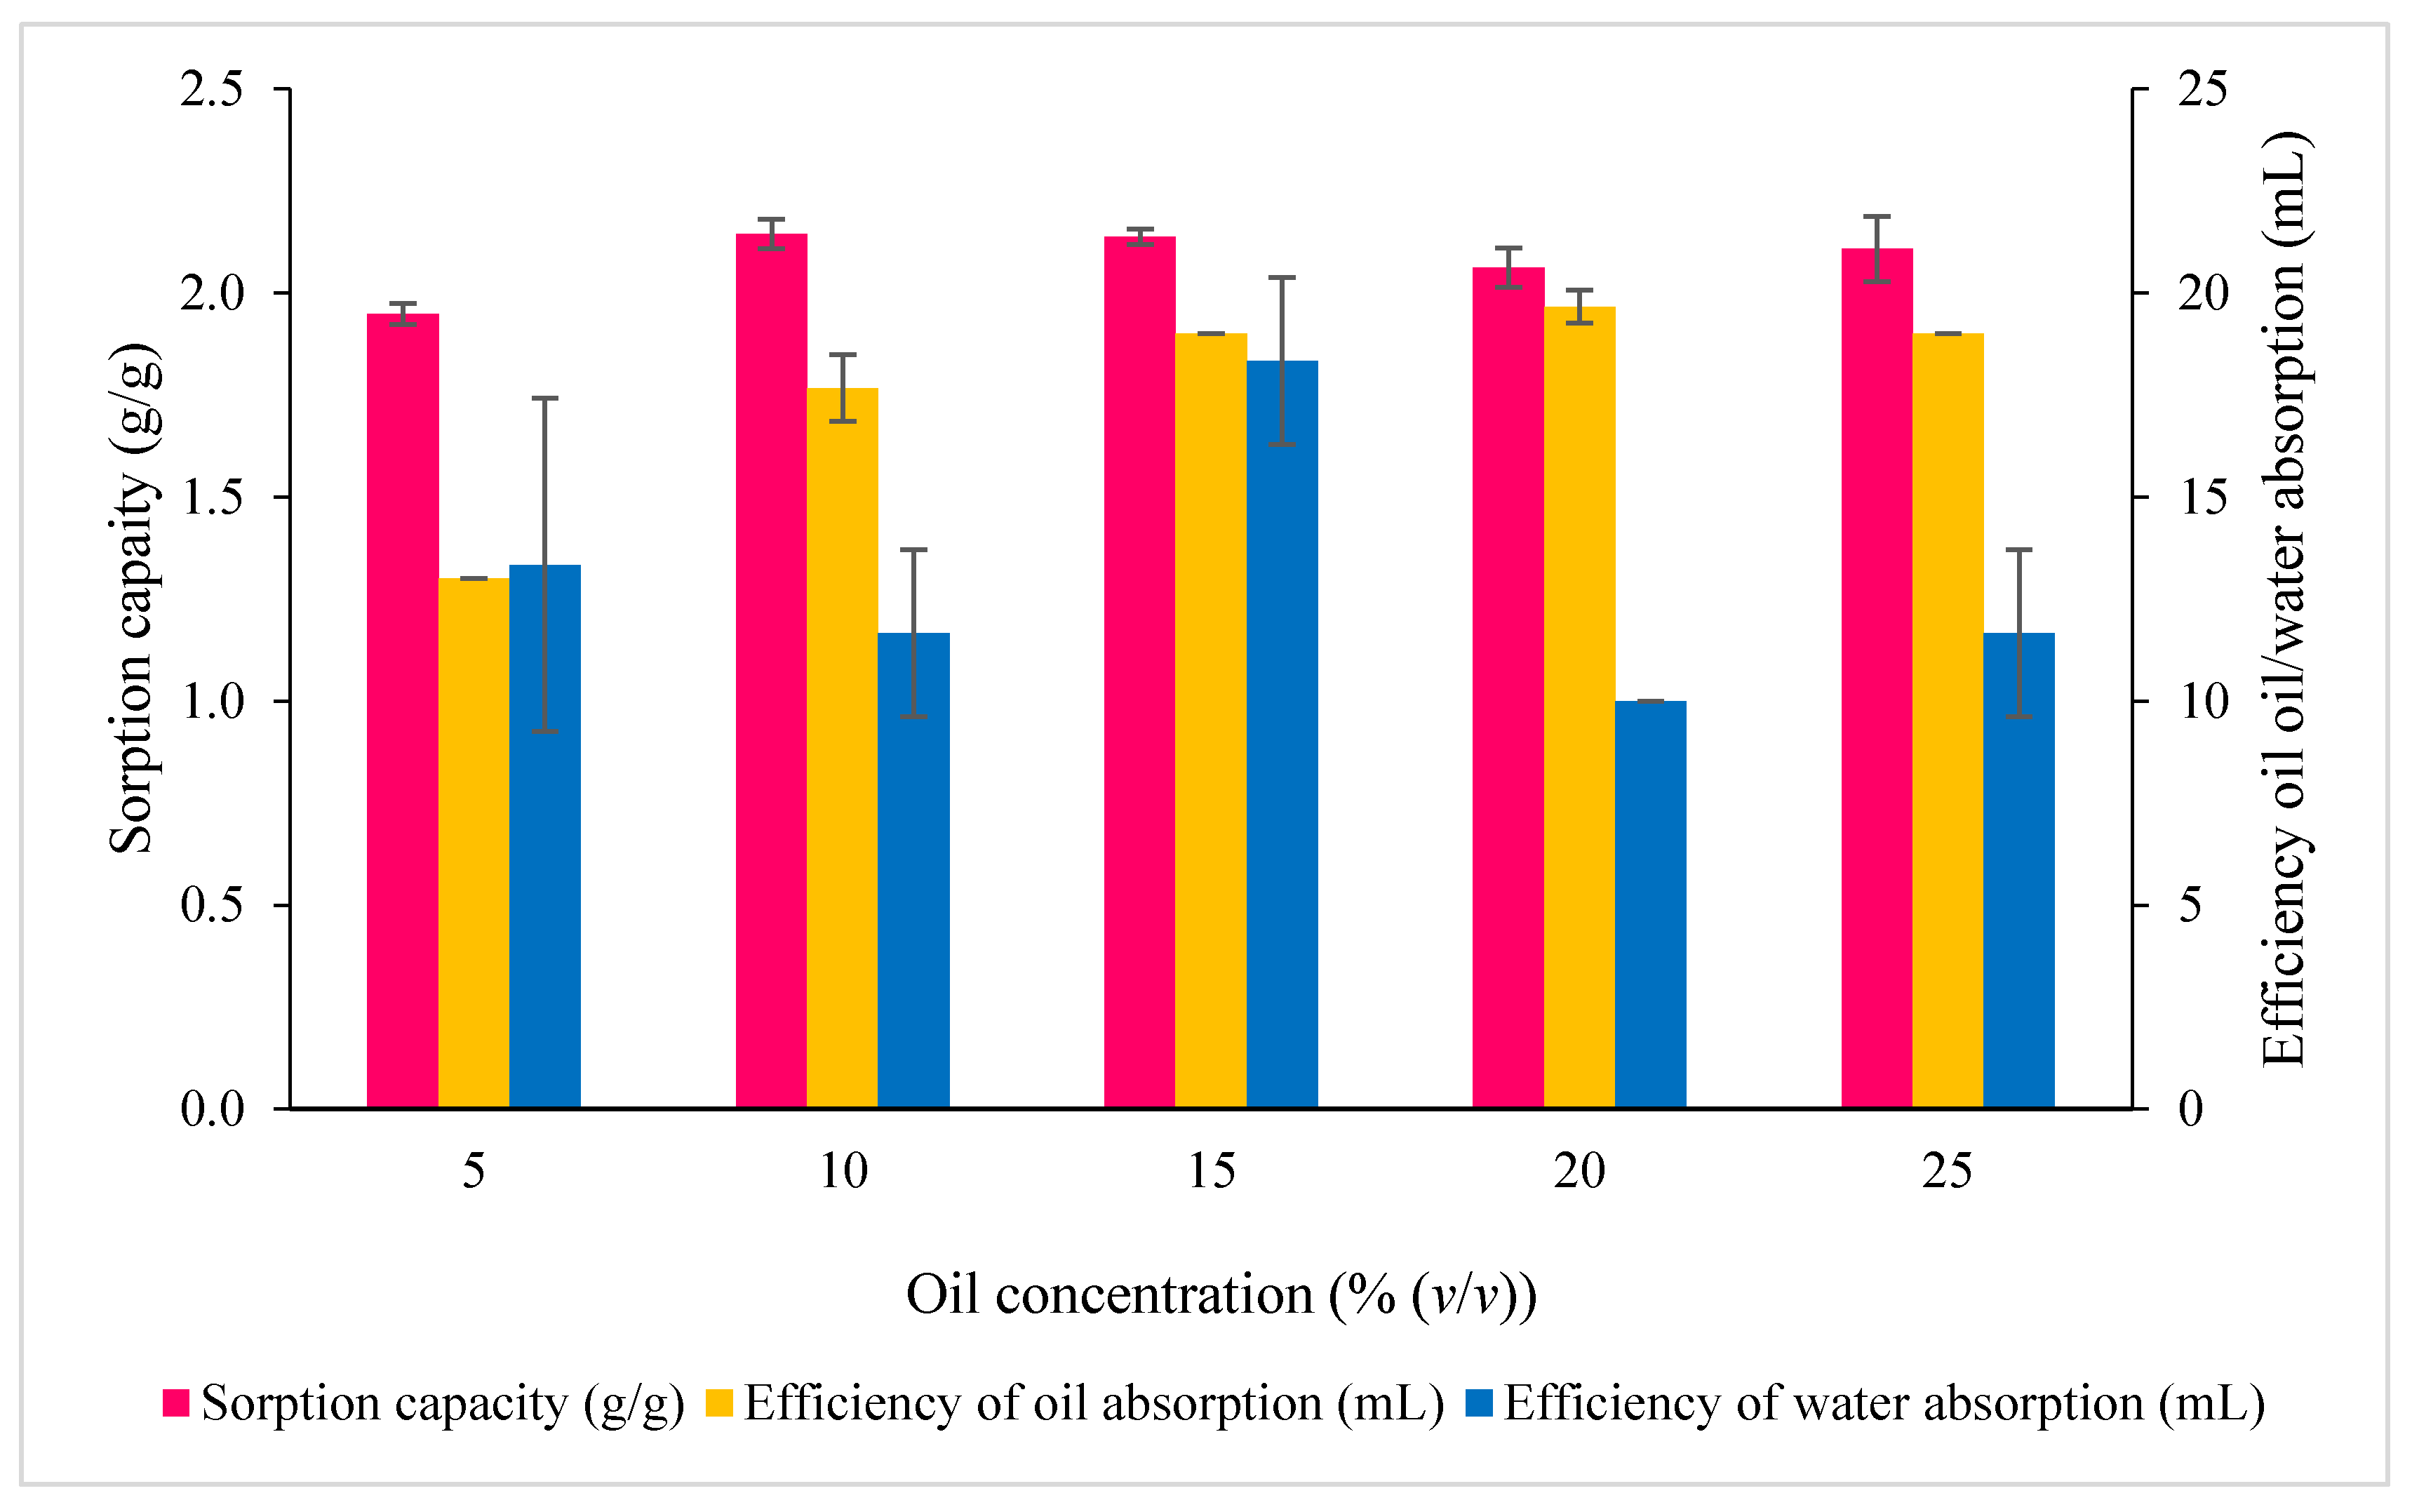
3.4. Optimization of Factors Affecting the Sorption Capacities and the Efficiency of Oil/Water Absorbed by One-Factor-at-a-Time (OFAT)

The RS sorption capacity (g/g) and the efficiency of oil/water absorption (% (v/v)) were assessed under four aligned factors: pre-treatment temperature, time of heating, packing density and oil concentration. Figure 6 shows the performance of RS after pre-treatment at different temperatures between 90 and 140 °C. Based on the data obtained, 120 °C was the optimum pre-treatment temperature, providing the highest sorption capacity (2.29 g/g ± 0.04) and efficiency of oil absorption (51.67% (v/v) ± 1.02). ANOVA was significant (F6,14 = 17.96, p < 0.0001), and Tukey’s post hoc pairwise comparisons confirmed that all points in the range were significantly different from the untreated RS, except for 90 °C. Plant fibers have many free hydroxyl groups that quickly bond with oil or water, providing them with high affinity for both [42]. When RS is heat treated, the contained fibers undergo modifications in their structure and morphology, surface tension, dimensions, chemical composition and mechanical characterization [43].
Cellulose has an excellent ability to absorb moisture from the environment. However, this activity is limited by the presence of a hydrophobic compound also present in plants, namely, lignin. When exposed to high temperature, lignin decomposes over time, leaving cellulose and hemicellulose as suitable sorbents [44]. However, exposure to temperatures above 140 °C can lead to more drastic changes in composition [45]. Higher temperature leads to high porosity, allowing many compounds, including water, to be easily absorbed [46,47].
RS treated at a fixed temperature of 120 °C was then trialed at treatment times ranging from 10 to 70 min (Figure 7). ANOVA was again significant (F4,10 = 568.3, p < 0.0001), and the sorption capacity and efficiency of oil absorption were greatest at 20 min.
Next, with the RS pre-treatment temperature and duration of heating fixed, different packing densities ranging from 0.08 to 0.16 g cm−3 were trialed (Figure 8). The data obtained show that 0.12 g cm−3 was the most efficient packing density, providing the highest sorption capacity (2.15 g/g ± 0.02) and efficiency of oil absorption (44.17% (v/v) ± 0.52), as well as the lowest water absorption. In this case, however, ANOVA detected no significant difference overall between the treatments (F4,10 = 1.214, p = 0.3639).
The final stage examined using OFAT was to expose the pre-treated RS to various concentrations of diesel oil ranging from 5 to 25% (v/v) (Figure 9). This demonstrated that 20% (v/v) led to the highest oil absorption (19.67 mL ± 0.26). With a slightly higher efficiency of oil absorption than 15% (v/v) and 30% (v/v) (19 mL ± 0.00), 20% was selected as it also had the lowest amount of water absorbed. However, ANOVA did not identify significant differences between the treatments (F4,10 = 2.643, p = 0.0969).

3.5. Statistical Analyses by Response Surface Methodology (RSM)

3.5.1. Optimization of Factors by Plackett–Burman Design (PBD)

The purpose of utilizing a Plackett–Burman design (PBD) in the secondary analysis is to eliminate non-significant factors after the OFAT analyses. With all factors aligned, 18 runs were generated (Table 4). These ranged from 100 to 130 °C for temperature (factor A), 10 to 30 min for heating time (factor B), 0.1 to 0.16 g cm−3 for packing density (factor C) and 10 to 25% (v/v) for oil concentration (factor D). Conditions of 130 °C, 10 min heating, 0.16 g cm−3 packing density and 25% (v/v) oil concentration (runs 1 and 4) provided the highest oil absorption (30.67% ± 0.2). Conditions of 100 °C, 10 min heating, 0.1 g cm−3 packing density and 10% (v/v) (run 2) oil concentration provided the lowest absorption (16% ± 0.01). Overall, RS treated at a higher temperature and more densely packed had better oil absorption.
PBDs extend the analyses provided by OFAT as well as incorporating the possibility of two-way interactions between factors [26]. ANOVA confirmed that the model generated was highly significant overall, with R2 = 0.9119, and the time of heating, packing density and oil concentration being significant factors (Table 5). These factors were therefore carried forward to CCD analysis. The model equation for the efficiency of oil absorption (Y) was
Y = + 21.03 1.64 B + 3.36 C 3.03 D  

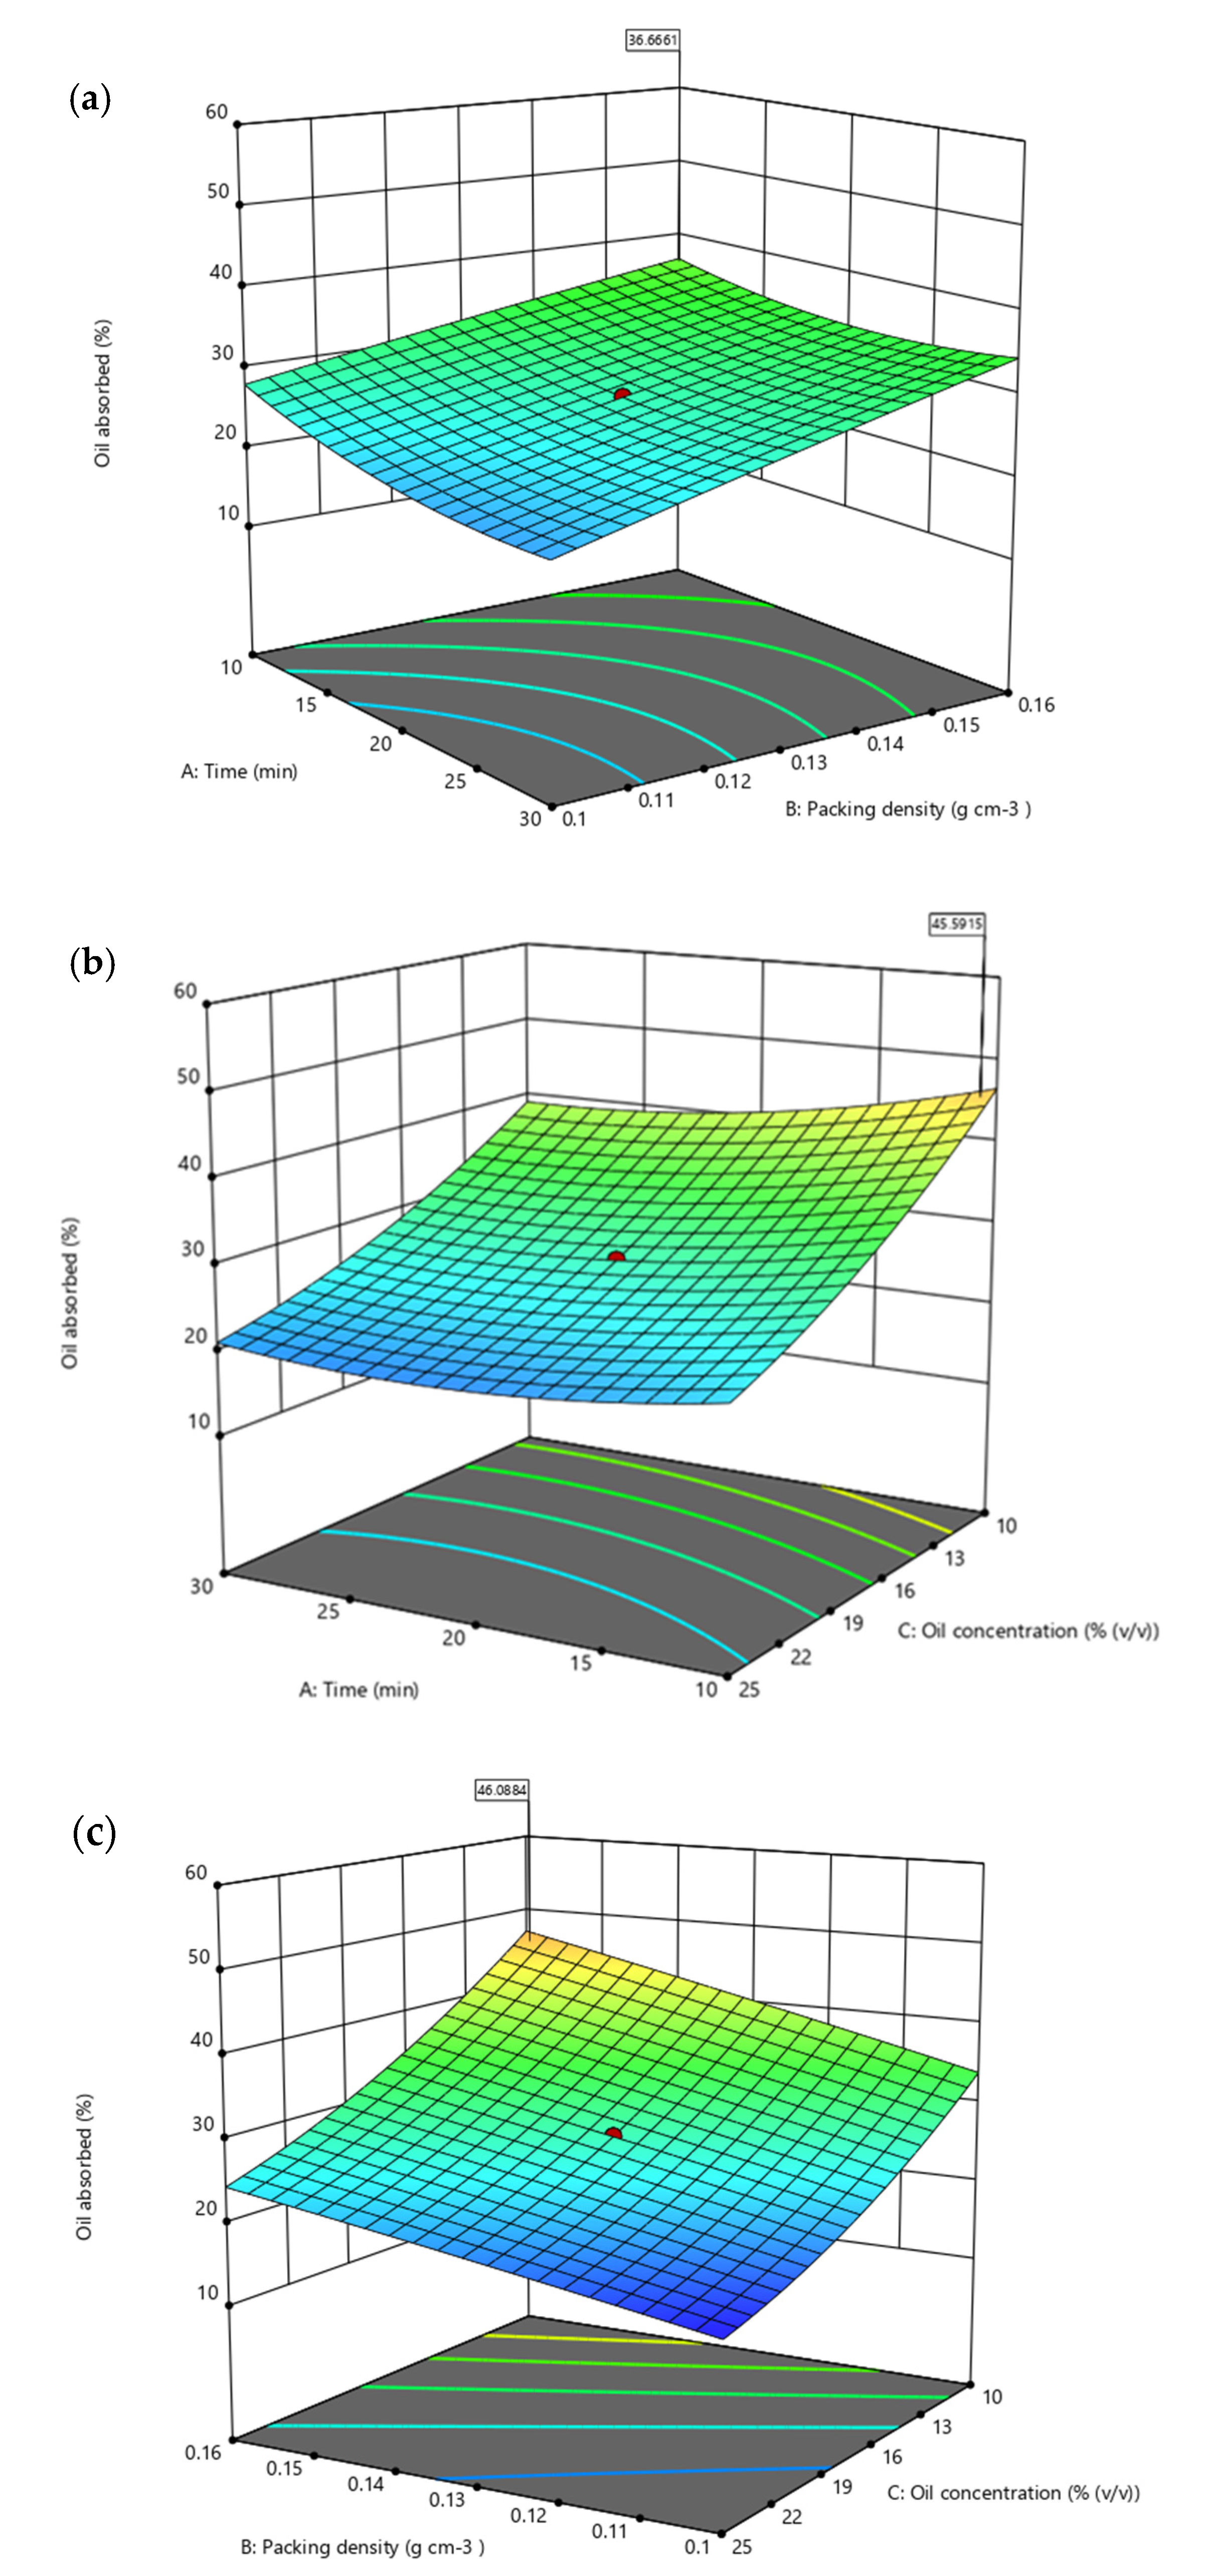
3.5.2. Interactions of Significant Factors Analyzed Using Central Composite Design (CCD)

CCD is used to quantify interactions between aligned factors. After eliminating insignificant factors in the PBD, 20 runs were generated in a five-level CCD to further optimize the efficiency of oil absorption and to minimize water absorption (Table 6).
A quadratic model was selected, and ANOVA was used to assess the significance of each model term (Table 7). The quadratic model was highly significant (p < 0.0001), with R2 = 0.965. The model equation for the efficiency of oil absorption (Y) was
Y = + 19.44 1.34 A + 3.87 B 8.82 C + 1.34 A ² 1.30 C ²
Although ANOVA identified no significant pairwise interactions between any of the factors (Table 7), three response surface contour plots were generated. The factors involved were time of heating, packing density and oil concentration, which were applied as A, B and C, respectively. Figure 10a shows the interaction between the time of heating (min) and packing density (g cm−3). The contour plot suggests that time of heating did not have a strong impact on oil absorption compared to packing density. The highest efficiency of oil absorption (36.67%) was predicted at 10 min and 0.16 g cm−3. Oil concentration (% (v/v)) had a strong influence on oil absorption and an interaction with time (Figure 10b). The greatest oil absorption (45.59%) was predicted at 10 min and 10% (v/v). Figure 10c shows the interaction between packing density (g cm−3) and oil concentration (% (v/v)). The greatest oil absorption (46.09%) was predicted at 0.16 g cm−3 and 10% (v/v) diesel. However, all three plots are characterized by relatively flat rather than domed surfaces, consistent with the lack of detection of significant interactions and these three variables acting independently.

3.5.3. RSM Model Validation

An additional experiment was carried out using the derived optimal conditions to assess the adequacy of the quadratic model of oil sorption capacity in RS. The model was validated by performing an experimental trial (n = 3) using the predicted values shown in Table 8. The model predicted a value of 26 mL of diesel with 14 mL of seawater for RS for oil absorption. These conditions were applied experimentally, and the value obtained was identical to that predicted (Fisher’s exact t-test, p = 0.9999).
Using OFAT, the optimal conditions for the sorption capacity and the efficiency of oil/water absorption were achieved by using RS treated at 120 °C for 20 min, then packed at a 0.12 g cm−3 packing density and exposed to 20% (v/v) diesel. These conditions resulted in the trapping of 19 mL of diesel and 10 mL of seawater. The efficiency of oil absorption was 24% ± 0.3. Using the PBD and the CCD approach, the suggested conditions were to treat RS at 120 °C for 10 min, pack it at 0.148 g cm−3 and use 25% (v/v) diesel. The efficiency of oil absorption under these conditions was 25% ± 0.5, providing a slight improvement to the use of OFAT alone. This is also consistent with the interaction terms being non-significant; in other words, both analyses rely on the ‘pure’ factors acting independently, and thus the close similarity in the results obtained is unsurprising.

4. Conclusions

The sorption capacity and efficiency of RS in absorbing oil were studied. The analyses carried out identified that various factors could enhance the effectiveness of RS as a natural sorbent. Pre-treatment of RS at high temperature led to a larger surface area for absorption than present in untreated RS. The use of OFAT and RSM was successful in identifying the factors that significantly influenced oil absorption and eliminated non-significant factors. The oil absorption capacity of pre-treated RS was greatly improved in comparison with untreated RS. Using a CCD, the optimum parameters obtained were 10 min heat pre-treatment, 0.148 g cm−3 packing density and 25% (v/v) oil concentration. The efficiency of oil absorption by RS was enhanced in the experimental equipment used, with a packing density of <0.16 g cm−3, and a shorter heat treatment duration. The use of RS as trialed in this study may prove to be technically feasible and environmentally acceptable and make a valuable contribution to oil spill clean-up.

Author Contributions

Conceptualization, S.A.A., N.A.S. and K.A.K.; methodology, S.A.A., N.A.S., S.H.T., N.N.Z., K.A.K. and A.A.A.; software, S.H.T., N.N.Z., K.A.K., F.E.K. and A.A.A.; validation, S.A.A., N.A.S., K.A.K. and A.A.A.; formal analysis, S.H.T., N.N.Z., S.A.A., N.A.S., K.A.K. and A.A.A.; investigation, S.H.T.; resources, S.A.A. and N.A.S.; data curation, S.H.T., S.A.A., N.A.S., K.A.K. and A.A.A.; writing—original draft preparation, S.H.T.; writing—review and editing, S.A.A., N.N.Z., N.A.S., K.A.K., F.E.K., A.Z., A.A.A., F.M. and P.C.; visualization, S.A.A., N.A.S. and K.A.K.; supervision, S.A.A., N.A.S., K.A.K., A.Z., F.M. and P.C.; project administration, S.A.A., N.A.S. and K.A.K.; funding acquisition, S.A.A. and K.A.K. All authors have read and agreed to the published version of the manuscript.

Funding

The APC was funded by Universiti Teknologi MARA. This project was financially supported by the Putra‒IPM fund under a research grant to S.A. Ahmad (GPM‒2019/9678900) disbursed by Universiti Putra Malaysia (UPM). C. Gomez-Fuentes is supported by Centro de Investigacion y Monitoreo Ambiental Antàrctico (CIMAA). P. Convey is supported by NERC core funding to the BAS ‘Biodiversity, Evolution and Adaptation’ Team. S.H. Taufik and F.E. Khalid are funded by a personal scholarship from Majlis Amanah Rakyat (MARA).

Institutional Review Board Statement

Not applicable.

Informed Consent Statement

Not applicable.

Data Availability Statement

Not applicable.

Acknowledgments

The authors would like to thank Universiti Teknologi MARA, Universiti Putra Malaysia, Universidad de Magallanes, Centro de Investigacion y Monitoreo Ambiental Antàrctico (CIMAA), British Antarctic Survey, Shibaura Institute of Technology, Universiti Malaysia Terengganu and Majlis Amanah Rakyat (MARA).

Conflicts of Interest

The authors declare no conflict of interest.

References

  1. Singh, V.; Jinka, S.; Hake, K.; Parameswaran, S.; Kendall, R.J.; Ramkumar, S. Novel Natural Sorbent for Oil Spill Cleanup. Ind. Eng. Chem. Res. 2014, S3, 11954–11961. [Google Scholar] [CrossRef]
  2. Pete, A.J.; Bharti, B.; Benton, M.G. Nano-Enhanced Bioremediation for Oil Spills: A Review. ACS ES&T Eng. 2021, 1, 928–946. [Google Scholar] [CrossRef]
  3. Wiloso, E.; Wiloso, E.I.; Barlianti, V.; Anggraini, I.F.; Hendarsyah, H. Potential of Cogon Grass as an Oil Sorbent. Indones. J. Appl. Chem. 2012, 14, 38–43. [Google Scholar] [CrossRef]
  4. Yang, L.; Wang, Z.; Yang, L.; Li, X.; Zhang, Y.; Lu, C. Coco Peat Powder as a Source of Magnetic Sorbent for Selective Oil–Water Separation. Ind. Crops Prod. 2017, 101, 1–10. [Google Scholar] [CrossRef]
  5. Goodman, B.A. Utilization of Waste Straw and Husks from Rice Production: A Review. J. Bioresour. Bioprod. 2020, 5, 143–162. [Google Scholar] [CrossRef]
  6. FAOSTAT. Available online: http://www.fao.org/faostat/en/#data/QC/visualize (accessed on 8 August 2021).
  7. Yusof, Z.M.; Misiran, M.; Baharin, N.F.; Yaacob, M.F.; Aziz, N.A.B.A.; Sanan, N.H.B. Projection of Paddy Production in Kedah Malaysia: A Case Study. Asian J. Adv. Agric. Res. 2019, 10, 1–6. [Google Scholar] [CrossRef]
  8. Mutert, E.; Fairhurst, T.H. Southeast Asia Developments in Rice Production in Southeast Asia. Better Crop. Int. 2002, 15, 12. [Google Scholar]
  9. Van Hung, N.; Maguyon-Detras, M.C.; Migo, M.V.; Quilloy, R.; Balingbing, C.; Chivenge, P.; Gummert, M. Rice Straw Overview: Availability, Properties, and Management Practices. In Sustainable Rice Straw Management; Springer International Publishing: Berlin/Heidelberg, Germany, 2020; pp. 1–13. [Google Scholar] [CrossRef] [Green Version]
  10. Mirmohamadsadeghi, S.; Karimi, K. Recovery of Silica from Rice Straw and Husk. In Current Developments in Biotechnology and Bioengineering: Resource Recovery from Wastes; Elsevier: Amsterdam, The Netherlands, 2020; pp. 411–433. [Google Scholar] [CrossRef]
  11. Li, W.C.; Law, F.Y.; Chan, Y.H.M. Biosorption Studies on Copper (II) and Cadmium (II) Using Pretreated Rice Straw and Rice Husk. Environ. Sci. Pollut. Res. 2017, 24, 8903–8915. [Google Scholar] [CrossRef]
  12. Mahamad, M.N.; Zaini, M.A.A.; Zakaria, Z.A. Preparation and Characterization of Activated Carbon from Pineapple Waste Biomass for Dye Removal. Int. Biodeterior. Biodegrad. 2015, 102, 274–280. [Google Scholar] [CrossRef]
  13. Kadhim, A.-S.F. Characterization the Removal of Phenol from Aqueous Solution in Fluidized Bed Column by Rice Husk Adsorbent. Res. J. Recent Sci. 2012, 1, 145. [Google Scholar]
  14. Dilamian, M.; Noroozi, B. Rice Straw Agri-Waste for Water Pollutant Adsorption: Relevant Mesoporous Super Hydrophobic Cellulose Aerogel. Carbohydr. Polym. 2021, 251, 117016. [Google Scholar] [CrossRef]
  15. Abidli, A.; Huang, Y.; Cherukupally, P.; Bilton, A.M.; Park, C.B. Novel Separator Skimmer for Oil Spill Cleanup and Oily Wastewater Treatment: From Conceptual System Design to the First Pilot-Scale Prototype Development. Environ. Technol. Innov. 2020, 18, 100598. [Google Scholar] [CrossRef]
  16. Purakayastha, T.J.; Das, K.C.; Gaskin, J.; Harris, K.; Smith, J.L.; Kumari, S. Effect of Pyrolysis Temperatures on Stability and Priming Effects of C3 and C4 Biochars Applied to Two Different Soils. Soil Tillage Res. 2016, 155, 107–115. [Google Scholar] [CrossRef]
  17. Thomsen, S.T.; Londoño, J.E.G.; Schmidt, J.E.; Kádár, Z. Comparison of Different Pretreatment Strategies for Ethanol Production of West African Biomass. Appl. Biochem. Biotechnol. 2015, 175, 2589–2601. [Google Scholar] [CrossRef]
  18. Hoang, A.T.; Le, V.V.; Al-Tawaha, A.R.M.S.; Nguyen, D.N.; Noor, M.M.; Pham, V.V. An Absorption Capacity Investigation of New Absorbent Based on Polyurethane Foams and Rice Straw for Oil Spill Cleanup. Pet. Sci. Technol. 2018, 36, 361–370. [Google Scholar] [CrossRef]
  19. Santiago Ramos, D.P.; Morgan, L.E.; Lloyd, N.S.; Higgins, J.A. Reverse Weathering in Marine Sediments and the Geochemical Cycle of Potassium in Seawater: Insights from the K Isotopic Composition (41K/39K) of Deep-Sea Pore-Fluids. Geochim. Cosmochim. Acta 2018, 236, 99–120. [Google Scholar] [CrossRef]
  20. Bazargan, A.; Tan, J.; McKay, G. Standardization of Oil Sorbent Performance Testing. J. Test. Eval. 2015, 43, 1271–1278. [Google Scholar] [CrossRef]
  21. Sun, X.F.; Sun, R.; Sun, J.X. Acetylation of Rice Straw with or without Catalysts and Its Characterization as a Natural Sorbent in Oil Spill Cleanup. J. Agric. Food Chem. 2002, 50, 6428–6433. [Google Scholar] [CrossRef]
  22. Garside, P.; Wyeth, P. Identification of Cellulosic Fibres by FTIR Spectroscopy Differentiation of FLAX and HEMP by Polarized ATR FTIR. Stud. Conserv. 2013, 51, 205–211. [Google Scholar] [CrossRef]
  23. Xu, F.; Zhu, T.T.; Rao, Q.Q.; Shui, S.W.; Li, W.W.; He, H.B.; Yao, R.S. Fabrication of Mesoporous Lignin-Based Biosorbent from Rice Straw and Its Application for Heavy-Metal-Ion Removal. J. Environ. Sci. 2017, 53, 132–140. [Google Scholar] [CrossRef] [Green Version]
  24. Boukir, A.; Fellak, S.; Doumenq, P. Structural Characterization of Argania Spinosa Moroccan Wooden Artifacts during Natural Degradation Progress Using Infrared Spectroscopy (ATR-FTIR) and X-Ray Diffraction (XRD). Heliyon 2019, 5, e02477. [Google Scholar] [CrossRef] [Green Version]
  25. Li, H.; Liu, L.; Yang, F. Oleophilic Polyurethane Foams for Oil Spill Cleanup. In Procedia Environmental Sciences; Elsevier BV: Amsterdam, The Netherlands, 2013; Volume 18, pp. 528–533. [Google Scholar] [CrossRef] [Green Version]
  26. Akaria, N.N.; Gomez-Fuentes, C.; Khalil, K.A.; Convey, P.; Roslee, A.F.A.; Zulkharnain, A.; Sabri, S.; Shaharuddin, N.A.; Cárdenas, L.; Ahmad, S.A. Statistical Optimisation of Diesel Biodegradation at Low Temperatures by an Antarctic Marine Bacterial Consortium Isolated from Non-Contaminated Seawater. Microorganisms 2021, 9, 1213. [Google Scholar] [CrossRef]
  27. Plackett, R.L.; Burman, J.P. The Design of Optimum Multifactorial Experiments. Biometrika 1946, 33, 305–325. [Google Scholar] [CrossRef]
  28. Darham, S.; Zahri, K.N.M.; Zulkharnain, A.; Sabri, S.; Gomez-Fuentes, C.; Convey, P.; Khalil, K.A.; Ahmad, S.A. Statistical Optimisation and Kinetic Studies of Molybdenum Reduction Using a Psychrotolerant Marine Bacteria Isolated from Antarctica. J. Mar. Sci. Eng. 2021, 9, 648. [Google Scholar] [CrossRef]
  29. Roslee, A.F.A.; Gomez-Fuentes, C.; Zakaria, N.N.; Shaharuddin, N.A.; Zulkharnain, A.; Khalil, K.A.; Convey, P.; Ahmad, S.A. Growth Optimisation and Kinetic Profiling of Diesel Biodegradation by a Cold-Adapted Microbial Consortium Isolated from Trinity Peninsula, Antarctica. Biology 2021, 10, 493. [Google Scholar] [CrossRef]
  30. Polak-Berecka, M.; Waśko, A.; Kordowska-Wiater, M.; Targoński, A. Application of Response Surface Methodology to Enhancement of Biomass Production by Lactobacillus Rhamnosus E/N. Brazilian J. Microbiol. 2011, 42, 1485–1494. [Google Scholar] [CrossRef] [Green Version]
  31. Darham, S.; Syed-Muhaimin, S.N.; Subramaniam, K.; Zulkharnain, A.; Shaharuddin, N.A.; Khalil, K.A.; Ahmad, S.A. Optimisation of Various Physicochemical Variables Affecting Molybdenum Bioremediation Using Antarctic Bacterium, Arthrobacter Sp. Strain AQ5-05. Water 2021, 13, 2367. [Google Scholar] [CrossRef]
  32. Mohanty, A.K.; Misra, M.; Drzal, L.T. Surface Modifications of Natural Fibers and Performance of the Resulting Biocomposites: An Overview. Compos. Interfaces 2012, 8, 313–343. [Google Scholar] [CrossRef]
  33. Ahmad, R.; Hamid, R.; Osman, S.A. Physical and Chemical Modifications of Plant Fibres for Reinforcement in Cementitious Composites. Adv. Civ. Eng. 2019, 2019, 1–18. [Google Scholar] [CrossRef]
  34. Singer, M.M.; Aurand, D.; Bragin, G.E.; Clark, J.R.; Coelho, G.M.; Sowby, M.L.; Tjeerdema, R.S. Standardization of the Preparation and Quantitation of Water-Accommodated Fractions of Petroleum for Toxicity Testing. Mar. Pollut. Bull. 2000, 40, 1007–1016. [Google Scholar] [CrossRef]
  35. Anuzyte, E.; Vaisis, V. Natural Oil Sorbents Modification Methods for Hydrophobicity Improvement. In Energy Procedia; Elsevier Ltd.: Amsterdam, The Netherlands, 2018; Volume 147, pp. 295–300. [Google Scholar] [CrossRef]
  36. Mi, H.; Lee, W.; Chen, C.; Yang, H. Effect of Fuel Aromatic Content on PAH Emission from a Heavy-Duty Diesel Engine. Chemosphere 2000, 41, 1783–1790. [Google Scholar] [CrossRef]
  37. Ibrahim, S.; Baharuddin, S.N.I.B.; Ariffin, B.; Hanafiah, M.A.K.M.; Kantasamy, N. Cogon Grass for Oil Sorption: Characterization and Sorption Studies. In Key Engineering Materials; Trans Tech Publications Ltd.: Bäch SZ, Switzerland, 2018; Volume 775, pp. 359–364. [Google Scholar] [CrossRef]
  38. Bhattacharyya, P.; Bhaduri, D.; Adak, T.; Munda, S.; Satapathy, B.S.; Dash, P.K.; Padhy, S.R.; Pattanayak, A.; Routray, S.; Chakraborti, M.; et al. Characterization of Rice Straw from Major Cultivars for Best Alternative Industrial Uses to Cutoff the Menace of Straw Burning. Ind. Crops Prod. 2020, 143, 111919. [Google Scholar] [CrossRef]
  39. Hadidi, M.; Amoli, P.I.; Jelyani, A.Z.; Hasiri, Z.; Rouhafza, A.; Ibarz, A.; Khaksar, F.B.; Tabrizi, S.T. Polysaccharides from Pineapple Core as a Canning By-Product: Extraction Optimization, Chemical Structure, Antioxidant and Functional Properties. Int. J. Biol. Macromol. 2020, 163, 2357–2364. [Google Scholar] [CrossRef]
  40. Chinedu Onwuka, J.; Bolanle Agbaji, E.; Olatunji Ajibola, V.; Godwin Okibe, F. Treatment of Crude Oil-Contaminated Water with Chemically Modified Natural Fiber. Appl. Water Sci. 2018, 8, 86. [Google Scholar] [CrossRef] [Green Version]
  41. Imran Ullah Sarkar, M.; Nazrul Islam, M.; Jahan, A.; Islam, A.; Chandra Biswas, J. Rice Straw as a Source of Potassium for Wetland Rice Cultivation. Geology 2017, 1, 184–189. [Google Scholar] [CrossRef]
  42. Wong, C.; McGowan, T.; Bajwa, S.G.; Bajwa, D.S. Impact of fiber treatment on the oil absorption characteristics of plant fibers. BioResources 2016, 11, 6452–6463. [Google Scholar] [CrossRef] [Green Version]
  43. George, J.; Bhagawan, S.S.; Thomas, S. Effects of Environment on the Properties of Low-Density Polyethylene Composites Reinforced with Pineapple-Leaf Fibre. Compos. Sci. Technol. 1998, 58, 1471–1485. [Google Scholar] [CrossRef]
  44. Bajwa, D.S.; Sitz, E.D.; Bajwa, S.G.; Barnick, A.R. Evaluation of Cattail (Typha Spp.) for Manufacturing Composite Panels. Ind. Crops Prod. 2015, 75, 195–199. [Google Scholar] [CrossRef]
  45. Peng, X.; Ye, L.L.; Wang, C.H.; Zhou, H.; Sun, B. Temperature and Duration Dependent Rice Straw-Derived Biochar: Characteristics and Its Effects on Soil Properties of an Ultisol in Southern China. Soil Tillage Res. 2011, 112, 159–166. [Google Scholar] [CrossRef]
  46. Manikandan Nair, K.C.; Thomas, S.; Groeninckx, G. Thermal and Dynamic Mechanical Analysis of Polystyrene Composites Reinforced with Short Sisal Fibres. Compos. Sci. Technol. 2001, 61, 2519–2529. [Google Scholar] [CrossRef]
  47. Kuila, A.; Sharma, V. Lignocellulosic Biomass Production and Industrial Applications; Kuila, A., Sharma, V., Eds.; John Wiley & Sons: Hoboken, NJ, USA; Inc. Scrivener & Publishing LLC: Beverly, MA, USA, 2017. [Google Scholar]
Figure 1. Experimental setup for the filter system: (a) retort stand; (b) plastic bottle; (c) cylinder holder; (d) beaker.
Water 13 03317 g001
Figure 2. Screening of untreated (UNT) and pre-treated RS samples (the latter were heat treated at 120 °C for 20 min). Error bars represent the mean ± SEM of three replicates.
Water 13 03317 g002
Figure 3. ATR-IR spectra of untreated and pre-treated RS before wetting with oil–seawater mixture.
Water 13 03317 g003
Figure 4. ATR-IR spectra of untreated and pre-treated (120 °C) RS after wetting with oil–seawater mixture.
Water 13 03317 g004
Figure 5. Images from scanning electron microscopy (SEM, left) and outputs of EDX (right): (a) untreated rice straw before wetting with oil–seawater mixture; (b) untreated rice straw after wetting with oil–seawater mixture; (c) pre-treated rice straw before wetting with oil–seawater mixture; (d) pre-treated rice straw after wetting with oil–seawater mixture.
Water 13 03317 g005
Figure 6. The effect of temperature pre-treatment of RS on the sorption capacity and the efficiency of oil/water absorption. Error bars represent the mean ± SEM of three replicates.
Water 13 03317 g006
Figure 7. The effect of time of heating on the sorption capacity and the efficiency of oil/water absorption by RS pre-treated at 120 °C. Error bars represent the mean ± SEM of three replicates.
Water 13 03317 g007
Figure 8. The effect of packing density on the sorption capacity and efficiency of oil/water absorption of RS pre-treated at 120 °C for 20 min. Error bars represent the mean ± SEM of three replicates.
Water 13 03317 g008
Figure 9. The influence of oil concentration on the sorption capacity and the efficiency of oil/water absorption by RS heat treated at 120 °C for 20 min and at the selected packing density. Error bars represent the mean ± SEM of three replicates.
Water 13 03317 g009
Figure 10. Three-dimensional contour plots generated by Design-Expert (Stat Ease, Inc) of the model terms (a) A: time of heating and B: packing density, (b) B: time of heating and C: oil concentration and (c) B: packing density and D: oil concentration.
Water 13 03317 g010
Table 1. Experimental values and levels of factors tested with a Plackett–Burman design.
FactorsCodeUnitExperimental Range
Low (−1)High (+1)
TemperatureA°C90130
Time of heatingBmin1070
Packing densityCg cm−30.080.16
Oil concentrationD% (v/v)525
Table 2. Experimental values and levels of the selected independent factors for CCD optimization.
FactorsCodeUnitExperimental Values
−2−10+1+2
Time of heatingAmin3.1810203036.82
Packing densityBg cm−30.080.10.130.160.18
Oil concentrationC% (v/v)4.881017.52530.11
Table 3. Summary of major peaks detected in ATR-IR spectroscopic analysis of untreated and pre-treated RS before and after wetting with diesel–seawater mixture.
Wavenumber
(cm−1)
Band AssignmentsMovement/VibrationReferences
1226Si–O–Si
Si=O
Stretching of silica[13,14,22,37]
1500–1600ʋ (C=C)Stretching vibration between alkenes and aromatic functional groups
2922ʋ (C–H)One of the peaks for cellulose, CH stretching
3430–3501ʋ (O–H)Stretching of free hydroxyl groups
848Si–HPeak of silica and hydrogen interaction
1021C–O
C–O–C
A sharp and strong band is attributed to C-O stretching in cellulose, hemicelluloses and lignin or C-O-C stretching in cellulose and hemicelluloses
1637H–O–HStretching of water absorbed
1781C=OThe absorption of carbonyl stretching of ester and carboxyl groups, which are the most abundant in straw hemicellulose
2912C–HStretching vibration with the presence of alkenes/alkyl group in diesel oil
3300O–HIntermolecular hydrogen bond
Table 4. Secondary screening of significant parameters affecting diesel sorption using a Plackett–Burman design (±SEM, n = 3).
StdRunABCDResponse 1
Oil Absorbed (mL)
Response 2
Water Absorbed (mL)
31130100.162530.666715
122100100.1101615.6667
183115200.1317.519.666710
114130100.162530.666715
145115200.1317.519.666710
166115200.1317.519.666710
137115200.1317.519.666710
78130100.11016.666711.6667
99130300.161020.333318
110130300.125168.3333
411100300.12519.666710
1712115200.1317.519.666710
613100100.12521.66678.3333
814130300.1101610
1515115200.1317.519.666710
516100100.161020.333320
1017100300.162525.666711.6667
218100300.161018.666720
A: temperature (°C); B: time of heating (min); C: packing density (g cm−3); D: oil concentration % (v/v).
Table 5. ANOVA of the PBD model used to identify the factors significantly influencing diesel sorption.
SourceSum of SquaresDFMean SquareF-Valuep-Value
Model283.59470.9031.05<0.0001***
A5.7915.792.530.1374
B32.23132.2314.120.0027**
C135.561135.5659.37<0.0001***
D110.011110.0148.18<0.0001***
Curvature7.4117.413.250.0968
Residual27.40122.28
Lack of Fit27.4064.57
Pure Error0.000060.0000
Cor Total318.4017
Std. Dev.1.51R20.9119
Mean20.57Adjusted R208825
C.V.%7.34Predicted R20.7411
Adeq Precision18.4041
A: temperature (°C); B: time of heating (min); C: packing density (g cm−3); D: oil concentration % (v/v); ** p < 0.01, *** p < 0.001.
Table 6. Optimization of parameters for diesel sorption by rice straw using a central composite design (CCD).
StdRunABCResponse 1
Oil Absorbed
(mL)
Response 2
Water Absorbed
(mL)
121200.18045417.52615.6667
162200.1317.519.666715
203200.1317.519.666715
144200.1330.113422.106713
185200.1317.519.666715
46300.161019.333315
157200.1317.519.666715
28300.11012.33339
199200.1317.519.666715
101036.81790.1317.52215
111100.11016.513.3333
312100.16102116.6667
713100.16252815
1314200.134.886559.615.6667
515100.12519.333310
9163.182070.1317.524.666716
1117200.079546217.511.333315
618300.12515.666710
819300.162523.666715
1720200.1317.519.666715
A: time of heating (min); B: packing density (g cm−3); C: oil concentration % (v/v).
Table 7. Results of ANOVA for CCD model identifying factors and pairwise interactions significantly influencing diesel sorption.
SourceSum of SquaresDFMean SquareF-Valuep-Value
Model399.41944.3830.80<0.0001***
A24.57124.5717.050.0020**
B204.391204.39141.83<0.0001***
C108.731108.7375.45<0.0001***
AB0.420110.42010.29150.6011
AC0.586710.58670.40710.5378
BC3.3413.342.31550.1591
A225.97125.9718.01910.0017**
B21.3611.360.94610.3536
C224.44124.4416.95860.0021**
Residual14.41122.28
Lack of Fit14.4164.57
Pure Error060.0000
Cor Total413.8217
Std. Dev.1.20R20.9652
Mean19.48Adjusted R20.9338
C.V. %6.16Predicted R20.7307
Adeq Precision19.8858
A: time of heating (min); B: packing density (g cm−3); C: oil concentration % (v/v); ** p < 0.01, *** p < 0.001.
Table 8. Model validation using the predicted optimum factor values.
Optimized FactorsValuePredicted ValueExperimental Value
Time of heating10 min26 mL of diesel with 14 mL of seawater *26 mL of diesel with 14 mL of seawater
± 1 mL *
Packing density0.148 g cm−3
Oil concentration25% (v/v)
* The significance p-value between predicted and experimental values (p = 0.9999).
Publisher’s Note: MDPI stays neutral with regard to jurisdictional claims in published maps and institutional affiliations.

