
Integrated Multi-Attribute Preference Analysis in Fisheries and Solar Power Symbiosis Areas: A Case Study in Cigu, Taiwan


Abstract
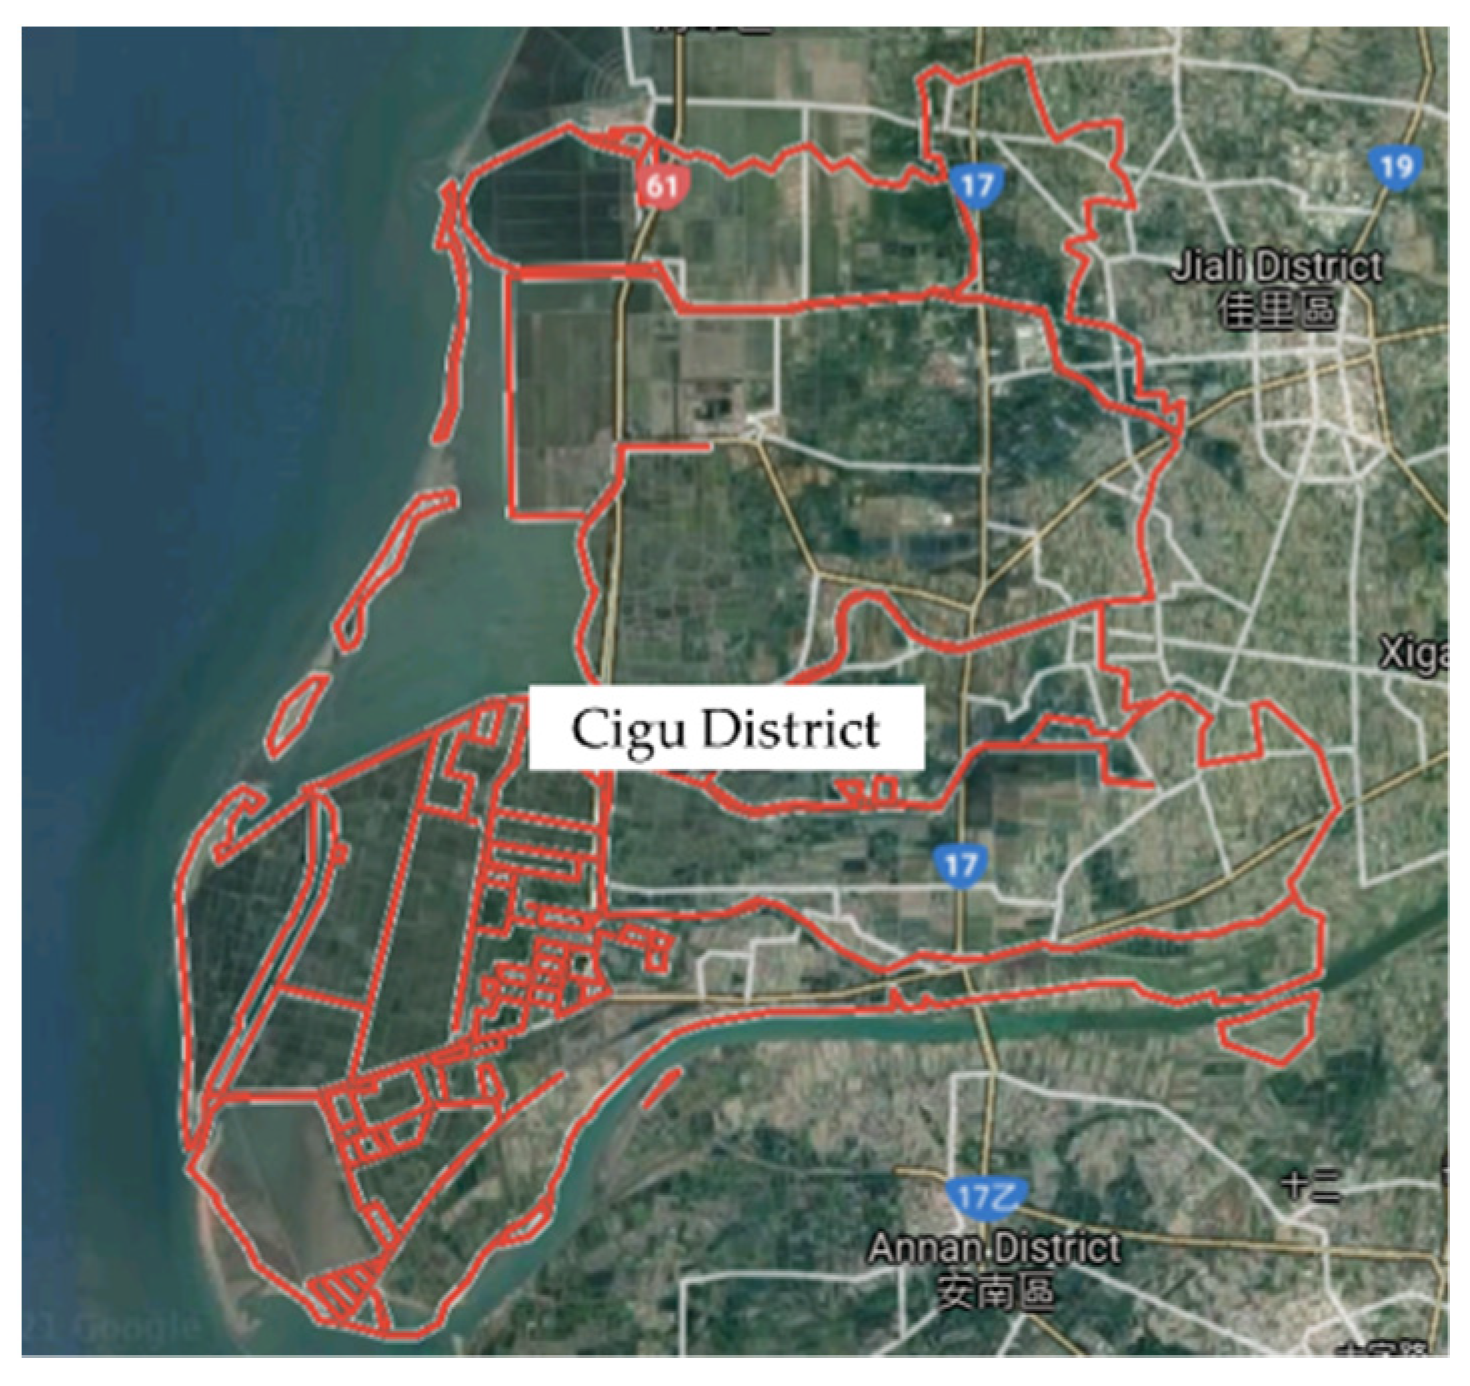
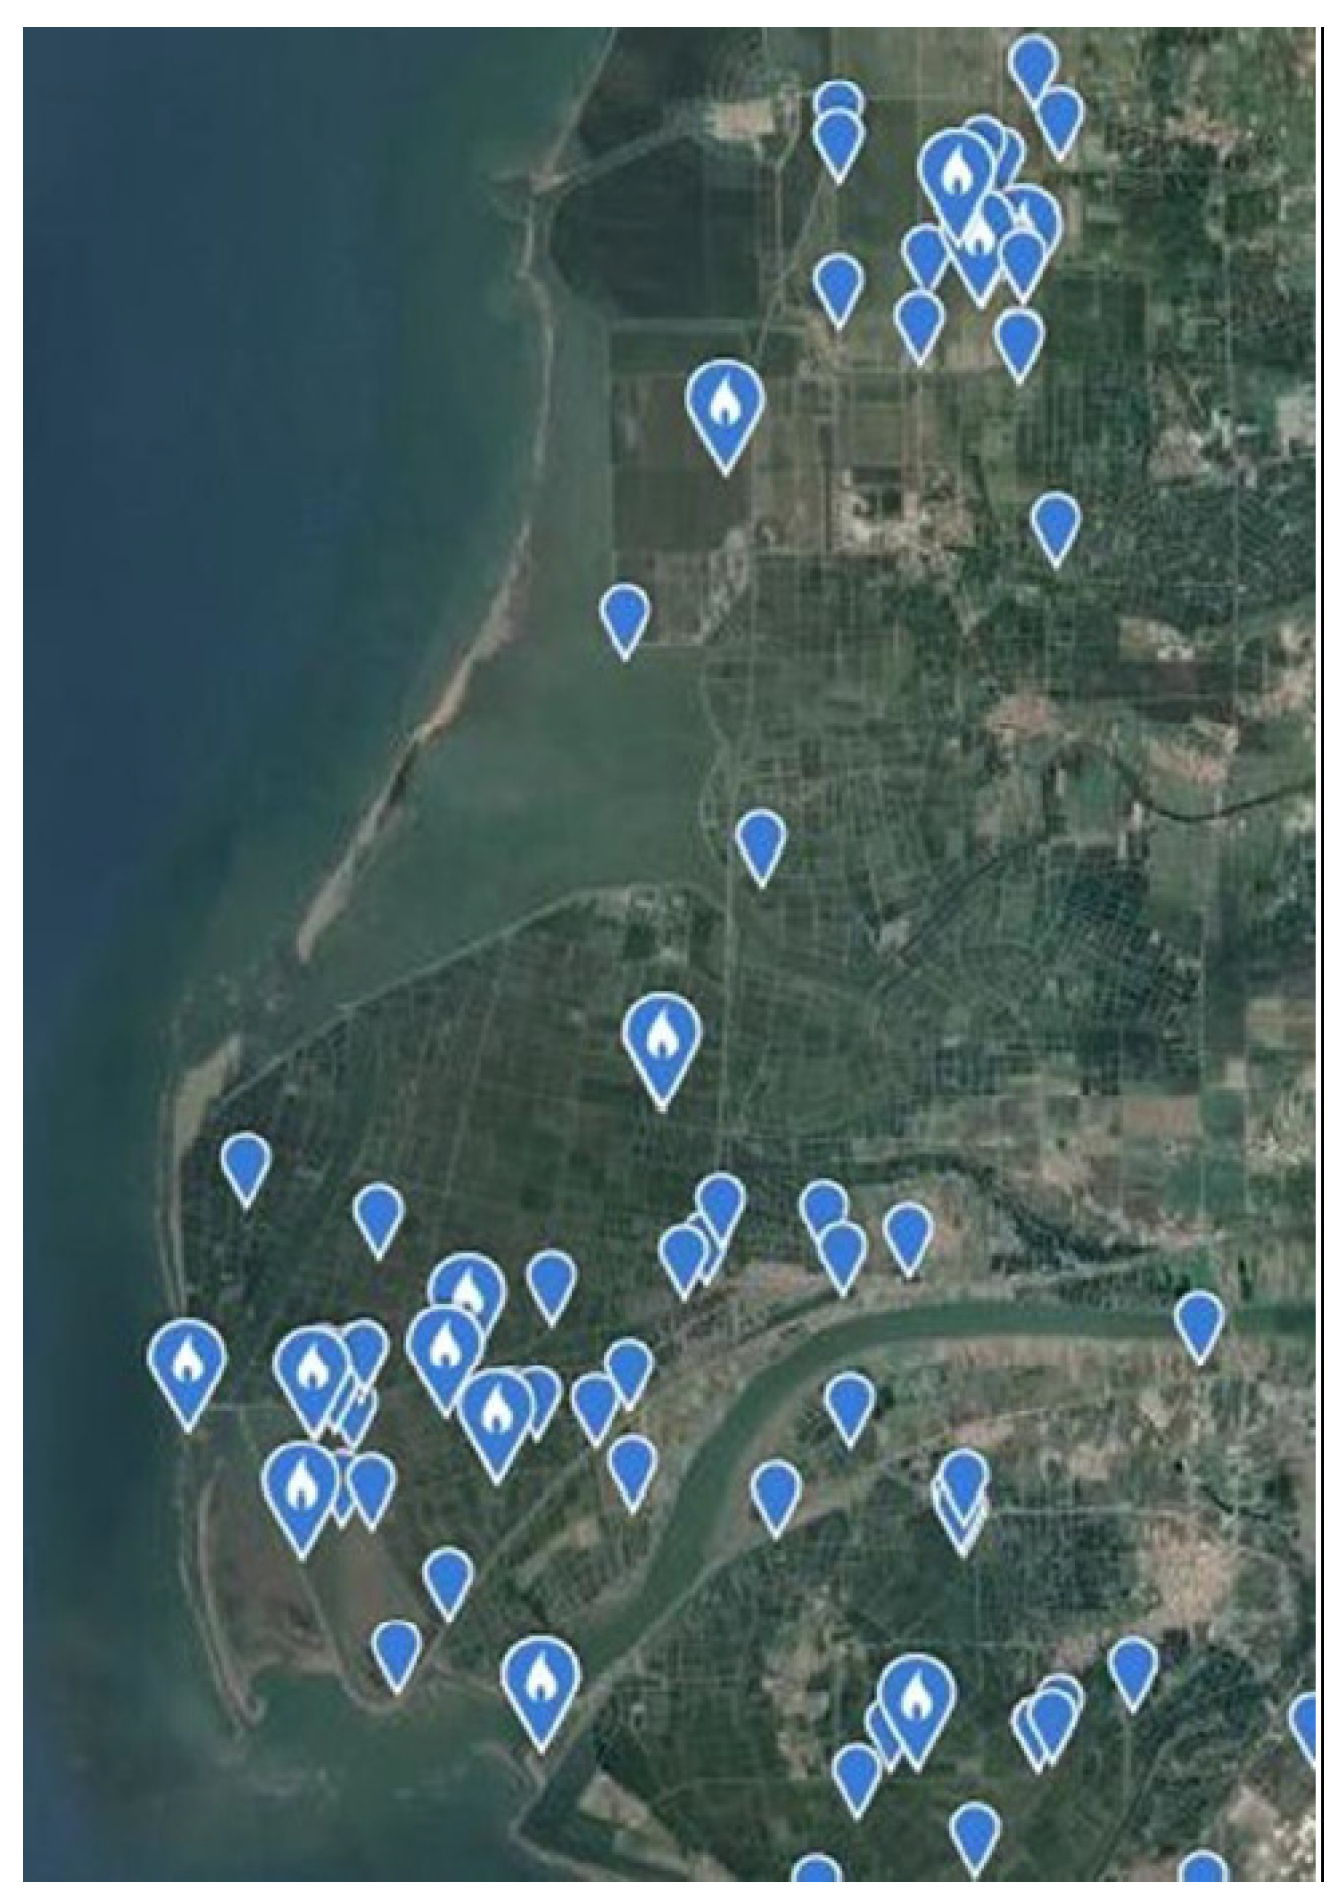
:1. Introduction
2. Materials and Methods
2.1. Nonmarket Valuation
2.2. Choice Experiment Design
2.2.1. Biodiversity
2.2.2. Land Use Patterns
2.2.3. Fisheries and Solar Power Symbiosis Coverage Ratio
2.2.4. Coastal Landscape
2.2.5. Ecocompensation Fund
2.3. Model Selection and Analysis
3. Results
3.1. Data Collection and Descriptive Statistics
3.2. Model Results
3.2.1. Explanation of Variables in the Empirical Model
3.2.2. Multinomial Logit Results
3.2.3. Willingness to Pay Measures
4. Discussion
4.1. Combination of Choices Preferred by Respondents
4.2. Discussion on Differences of Respondents
5. Conclusions
5.1. Findings
5.2. Recommendations
- The government should plan special FSPS areas in recreational scenic spots to educate tourists about the operational manner and purpose of FSPS through models, educational programs and promotional videos and collect tourists’ comments for improving future administration;
- FSPS’s influences on the original ecosystem services are inevitable, but the harm can be remedied and recovered with ecocompensation, which is acceptable to most respondents. Therefore, this study recommends that in reviewing FSPS cases, the government should evaluate the maintenance plan for environmental conservation after implementation and assessment of some aspects of the ecocompensation fund, including effectiveness, reasonableness, and sustainability;
- Tourists, local residents, and aquaculture farmers prefer maintaining the status quo of the land use pattern, and this is reflected in that most respondents prefer “ecological remediation” to “ecosystem creation”. Therefore, the land use pattern of FSPS should follow the principle of maintaining the status quo and achieve biodiversity improvement through ecological remediation.
5.3. Directions for Future Studies
Author Contributions
Funding
Institutional Review Board Statement
Informed Consent Statement
Data Availability Statement
Acknowledgments
Conflicts of Interest
References
- Woo, J.; Chung, S.; Lee, C.Y.; Huh, S.Y. Willingness to participate in community-based renewable energy projects: A contingent valuation study in South Korea. Renew. Sustain. Energy Rev. 2019, 112, 643–652. [Google Scholar] [CrossRef]
- Baldwin, E.; Carley, S.; Nicholson-Crotty, S. Why do countries emulate each others’ policies? A global study of renewable energy policy diffusion. World Dev. 2019, 120, 29–45. [Google Scholar] [CrossRef]
- Swain, R.B.; Karimu, A. Renewable electricity and sustainable development goals in the EU. World Dev. 2020, 125, 104693. [Google Scholar] [CrossRef]
- Bigerna, S.; Bollino, C.A.; Micheli, S. Renewable energy scenarios for costs reductions in the European Union. Renew. Energy 2016, 96, 80–90. [Google Scholar]
- Connolly, D.; Lund, H.; Mathiesen, B.V. Smart energy Europe: The technical and economic impact of one potential 100% renewable energy scenario for the European Union. Renew. Sustain. Energy Rev. 2016, 60, 1634–1653. [Google Scholar] [CrossRef]
- Kemfert, C. Germany must go back to its low-carbon future. Nature 2017, 549, 26–27. [Google Scholar] [CrossRef] [Green Version]
- Hong, S.; Brook, B.W. A nuclear-to-gas transition in South Korea: Is it environmentally friendly or economically viable? Energy Policy 2018, 112, 67–73. [Google Scholar] [CrossRef]
- Taipower. Power Generation Information. Available online: https://www.taipower.com.tw/tc/page.aspx?mid=204 (accessed on 11 May 2021).
- Taiyen Green Energy. What Is Fisheries and Solar Power Symbiosis. Available online: https://www.tygreen.com.tw/faq/3/ (accessed on 11 March 2021).
- Fishery Office, Agriculture Committee of the Executive Yuan of Taiwan. 2019. Available online: https://fadopen.fa.gov.tw/fadopen/service/qrySpeciesSummaryYearlyReport.htmx (accessed on 11 May 2021).
- Spellman, F.R. Environmental Impacts of Renewable Energy; Taylor & Francis Group: Boca Raton, FL, USA, 2014. [Google Scholar]
- Hernandez, R.R.; Hoffacker, M.K.; Murphy-Mariscal, M.L.; Wu, G.C.; Allen, M.F. Solar energy development impacts on land cover change and protected areas. Proc. Natl. Acad. Sci. USA 2015, 112, 13579–13584. [Google Scholar] [CrossRef] [Green Version]
- Dhar, A.; Naeth, M.A.; Jennings, P.D.; El-Din, M.G. Perspectives on environmental impacts and a land reclamation strategy for solar and wind energy systems. Sci. Total Environ. 2020, 718, 134602. [Google Scholar] [CrossRef] [PubMed]
- Bennett, M.T.; Gong, Y.; Scarpa, R. Hungry birds and angry farmers: Using choice experiments to assess “eco-compensation” for coastal wetlands protection in China. Ecol. Econ. 2018, 154, 71–87. [Google Scholar] [CrossRef] [Green Version]
- Staples, A.J.; Reeling, C.J.; Widmar, N.J.O.; Lusk, J.L. Consumer willingness to pay for sustainability attributes in beer: A choice experiment using eco-labels. Agribusiness 2020, 36, 591–612. [Google Scholar] [CrossRef]
- Dauda, S.; Sidique, S.F.; Sheng, T.Y.; Djama, M. Consumer Preference for Certified Sustainable Palm Oil with Environmental Sustainability Attributes: A Choice Experiment Approach. Stud. Appl. Econ. 2021, 39. [Google Scholar] [CrossRef]
- Kim, J.H.; Kim, Y.; Yoo, S.H. Using a choice experiment to explore the public willingness to pay for the impacts of improving energy efficiency of an apartment. Qual. Quant. 2021, 55, 1775–1793. [Google Scholar] [CrossRef]
- Liu, J.; Dou, S.; Hmeimar, A.E.H. Cost-effectiveness analysis of different types of payments for ecosystem services: A case in the urban wetland ecosystem. J. Clean. Prod. 2020, 249, 119325. [Google Scholar]
- TEEB. The Economics of Ecosystems and Biodiversity: Ecological and Economic Foundations; Kumar, P., Ed.; Earthscan Publications: London, UK; Washington, DC, USA, 2010. [Google Scholar]
- Muradian, R.; Corbera, E.; Pascual, U.; Kosoy, N.; May, P.H. Reconciling theory and practice: An alternative conceptual framework for understanding payments for environmental services. Ecol. Econ. 2010, 69, 1202–1208. [Google Scholar] [CrossRef]
- Kumar, P.; Kumar, M.; Garrett, L. Behavioural foundation of response policies for ecosystem management: What can we learn from payments for ecosystem services (PES). Ecosyst. Serv. 2014, 10, 128–136. [Google Scholar] [CrossRef]
- Japelj, A.; Mavsar, R.; Hodges, D.; Kovač, M.; Juvančič, L. Latent preferences of residents regarding an urban forest recreation setting in Ljubljana, Slovenia. Forest Policy Econ. 2016, 71, 71–79. [Google Scholar] [CrossRef]
- King, D.M.; Mazzotta, M.; Markowitz, K.J. Ecosystem Valuation. 2000. Available online: https://ecosystemvaluation.org/ (accessed on 19 October 2021).
- Mark, T.L.; Swait, J. Using stated preference and revealed preference modeling to evaluate prescribing decisions. Health Econ. 2004, 13, 563–573. [Google Scholar] [CrossRef] [PubMed]
- Choi, A.S.; Ritchie, B.W.; Papandrea, F.; Bennett, J. Economic valuation of cultural heritage sites: A choice modeling approach. Tourism Manag. 2010, 31, 213–220. [Google Scholar] [CrossRef]
- Rudd, R.A. National values for reginal aquatic species at risk in Canada. Endanger. Species Res. 2009, 6, 239–249. [Google Scholar] [CrossRef]
- Hoyos, D. The state of the art of environmental valuation with discrete choice experiments. Ecol. Econ. 2010, 69, 1595–1603. [Google Scholar] [CrossRef]
- Jaung, W.; Putzel, L.; Bull, G.Q.; Guariguata, M.R.; Sumaila, U.R. Estimating demand for certification of forest ecosystem services: A choice experiment with Forest Stewardship Council certificate holders. Ecosyst. Serv. 2016, 22, 193–201. [Google Scholar] [CrossRef]
- Rulleau, B.; Dumax, N.; Rozan, A. Eliciting preferences for wetland services: A way to manage conflicting land uses. J. Environ. Plan. Manag. 2017, 60, 309–327. [Google Scholar] [CrossRef]
- Liu, T.M.; Yang, W.C. Using choice experiments to inform management of black-faced spoonbill reserve in Taiwan. Cogent Soc. Sci. 2019, 5, 1611984. [Google Scholar] [CrossRef]
- Xi, Z.; Xu, W.; Wei, Q. Value attributes and user preferences for the coastal wetland ecosystem in Caofeidian, China. IOP Conf. Ser. Mater. Sci. Eng. 2018, 392, 042017. [Google Scholar] [CrossRef]
- Huang, Y.S.; Chen, Y.J.; Ting, C.T. Estimation the preference of ecotourism for Gaomei wetland in Taiwan. EcoForum J. 2018, 7, 14. [Google Scholar]
- Owuor, M.A.; Mulwa, R.; Otieno, P.; Icely, J.; Newton, A. Valuing mangrove biodiversity and ecosystem services: A deliberative choice experiment in Mida Creek, Kenya. Ecosyst. Serv. 2019, 40, 101040. [Google Scholar] [CrossRef]
- Mao, B.; Ao, C.; Wang, J.; Xu, L. The importance of loss aversion in public preferences for wetland management policies: Evidence from a choice experiment with reference-dependent discrete choice model. Wetlands 2020, 40, 599–608. [Google Scholar] [CrossRef]
- Hassan, S.; Olsen, S.B.; Thorsen, B.J. Urban–rural divides in preferences for wetland conservation in Malaysia. Land Use Policy 2019, 84, 226–237. [Google Scholar] [CrossRef]
- Kim, K.J.; Lee, H.; Koo, Y. Research on local acceptance cost of renewable energy in South Korea: A case study of photovoltaic and wind power projects. Energy Policy 2020, 144, 111684. [Google Scholar] [CrossRef]
- Zhao, Q.; Bai, J.; Huang, L.; Gu, B.; Lu, Q.; Gao, Z. A review of methodologies and success indicators for coastal wetland restoration. Ecol. Indic. 2016, 60, 442–452. [Google Scholar] [CrossRef]
- Tan, Y.; Lv, D.; Cheng, J.; Wang, D.; Mo, W.; Xiang, Y. Valuation of environmental improvements in coastal wetland restoration: A choice experiment approach. Glob. Ecol. Conserv. 2018, 15, e00440. [Google Scholar] [CrossRef]
- Chen, W.; Cao, C.; Liu, D.; Tian, R.; Wu, C.; Wang, Y.; Qian, Y.; Ma, G.; Bao, D. An evaluating system for wetland ecological health: Case study on nineteen major wetlands in Beijing-Tianjin-Hebei region, China. Sci. Total Environ. 2019, 666, 1080–1088. [Google Scholar] [CrossRef] [PubMed]
- Barbier, E.B.; Koch, E.W.; Silliman, B.R.; Hacker, S.D.; Wolanski, E.; Primavera, J.; Granek, E.F.; Polasky, S.; Aswani, S.; Cramer, L.A.; et al. Coastal ecosystem-based management with nonlinear ecological functions and values. Science 2008, 319, 321–323. [Google Scholar] [CrossRef]
- Barbier, E.B.; Hacker, S.D.; Kennedy, C.; Koch, E.W.; Stier, A.C.; Silliman, B.R. The value of estuarine and coastal ecosystem services. Ecol. Monogr. 2011, 81, 169–193. [Google Scholar] [CrossRef]
- Himes-Cornell, A.; Pendleton, L.; Atiyah, P. Valuing ecosystem services from blue forests: A systematic review of the valuation of salt marshes, sea grass beds and mangrove forests. Ecosyst. Serv. 2018, 30, 36–48. [Google Scholar] [CrossRef]
- Suziana, H. Environmental attitudes and preference for wetland conservation in Malaysia. J. Nat. Conserv. 2017, 37, 133–145. [Google Scholar] [CrossRef]
- Liekens, I.; Schaafsma, M.; De Nocker, L.; Broekx, S.; Staes, J.; Aertsens, J.; Brouwer, R. Developing a value function for nature development and land use policy in Flanders, Belgium. Land Use Policy 2013, 30, 549–559. [Google Scholar] [CrossRef]
- Boavida-Portugal, I.; Rocha, J.; Ferreira, C.C. Exploring the impacts of future tourism development on land use/cover changes. Appl. Geogr. 2016, 77, 82–91. [Google Scholar] [CrossRef]
- Quintas-Soriano, C.; Castro, A.J.; Castro, H.; García-Llorente, M. Impacts of land use change on ecosystem services and implications for human well-being in Spanish drylands. Land Use Policy 2016, 54, 534–548. [Google Scholar] [CrossRef]
- Erb, K.H. How a socio-ecological metabolism approach can help to advance our understanding of changes in land-use intensity. Ecol. Econ. 2012, 76, 8. [Google Scholar] [CrossRef] [PubMed] [Green Version]
- Dai, J.; Zhang, C.; Lim, H.V.; Ang, K.K.; Qian, X.; Wong, J.L.H.; Tan, S.T.; Wang, C.L. Design and construction of floating modular photovoltaic system for water reservoirs. Energy 2020, 191, 116549. [Google Scholar] [CrossRef]
- Shao, W.; Liu, J.; Zhu, M.; Weng, B.; Wang, N.; Huang, H.; Yu, Y.; Yan, D.; Jiang, S. Evaluation of a photovoltaic water-supply scheme for the surface water system in Xiamen, China. Appl. Energy 2018, 230, 357–373. [Google Scholar] [CrossRef]
- Spencer, R.S.; Macknick, J.; Aznar, A.; Warren, A.; Reese, M.O. Floating photovoltaic systems: Assessing the technical potential of photovoltaic systems on man-made water bodies in the continental United States. Environ. Sci. Technol. 2019, 53, 1680–1689. [Google Scholar] [CrossRef] [PubMed]
- Taboada, M.E.; Cáceres, L.; Graber, T.A.; Galleguillos, H.R.; Cabeza, L.F.; Rojas, R. Solar water heating system and photovoltaic floating cover to reduce evaporation: Experimental results and modeling. Renew. Energy 2017, 105, 601–615. [Google Scholar] [CrossRef] [Green Version]
- Wen, C.; Dallimer, M.; Carver, S.; Ziv, G. Valuing the visual impact of wind farms: A calculus method for synthesizing choice experiments studies. Sci. Total Environ. 2018, 637–638, 58–68. [Google Scholar] [CrossRef]
- Lee, H.J.; Yoo, S.H.; Huh, S.Y. Public perspectives on reducing the environmental impact of onshore wind farms: A discrete choice experiment in South Korea. Environ. Sci. Pollut. Res. Int. 2020, 27, 25582–25599. [Google Scholar] [CrossRef]
- Kermagoret, C.; Levrel, H.; Carlier, A.; Dachary-Bernard, J. Individual preferences regarding environmental offset and welfare compensation: A choice experiment application to an offshore wind farm project. Ecol. Econ. 2016, 129, 230–240. [Google Scholar] [CrossRef]
- Westerberg, V.; Jacobsen, J.B.; Lifran, R. The case for offshore wind farms, artificial reefs and sustainable tourism in the French Mediterranean. Tourism Manag. 2013, 34, 172–183. [Google Scholar] [CrossRef] [Green Version]
- Alalwan, A.A. Mobile food ordering apps: An empirical study of the factors affecting customer e-satisfaction and continued intention to reuse. Int. J. Inf. Manag. 2020, 50, 28–44. [Google Scholar] [CrossRef]
- Egoh, B.N.; Reyers, B.; Carwardine, J.; Bode, M.; O’Farrell, P.J.; Wilson, K.A.; Possingham, H.P.; Rouget, M.; de Lange, W.; Richardson, D.M.; et al. Safeguarding biodiversity and ecosystem services in the Little Karoo, South Africa. Conserv. Biol. 2010, 24, 1021–1030. [Google Scholar] [CrossRef]
- Haines-Young, R.; Potschin, M. The links between biodiversity, ecosystem services and human well-being. In Ecosystem Ecology: A New Synthesis; Raffaelli, D., Frid, C., Eds.; Cambridge University Press: Cambridge, UK, 2010; pp. 110–139. [Google Scholar]
- Ntanos, S.; Kyriakopoulos, G.; Chalikias, M.; Arabatzis, G.; Skordoulis, M. Public perceptions and willingness to pay for renewable energy: A case study from Greece. Sustainability 2018, 10, 687. [Google Scholar] [CrossRef] [Green Version]
- Bigerna, S.; Polinori, P. Italian households’ willingness to pay for green electricity. Renew. Sustain. Energy Rev. 2014, 34, 110–121. [Google Scholar] [CrossRef]
- Xie, B.C.; Zhao, W. Willingness to pay for green electricity in Tianjin, China: Based on the contingent valuation method. Energy Policy 2018, 114, 98–107. [Google Scholar] [CrossRef]
- Koto, P.S.; Yiridoe, E.K. Expected willingness to pay for wind energy in Atlantic Canada. Energy Policy 2019, 129, 80–88. [Google Scholar] [CrossRef]
- Shoyama, K.; Managi, S.; Yamagata, Y. Public preferences for biodiversity conservation and climate-change mitigation: A choice experiment using ecosystem services indicators. Land Use Policy 2013, 34, 282–293. [Google Scholar] [CrossRef]
- Lee, H.J.; Yoo, S.H.; Huh, S.Y. Economic benefits of introducing LNG-fuelled ships for imported flour in South Korea. Transp. Res. D 2020, 78, 102220. [Google Scholar] [CrossRef]
- Kunwar, S.B.; Bohara, A.K.; Thacher, J. Public preference for river restoration in the Danda Basin, Nepal: A choice experiment study. Ecol. Econ. 2020, 175, 106690. [Google Scholar] [CrossRef]
- Peri, E.; Becker, N.; Tal, A. What really undermines public acceptance of wind turbines? A choice experiment analysis in Israel. Land Use Policy 2020, 99, 105113. [Google Scholar] [CrossRef]
- Müller, A.; Olschewski, R.; Unterberger, C.; Knoke, T. The valuation of forest ecosystem services as a tool for management planning—A choice experiment. J. Environ. Manag. 2020, 271, 111008. [Google Scholar] [CrossRef] [PubMed]
- Borchers, A.M.; Duke, J.M.; Parsons, G.R. Does willingness to pay for green energy differ by source? Energy Policy 2007, 35, 3327–3334. [Google Scholar] [CrossRef]
- Lee, C.Y.; Lee, M.K.; Yoo, S.H. Willingness to pay for replacing traditional energies with renewable energy in South Korea. Energy 2017, 128, 284–290. [Google Scholar] [CrossRef]
- Müller, A.; Knoke, T.; Olschewski, R. Can existing estimates for ecosystem service values inform forest management? Forests 2019, 10, 132. [Google Scholar] [CrossRef] [Green Version]
- Strazzera, E.; Mura, M.; Contu, D. Combining choice experiments with psychometric scales to assess the social acceptability of wind energy projects: A latent class approach. Energy Policy 2012, 48, 334–347. [Google Scholar] [CrossRef]
- Dimitropoulos, A.; Kontoleon, A. Assessing the determinants of local acceptability of wind-farm investment: A choice experiment in the Greek Aegean Islands. Energy Policy 2009, 37, 1842–1854. [Google Scholar] [CrossRef]
- Luhmann, N. The world society as a social system. Int. J. Gen. Syst. 1982, 8, 131–138. [Google Scholar]
- Bartczak, A. The role of social and environmental attitudes in non-market valuation. Forest Policy Econ. 2015, 50, 357–365. [Google Scholar] [CrossRef]
- Torgler, B.; Garcia-Valiñas, M.A. The determinants of individuals’ attitudes towards preventing environmental damage. Ecol. Econ. 2007, 63, 536–552. [Google Scholar] [CrossRef] [Green Version]
- Israel, D.; Levinson, A. Willingness to pay for environmental quality: Testable empirical implications of the growth and environment literature. Contrib. Econ. Anal. Policy 2004, 3, 31. [Google Scholar] [CrossRef]
- Ning, J.; Jin, J.; Kuang, F.; Wan, X.; Zhang, C.; Guan, T. The valuation of grassland ecosystem services in Inner Mongolia of China and its spatial differences. Sustainability 2019, 11, 7117. [Google Scholar] [CrossRef] [Green Version]
- Burch, C.; Busch, M.; Higgins, E.; Bittner, S.; Perera, N.; Neal, K.; Burkett, L.; Castro, A.; Anderson, C. Revisiting a water conflict in southeastern Oklahoma 6 years later: A new valuation of the willingness to pay for ecosystem services. Sustainability 2020, 12, 819. [Google Scholar] [CrossRef] [Green Version]
- Kollmann, A.; Reichl, J.; Schneider, F. Who is willing to pay for the environment in the EU—An empirical analysis. EuroEconomica 2013, 31, 15–27. [Google Scholar]


| Attribute | Scheme 1 | Scheme 2 | Status Quo |
|---|---|---|---|
| Biodiversity |  Improving biodiversity |  Maintaining biodiversity |  Maintaining biodiversity |
| Land use pattern |  Maintaining the status quo |  Increasing the area of solar power facilities |  Maintaining the status quo |
| FSPS coverage ratio |  40% coverage ratio |  70% coverage ratio |  0% coverage ratio |
| Coastal landscape |  Floating solar power facilities landscape |  Fixed solar power facilities landscape | 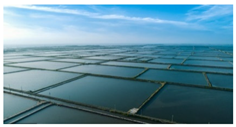 Aqua farm landscape |
| Ecocompensation fund | NT$500/year | NT$250/year | Maintaining status quo |
| Scheme selection (Choose one from the three) | □ | □ | □ |
| No. | 1 | 3 | 6 | 12 | 17 | 25 |
|---|---|---|---|---|---|---|
| 3 | 1 × 3 | |||||
| 6 | 1 × 6 | 3 × 6 | ||||
| 12 | 1 × 12 | 3 × 12 | 6 × 12 | |||
| 17 | 1 × 17 | 3 × 17 | 6 × 17 | 12 × 17 | ||
| 25 | 1 × 25 | 3 × 25 | 6 × 25 | 12 × 25 | 17 × 25 |
| Variable | Item | Tourists (N = 400) | Local Residents (N = 405) | Aquaculture Farmers (N = 169) | |||
|---|---|---|---|---|---|---|---|
| N | % | N | % | N | % | ||
| Gender | Male | 203 | 50.8% | 205 | 50.6% | 141 | 83.4% |
| Female | 197 | 49.2% | 200 | 49.4% | 28 | 16.6% | |
| Age (years) | Under 19 | 45 | 11.2% | 7 | 1.8% | 0 | 0.0% |
| 20–29 | 82 | 20.4% | 9 | 2.3% | 0 | 0.0% | |
| 30–39 | 97 | 24.3% | 83 | 20.6% | 14 | 8.3% | |
| 40–49 | 71 | 17.8% | 105 | 25.6% | 52 | 30.8% | |
| 50–59 | 55 | 13.7% | 84 | 20.8% | 58 | 34.3% | |
| 60–69 | 32 | 8.1% | 71 | 17.6% | 30 | 17.8% | |
| 70 above | 18 | 4.5% | 46 | 11.3% | 15 | 8.9% | |
| Education level | Junior high school | 33 | 8.2% | 67 | 16.6% | 52 | 30.8% |
| Senior high/vocational school | 68 | 17.0% | 156 | 38.4% | 45 | 26.6% | |
| Junior college | 105 | 26.2% | 102 | 25.2% | 39 | 23.1% | |
| Bachelor’s degree | 139 | 34.8% | 52 | 12.8% | 26 | 15.4% | |
| Master’s degree & above | 55 | 13.8% | 28 | 7.0% | 7 | 4.1% | |
| Average personal income per month | NT$20,000 and below | 73 | 18.2% | 59 | 14.6% | 5 | 3.0% |
| NT$20,001–40,000 | 122 | 30.2% | 115 | 28.2% | 17 | 10.1% | |
| NT$40,001–60,000 | 99 | 24.8% | 92 | 22.8% | 89 | 52.7% | |
| NT$60,001–80,000 | 58 | 14.6% | 92 | 22.8% | 46 | 27.2% | |
| NT$80,001–100,000 | 30 | 7.6% | 26 | 6.4% | 8 | 4.7% | |
| NT$100,000 and above | 18 | 4.6% | 21 | 5.2% | 4 | 2.4% | |
| Participation in environmental groups | Yes | 29 | 7.2% | 13 | 3.2% | 3 | 1.8% |
| No | 371 | 92.8% | 392 | 96.8% | 166 | 98.2% | |
| Preference for ecocompensation | Ecological remediation | 299 | 74.7% | 307 | 75.7% | 137 | 81.1% |
| Ecosystem creation | 101 | 25.3% | 98 | 24.3% | 32 | 18.9% | |
| Item | Options | Tourists | Local Residents | Aquaculture Farmers | |||
|---|---|---|---|---|---|---|---|
| N | % | N | % | N | % | ||
| Do you believe that “solar power generation” harms the environment? | Yes | 325 | 81.2% | 345 | 85.1% | 148 | 87.8% |
| No | 63 | 15.8% | 45 | 11.2% | 15 | 9.1% | |
| No idea | 12 | 3.0% | 15 | 3.7% | 5 | 3.1% | |
| Have your heard that the government will develop “Fisheries and Solar Power Symbiosis (FSPS)” in the Cigu region of Tainan? | Yes | 322 | 80.6% | 353 | 87.1% | 160 | 94.5% |
| No | 78 | 19.4% | 52 | 12.9% | 9 | 5.5% | |
| Do you believe that the development of “FSPS” will influence the production output of the aquaculture and fisheries? | Yes | 327 | 81.8% | 347 | 85.6% | 155 | 92.0% |
| No | 61 | 15.2% | 45 | 11.2% | 11 | 6.7% | |
| No idea | 12 | 3.0% | 13 | 3.2% | 2 | 1.3% | |
| Do you believe that the construction of the FSPS facilities will influence the surrounding ecosystem? | Yes | 327 | 81.7% | 337 | 83.3% | 147 | 86.7% |
| No | 53 | 13.2% | 58 | 14.4% | 20 | 11.6% | |
| No idea | 20 | 5.1% | 9 | 2.3% | 3 | 1.7% | |
| Do you agree with the prevention or mitigation of the hazards to the ecosystem via “ecocompensation”? | Yes | 283 | 70.8% | 297 | 73.4% | 125 | 74.2% |
| No | 60 | 14.9% | 45 | 11.2% | 20 | 12.0% | |
| No idea | 57 | 14.3% | 62 | 15.4% | 23 | 13.8% | |
| Average value | Standard deviation | Average value | Standard deviation | Average value | Standard deviation | ||
| How well do you know about “FSPS”? | 5.13 | 0.47 | 5.32 | 0.68 | 5.47 | 0.58 | |
| How well do you know about “ecocompensation”? | 5.17 | 0.62 | 5.22 | 0.91 | 5.32 | 0.66 | |
| No. | Biodiversity | Land Use Patterns | Fishery and Solar Power Symbiosis Coverage Ratio | Coastal Landscape | Ecocompensation Fund | Tourists | Local Residents | Aquaculture Farmers | |||
|---|---|---|---|---|---|---|---|---|---|---|---|
| N | % | N | % | N | % | ||||||
| 1 | Improving biodiversity | Maintaining the status quo | 40% coverage ratio | Floating solar power facilities landscape | NT$500/year | 190 | 23.70% | 171 | 21.10% | 79 | 23.30% |
| 3 | Maintaining the number of species | Maintaining the status quo | 70% coverage ratio | Fixed solar power facilities landscape | NT$250/year | 114 | 14.30% | 126 | 15.50% | 43 | 12.80% |
| 6 | Maintaining the number of species | Maintaining the status quo | 70% coverage ratio | Fixed solar power facilities landscape | NT$50/year | 97 | 12.10% | 87 | 10.80% | 38 | 11.10% |
| 12 | Maintaining the number of species | Increasing the afforestation area | Coverage ratio of 40% | Floating solar power facilities landscape | NT$250/year | 157 | 19.60% | 141 | 17.40% | 60 | 17.80% |
| 17 | Improving biodiversity | Maintaining the status quo | 40% coverage ratio | Fixed solar power facilities landscape | NT$1,000/year | 58 | 7.20% | 47 | 5.80% | 18 | 5.20% |
| 23 | Maintaining the number of species | Maintaining the status quo | 0% coverage ratio | Aqua farm landscape | NT$0/year | 89 | 11.10% | 115 | 14.20% | 48 | 14.10% |
| 25 | Improving biodiversity | Increasing the solar panel area | 40% coverage ratio | Fixed solar power facilities landscape | NT$250/year | 96 | 12.00% | 123 | 15.20% | 53 | 15.70% |
| Variable Name | Variable Designation | Variable Code | Expected Symbol | |
|---|---|---|---|---|
| Attribute level value | Biodiversity | BD1 | “−1” stands for maintaining the number of species “1” stands for improving biodiversity “0” stands for reducing biodiversity | + |
| BD2 | “−1” stands for maintaining the number of species “1” stands for reducing biodiversity “0” stands for improving biodiversity | − | ||
| Land use pattern | LU1 | “−1” stands for maintaining the status quo “1” stands for increasing afforestation area “0” stands for increasing the solar panel area | + | |
| LU2 | “−1” stands for maintaining the status quo “1” stands for increasing the solar panel area “0” stands for increasing afforestation area | − | ||
| Fishery and solar power symbiosis coverage ratio | SH1 | “−1” stands for the 0% coverage ratio “1” stands for the 40% coverage ratio “0” stands for the 70% coverage ratio | − | |
| SH2 | “−1” stands for the 0% coverage ratio “1” stands for the 70% coverage ratio “0” stands for the 40% coverage ratio | − | ||
| Coastal landscape | PN1 | “−1” stands for the aqua farm landscape “1” stands for the fixed solar power facilities landscape “0” stands for the floating solar power facilities landscape | − | |
| PN2 | “−1” stands for the aqua farm landscape “1” stands for the floating solar power facilities landscape “0” stands for the fixed solar power facilities landscape | + | ||
| Ecocompensation fund | CS | “0” stands for NT$0/year “250” stands for NT$250/year “500” stands for NT$500/year “750” stands for NT$750/year “1000” stands for NT$1000/year | − |
| Model 1—Tourists | Model 2—Tourists | Model 1—Local Residents | Model 2—Local Residents | Model 1—Aquaculture Farmers | Model 2—Aquaculture Farmers | |||||||||||||
|---|---|---|---|---|---|---|---|---|---|---|---|---|---|---|---|---|---|---|
| Variable Designation | Coefficient | Standard Error | p Value | Coefficient | Standard Error | p Value | Coefficient | Standard Error | p Value | Coefficient | Standard Error | p Value | Coefficient | Standard Error | p Value | Coefficient | Standard Error | p Value |
| BD1 | 0.2666 *** | 0.1883 | 0.0000 | 0.3102 *** | 0.1624 | 0.0000 | 0.2832 *** | 0.1773 | 0.0000 | 0.3302 *** | 0.1524 | 0.0000 | 0.3012 *** | 0.2081 | 0.0000 | 0.3413 *** | 0.1734 | 0.0000 |
| BD2 | −0.2337 *** | 0.1592 | 0.0000 | −0.2584 *** | 0.1133 | 0.0000 | −0.2526 *** | 0.1698 | 0.0000 | −0.2484 *** | 0.1122 | 0.0000 | −0.2782 *** | 0.1778 | 0.0000 | −0.2722 *** | 0.1211 | 0.0000 |
| LU1 | 0.2314 ** | 0.2149 | 0.0029 | 0.2013 *** | 0.1149 | 0.0007 | 0.2422 ** | 0.2203 | 0.0021 | 0.2113 *** | 0.1433 | 0.0000 | 0.2023 ** | 0.2236 | 0.0018 | 0.2501 *** | 0.1333 | 0.0000 |
| LU2 | −0.2114 *** | 0.1213 | 0.0007 | −0.1714 *** | 0.1247 | 0.0008 | −0.2014 *** | 0.1513 | 0.0000 | −0.1664 *** | 0.1244 | 0.0002 | −0.2144 *** | 0.1444 | 0.0002 | −0.1833 *** | 0.1189 | 0.0002 |
| SH1 | −0.1921 *** | 0.1712 | 0.0000 | −0.1954 *** | -0.1338 | 0.0000 | −0.1893 *** | 0.1773 | 0.0000 | −0.1854 *** | 0.1711 | 0.0000 | −0.2022 *** | 0.1812 | 0.0000 | −0.1933 *** | 0.1347 | 0.0000 |
| SH2 | −0.1830 *** | 0.1821 | 0.0000 | −0.1666 *** | 0.1702 | 0.0000 | −0.1663 *** | 0.1779 | 0.0000 | −0.1616 *** | 0.1659 | 0.0000 | −0.1778 *** | 0.1889 | 0.0000 | −0.1473 *** | 0.1221 | 0.0000 |
| PN1 | −0.2602 *** | 0.1333 | 0.0000 | −0.2884 *** | 0.1221 | 0.0001 | −0.2732 *** | 0.1428 | 0.0000 | −0.2784 *** | 0.1331 | 0.0002 | −0.2893 *** | 0.1983 | 0.0000 | −0.2733 *** | 0.1219 | 0.0000 |
| PN2 | 0.2111 *** | 0.1346 | 0.0007 | 0.2776 *** | 0.1537 | 0.0004 | 0.2202 *** | 0.1336 | 0.0000 | 0.2674 *** | 0.1222 | 0.0003 | 0.2022 *** | 0.1788 | 0.0000 | 0.2630 *** | 0.1417 | 0.0004 |
| SEXA | 0.2106 ** | 0.2106 | 0.0018 | 0.2003 ** | 0.1788 | 0.0011 | 0.2111 | 0.1883 | 0.1899 | |||||||||
| AGE | 0.2213 | 0.1131 | 0.1566 | 0.2143 | 0.1434 | 0.1718 | 0.2033 | 0.1321 | 0.1442 | |||||||||
| EDU | 0.3511 *** | 0.1732 | 0.0001 | 0.3001 ** | 0.1665 | 0.0021 | 0.2701 | 0.1771 | 0.1713 | |||||||||
| IC | 0.1049 | 0.1444 | 0.1778 | 0.1347 | 0.1114 | 0.2333 | 0.1047 | 0.2098 | 0.2103 | |||||||||
| CS | −0.0012 *** | 0.0019 | 0.0004 | −0.0015 *** | 0.0012 | 0.0002 | −0.0011 *** | 0.0016 | 0.0004 | −0.0014 *** | 0.0022 | 0.0002 | −0.0007 *** | 0.0019 | 0.0004 | −0.0012 *** | 0.0011 | 0.0000 |
| log likelihood | −547.2678 | −389.3281 | −533.2338 | −367.3311 | −443.322 | −288.2331 | ||||||||||||
| PseudR2 | 0.1033 | 0.2367 | 0.1333 | 0.1334 | 0.1894 | 0.2334 | ||||||||||||
| AIC/N | 1.7332 | 1.5798 | 1.8322 | 1.4673 | 1.6792 | 1.4749 | ||||||||||||
| Attribute and Variable | Tourist | Local Resident | Aquaculture Farmer | |||
|---|---|---|---|---|---|---|
| Coefficient | MWTP (NT$) | Coefficient | Coefficient | MWTP (NT$) | Coefficient | |
| Biodiversity (BD1) | 0.3102 *** | 206.8 | 0.3302 *** | 235.9 | 0.3413 *** | 284.4 |
| Biodiversity (BD2) | −0.2584 *** | 172.3 | −0.2484 *** | 177.4 | −0.2722 *** | 226.8 |
| Land use pattern (LU1) | 0.2013 *** | 134.2 | 0.2113 *** | 150.9 | 0.2501 *** | 208.4 |
| Land use pattern (LU2) | −0.1714 *** | 114.3 | −0.1664 *** | 118.9 | −0.1833 *** | 152.8 |
| FSPS coverage ratio (SH1) | −0.1954 *** | 130.3 | −0.1854 *** | 132.4 | −0.1933 *** | 161.1 |
| FSPS coverage ratio (SH2) | −0.1666 *** | 111.1 | −0.1616 *** | 115.4 | −0.1473 *** | 122.8 |
| Coastal landscape (PN1) | −0.2884 *** | 192.3 | −0.2784 *** | 198.9 | −0.2733 *** | 227.8 |
| Coastal landscape (PN2) | 0.2776 *** | 185.1 | 0.2674 *** | 191.0 | 0.2630 *** | 219.2 |
| Ecocompensation fund (CS) | −0.0015 *** | −0.0014 *** | −0.0012 *** | |||
Publisher’s Note: MDPI stays neutral with regard to jurisdictional claims in published maps and institutional affiliations. |
© 2021 by the authors. Licensee MDPI, Basel, Switzerland. This article is an open access article distributed under the terms and conditions of the Creative Commons Attribution (CC BY) license (https://creativecommons.org/licenses/by/4.0/).
Share and Cite
Chen, H.-S.; Kuo, H.-Y. Integrated Multi-Attribute Preference Analysis in Fisheries and Solar Power Symbiosis Areas: A Case Study in Cigu, Taiwan. Water 2021, 13, 3265. https://doi.org/10.3390/w13223265
Chen H-S, Kuo H-Y. Integrated Multi-Attribute Preference Analysis in Fisheries and Solar Power Symbiosis Areas: A Case Study in Cigu, Taiwan. Water. 2021; 13(22):3265. https://doi.org/10.3390/w13223265
Chicago/Turabian StyleChen, Han-Shen, and Hung-Yu Kuo. 2021. "Integrated Multi-Attribute Preference Analysis in Fisheries and Solar Power Symbiosis Areas: A Case Study in Cigu, Taiwan" Water 13, no. 22: 3265. https://doi.org/10.3390/w13223265
APA StyleChen, H.-S., & Kuo, H.-Y. (2021). Integrated Multi-Attribute Preference Analysis in Fisheries and Solar Power Symbiosis Areas: A Case Study in Cigu, Taiwan. Water, 13(22), 3265. https://doi.org/10.3390/w13223265