
The Relationship between the Community Structure and Function of Bacterioplankton and the Environmental Response in Qingcaosha Reservoir


Abstract
:1. Introduction
2. Materials and Methods
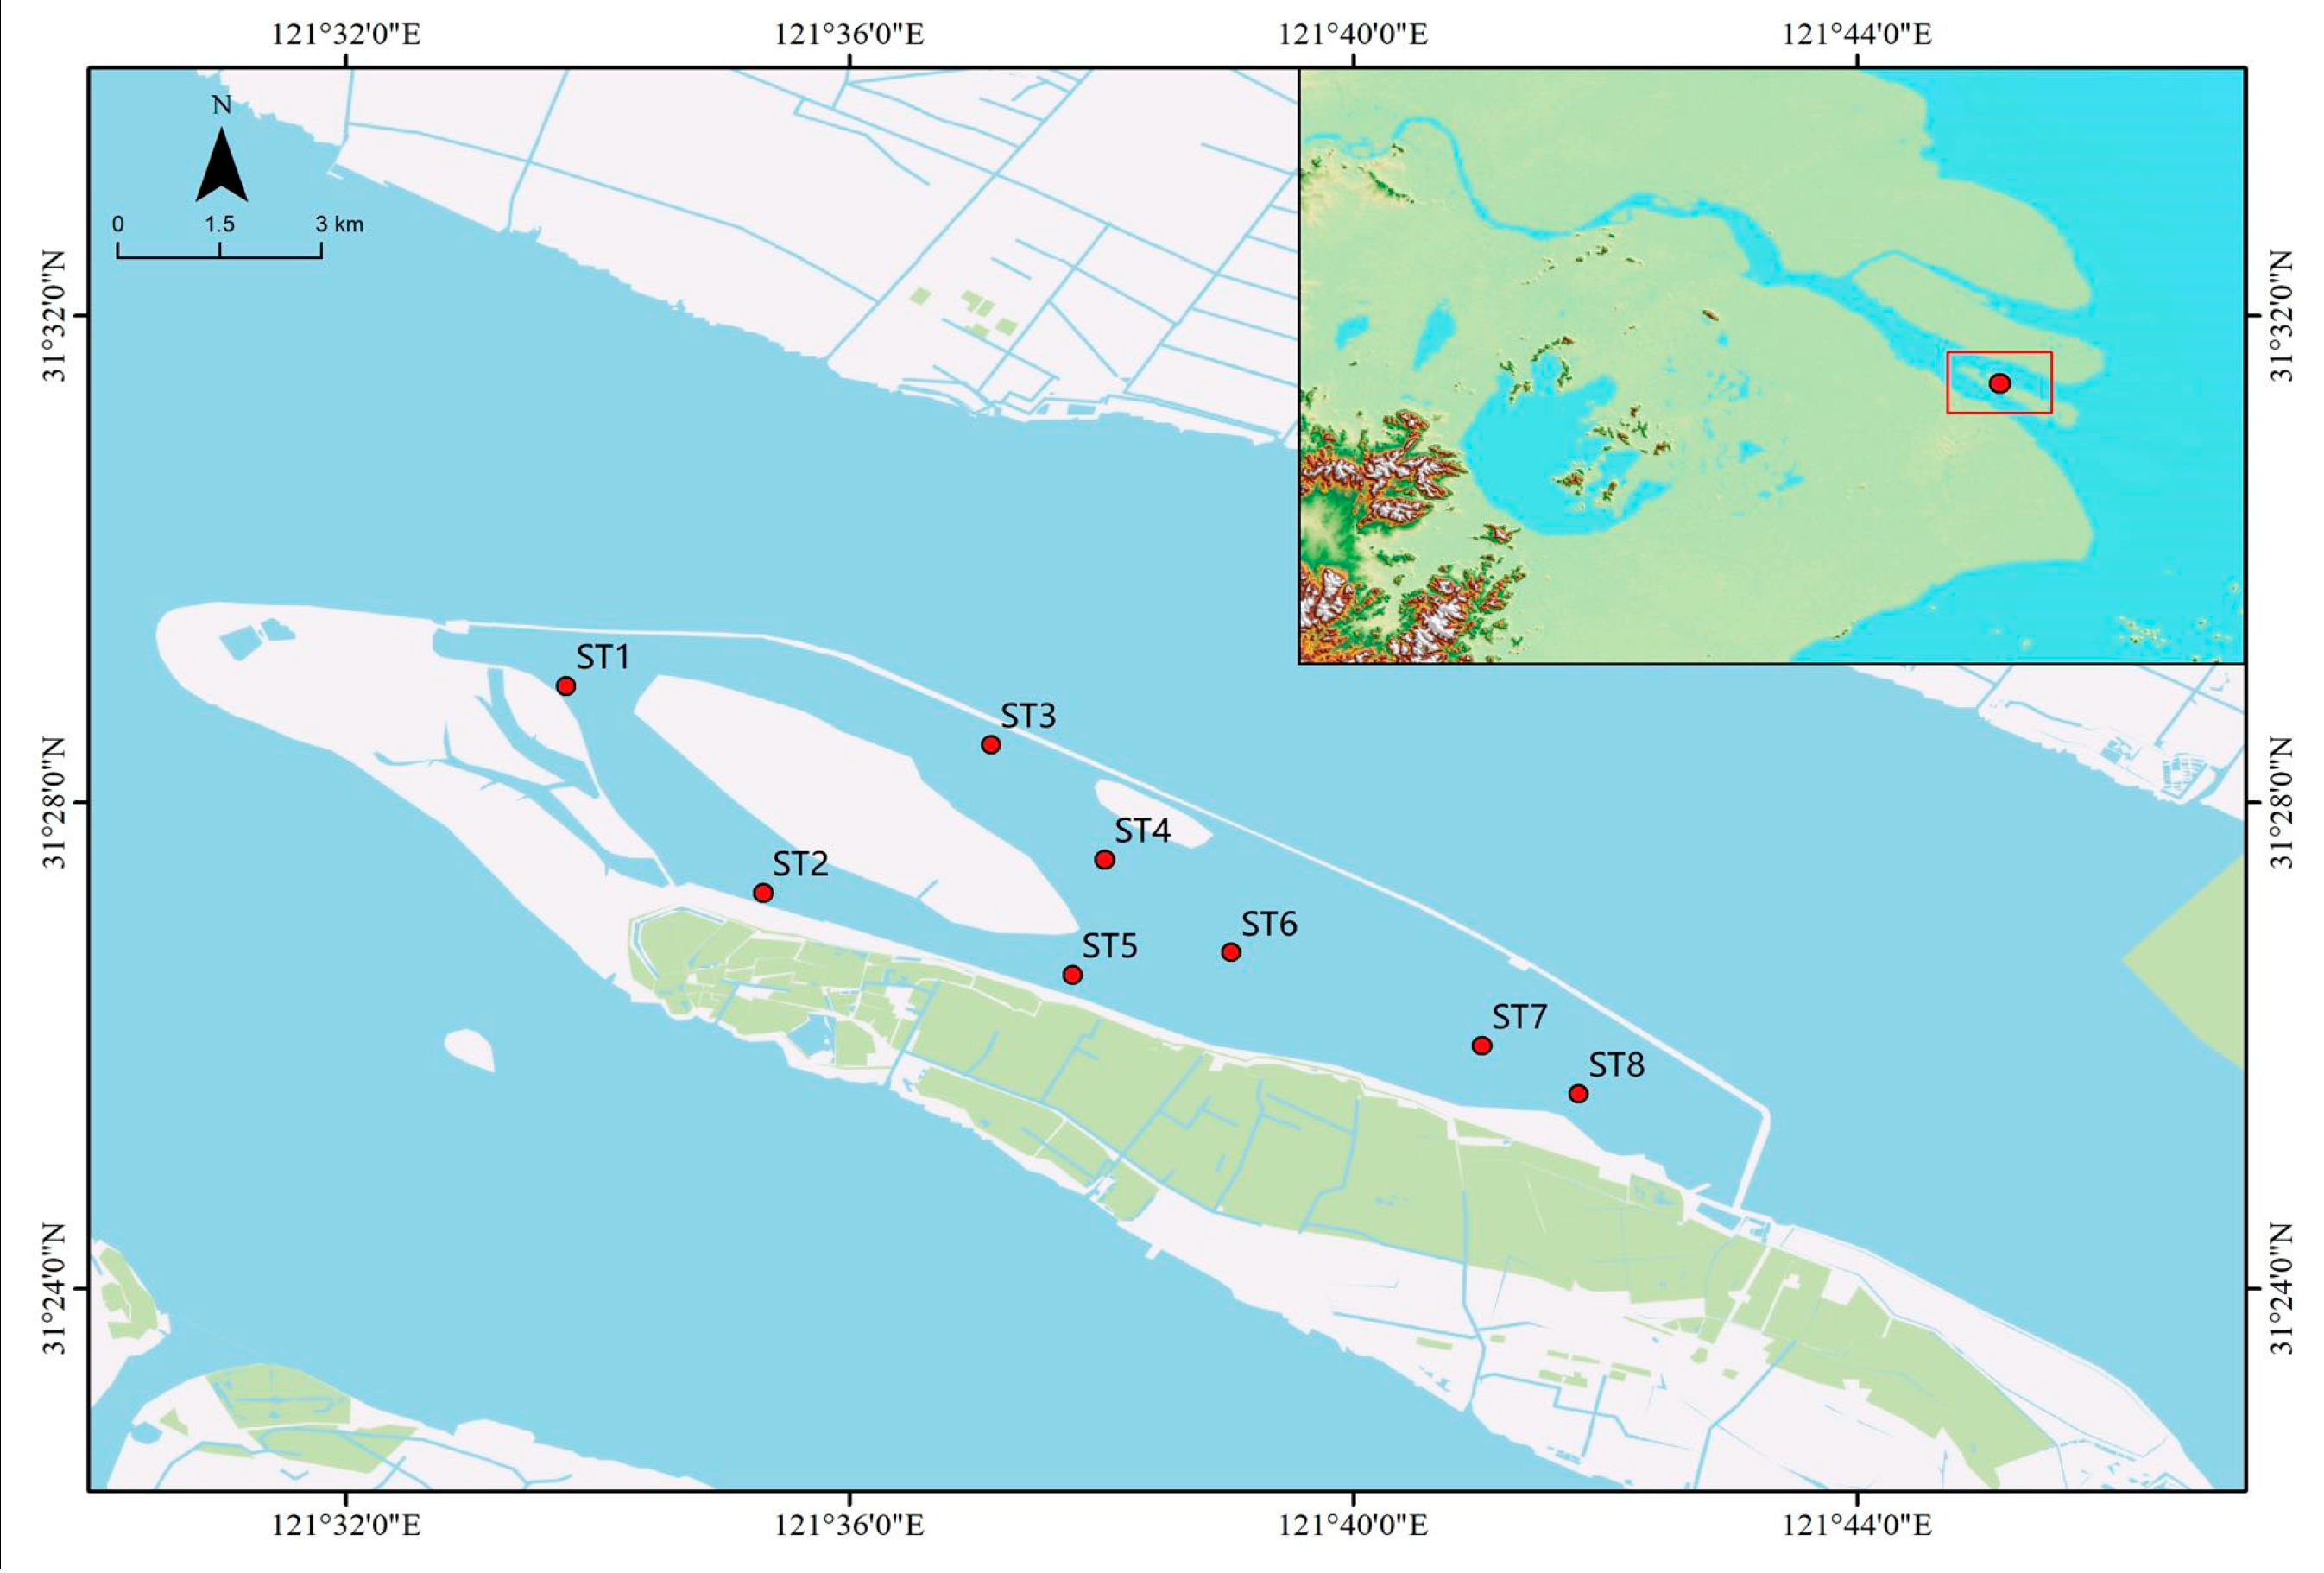
2.1. Sampling Site
2.2. Sample Collection and Determination of Physical and Chemical Indexes of Water Quality
2.3. Collection and Identification of Phytoplankton
2.4. DNA Extraction and High-Throughput Sequencing
2.5. Data Analysis
2.5.1. Bioinformatics Analysis
2.5.2. Biodiversity Analysis
2.5.3. Statistical Analysis
2.5.4. Functional Predictive Analysis
3. Results and Analysis
3.1. Physical and Chemical Properties of Qingcaosha Reservoir Water
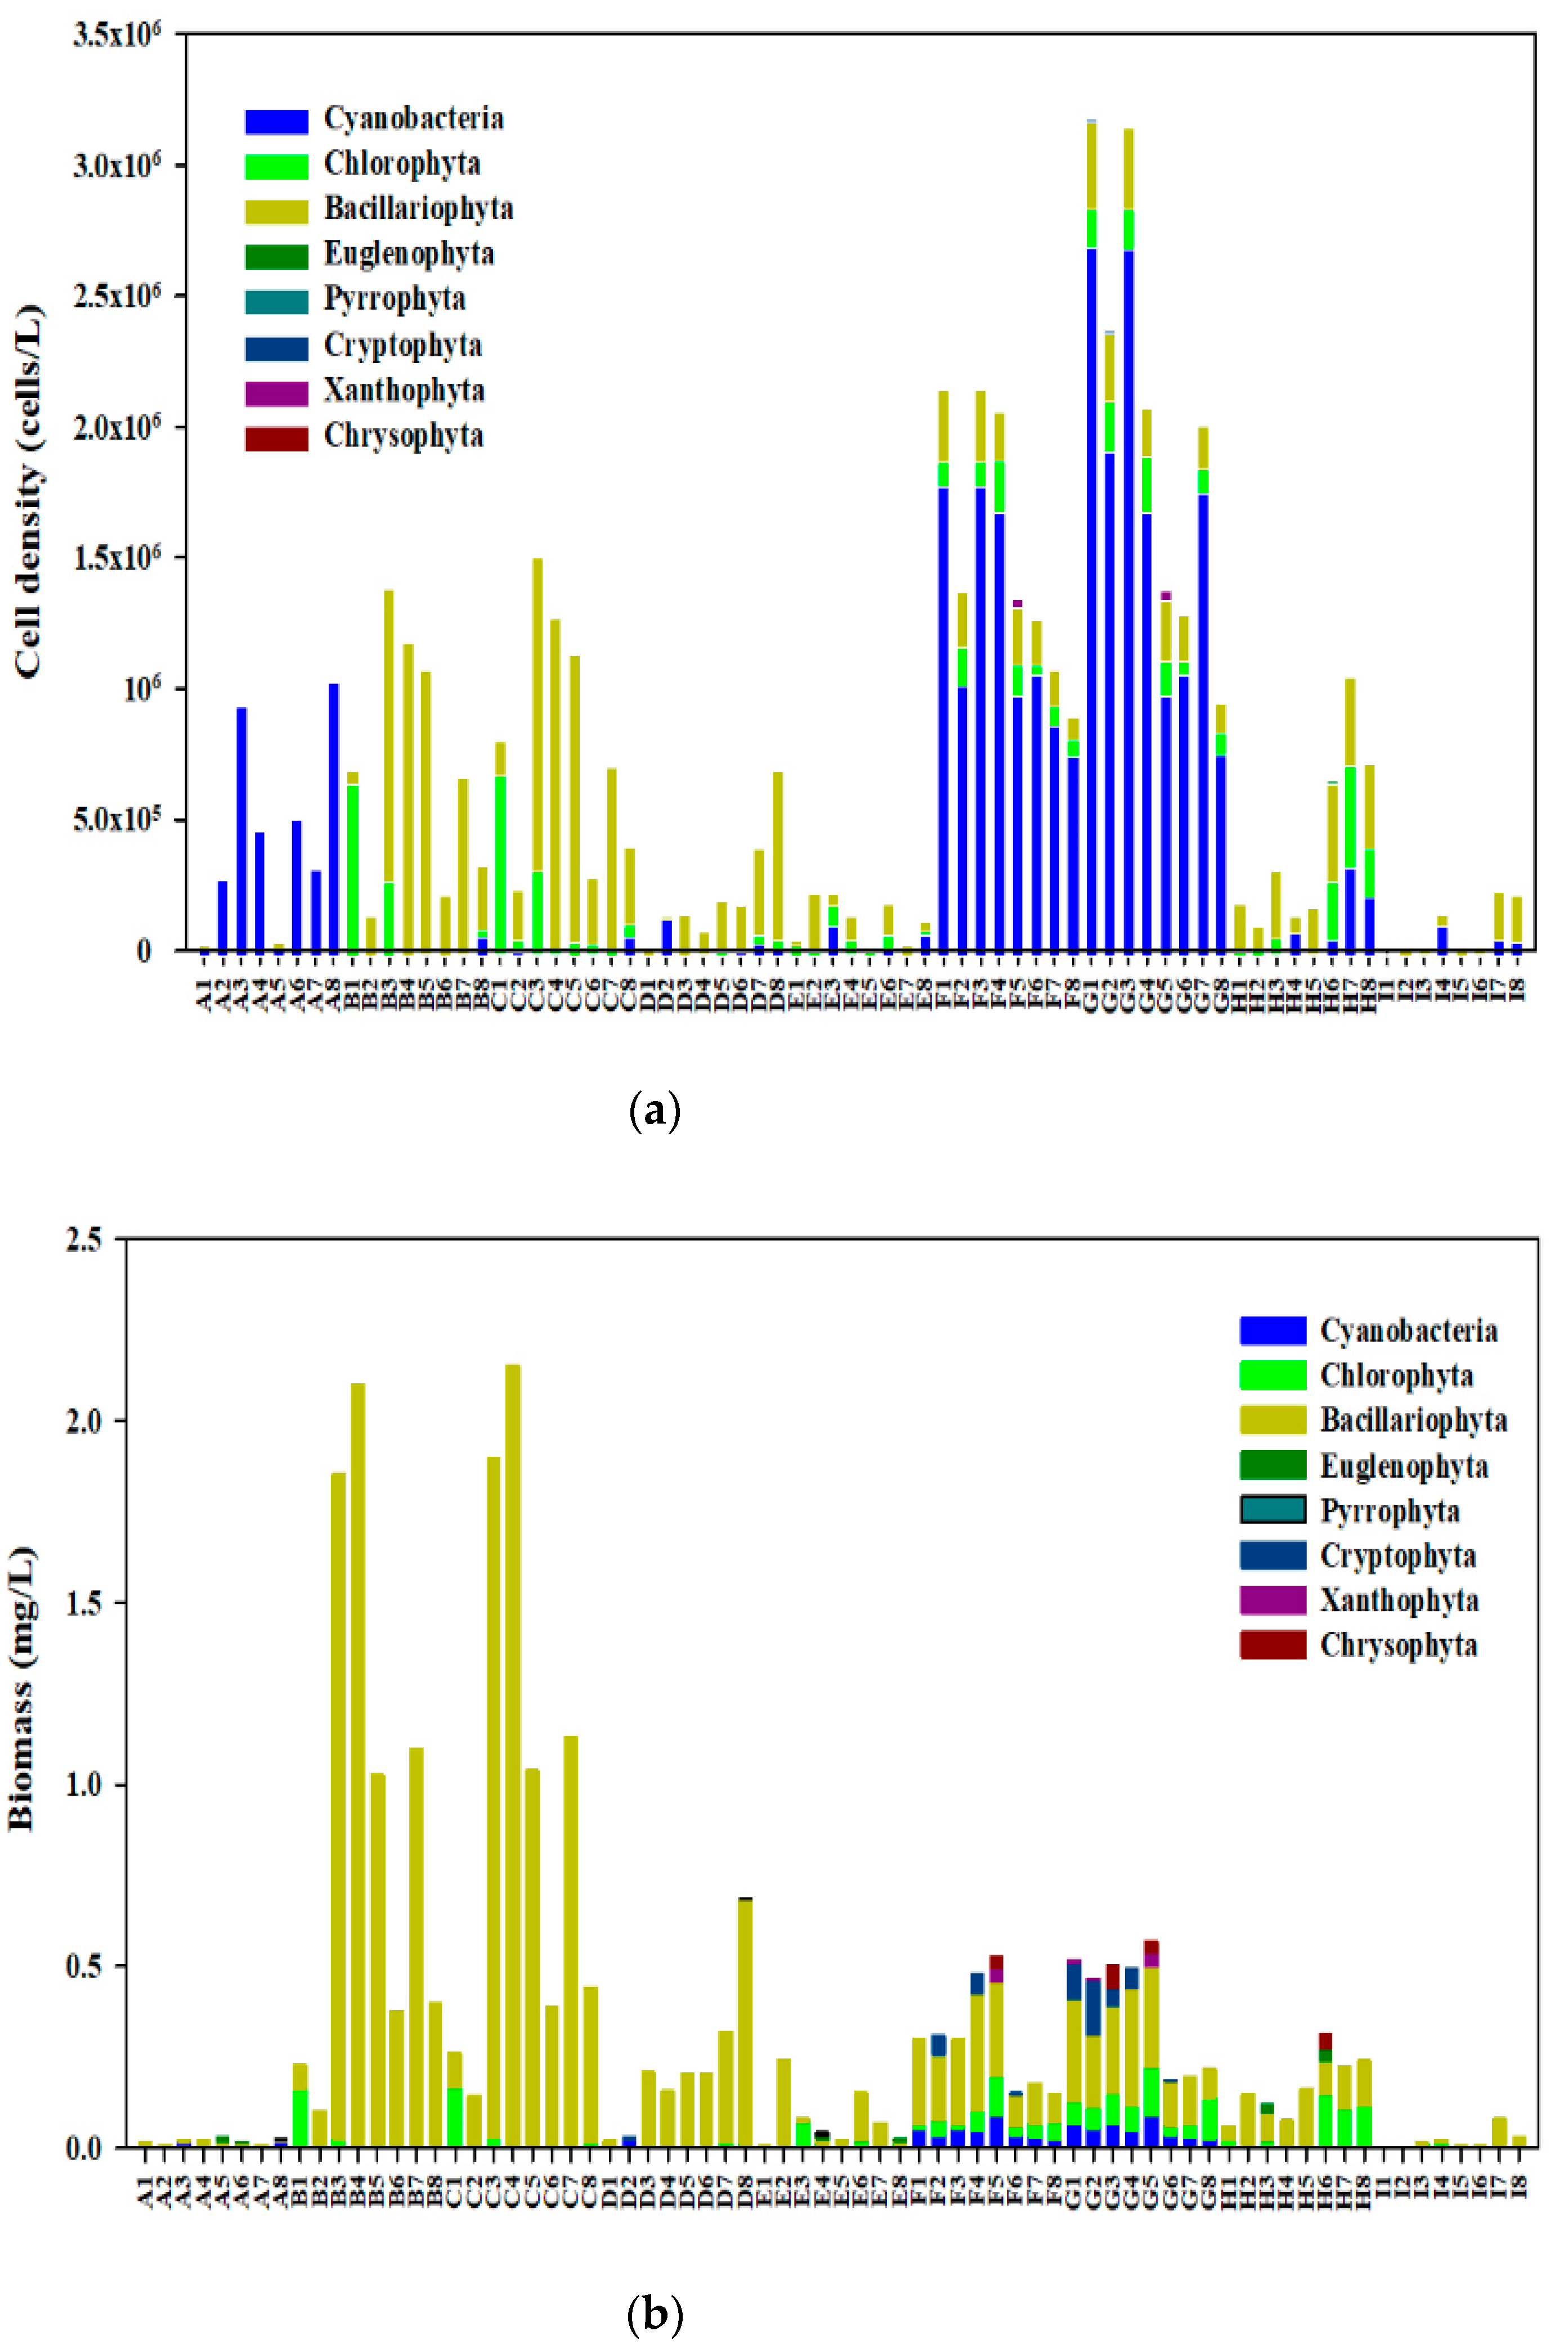
3.2. Community Structure of Phytoplankton
3.3. Community Structure of Bacterioplankton
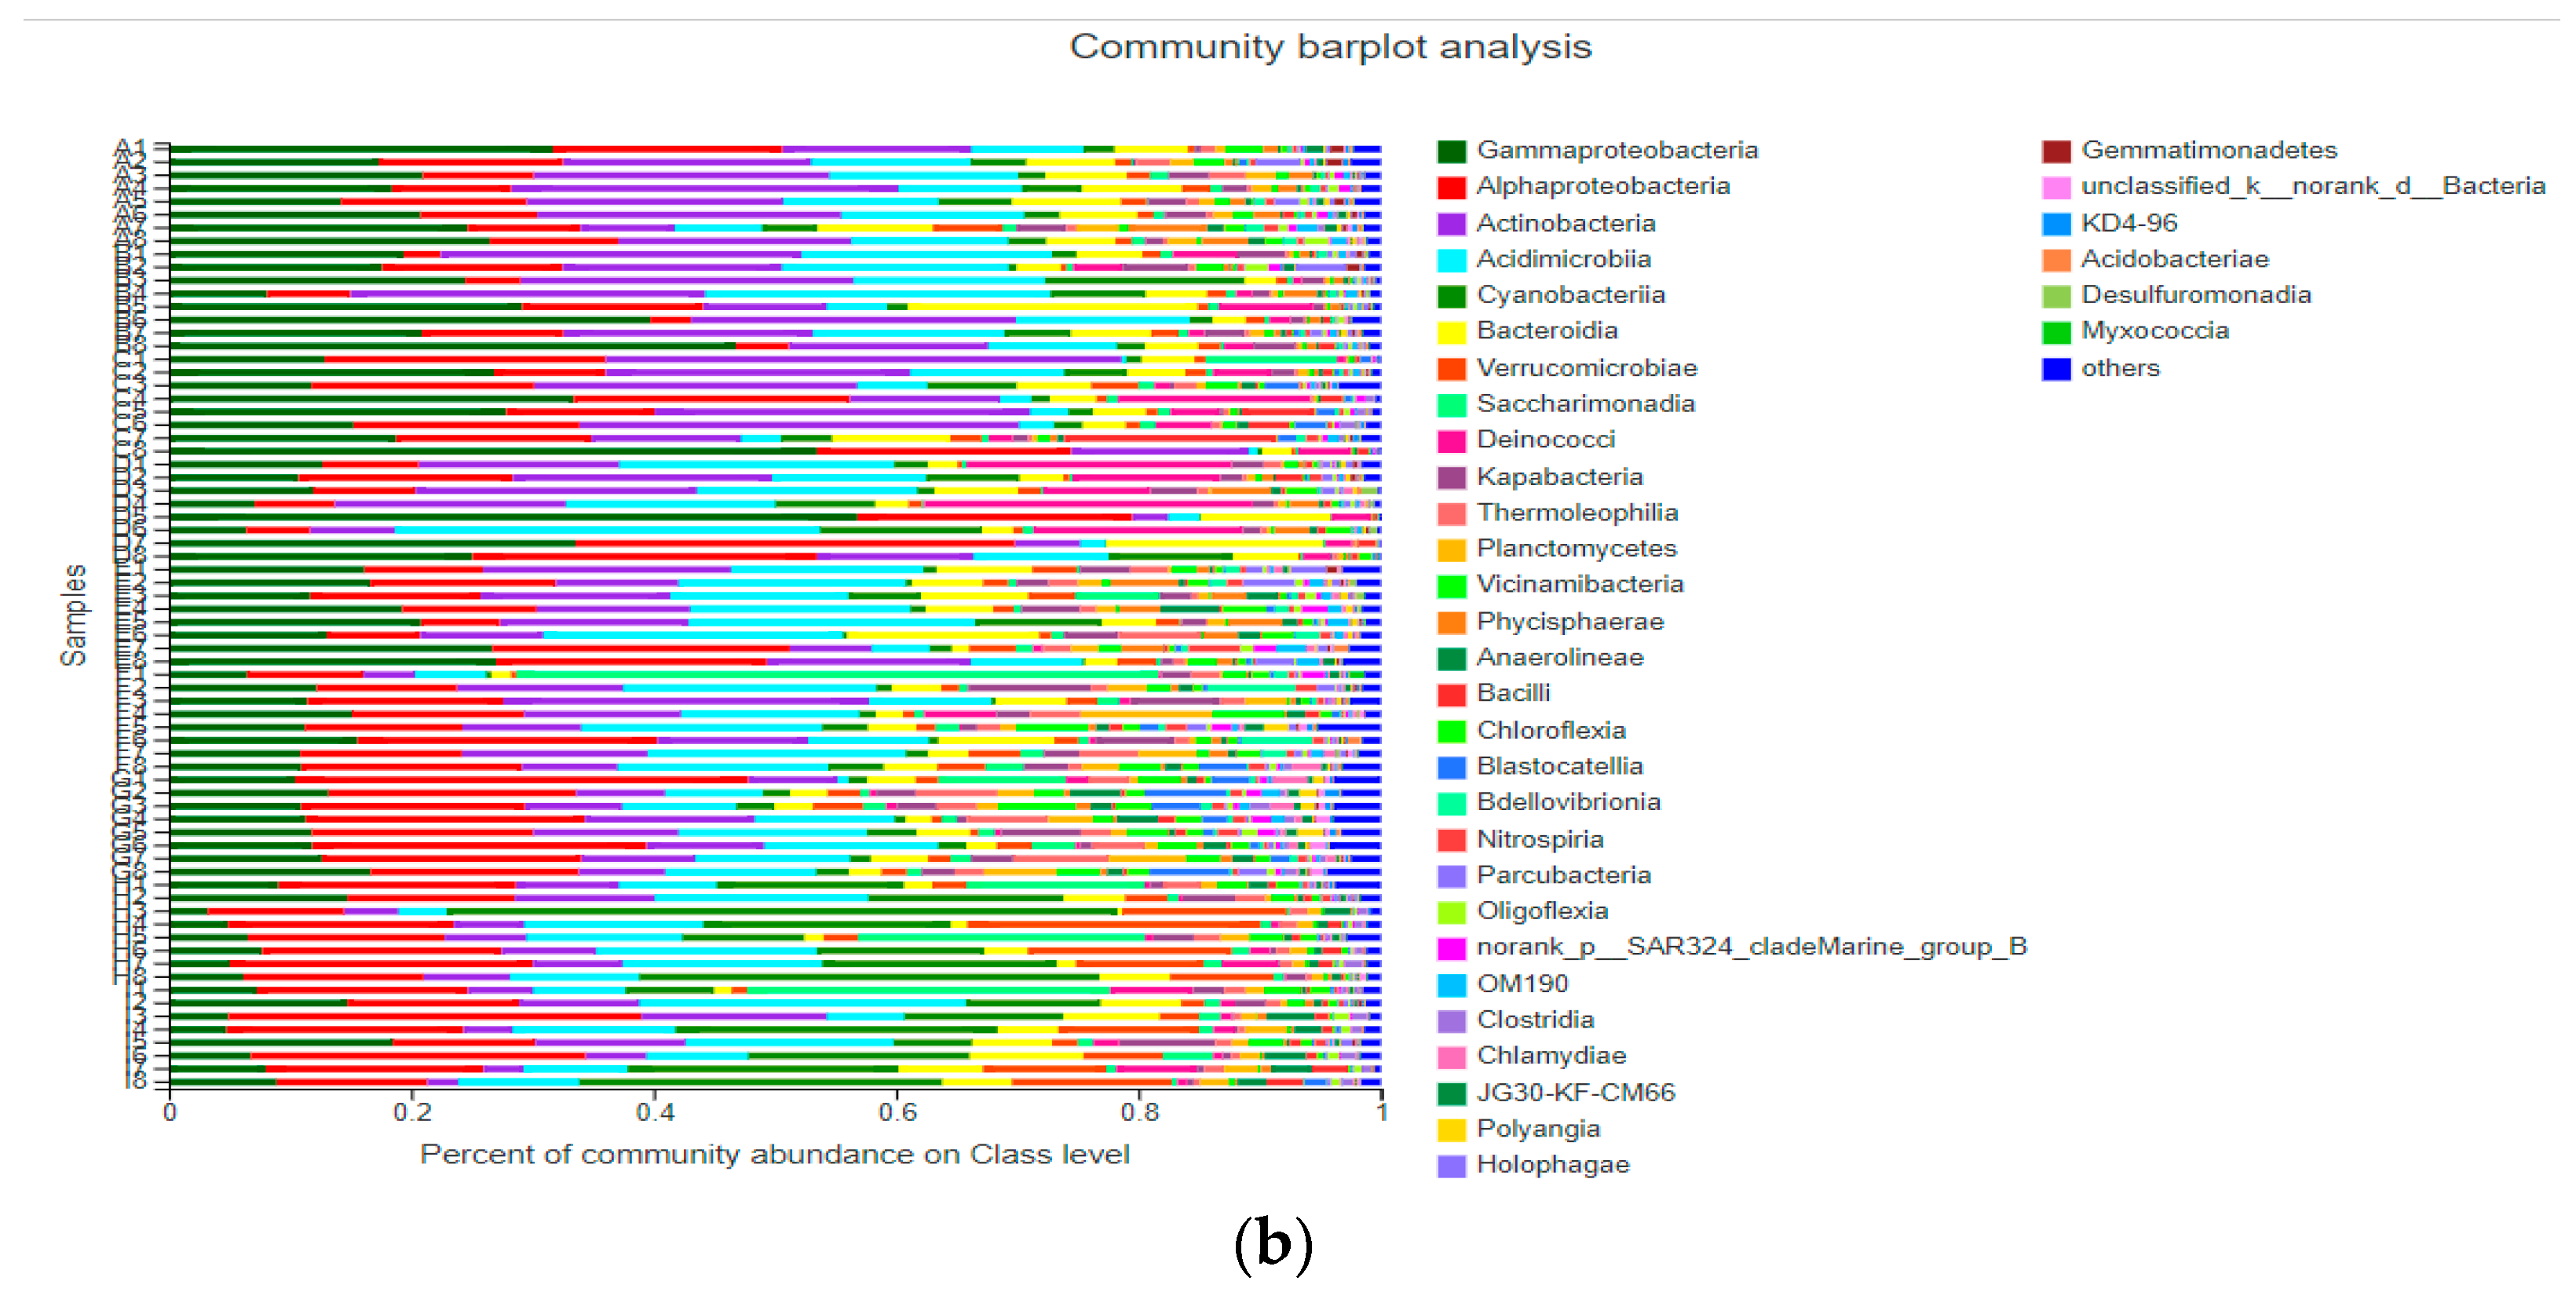
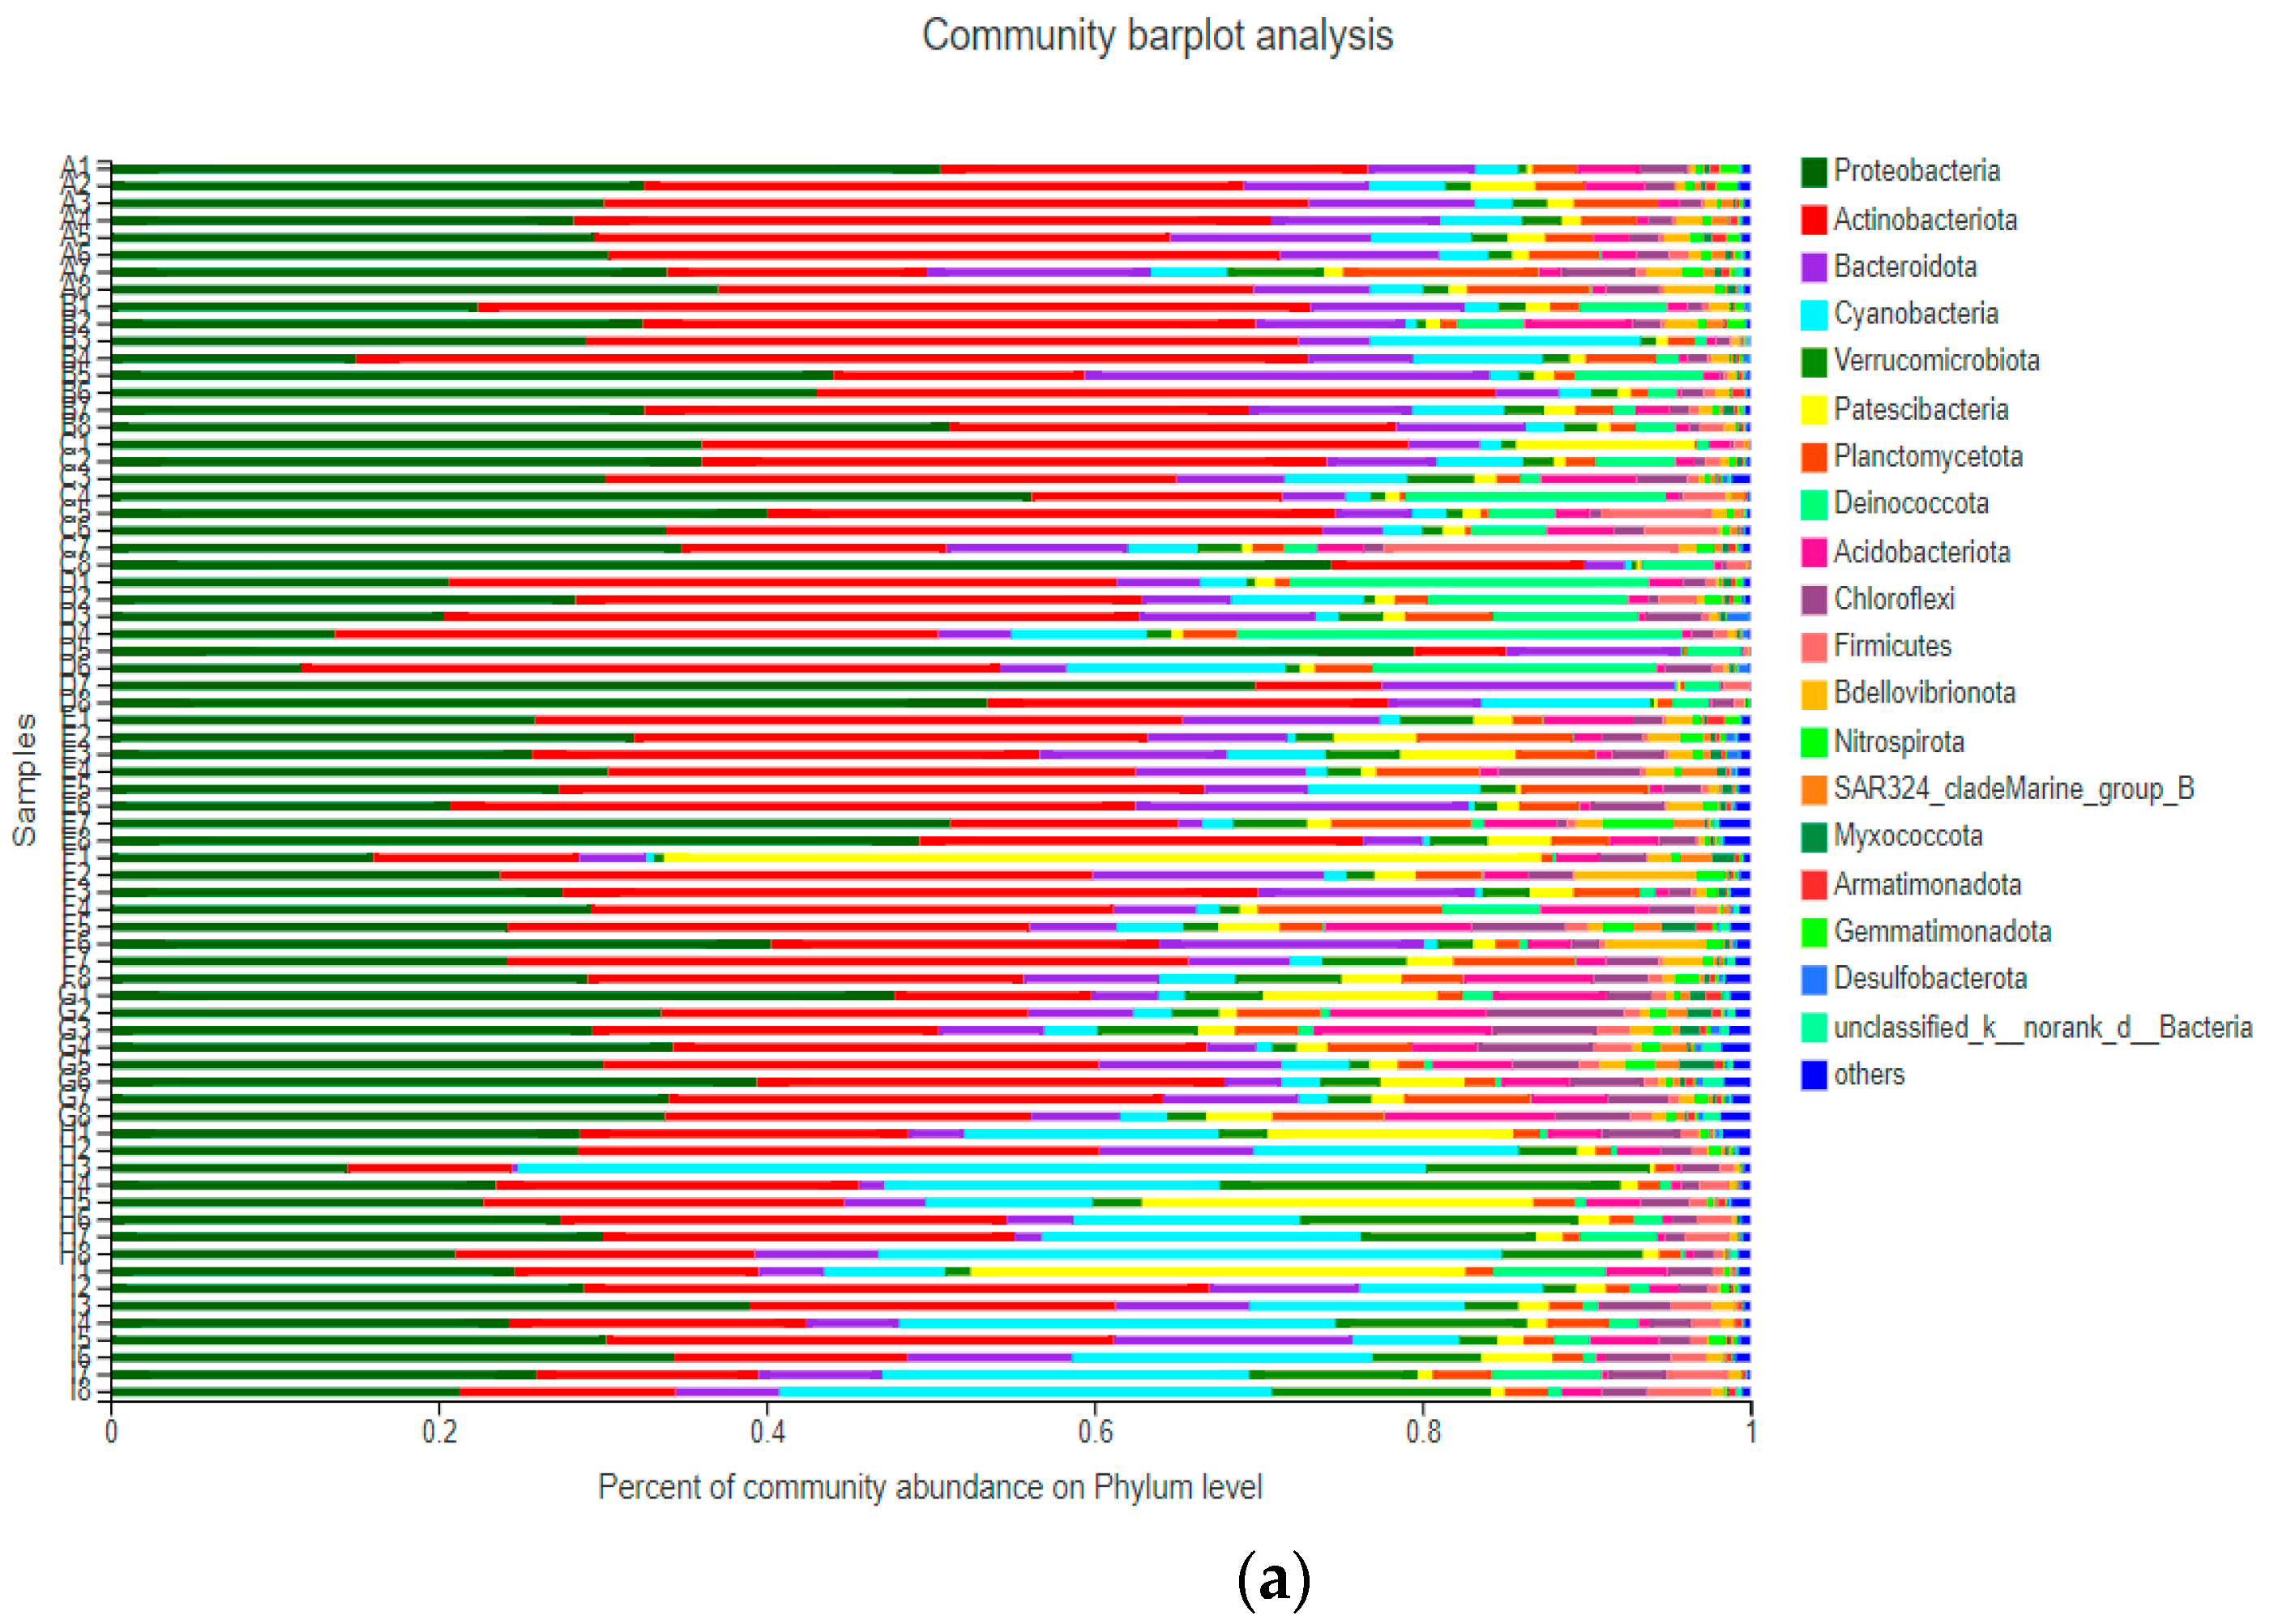
3.3.1. Community Structure of Bacterioplankton
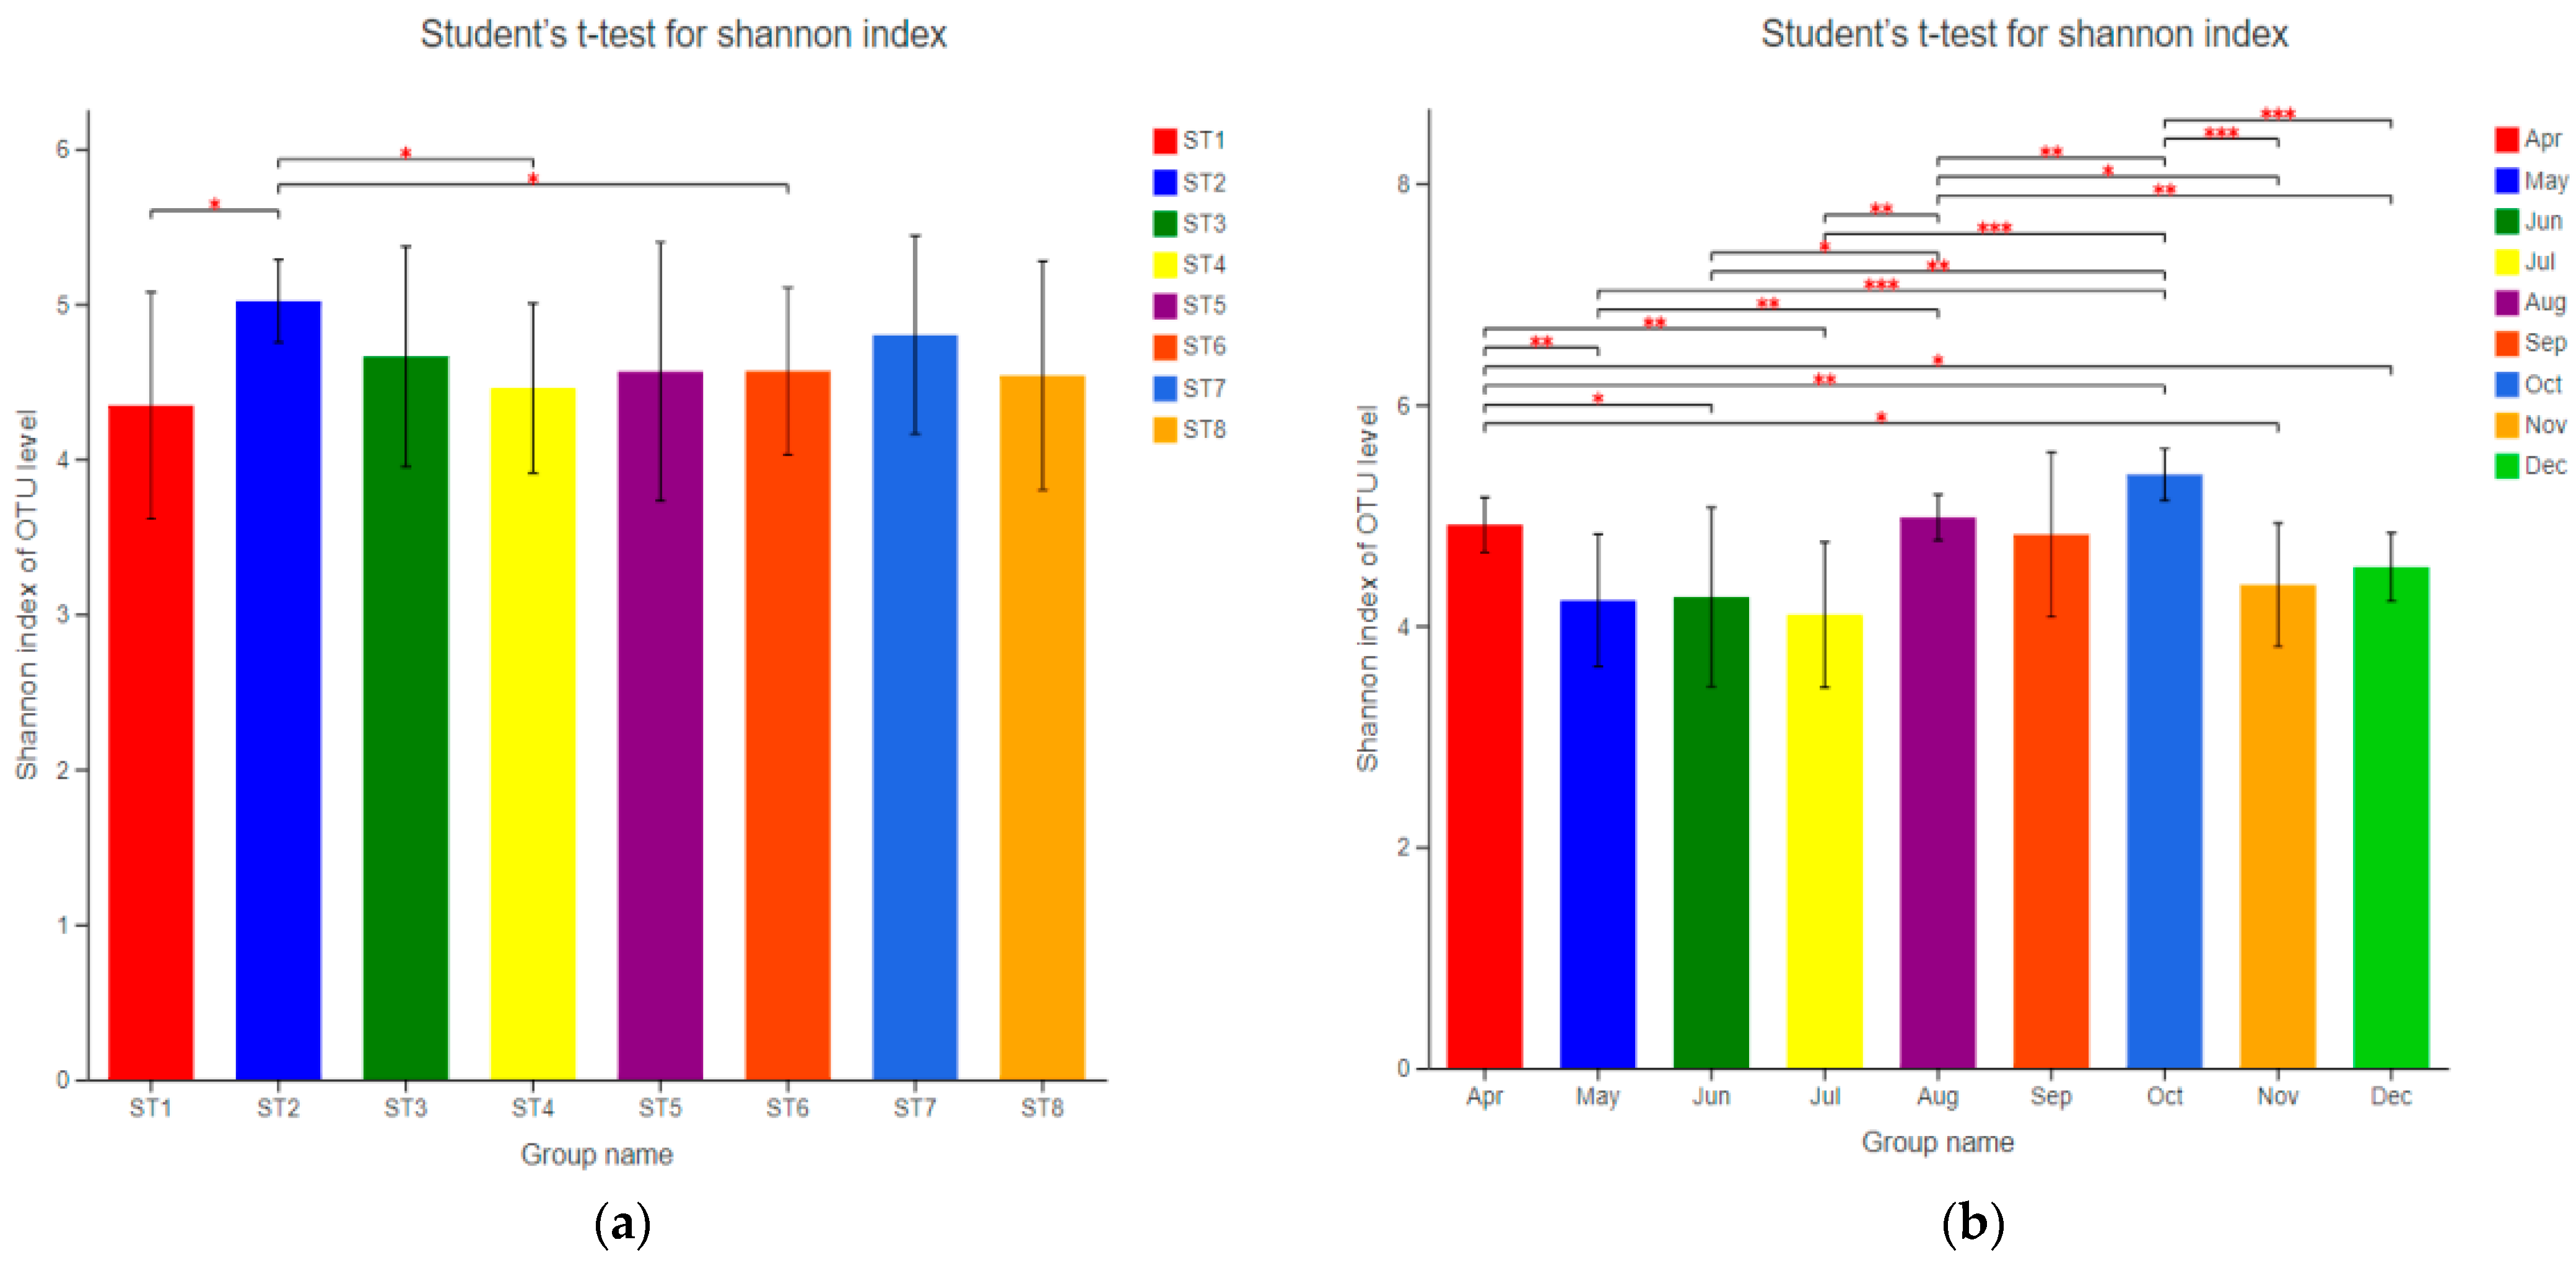
3.3.2. Diversity and Abundance of Bacterioplankton
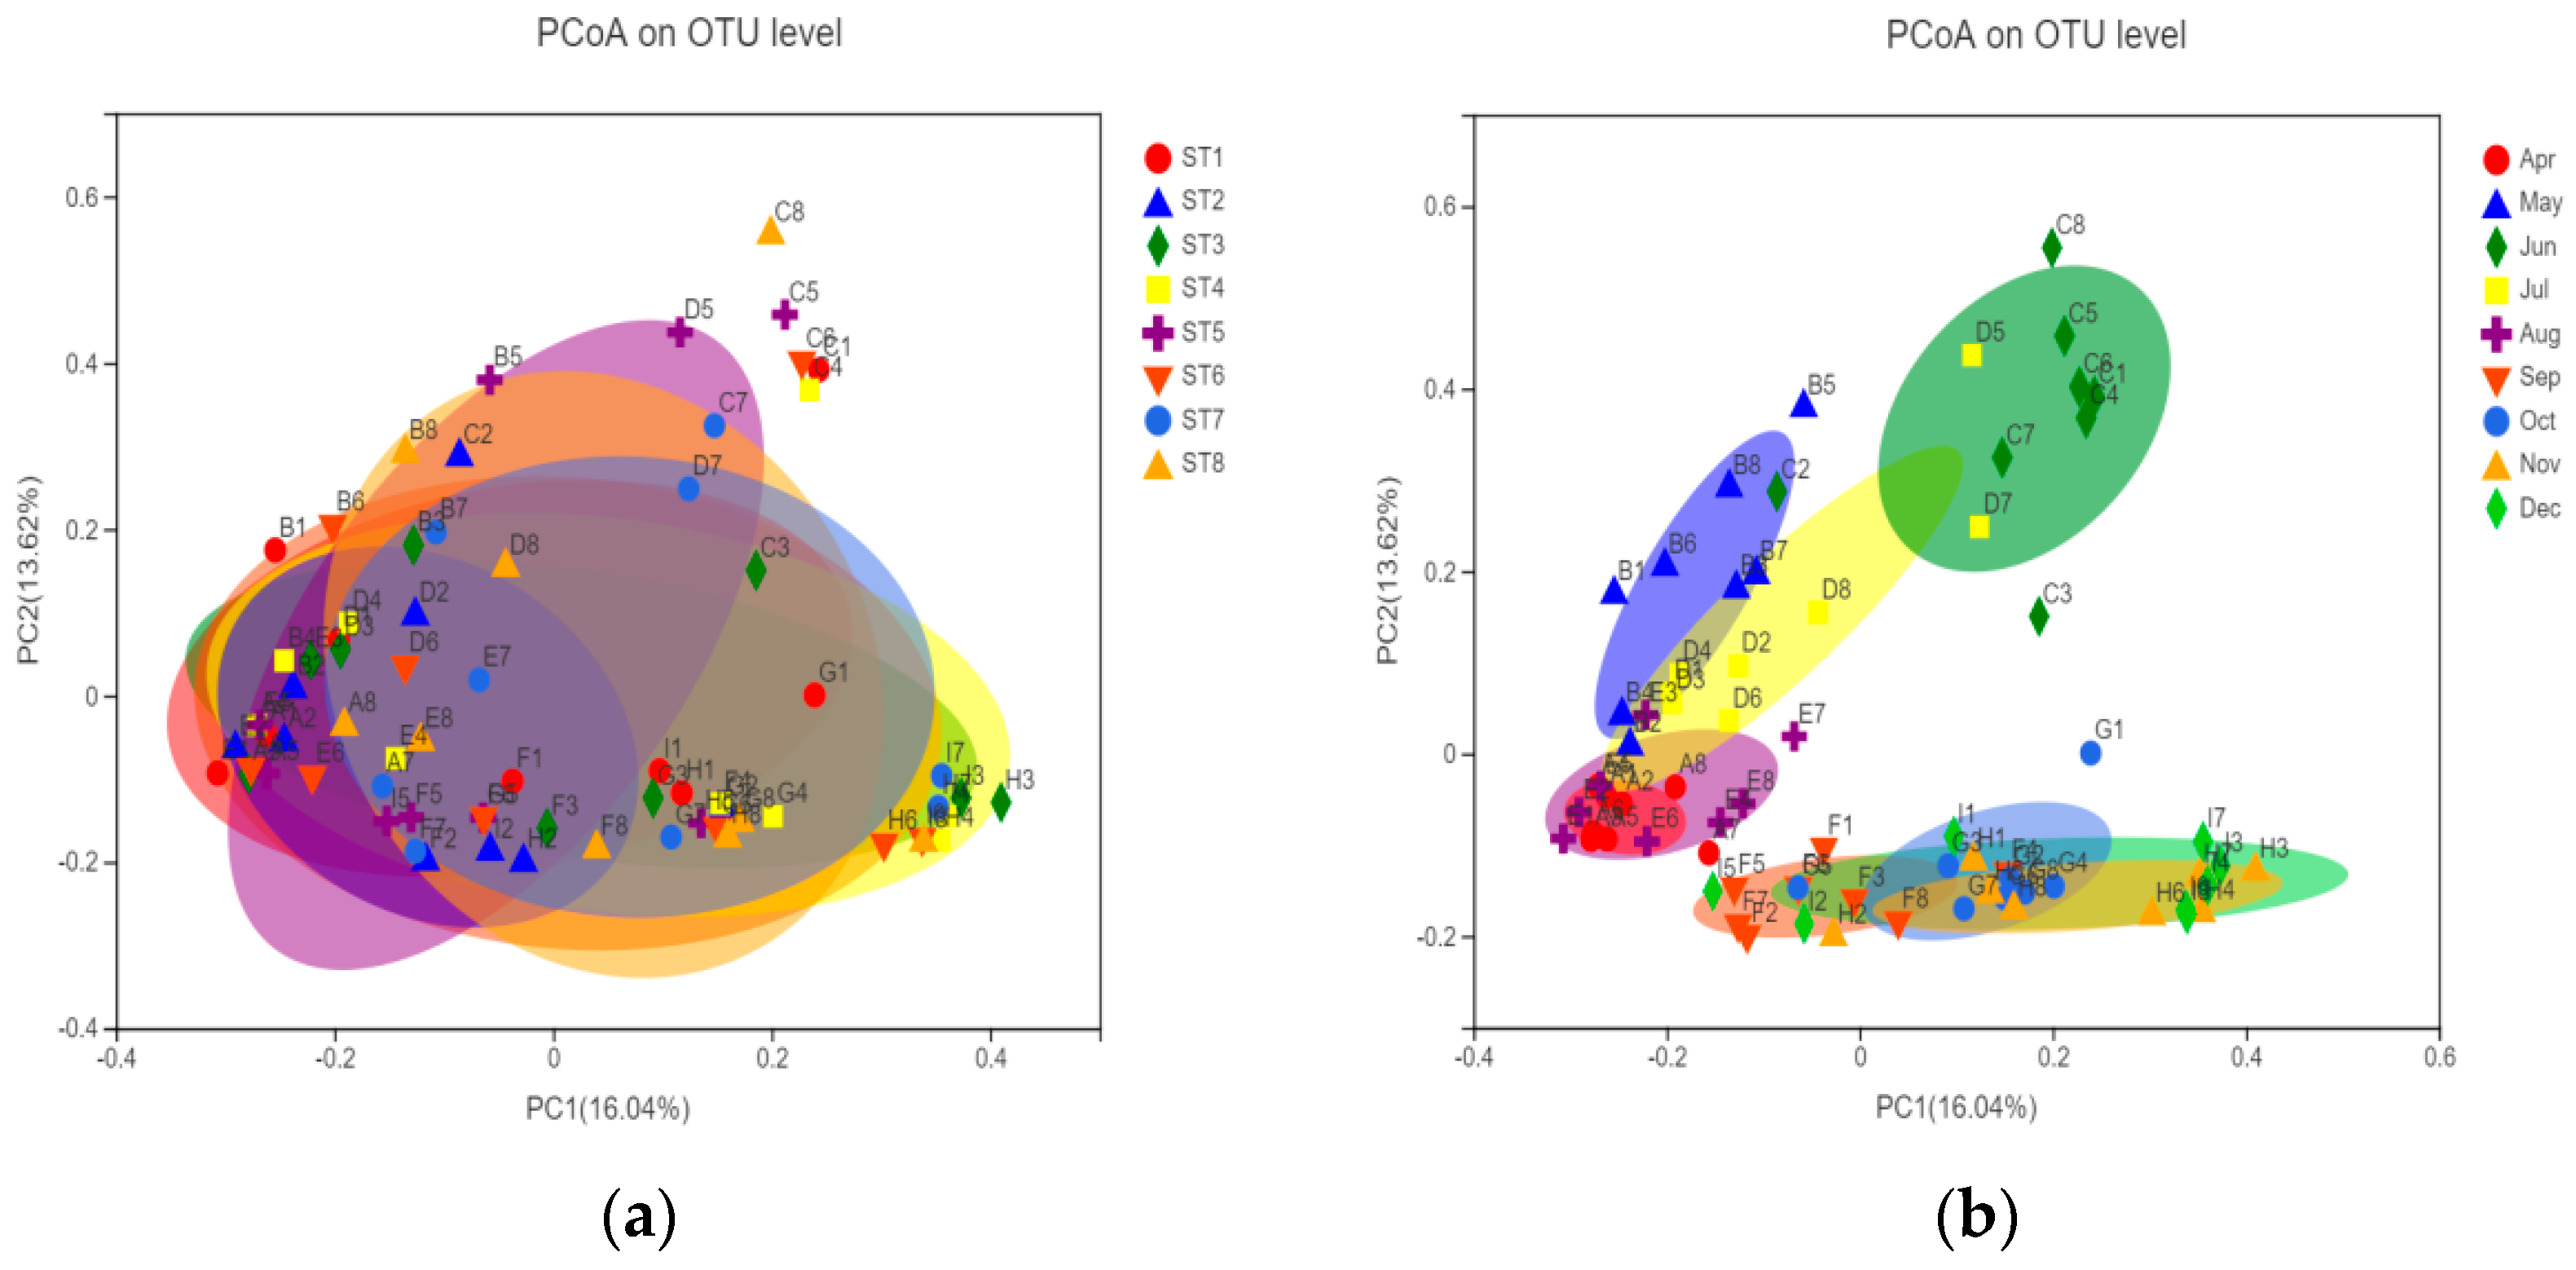
3.3.3. Temporal and Spatial Distribution Characteristics of Bacterioplankton
3.4. Characteristics of the Environmental Response of the Bacterioplankton Community
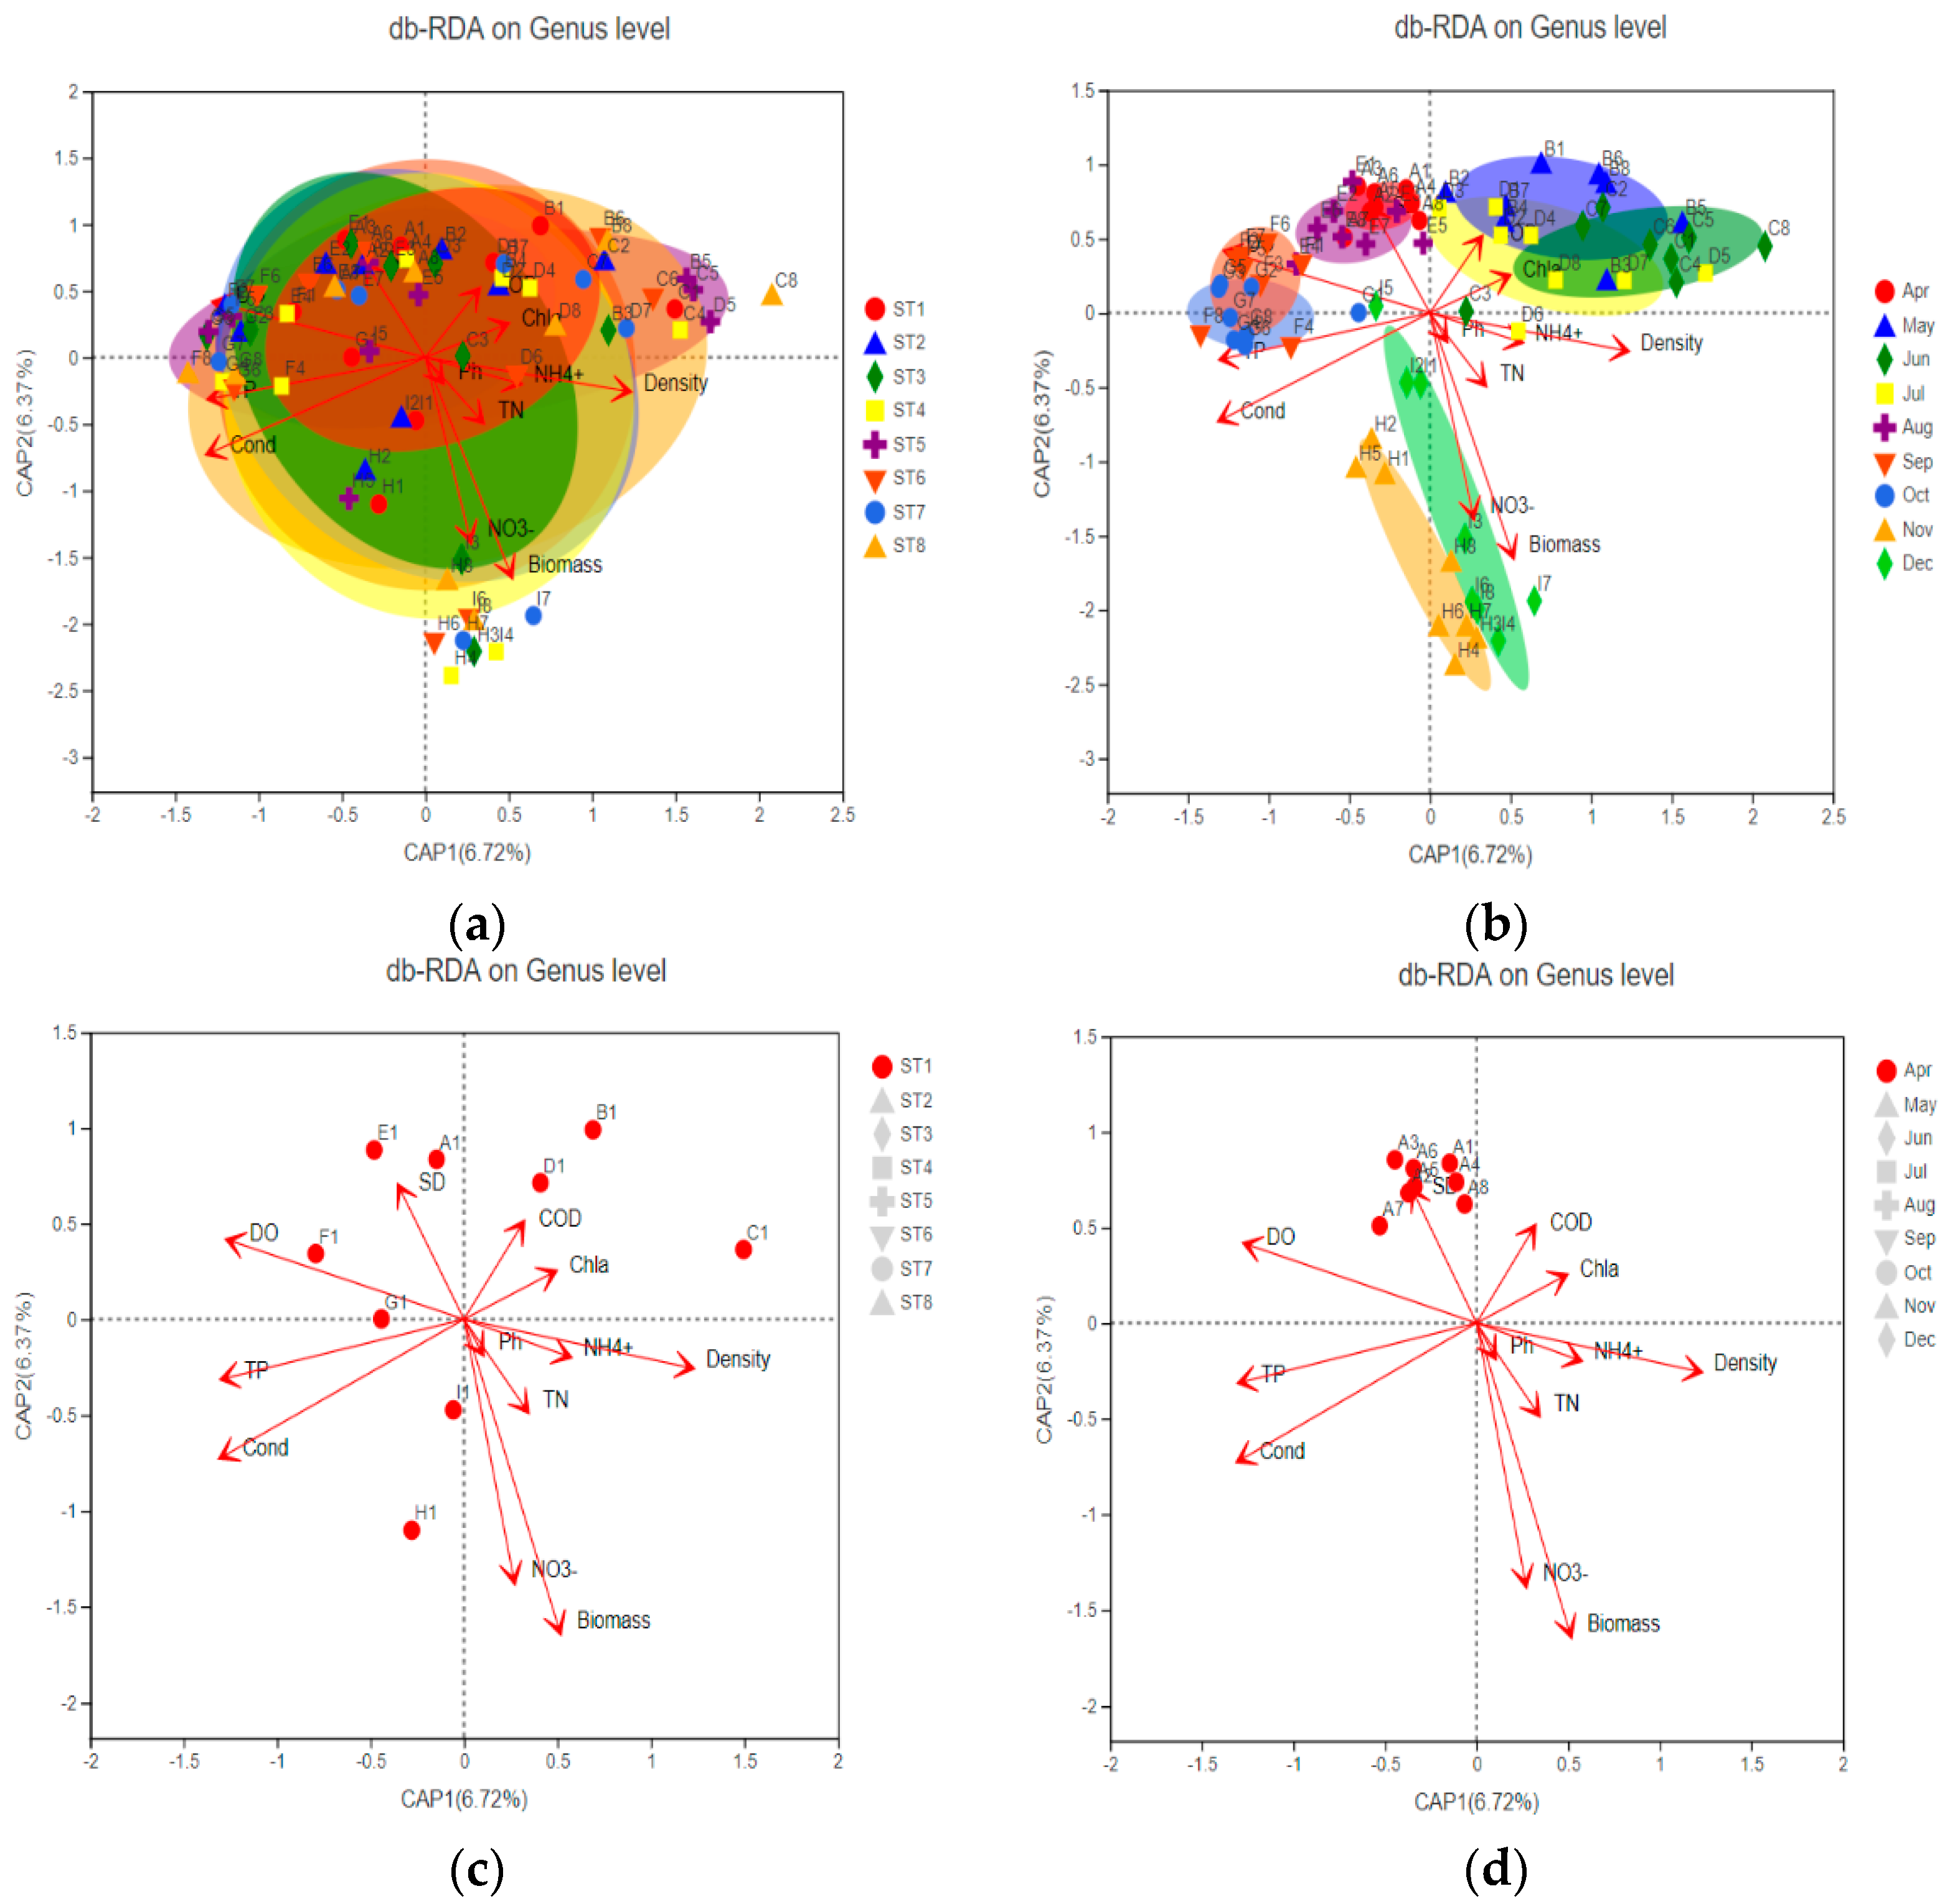
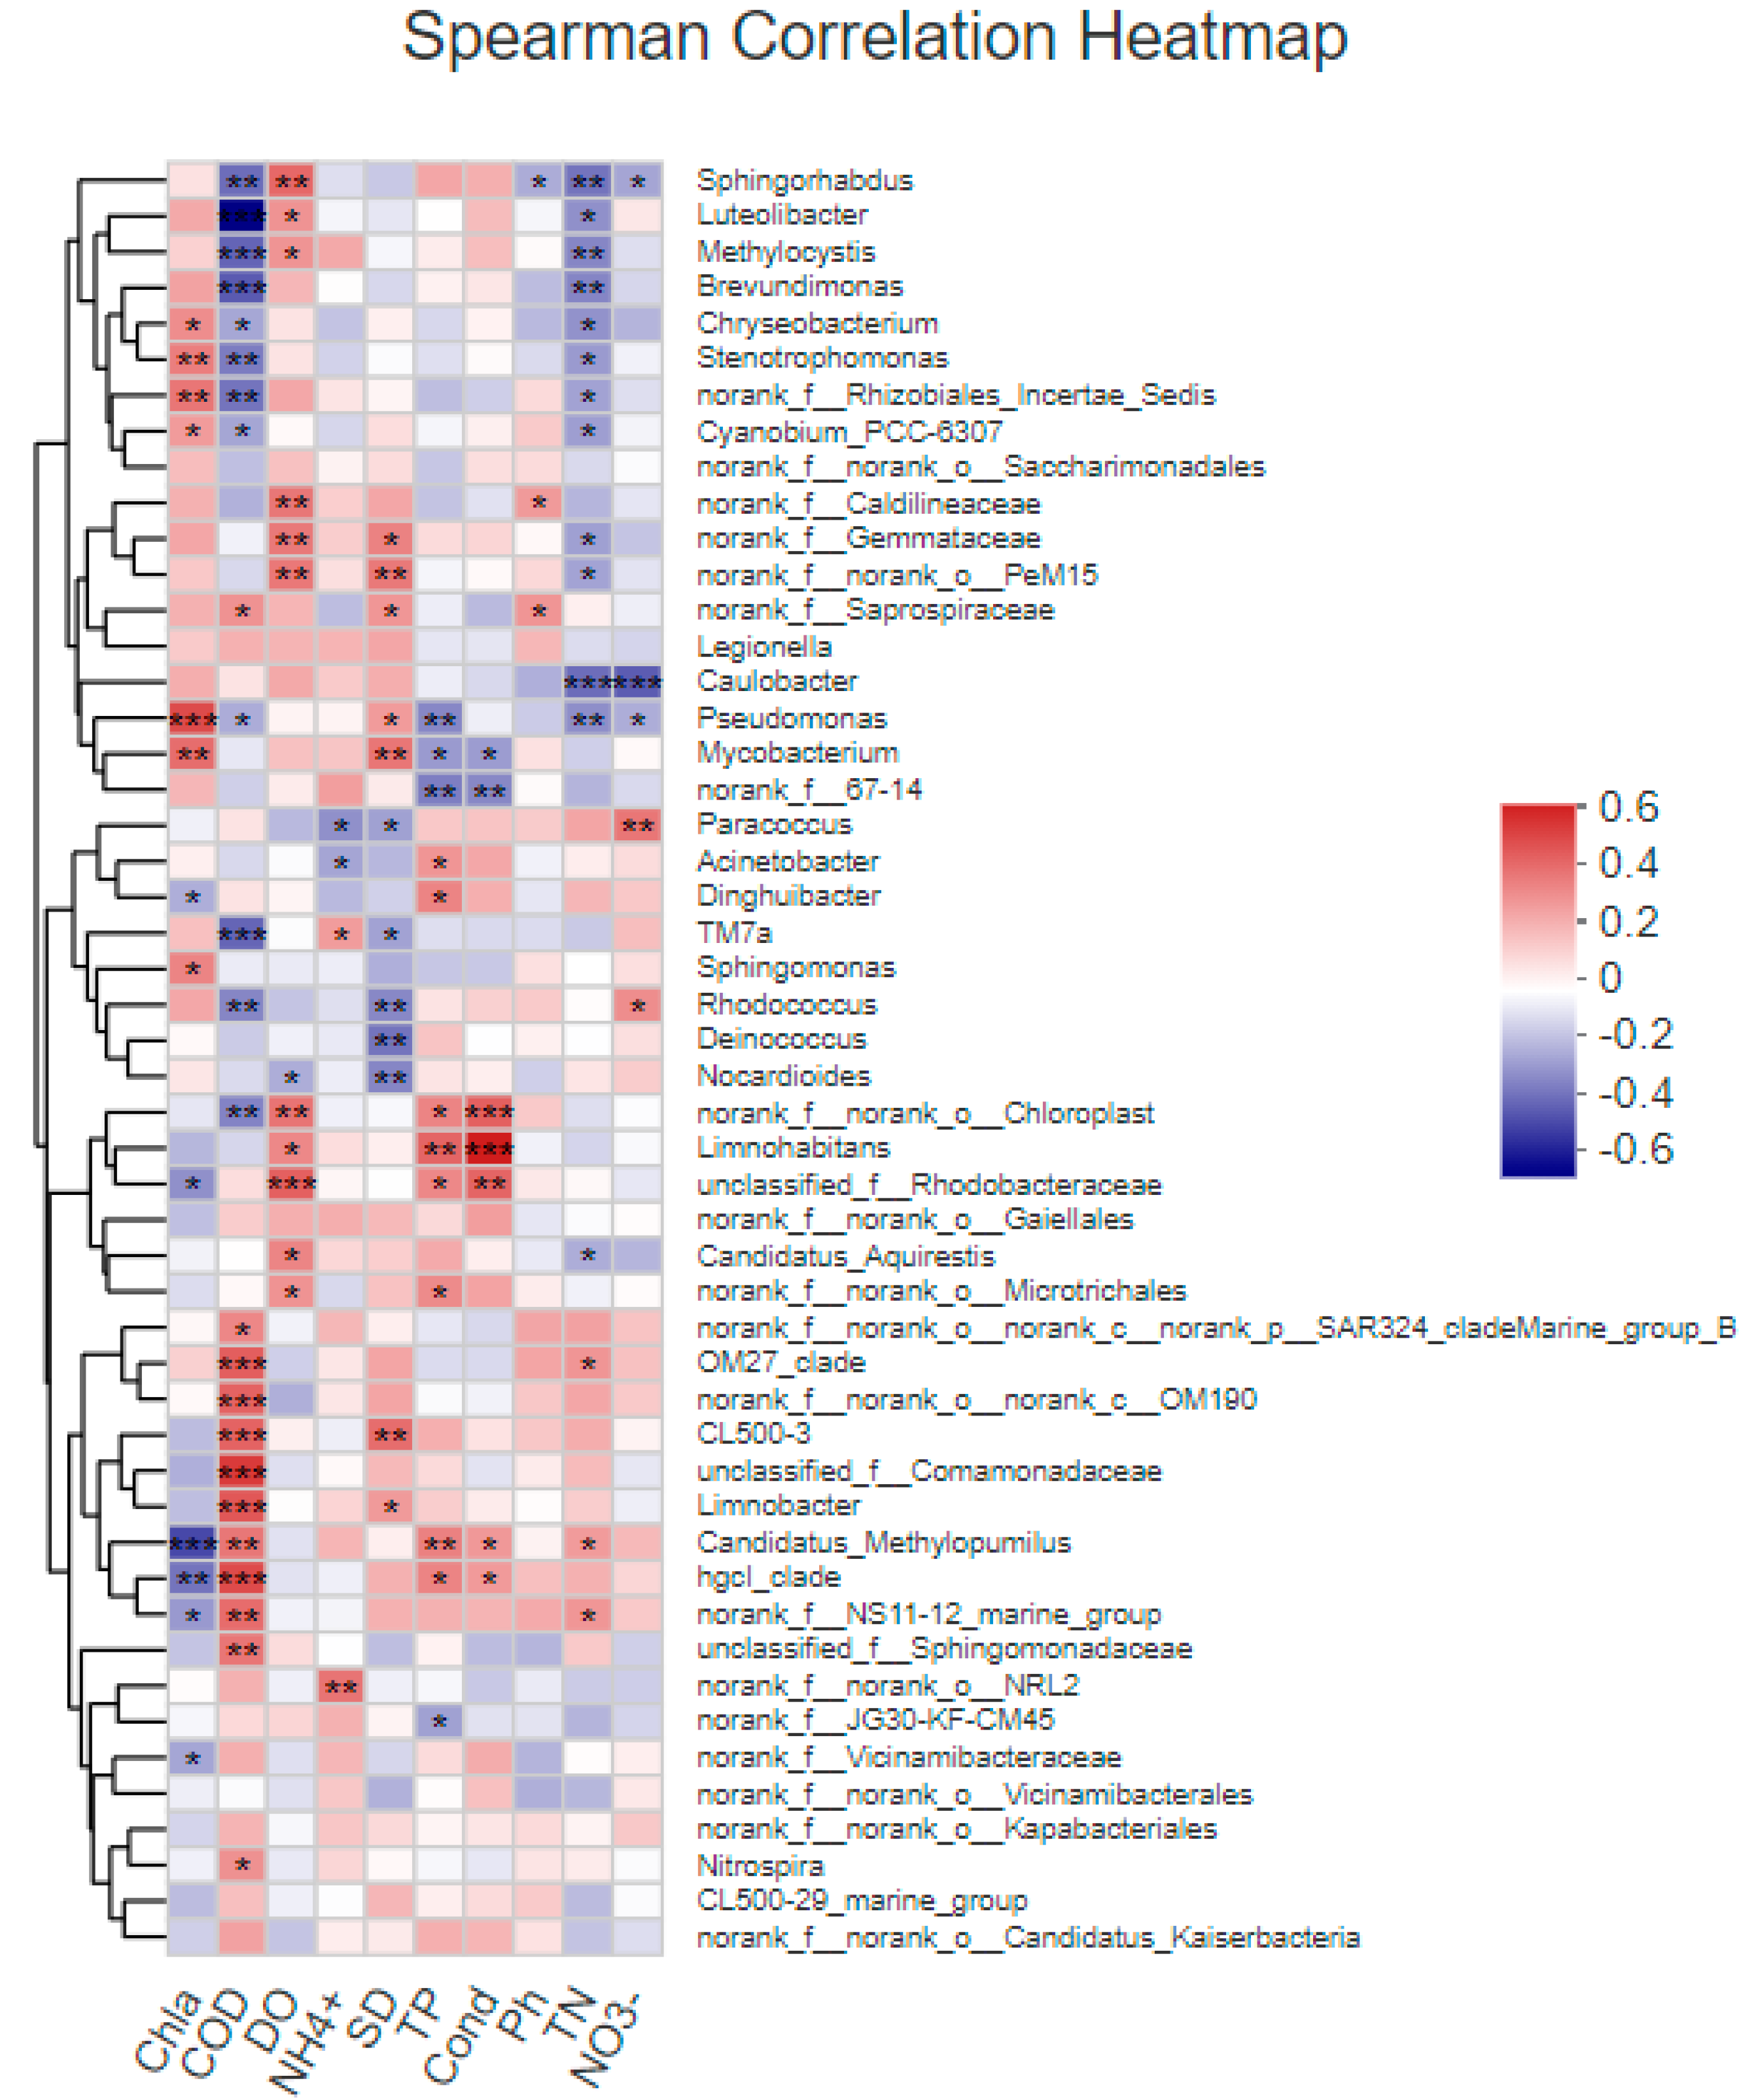
3.4.1. Correlation between Bacterial Community Structure and Environmental Factors
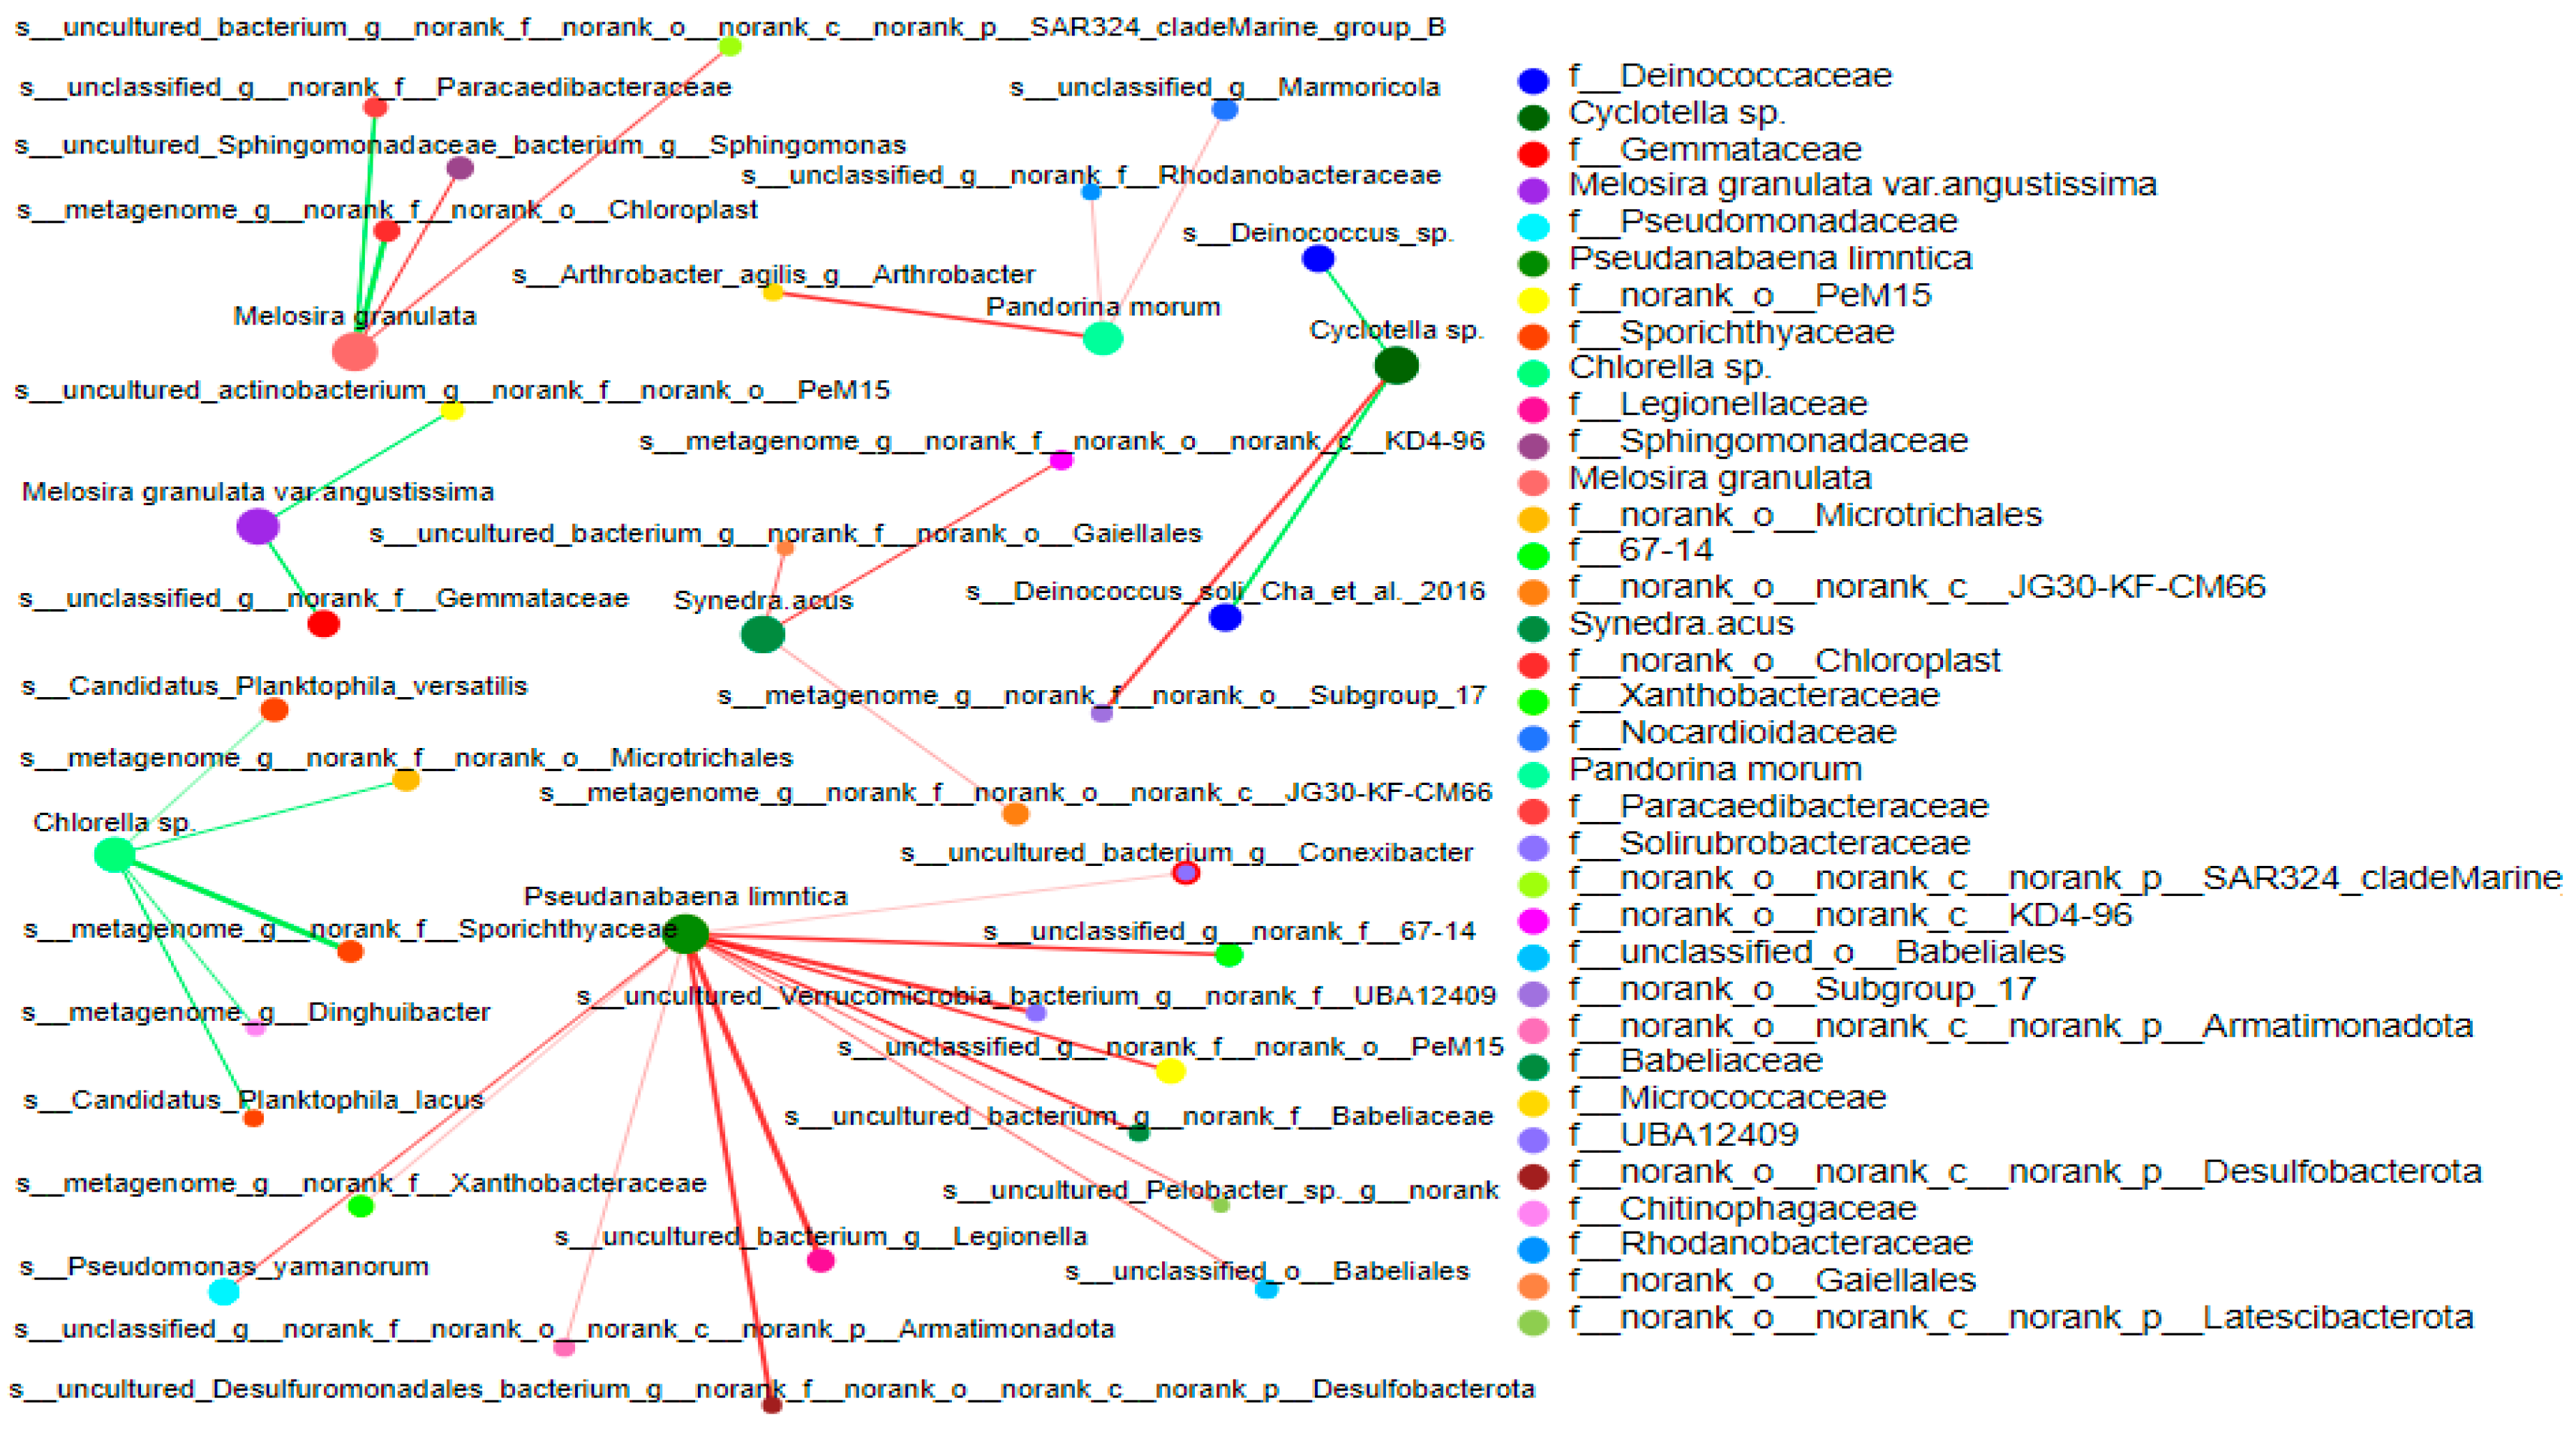
3.4.2. Correlation between Bacterial Community and Phytoplankton
3.5. Prediction of Bacterioplankton Function
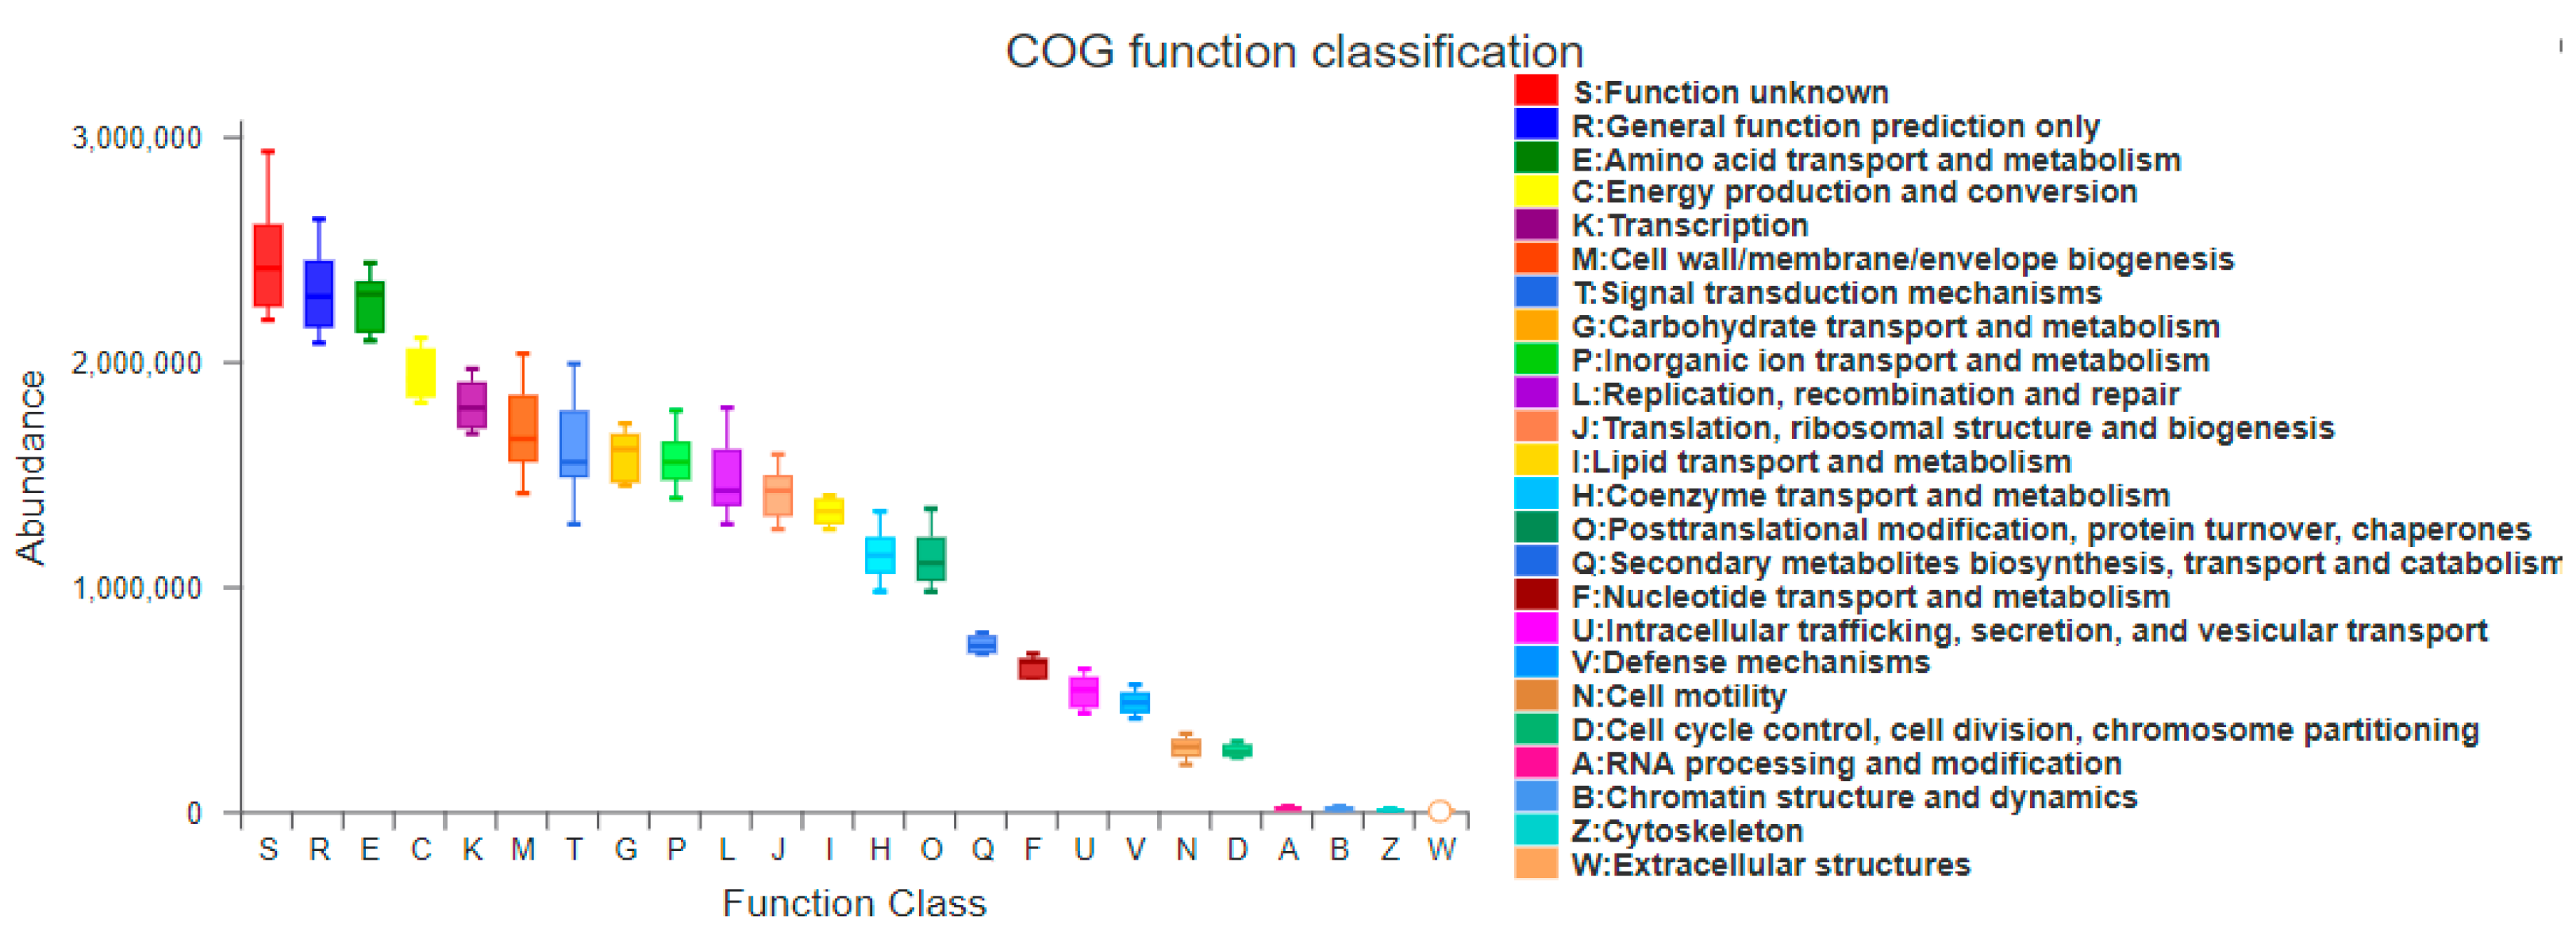
3.5.1. PICRUSt Functional Gene Prediction
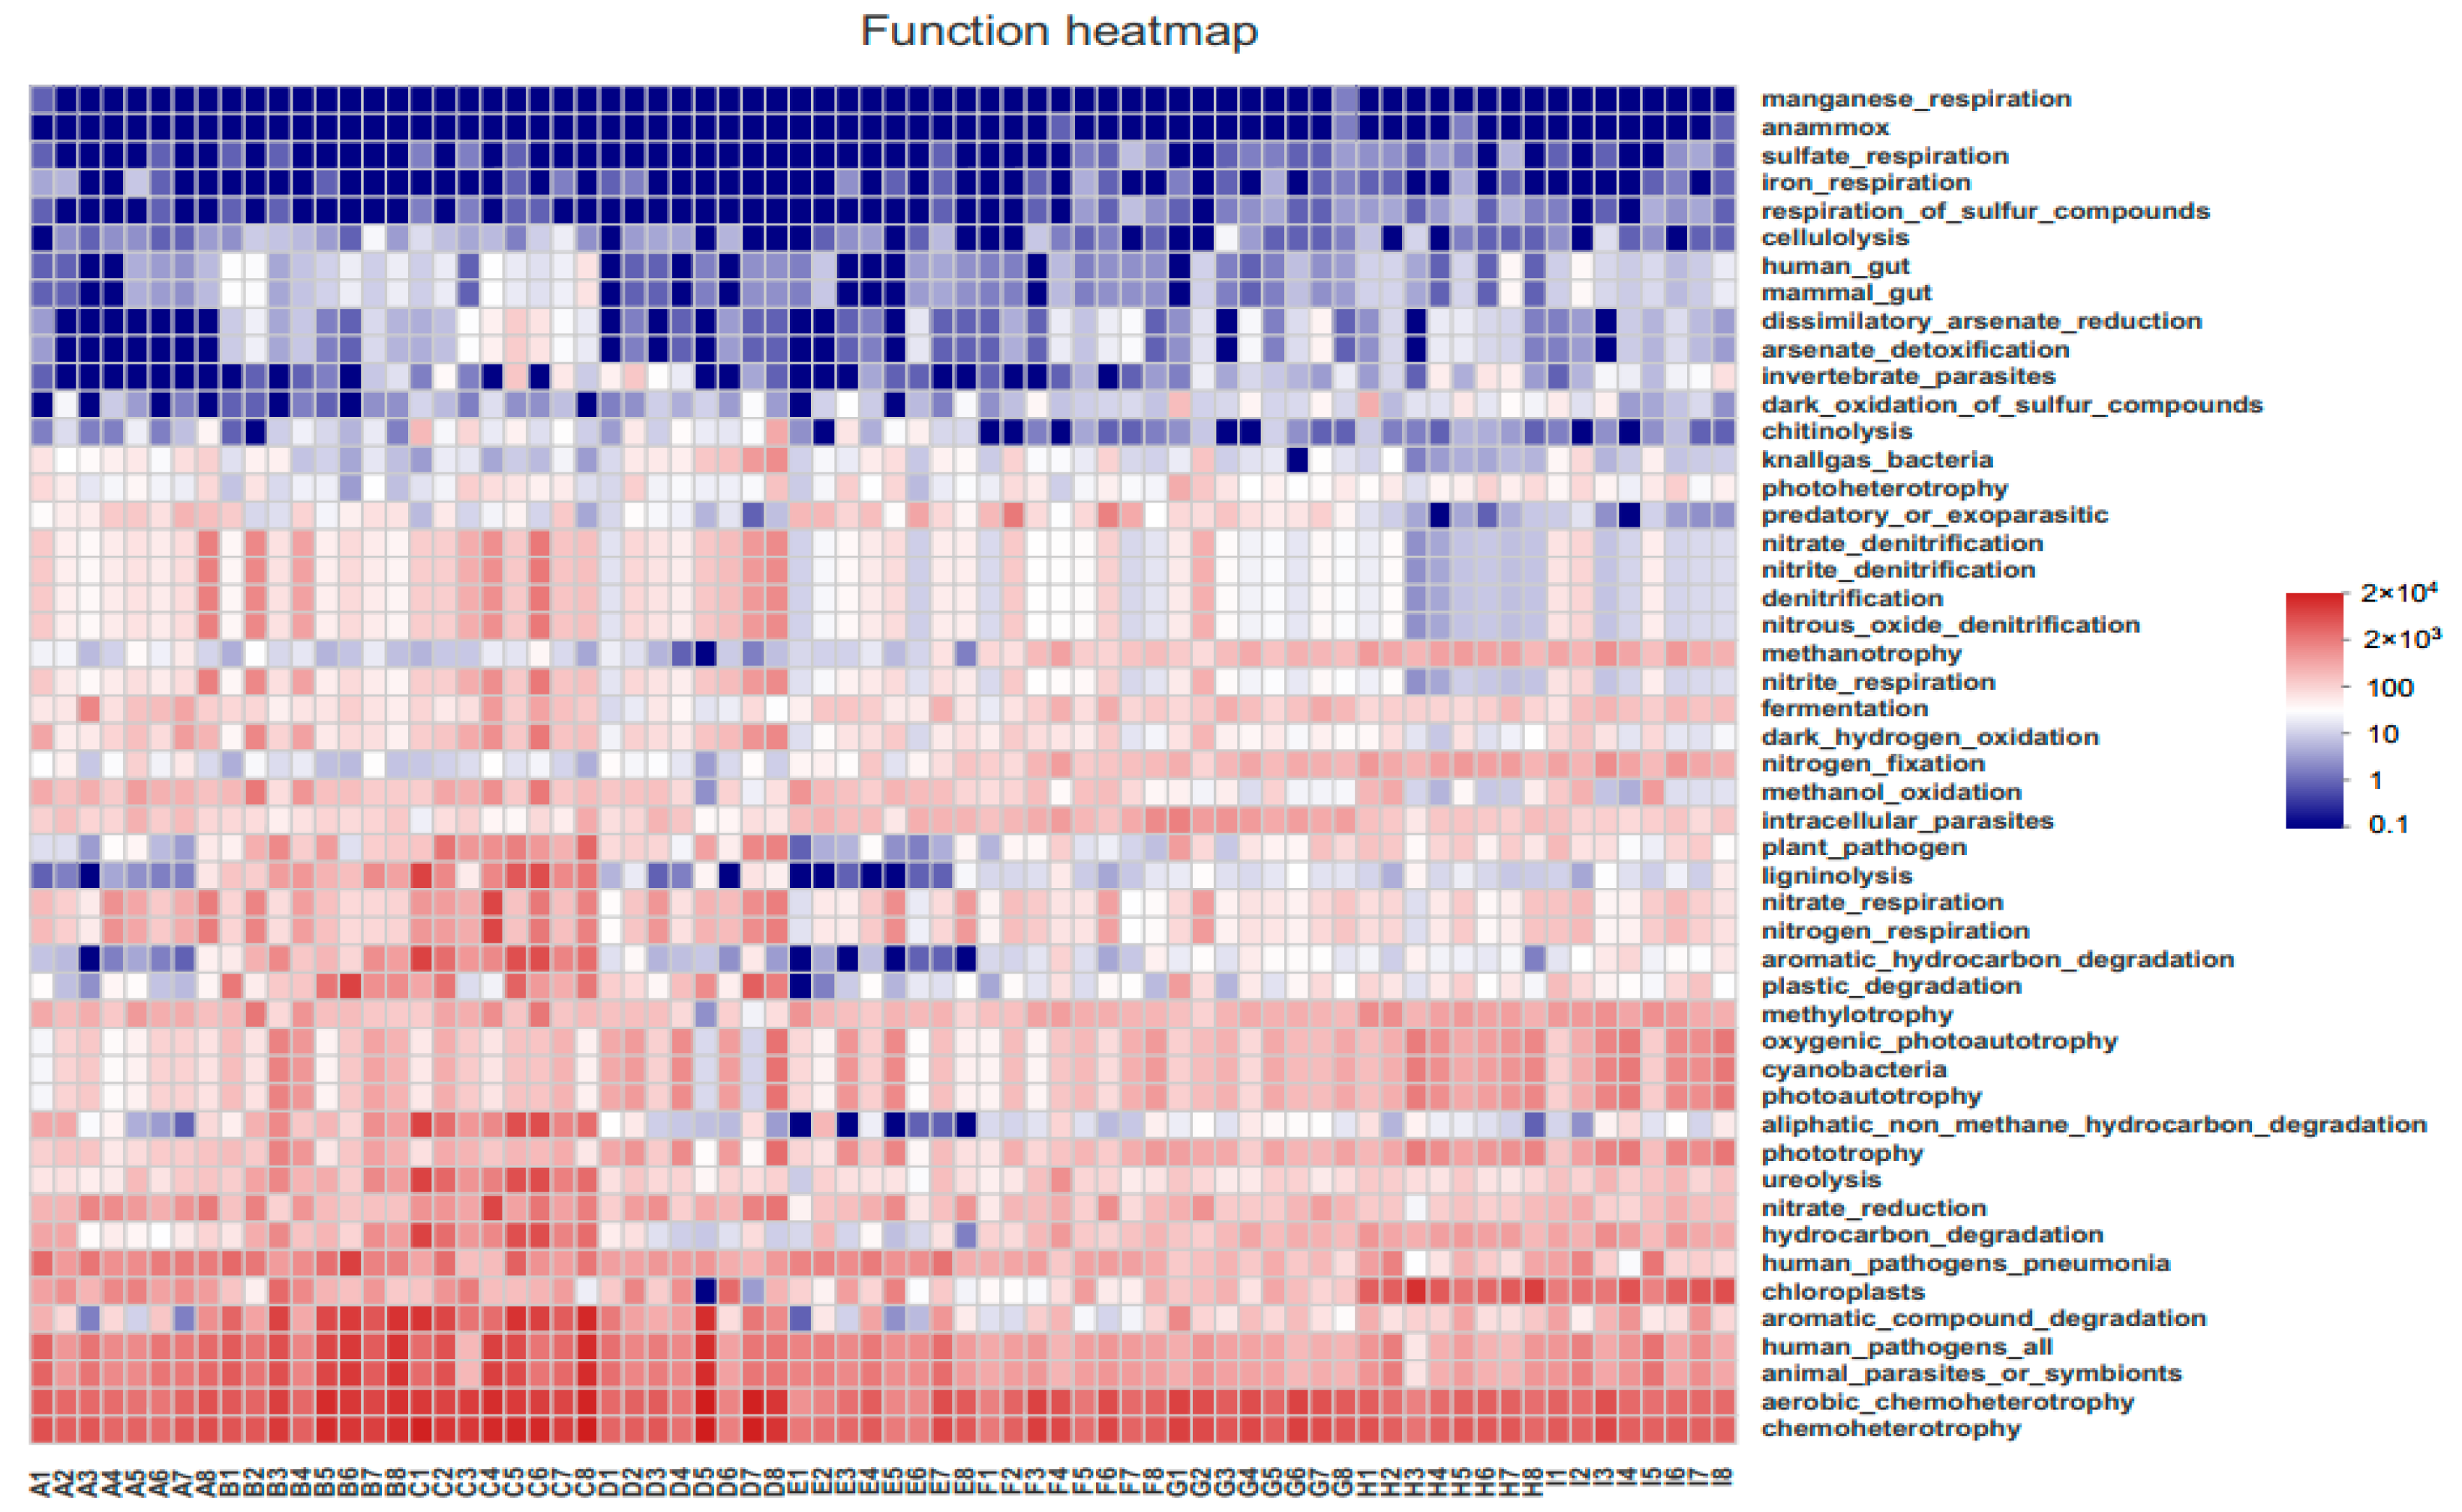
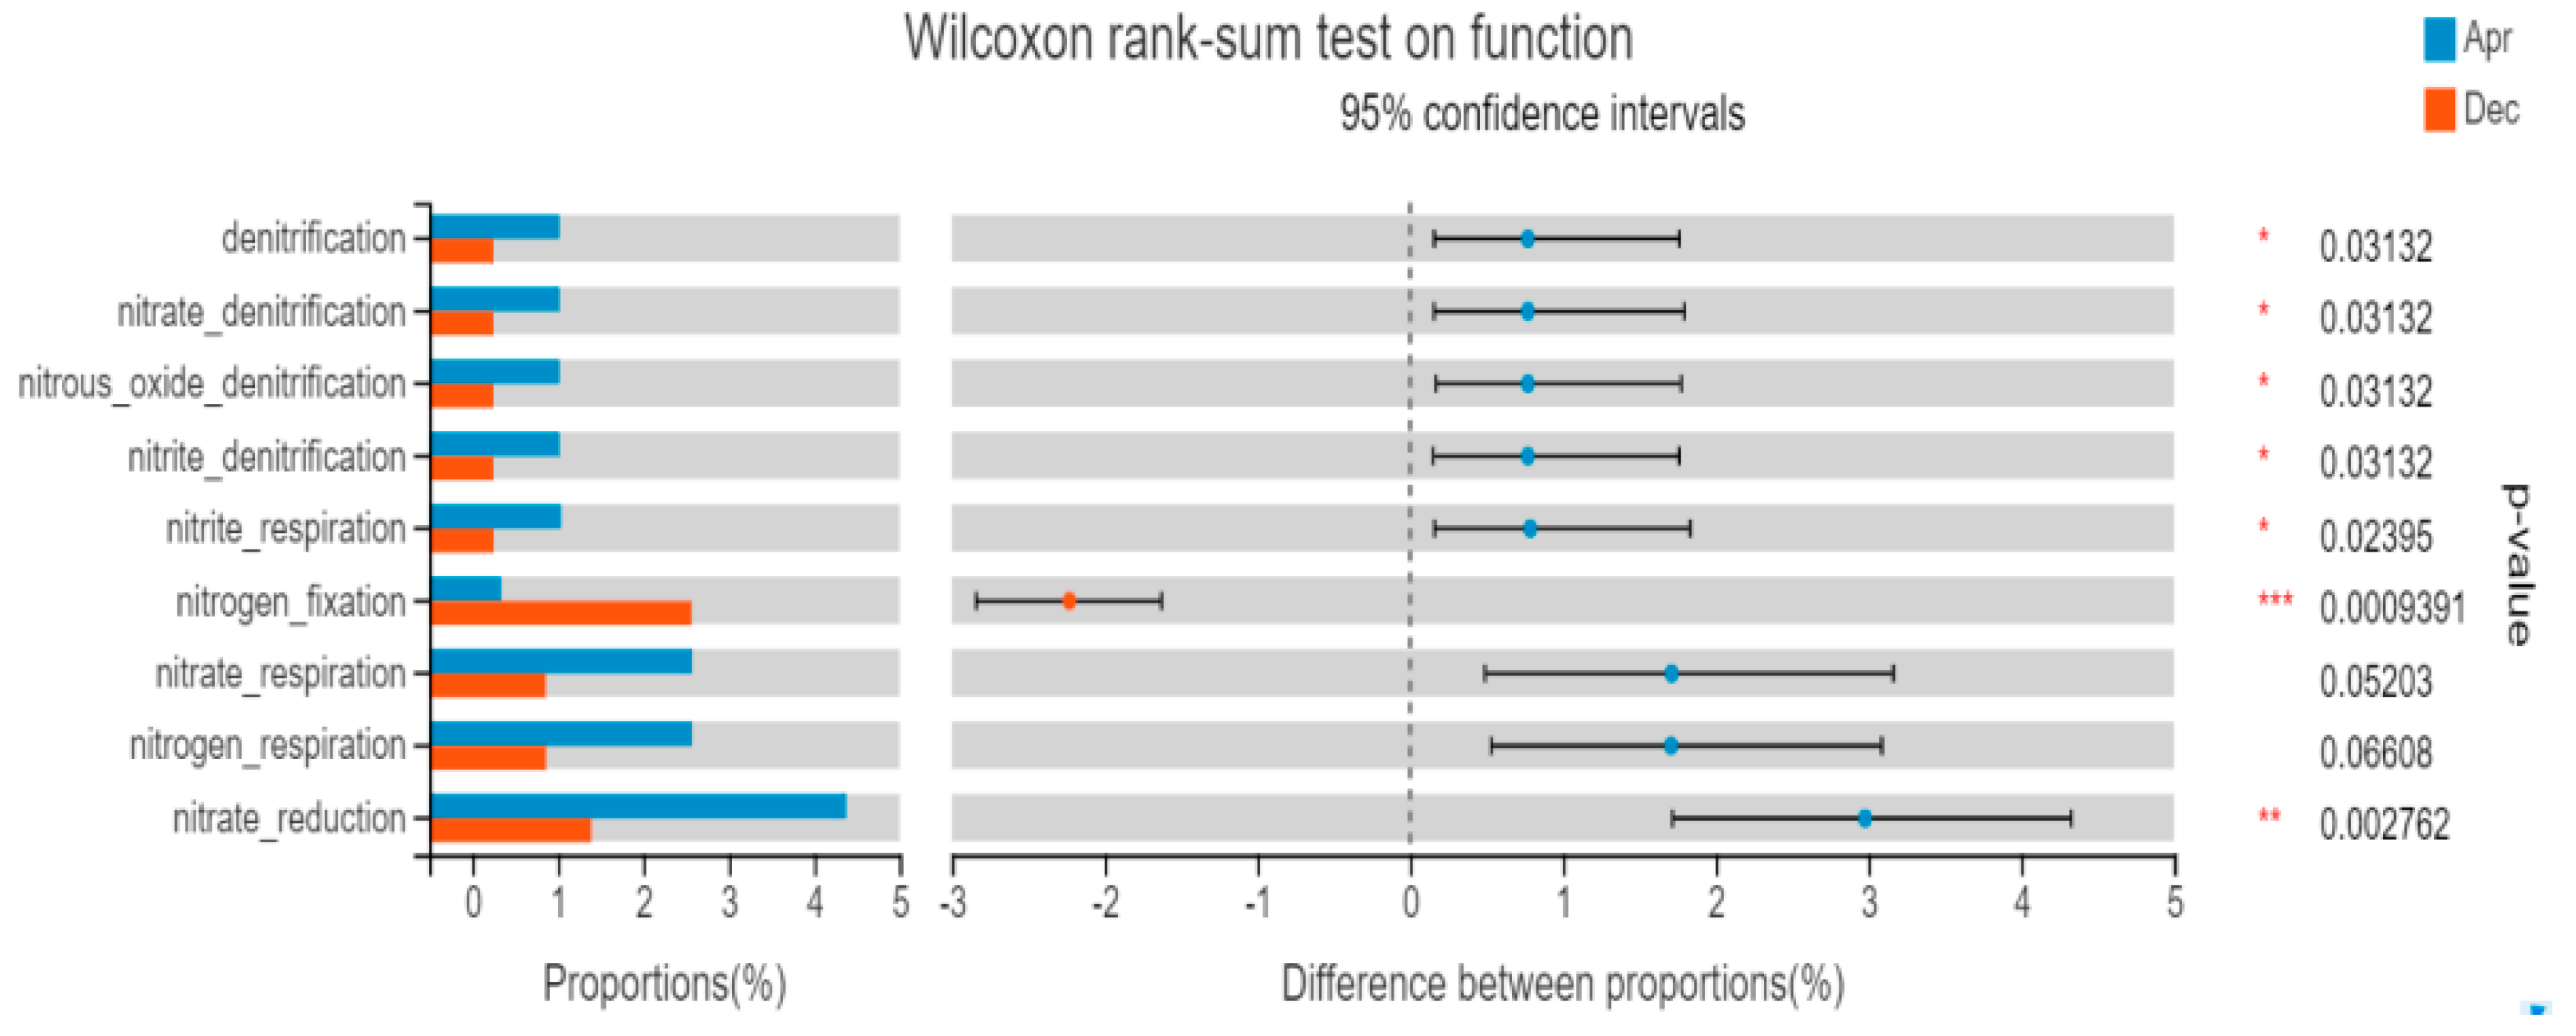
3.5.2. FAPROTAX Function Prediction
4. Discussion
4.1. Bacterial Community Diversity and Species Composition during the Non-Salty Tide Period in the Reservoir
4.2. Relationship between Bacterioplankton and Physical and Chemical Environmental Factors
4.3. Correlation between Bacterioplankton and Phytoplankton
4.4. Characteristics of Bacterioplankton Function Prediction
5. Conclusions
Author Contributions
Funding
Institutional Review Board Statement
Informed Consent Statement
Data Availability Statement
Conflicts of Interest
References
- Cloern, J. Our evolving conceptual model of the coastal eutrophication problem. Mar. Ecol. Prog. Ser. 2001, 210, 223–253. [Google Scholar] [CrossRef]
- Chen, Y.; Liu, R.; Sun, C.; Zhang, P.; Feng, C.; Shen, Z. Spatial and temporal variations in nitrogen and phosphorous nutrients in the Yangtze River Estuary. Mar. Pollut. Bull. 2012, 64, 2083–2089. [Google Scholar] [CrossRef] [PubMed]
- Ho, J.C.; Michalak, A.M.; Pahlevan, N. Widespread global increase in intense lake phytoplankton blooms since the 1980s. Nature 2019, 574, 667–670. [Google Scholar] [CrossRef]
- Schindler, D.W. The dilemma of controlling cultural eutrophication of lakes. Proc. R. Soc. B Boil. Sci. 2012, 279, 4322–4333. [Google Scholar] [CrossRef] [PubMed] [Green Version]
- Jiang, Y.; Xu, C.; Wu, X.; Chen, Y.; Han, W.; Gin, K.Y.H.; He, Y. Occurrence, seasonal variation and risk assessment of antibi-otics in Qingcaosha reservoir. Water 2018, 10, 115. [Google Scholar] [CrossRef] [Green Version]
- Chen, Y.; Zhu, J. Reducing eutrophication risk of a reservoir by water replacement: A case study of the Qingcaosha reservoir in the Changjiang Estuary. Acta Oceanol. Sin. 2018, 37, 23–29. [Google Scholar] [CrossRef]
- Liu, X.P.; Zhang, W.; Wang, L.Q.; Jiang, Y.; Liu, C.; Zheng, X. Structure of phytoplankton community and its relationship with environmental factors in Qingcaosha Reservoir. J. Shanghai Ocean. Univ. 2015, 24, 532–543. [Google Scholar]
- Wagg, C.; Schlaeppi, K.; Banerjee, S.; Kuramae, E.E.; van der Heijden, M.G. Fungal-bacterial diversity and microbiome com-plexity predict ecosystem functioning. Nat. Commun. 2019, 10, 4841. [Google Scholar] [CrossRef]
- Cerro-Gálvez, E.; Sala, M.M.; Marrasé, C.; Gasol, J.M.; Dachs, J.; Vila-Costa, M. Modulation of microbial growth and enzy-matic activities in the marine environment due to exposure to organic contaminants of emerging concern and hydrocarbons. Sci. Total Environ. 2019, 678, 486–498. [Google Scholar] [CrossRef]
- Azam, F.; Fenchel, T.; Field, J.G.; Gray, J.; Meyer-Reil, L.; Thingstad, F. The Ecological Role of Water-Column Microbes in the Sea. Mar. Ecol. Prog. Ser. 1983, 10, 257–263. [Google Scholar] [CrossRef]
- Naeem, S.; Hahn, D.R.; Schuurman, G. Producer–decomposer co-dependency influences biodiversity effects. Nature 2000, 403, 762–764. [Google Scholar] [CrossRef] [PubMed]
- Burns, C.W.; Galbraith, L.M. Relating planktonic microbial food web structure in lentic freshwater ecosystems to water quality and land use. J. Plankton Res. 2007, 29, 127–139. [Google Scholar] [CrossRef]
- Comte, J.; Lovejoy, C.; Crevecoeur, S.; Vincent, W.F. Co-occurrence patterns in aquatic bacterial communities across chang-ing permafrost landscapes. Biogeosciences 2006, 13, 175–190. [Google Scholar] [CrossRef] [Green Version]
- Yu, S.-X.; Pang, Y.-L.; Wang, Y.-C.; Li, J.-L.; Qin, S. Distribution of bacterial communities along the spatial and environmental gradients from Bohai Sea to northern Yellow Sea. PeerJ 2018, 6, e4272. [Google Scholar] [CrossRef] [PubMed] [Green Version]
- Brooks, B.W.; Lazorchak, J.M.; Howard, M.D.; Johnson, M.V.V.; Morton, S.L.; Perkins, D.A.; Steevens, J.A. Are harmful algal blooms becoming the greatest inland water quality threat to public health and aquatic ecosystems? Environ. Toxicol. Chem. 2016, 35, 6–13. [Google Scholar] [CrossRef]
- Teeling, H.; Fuchs, B.M.; Becher, D.; Klockow, C.; Gardebrecht, A.; Bennke, C.M.; Kassabgy, M.; Huang, S.; Mann, A.J.; Waldmann, J.; et al. Substrate-Controlled Succession of Marine Bacterioplankton Populations Induced by a Phytoplankton Bloom. Science 2012, 336, 608–611. [Google Scholar] [CrossRef] [PubMed]
- McCarthy, M.J.; Lavrentyev, P.J.; Yang, L.; Zhang, L.; Chen, Y.; Qin, B.; Gardner, W.S. Nitrogen dynamics and microbial food web structure during a summer cyanobacterial bloom in a subtropical, shallow, well-mixed, eutrophic lake (Lake Taihu, China). Hydrobiologia 2007, 581, 195–207. [Google Scholar] [CrossRef]
- Zhou, J.; Zhang, B.-Y.; Yu, K.; Du, X.-P.; Zhu, J.-M.; Zeng, Y.-H.; Cai, Z.-H. Functional profiles of phycospheric microorganisms during a marine dinoflagellate bloom. Water Res. 2020, 173, 115554. [Google Scholar] [CrossRef]
- Parveen, B.; Ravet, V.; Djediat, C.; Mary, I.; Quiblier, C.; Debroas, D.; Humbert, J.F. Bacterial communities associated with M icrocystis colonies differ from free-living communities living in the same ecosystem. Environ. Microbiol. Rep. 2013, 5, 716–724. [Google Scholar]
- Meyer, N.; Bigalke, A.; Kaulfuß, A.; Pohnert, G. Strategies and ecological roles of algicidal bacteria. FEMS Microbiol. Rev. 2017, 41, 880–899. [Google Scholar] [CrossRef] [Green Version]
- Huang, X.; Zhu, J.; Cai, Z.; Lao, Y.; Jin, H.; Yu, K.; Zhang, B.; Zhou, J. Profiles of quorum sensing (QS)-related sequences in phycospheric microorganisms during a marine dinoflagellate bloom, as determined by a metagenomic approach. Microbiol. Res. 2018, 217, 1–13. [Google Scholar] [CrossRef]
- Shi, L.; Huang, Y.; Zhang, M.; Yu, Y.; Lu, Y.; Kong, F. Bacterial community dynamics and functional variation during the long-term decomposition of cyanobacterial blooms in-vitro. Sci. Total. Environ. 2017, 598, 77–86. [Google Scholar] [CrossRef]
- Bouvy, M.; Bettarel, Y.; Bouvier, C.; Domaizon, I.; Jacquet, S.; Le Floc’H, E.; Montanié, H.; Mostajir, B.; Sime-Ngando, T.; Torréton, J.P.; et al. Trophic interactions between viruses, bacteria and nanoflagellates under various nutrient conditions and simulated climate change. Environ. Microbiol. 2011, 13, 1842–1857. [Google Scholar] [CrossRef]
- Li, K.; Hu, J.; Li, T.; Liu, F.; Tao, J.; Liu, J.; Zhang, Z.; Luo, X.; Li, L.; Deng, Y.; et al. Microbial abundance and diversity investigations along rivers: Current knowledge and future directions. Wiley Interdiscip. Rev. Water 2021, 8, e1547. [Google Scholar] [CrossRef]
- Hillebrand, H.; Watermann, F.; Karez, R.; Berninger, U.-G. Differences in species richness patterns between unicellular and multicellular organisms. Oecologia 2001, 126, 114–124. [Google Scholar] [CrossRef]
- Chen, S.; Zhou, Y.; Chen, Y.; Gu, J. fastp: An ultra-fast all-in-one FASTQ preprocessor. Bioinformatics 2018, 34, i884–i890. [Google Scholar] [CrossRef] [PubMed]
- Magoč, T.; Salzberg, S. FLASH: Fast length adjustment of short reads to improve genome assemblies. Bioinformatics 2011, 27, 2957–2963. [Google Scholar] [CrossRef] [PubMed]
- Stackebrandt, E.; Goebel, B.M. Taxonomic Note: A Place for DNA-DNA Reassociation and 16S rRNA Sequence Analysis in the Present Species Definition in Bacteriology. Int. J. Syst. Evol. Microbiol. 1994, 44, 846–849. [Google Scholar] [CrossRef] [Green Version]
- Edgar, R.C. UPARSE: Highly accurate OTU sequences from microbial amplicon reads. Nat. Methods 2013, 10, 996–998. [Google Scholar] [CrossRef] [PubMed]
- Wang, Q.; Garrity, G.M.; Tiedje, J.M.; Cole, J.R. Naive Bayesian classifier for rapid assignment of rRNA sequences into the new bacterial taxonomy. Appl. Environ. Microbiol. 2007, 73, 5261–5267. [Google Scholar] [CrossRef] [PubMed] [Green Version]
- Austin, M.P. Relationships among Functional Properties of Californian Grassland. Nature 1968, 217, 1163. [Google Scholar] [CrossRef]
- Sunagawa, S.; Coelho, L.P.; Chaffron, S.; Kultima, J.R.; Labadie, K.; Salazar, G.; Djahanschiri, B.; Zeller, G.; Mende, D.R.; Alberti, A.; et al. Structure and function of the global ocean microbiome. Science 2015, 348, 1261359. [Google Scholar] [CrossRef] [PubMed] [Green Version]
- Han, M.; Gong, Y.; Zhou, C.; Zhang, J.; Wang, Z.; Ning, K. Comparison and interpretation of taxonomical structure of bacte-rial communities in two types of lakes on Yun-Gui plateau of China. Sci. Rep. 2016, 6, 30616. [Google Scholar] [CrossRef] [PubMed] [Green Version]
- Read, D.; Gweon, H.S.; Bowes, M.; Newbold, L.; Field, D.; Bailey, M.J.; Griffiths, R. Catchment-scale biogeography of riverine bacterioplankton. ISME J. 2014, 9, 516–526. [Google Scholar] [CrossRef] [PubMed] [Green Version]
- Zhang, H.-H.; Chen, S.-N.; Huang, T.-L.; Ma, W.-X.; Xu, J.-L.; Sun, X. Vertical Distribution of Bacterial Community Diversity and Water Quality during the Reservoir Thermal Stratification. Int. J. Environ. Res. Public Health 2015, 12, 6933–6945. [Google Scholar] [CrossRef] [PubMed] [Green Version]
- Rusch, D.B.; Halpern, A.L.; Sutton, G.; Heidelberg, K.; Williamson, S.; Yooseph, S.; Wu, D.; Eisen, J.A.; Hoffman, J.M.; Remington, K.; et al. The Sorcerer II Global Ocean Sampling Expedition: Northwest Atlantic through Eastern Tropical Pacific. PLoS Biol. 2007, 5, e77. [Google Scholar] [CrossRef] [PubMed]
- Staley, C.; Pongsilp, N.; Nimnoi, P.; Kaiser, T.; Sadowsky, M.J. Influence of Physicochemical Factors on Bacterial Communities Along the Lower Mekong River Assessed by Illumina Next-Generation Sequencing. Water Air Soil Pollut. 2018, 229, 321. [Google Scholar] [CrossRef]
- Mansour, I.; Heppell, C.M.; Ryo, M.; Rillig, M. Application of the microbial community coalescence concept to riverine networks. Biol. Rev. 2018, 93, 1832–1845. [Google Scholar] [CrossRef] [Green Version]
- Su, X.; Steinman, A.D.; Xue, Q.; Zhao, Y.; Tang, X.; Xie, L. Temporal patterns of phyto-and bacterioplankton and their rela-tionships with environmental factors in Lake Taihu, China. Chemosphere 2017, 184, 299–308. [Google Scholar] [CrossRef] [PubMed]
- Wei, G.; Li, J.; Wang, N.; Gao, Z. Spatial abundance and diversity of bacterioplankton in a typical stream-forming ecosystem, Huangqian Reservoir, China. J. Microbiol. Biotechnol. 2014, 24, 1308–1318. [Google Scholar] [CrossRef] [PubMed] [Green Version]
- Zhou, Z.; Huang, T.; Gong, W.; Li, Y.; Liu, Y.; Zhou, S. Field research on mixing aeration in a drinking water reservoir: Per-formance and microbial community structure. Int. J. Environ. Res. Public Health 2019, 16, 4221. [Google Scholar]
- Vrede, K. Nutrient and Temperature Limitation of Bacterioplankton Growth in Temperate Lakes. Microb. Ecol. 2005, 49, 245–256. [Google Scholar] [CrossRef]
- Ji, B.; Yang, K.; Zhu, L.; Jiang, Y.; Wang, H.; Zhou, J.; Zhang, H. Aerobic denitrification: A review of important advances of the last 30 years. Biotechnol. Bioprocess Eng. 2015, 20, 643–651. [Google Scholar] [CrossRef]
- Yang, Y.; Li, S.; Gao, Y.; Chen, Y.; Zhan, A. Environment-driven geographical distribution of bacterial communities and identification of indicator taxa in Songhua River. Ecol. Indic. 2019, 101, 62–70. [Google Scholar] [CrossRef]
- Dokulil, M.; Teubner, K. Cyanobacterial dominance in lakes. Hydrobiologia 2000, 438, 1–12. [Google Scholar] [CrossRef]
- Xing, P.; & Kong, F. Intra-habitat heterogeneity of environmental factors regulating bacterioplankton community composi-tion in Lake Taihu, China. Aquat. Microb. Ecol. 2007, 48, 113–122. [Google Scholar] [CrossRef]
- Zhu, C.; Zhang, J.; Nawaz, M.Z.; Mahboob, S.; Al-Ghanim, K.A.; Khan, I.A.; Chen, T. Seasonal succession and spatial distribu-tion of bacterial community structure in a eutrophic freshwater Lake, Lake Taihu. Sci. Total Environ. 2019, 669, 29–40. [Google Scholar] [CrossRef]
- Langer, U.; Bohme, L.; Bohme, F. Short communication classification of soil microorganisms based on growth properties: A critical view of some commonly used terms. Z. Pflanzen. Bodenk. 2004, 167, 267. [Google Scholar] [CrossRef]
- Xing, P.; Guo, L.; Tian, W.; Wu, Q.L. Novel Clostridium populations involved in the anaerobic degradation of Microcystis blooms. ISME J. 2010, 5, 792–800. [Google Scholar] [CrossRef] [Green Version]
- Li, H.; Xing, P.; Chen, M.; Bian, Y.; Wu, Q.L. Short-term bacterial community composition dynamics in response to accumula-tion and breakdown of Microcystis blooms. Water Res. 2011, 45, 1702–1710. [Google Scholar] [CrossRef]
- Mujakić, I.; Andrei, A.Ş.; Shabarova, T.; Fecskeová, L.K.; Salcher, M.M.; Piwosz, K.; Koblížek, M. Common Presence of Pho-totrophic Gemmatimonadota in Temperate Freshwater Lakes. mSystems 2021, 6, e01241-20. [Google Scholar] [CrossRef] [PubMed]
- Zhang, H.; Sekiguchi, Y.; Hanada, S.; Hugenholtz, P.; Kim, H.; Kamagata, Y.; Nakamura, K. Gemmatimonas aurantiaca gen. nov., sp. nov., a Gram-negative, aerobic, polyphosphate-accumulating micro-organism, the first cultured representative of the new bacterial phylum Gemmatimonadetes phyl. nov. Int. J. Syst. Evol. Microbiol. 2003, 53, 1155–1163. [Google Scholar] [CrossRef] [PubMed]
- Daims, H.; Taylor, M.; Wagner, M. Wastewater treatment: A model system for microbial ecology. Trends Biotechnol. 2006, 24, 483–489. [Google Scholar] [CrossRef] [PubMed]
- Niu, Y.; Shen, H.; Chen, J.; Xie, P.; Yang, X.; Tao, M.; Ma, Z.; Qi, M. Phytoplankton community succession shaping bacterioplankton community composition in Lake Taihu, China. Water Res. 2011, 45, 4169–4182. [Google Scholar] [CrossRef]
- Brunberg, A.K. Contribution of bacteria in the mucilage of microcystis spp. (Cyanobacteria) to benthic and pelagic bacterial production in a hypereutrophic lake. FEMS Microbiol. Ecol. 1999, 29, 13–22. [Google Scholar] [CrossRef]
- Salomon, P.S.; Janson, S.; Granéli, E. Molecular identification of bacteria associated with filaments of Nodularia spumigena and their effect on the cyanobacterial growth. Harmful Algae 2003, 2, 261–272. [Google Scholar] [CrossRef]
- Grossart, H.P.; Levold, F.; Allgaier, M.; Simon, M.; Brinkhoff, T. Marine diatom species harbour distinct bacterial communi-ties. Environ. Microbiol. 2005, 7, 860–873. [Google Scholar] [CrossRef]
- Li, H.; Xing, P.; Wu, Q.L. Characterization of the bacterial community composition in a hypoxic zone induced by Microcystis blooms in Lake Taihu, China. FEMS Microbiol. Ecol. 2012, 79, 773–784. [Google Scholar] [CrossRef]
- Xing, P.; Zheng, J.; Li, H.; Liu, Q. Methanogen genotypes involved in methane formation during anaerobic decomposition of Microcystis blooms at different temperatures. World J. Microbiol. Biotechnol. 2012, 29, 373–377. [Google Scholar] [CrossRef]
- Mouillot, D.; Graham, N.; Villéger, S.; Mason, N.W.; Bellwood, D.R. A functional approach reveals community responses to disturbances. Trends Ecol. Evol. 2013, 28, 167–177. [Google Scholar] [CrossRef]
- Beck, W.S.; Rugenski, A.T.; Poff, N.L. Influence of experimental, environmental, and geographic factors on nutrient-diffusing substrate experiments in running waters. Freshw. Biol. 2017, 62, 1667–1680. [Google Scholar] [CrossRef] [Green Version]
- Luo, J.; Liang, H.; Yan, L.; Ma, J.; Yang, Y.; Li, G. Microbial community structures in a closed raw water distribution system biofilm as revealed by 454-pyrosequencing analysis and the effect of microbial biofilm communities on raw water quality. Bioresour. Technol. 2013, 148, 189–195. [Google Scholar] [CrossRef] [PubMed]
- Suzuki, D.; Li, Z.; Cui, X.; Zhang, C.; Katayama, A. Reclassification of Desulfobacterium anilini as Desulfatiglans anilini comb. nov. within Desulfatiglans gen. nov., and description of a 4-chlorophenol-degrading sulfate-reducing bacterium, Desulfatiglans parachlorophenolica sp. nov. Int. J. Syst. Evol. Microbiol. 2014, 64, 3081–3086. [Google Scholar] [CrossRef]
- Huang, T.; Guo, L.; Zhang, H.; Su, J.; Wen, G.; Zhang, K. Nitrogen-removal efficiency of a novel aerobic denitrifying bacte-rium, Pseudomonas stutzeri strain ZF31, isolated from a drinking-water reservoir. Bioresour. Technol. 2015, 196, 209–216. [Google Scholar] [CrossRef] [PubMed]


| Environmental Factor | ST1 | ST2 | ST3 | ST4 | ST5 | ST6 | ST7 | ST8 |
|---|---|---|---|---|---|---|---|---|
| TP (mg/L) | 0.21 a | 0.22 ab | 0.21 a | 0.17 a | 0.23 a | 0.15 a | 0.17 a | 0.14 a |
| (0.14–0.39) | (0.1–0.4) | (0.09–0.41) | (0.11–0.33) | (0.14–0.43) | (0.08–0.27) | (0.10–0.29) | (0.10~0.20) | |
| TN (mg/L) | 2.10 b | 1.92 b | 1.36 a | 1.35 a | 1.55 a | 1.35 a | 1.25 a | 1.26 a |
| (1.50–2.46) | (1.4–2.31) | (1.19–1.74) | (1.00–1.79) | (1.10–2.12) | (0.99–1.67) | (0.64–1.92) | (0.90–2.03) | |
| NH4+-N (mg/L) | 0.02 a | 0.03 b | 0.02 a | 0.02 a | 0.01 a | 0.01 a | 0.01 a | 0.01 a |
| (0.004–0.031) | (0.013–0.053) | (0.009–0.064) | (0.01–0.024) | (0.004–0.021) | (0.005–0.015) | (0.009–0.017) | (0.002–0.012) | |
| NO3−-N (mg/L) | 1.29 b | 1.21 ab | 1.00 a | 1.08 a | 1.16 ab | 1.03 a | 0.99 a | 1.02 a |
| (1.07–1.63) | (0.93–1.56) | (0.75–1.23) | (0.89–1.41) | (0.91–1.55) | (0.91–1.32) | (0.51–1.3) | (0.92–1.24) | |
| COD (mg/L) | 22 a | 24 a | 19 a | 19 a | 21 a | 19 a | 11 a | 15 a |
| (10–36) | (10–39) | (12–31) | (8–32) | (11–36) | (12–37) | (3–21) | (3–22) | |
| Chl a (μg/L) | 12.00 a | 14.38 ab | 16.06 ab | 21.98 b | 16.38 ab | 20.71 b | 32.95 c | 28.39 c |
| (1.22–24.79) | (8.22–28.22) | (13.36–23.69) | (16.71–29.37) | (4.11–24.11) | (20.25–21.22) | (22.47–42.39) | (25.88–36.57) | |
| SD (cm) | 0.29 a | 0.47 a | 0.76 b | 0.78 b | 0.49 a | 0.77 b | 0.79 b | 0.83 b |
| (0.15–0.50) | (0.15–0.91) | (0.45–1.26) | (0.40–1.25) | (0.20–0.90) | (0.43–1.09) | (0.50–0.93) | (0.49–1.07) | |
| pH | 8.11 a | 8.15 a | 9.15 a | 9.26 a | 9.12 a | 8.92 a | 8.58 a | 8.62 a |
| (6.36–9.19) | (7.46–8.59) | (8.60–10.27) | (8.56–10.04) | (8.37–10.63) | (8.38–10.08) | (7.39–9.75) | (6.63–10.01) | |
| DO (mg/L) | 8.33 a | 9.52 a | 10.24 a | 10.09 a | 9.49 a | 9.84 a | 9.31 a | 9.21 a |
| (5.3–10.77) | (8.0–10.63) | (9.37–11.95) | (9.11–11.7) | (5.3–12.66) | (8.48–12.04) | (6.87–11.90) | (6.76–12.12) | |
| Cond (μs/cm) | 330.24 a | 313.68 a | 302.87 a | 302.46 a | 323.11 a | 305.44 a | 306.90 a | 306.40 a |
| (254.30–469.50) | (261.30–383.10) | (247.20–352.10) | (247.90–351.90) | (274.60–400.70) | (260.40–357.10) | (258.40–353.20) | (253.60–351.50) |
| Phylum | Dominant Species | Apr. | May | Jun. | Jul. | Aug. | Sep. | Oct. | Nov. | Dec. |
|---|---|---|---|---|---|---|---|---|---|---|
| Cyanophyta | Synechococcus bigranulatus | 0.471 | - | - | - | - | - | - | - | - |
| Pseudanabaena sp. | - | - | - | 0.080 | 0.171 | 0.692 | 0.522 | 0.173 | ||
| Scenedesmus quadricauda | - | - | - | - | 0.024 | - | - | - | - | |
| Merismopedia minima | - | - | - | - | - | - | 0.115 | - | 0.050 | |
| Aphanocapsa delicatissima | - | - | - | - | - | - | 0.082 | - | - | |
| Bacillariophyta | Melosira granulata | - | 0.644 | 0.578 | 0.459 | 0.195 | 0.038 | 0.029 | 0.103 | 0.050 |
| Cyclotella sp. | - | 0.020 | 0.027 | 0.103 | 0.047 | 0.035 | 0.318 | 0.540 | ||
| Melosira granulata var. angustissima | - | 0.101 | 0.092 | 0.335 | 0.169 | |||||
| Cyclotella meneghiniana | - | - | - | - | - | - | - | 0.077 | 0.062 | |
| Synedra acus | 0.121 | - | - | - | - | - | - | - | - | |
| Chlorophyta | Oedogonium sp. | - | 0.113 | 0.105 | - | - | - | - | - | - |
| Pandorina morum | - | - | 0.037 | - | - | - | - | - | - | |
| Chlorella sp. | - | - | - | - | 0.055 | 0.022 | - | 0.101 | 0.149 | |
| Scenedesmus quadricauda | - | - | 0.048 | - | - | - | - | - | 0.050 | |
| Chlamydomonas sp. | - | 0.063 | 0.025 | - | - | - | - | 0.042 | 0.023 |
| Shannon | Apr. | May | Jun. | Jul. | Sep. | Aug. | Oct. | Nov. | Dec. |
|---|---|---|---|---|---|---|---|---|---|
| ST1 | 5.05522 | 4.327022 | 3.271228 | 4.320451 | 4.746119 | 3.167453 | 5.104217 | 5.051481 | 4.195682 |
| ST2 | 5.20597 | 4.930877 | 4.724719 | 4.823673 | 5.199873 | 4.879845 | 5.552623 | 5.168004 | 4.839735 |
| ST3 | 4.706655 | 3.876587 | 5.130286 | 4.736654 | 5.164861 | 4.87874 | 5.797169 | 3.441698 | 4.333132 |
| ST4 | 4.532297 | 4.413602 | 3.883676 | 4.082314 | 5.189498 | 4.594758 | 5.462392 | 3.929142 | 4.153756 |
| ST5 | 4.932523 | 3.714345 | 4.279125 | 2.913335 | 4.766668 | 5.57698 | 5.439537 | 4.635082 | 5.015866 |
| ST6 | 4.83352 | 3.521203 | 4.548778 | 4.052488 | 4.936798 | 5.134269 | 5.119537 | 4.229695 | 4.801377 |
| ST7 | 5.28414 | 5.215375 | 5.28474 | 3.400411 | 5.128758 | 4.986939 | 5.268078 | 4.335306 | 4.450574 |
| ST8 | 4.917163 | 3.918191 | 3.08248 | 4.515715 | 4.766734 | 5.534643 | 5.327223 | 4.298399 | 4.610231 |
Publisher’s Note: MDPI stays neutral with regard to jurisdictional claims in published maps and institutional affiliations. |
© 2021 by the authors. Licensee MDPI, Basel, Switzerland. This article is an open access article distributed under the terms and conditions of the Creative Commons Attribution (CC BY) license (https://creativecommons.org/licenses/by/4.0/).
Share and Cite
Liu, S.; Zhao, F.; Fang, X. The Relationship between the Community Structure and Function of Bacterioplankton and the Environmental Response in Qingcaosha Reservoir. Water 2021, 13, 3155. https://doi.org/10.3390/w13223155
Liu S, Zhao F, Fang X. The Relationship between the Community Structure and Function of Bacterioplankton and the Environmental Response in Qingcaosha Reservoir. Water. 2021; 13(22):3155. https://doi.org/10.3390/w13223155
Chicago/Turabian StyleLiu, Shumin, Fengbin Zhao, and Xin Fang. 2021. "The Relationship between the Community Structure and Function of Bacterioplankton and the Environmental Response in Qingcaosha Reservoir" Water 13, no. 22: 3155. https://doi.org/10.3390/w13223155
APA StyleLiu, S., Zhao, F., & Fang, X. (2021). The Relationship between the Community Structure and Function of Bacterioplankton and the Environmental Response in Qingcaosha Reservoir. Water, 13(22), 3155. https://doi.org/10.3390/w13223155