
Temporal and Spatial Variation of NDVI and Its Driving Factors in Qinling Mountain

Abstract
:1. Introduction
2. Materials and Methods
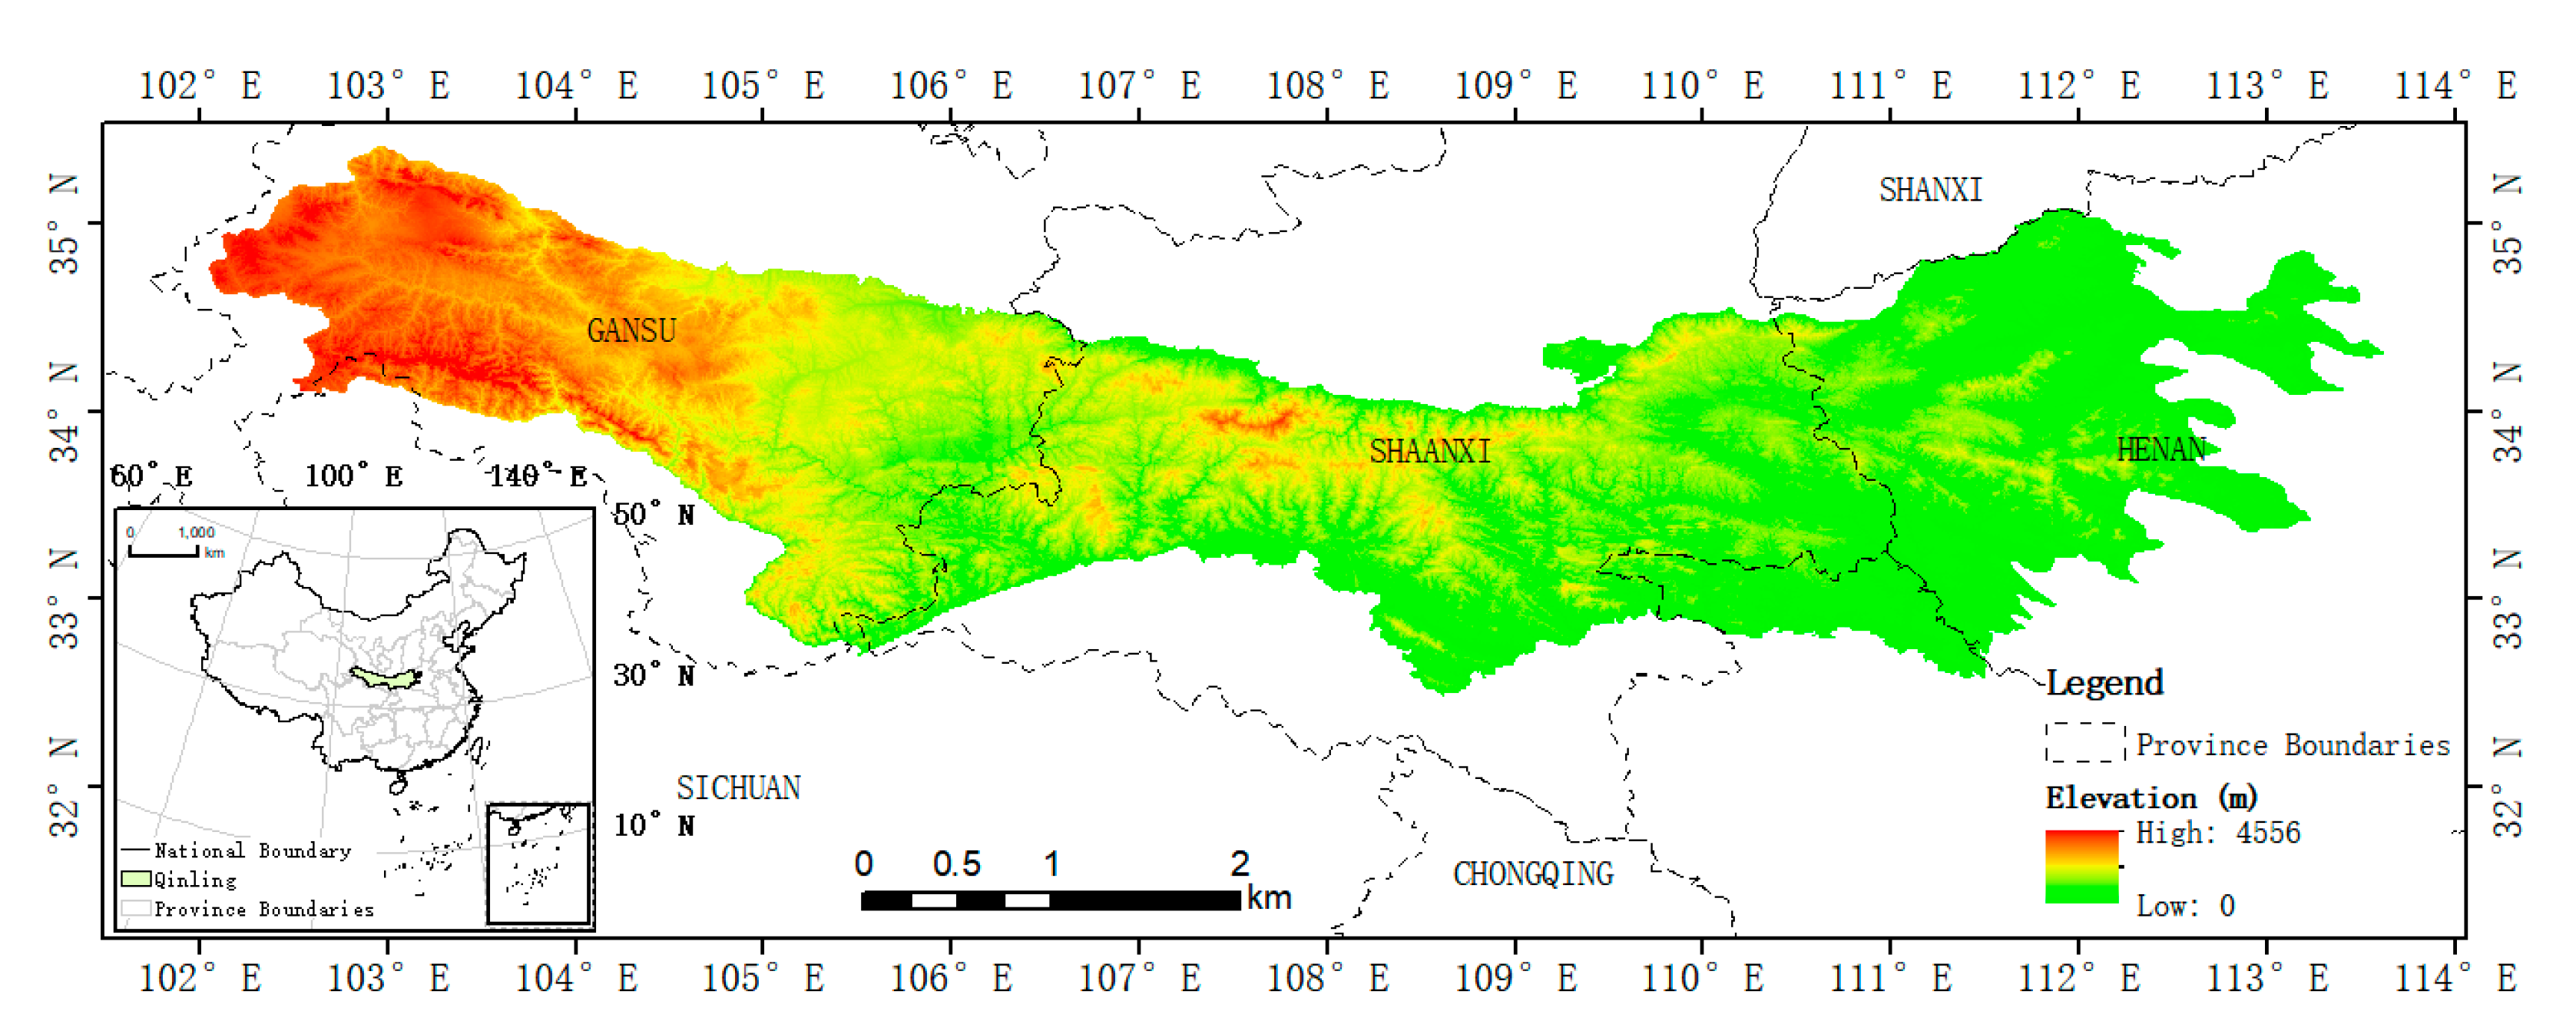
2.1. Study Area
2.2. Data
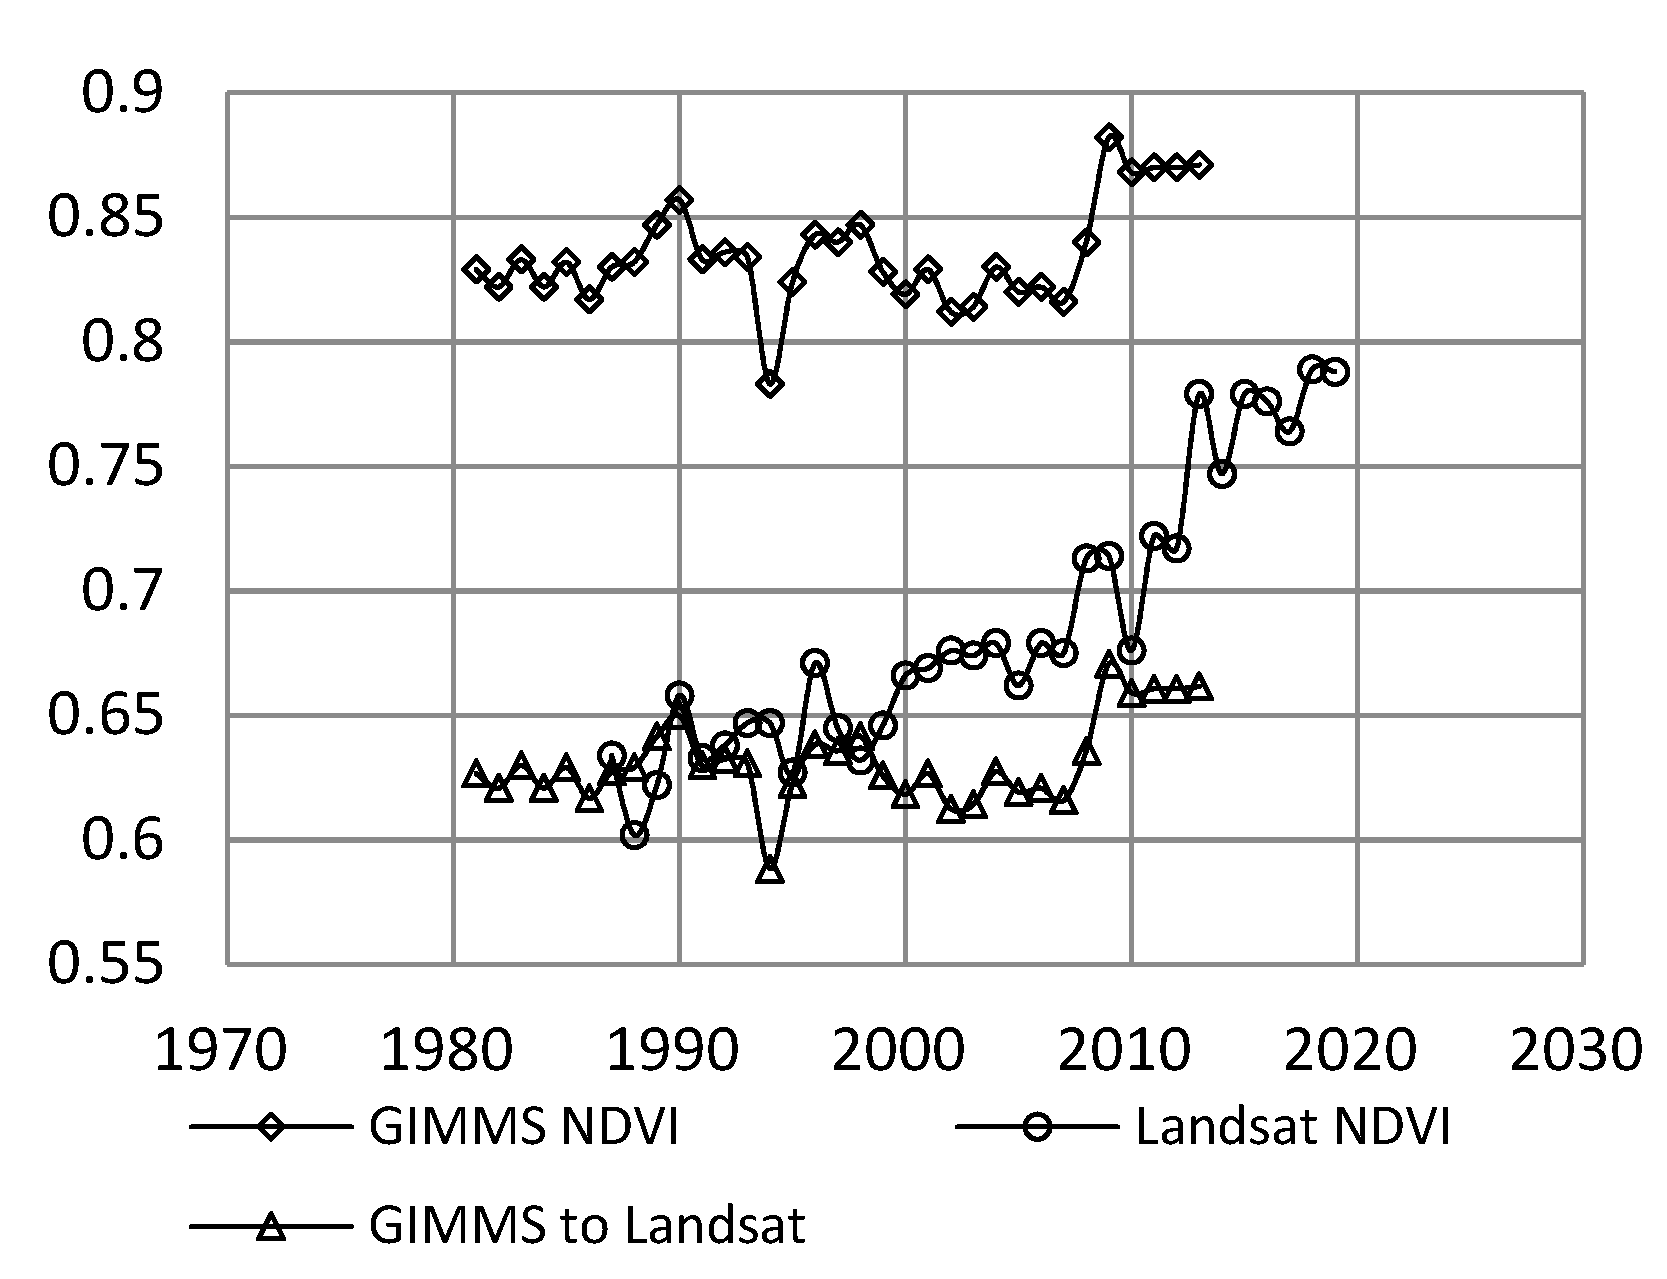
2.2.1. Satellite Data
2.2.2. Digital Elevation Model
2.2.3. Climate Data
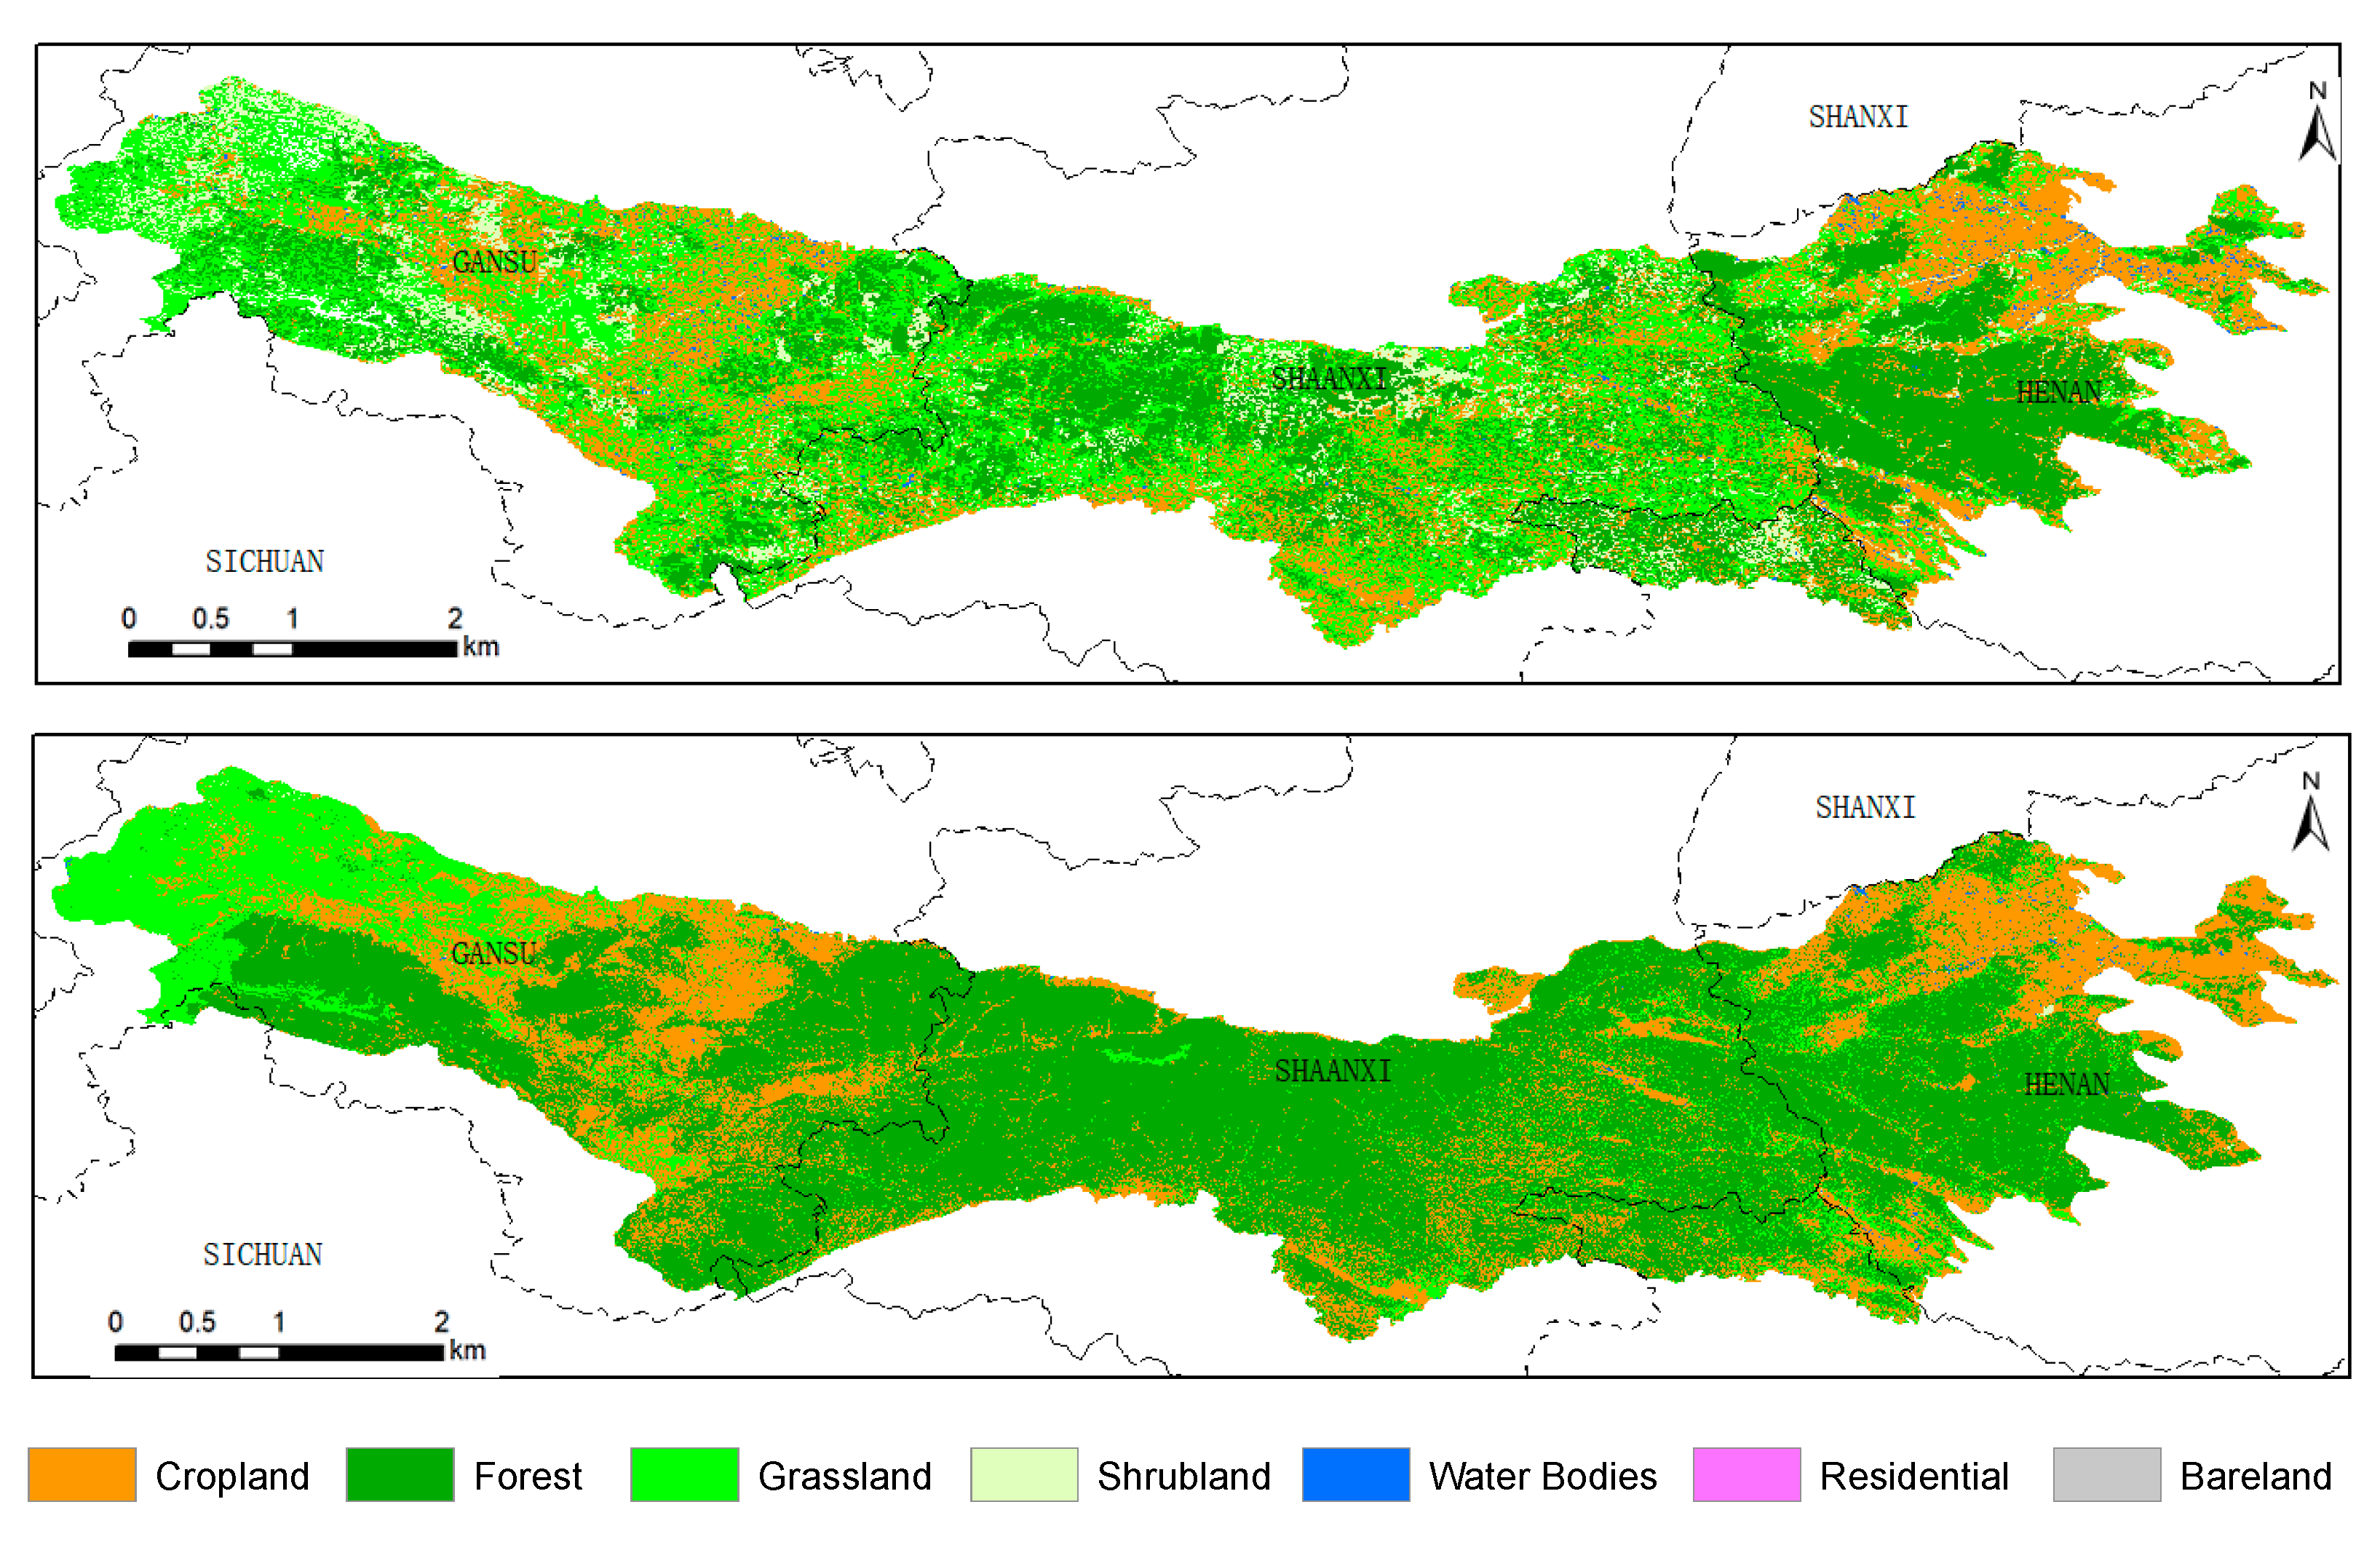
2.2.4. Landcover Data
2.3. Methods
2.3.1. Remote Sensing Image Processing
2.3.2. Trend Analysis
2.3.3. Sensitivity Analysis
2.3.4. Residual Analysis
2.3.5. Cumulative Slope Change Rate
3. Results
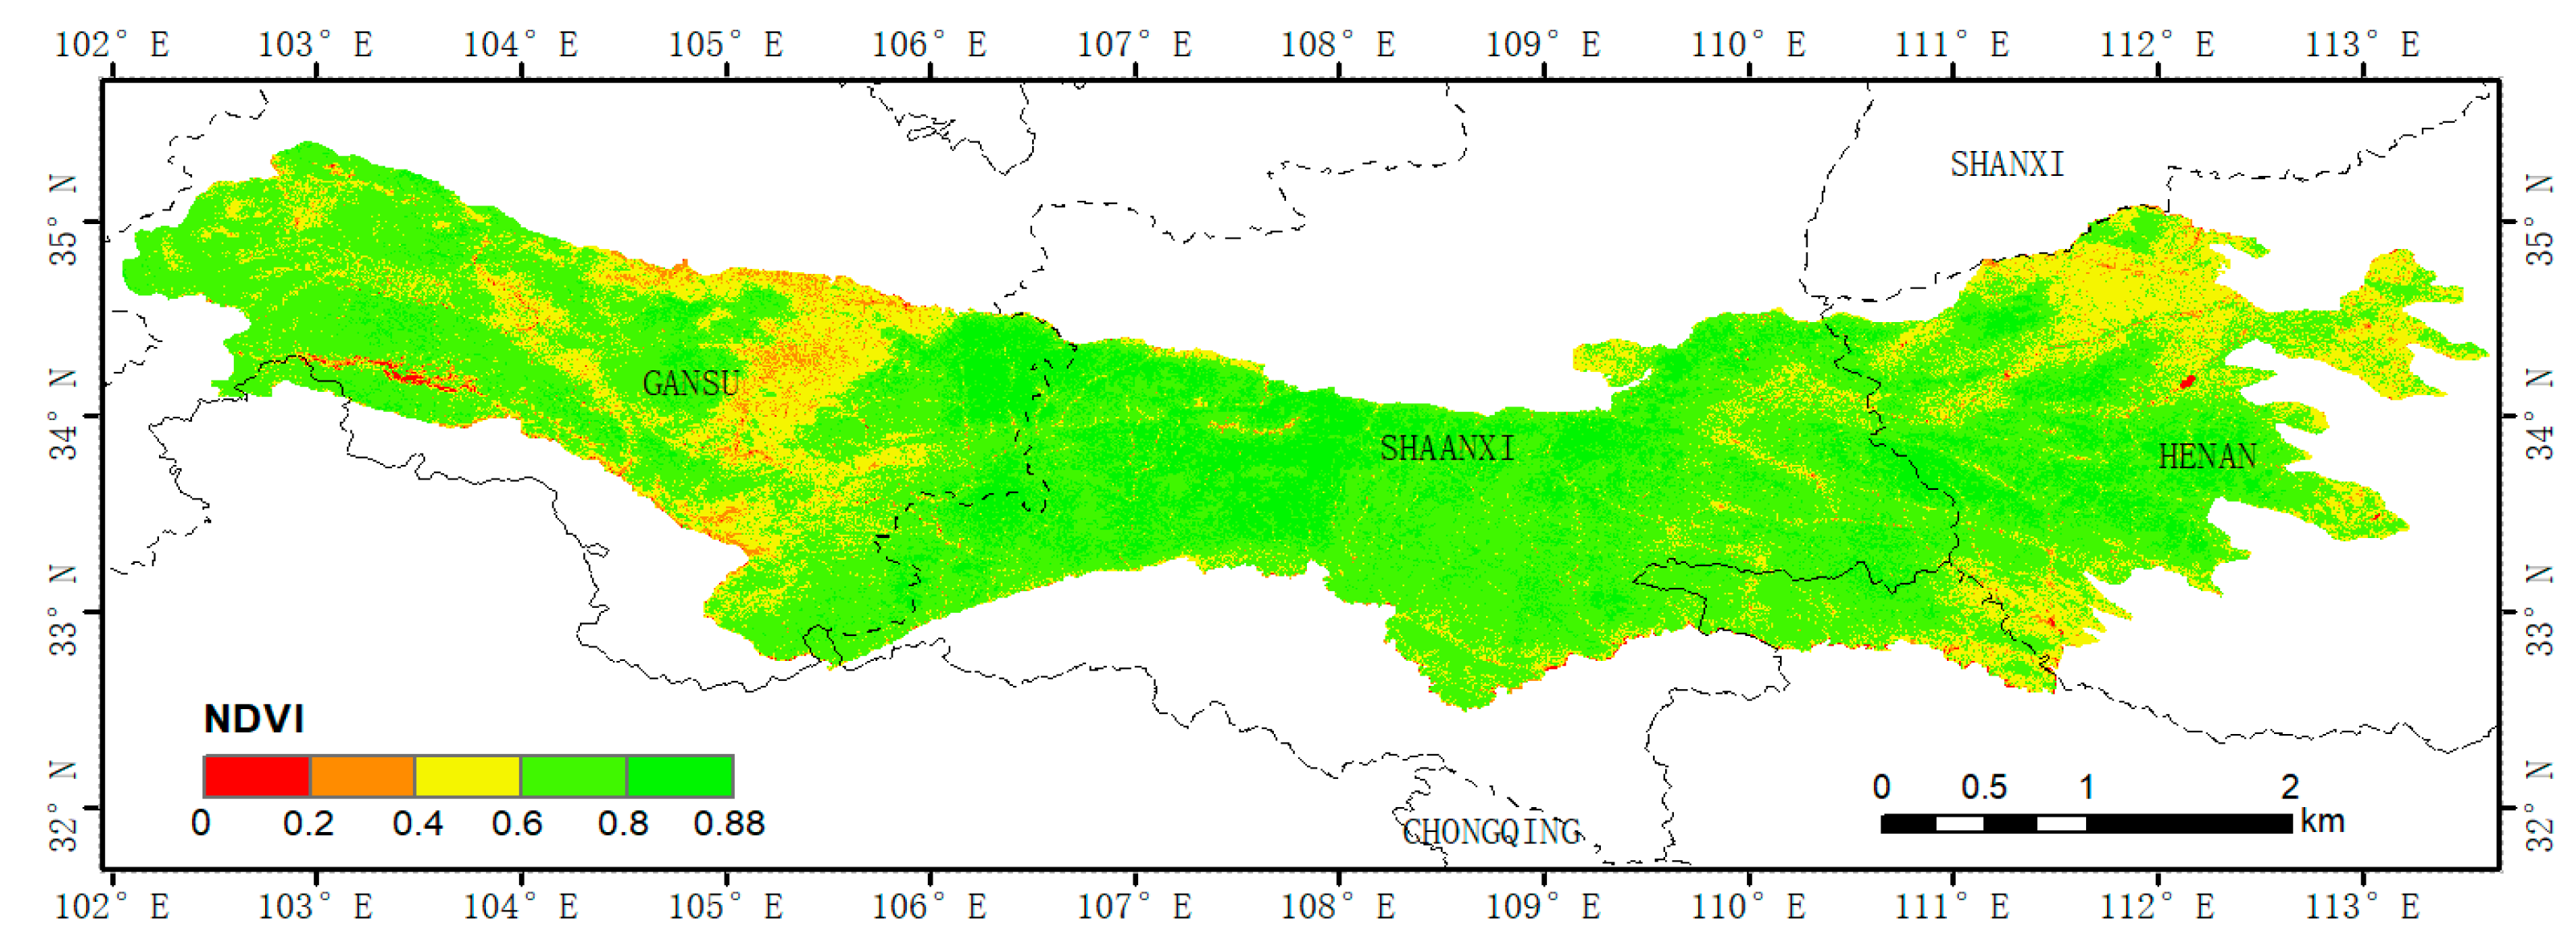
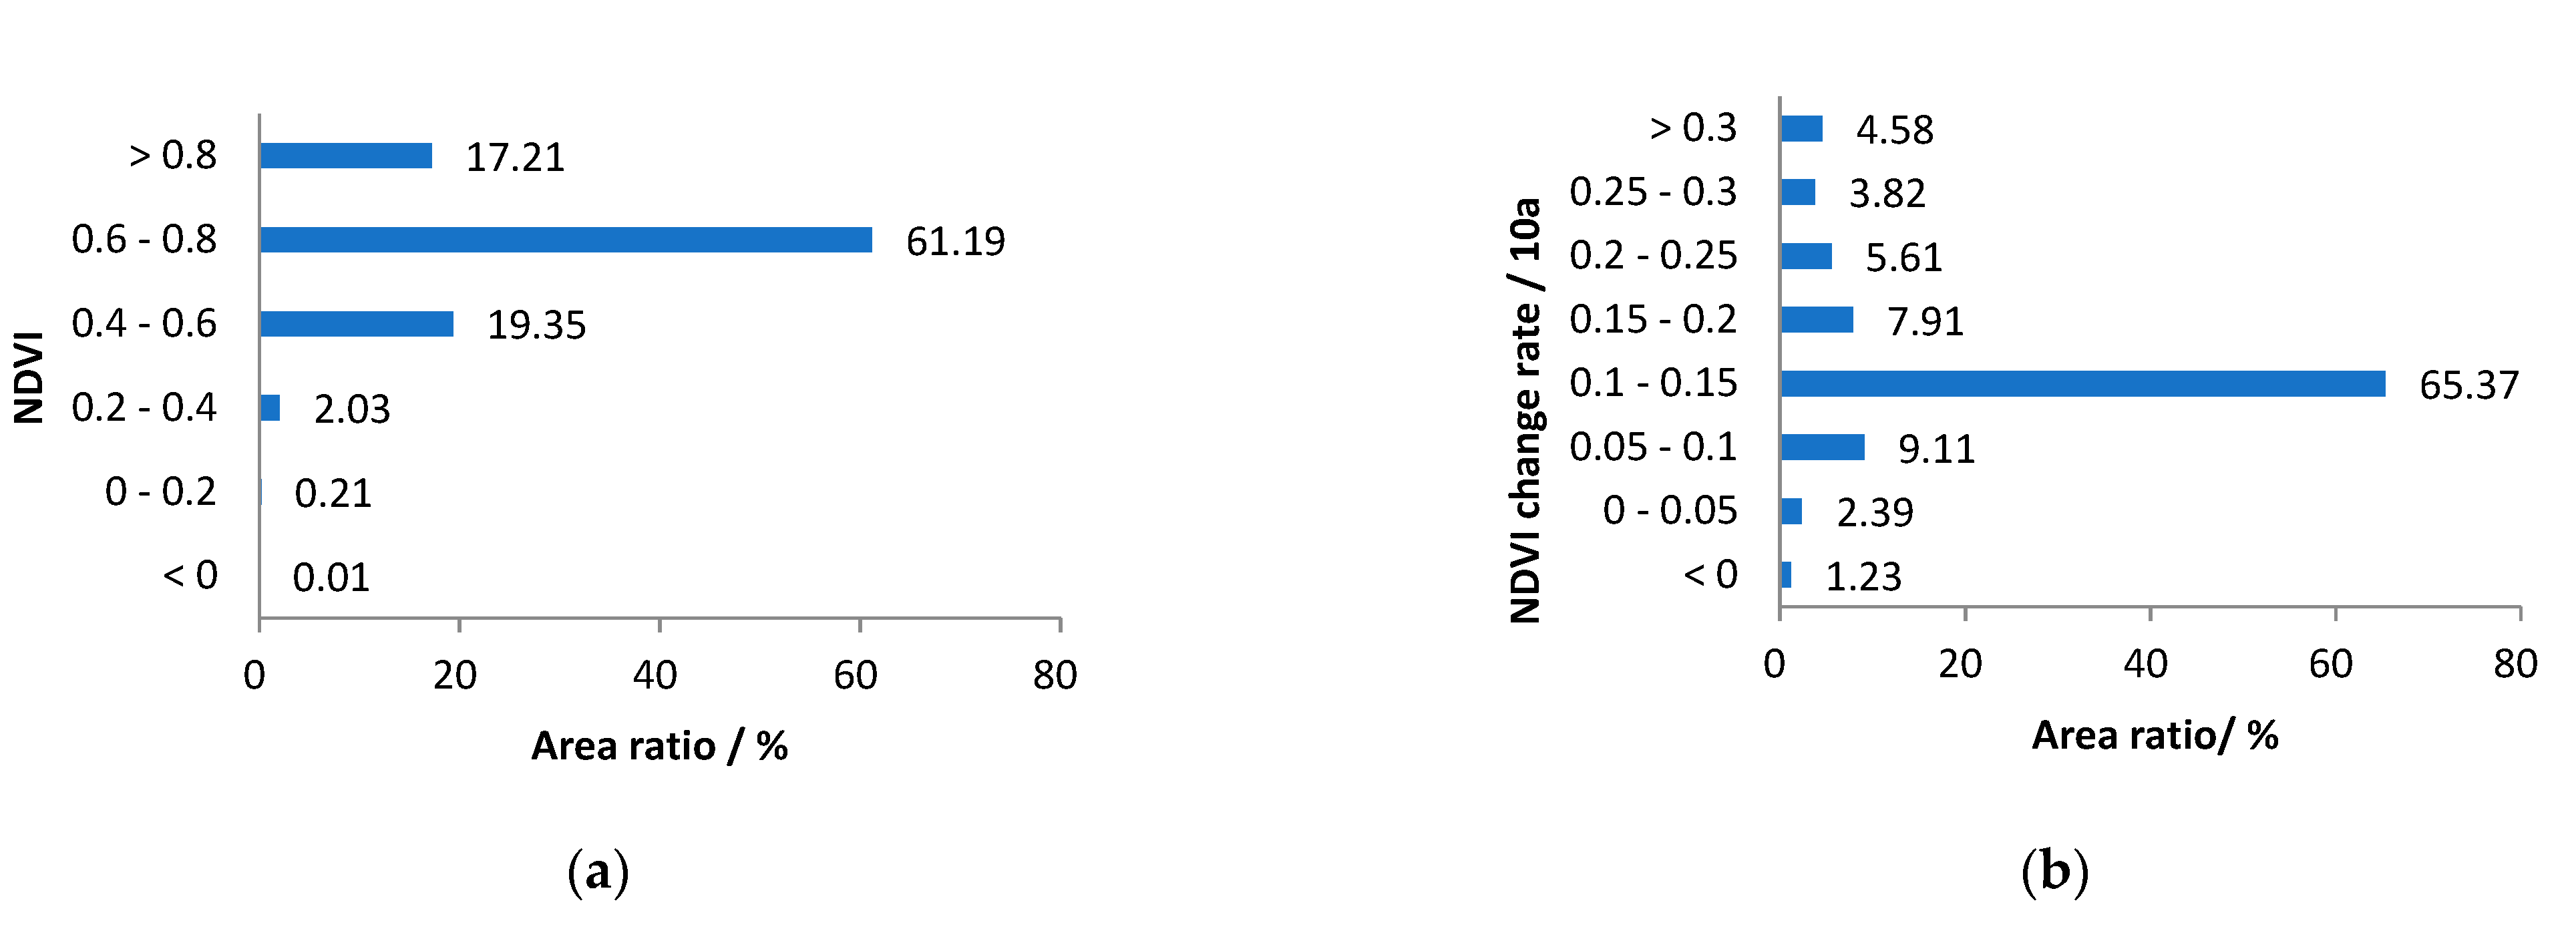
3.1. Spatial Distribution and Changing Trend of NDVI
3.2. NDVI Change Trend
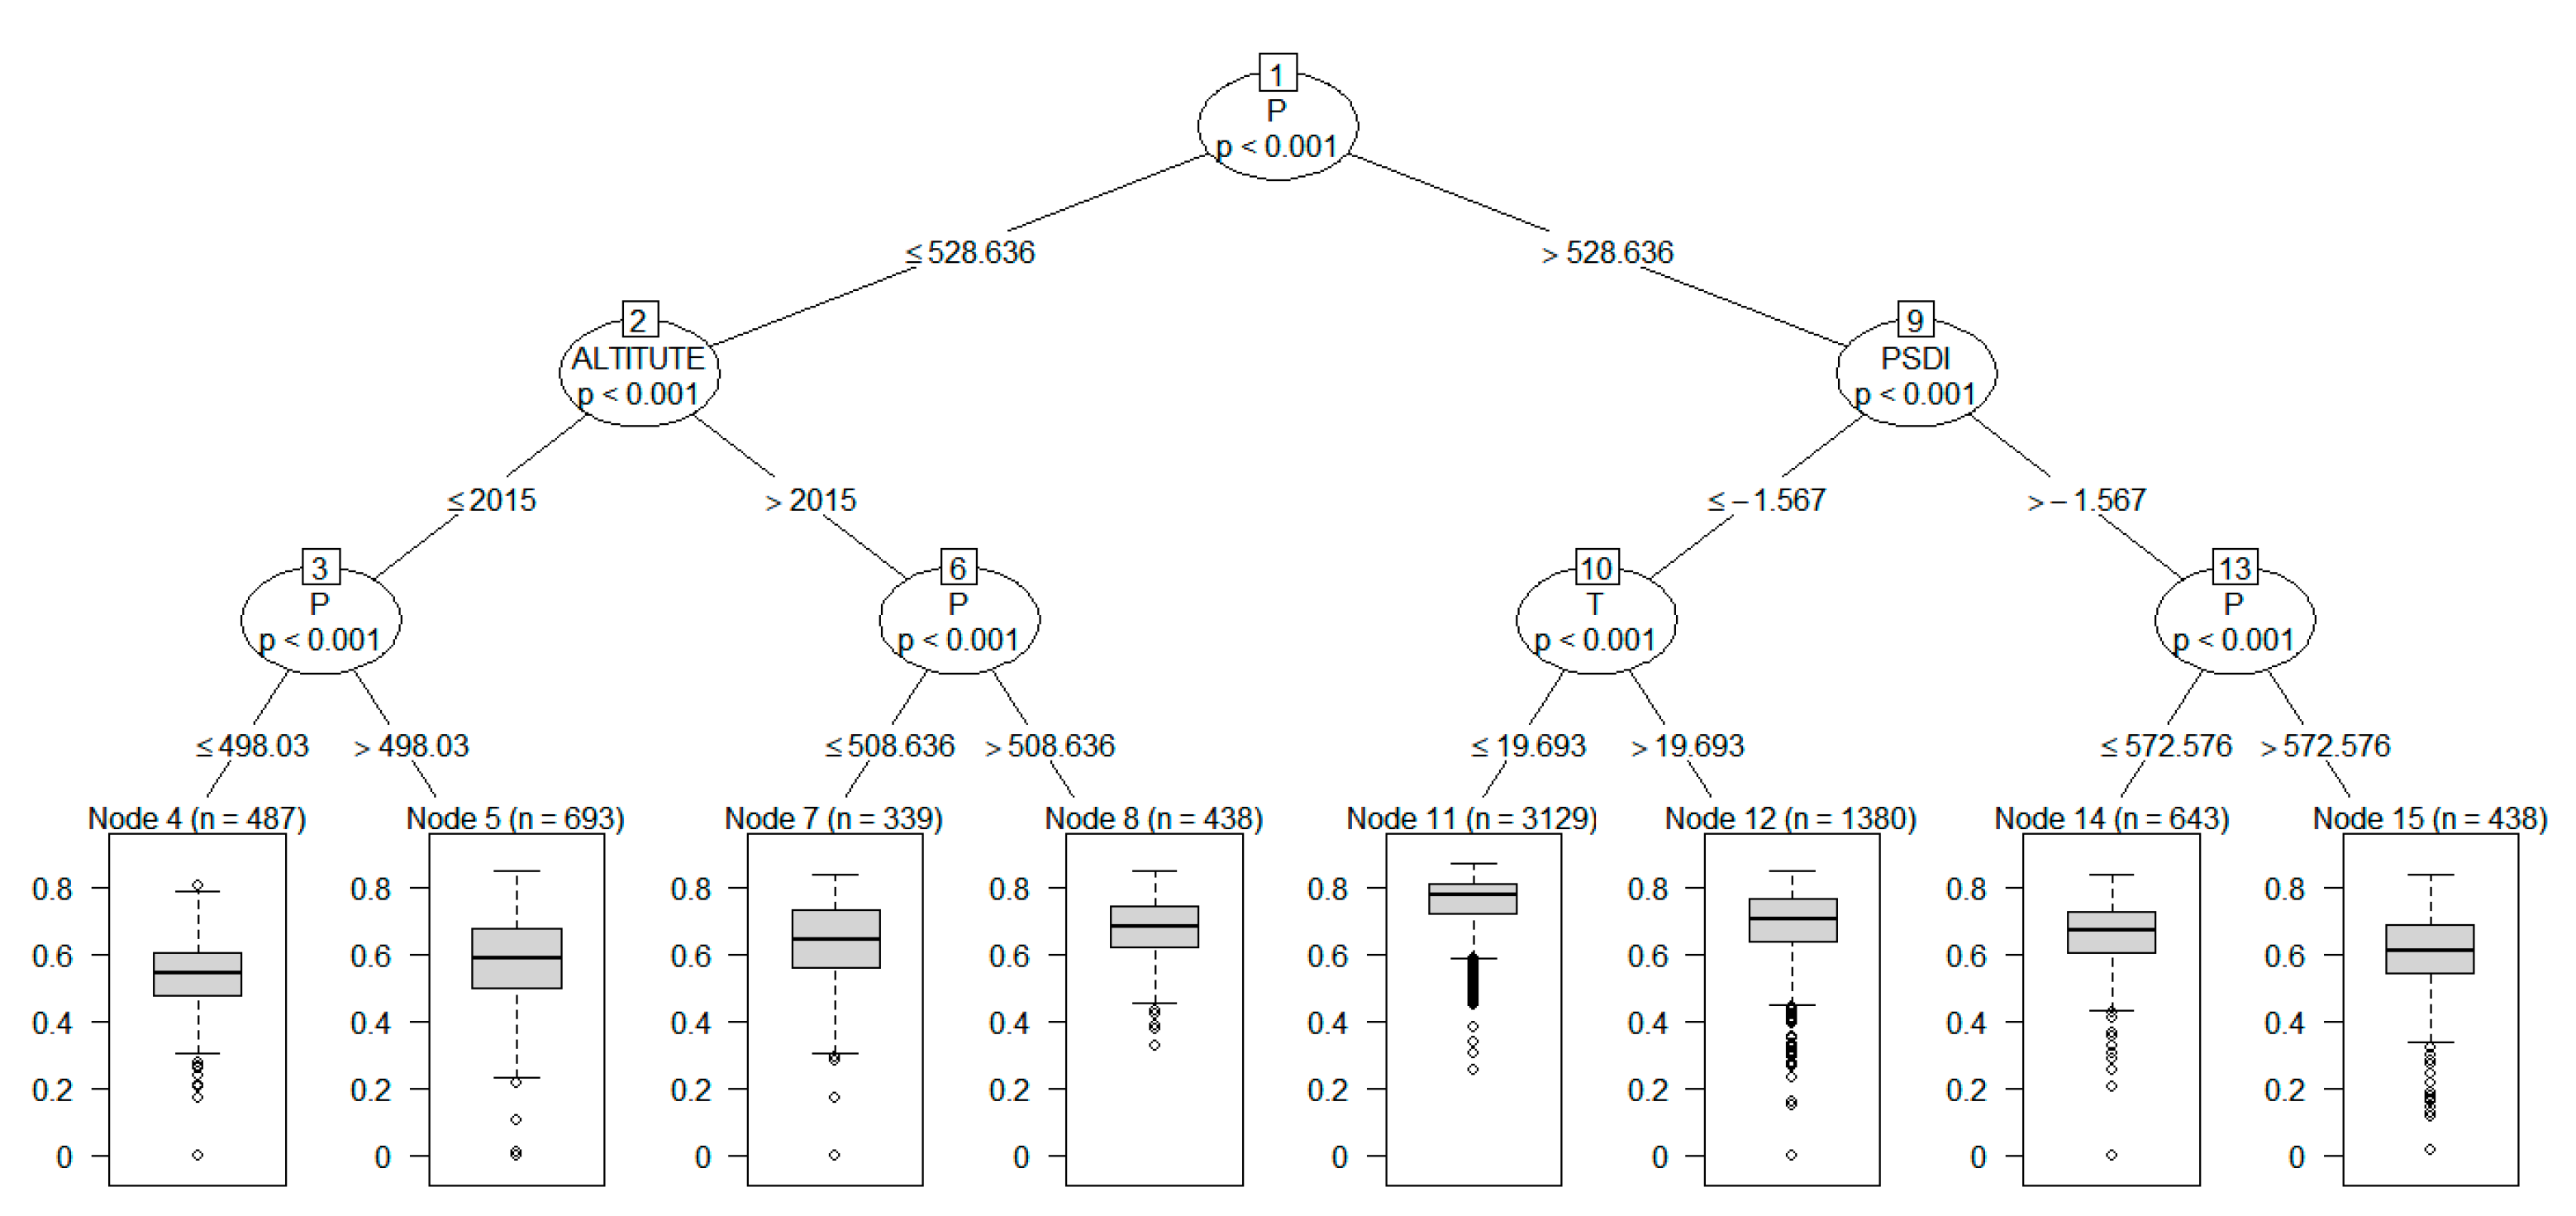
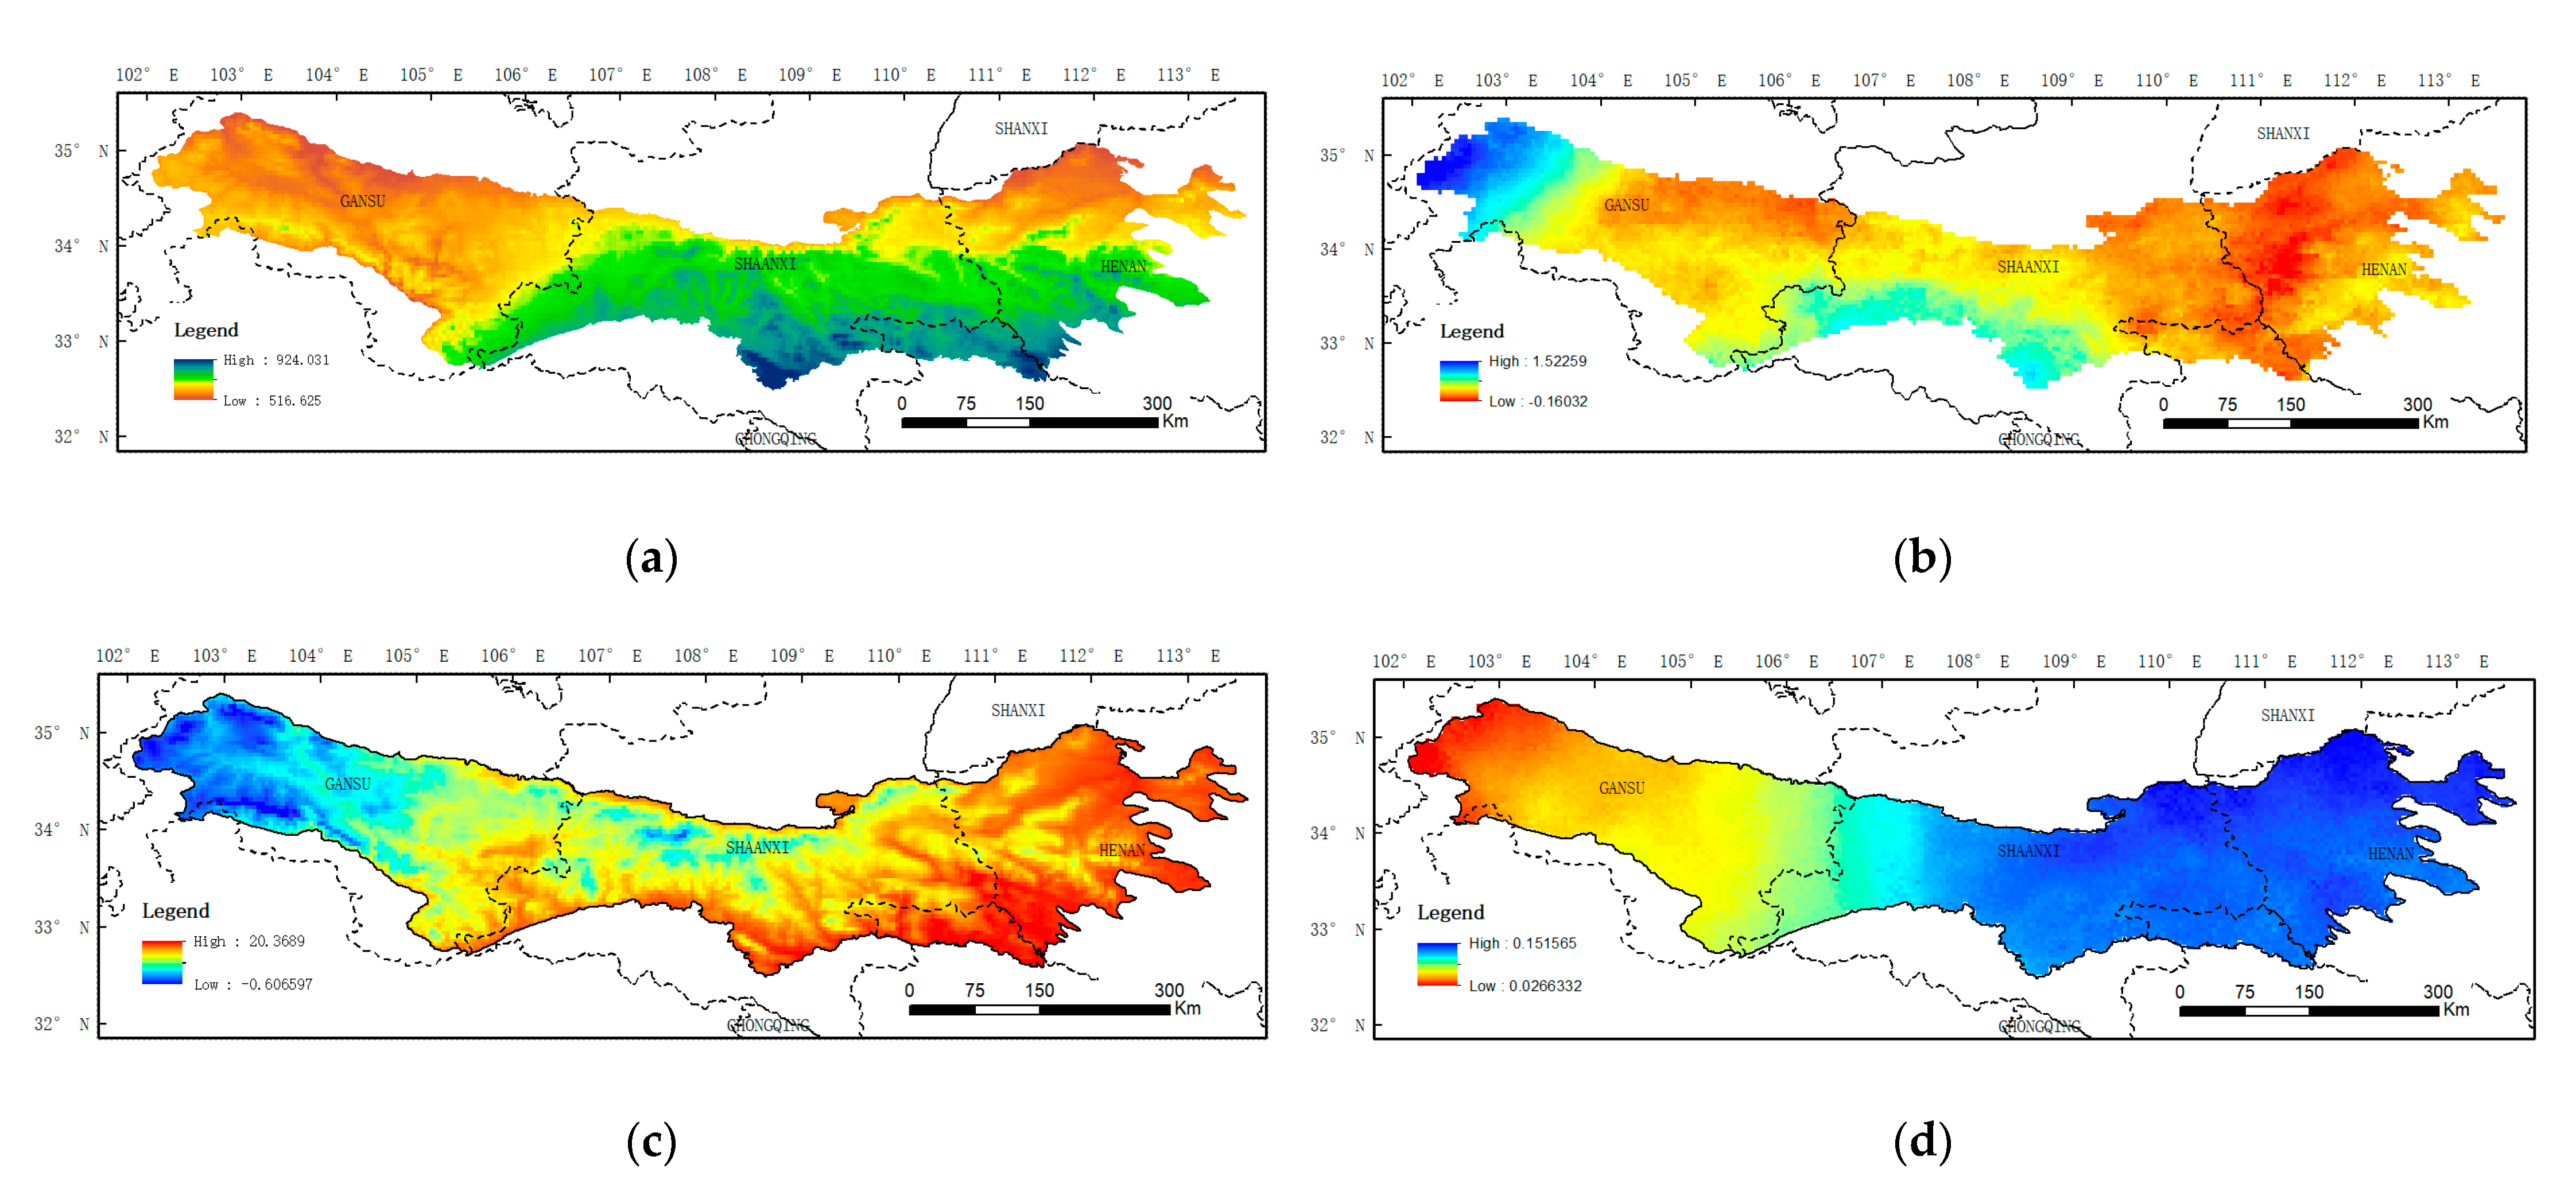
3.3. Climatic Factor Sensitivity Characteristics
3.4. The Relative Contribution of Climate Change and Human Activities to NDVI Changes
4. Discussion
4.1. The Relationship between NDVI and Climate in Qinling Mountains
4.2. The Relationship between NDVI and Land Use in Qinling Mountains
4.3. Significance of Research on NDVI Changes in Qinling Mountain
5. Conclusions
- (1)
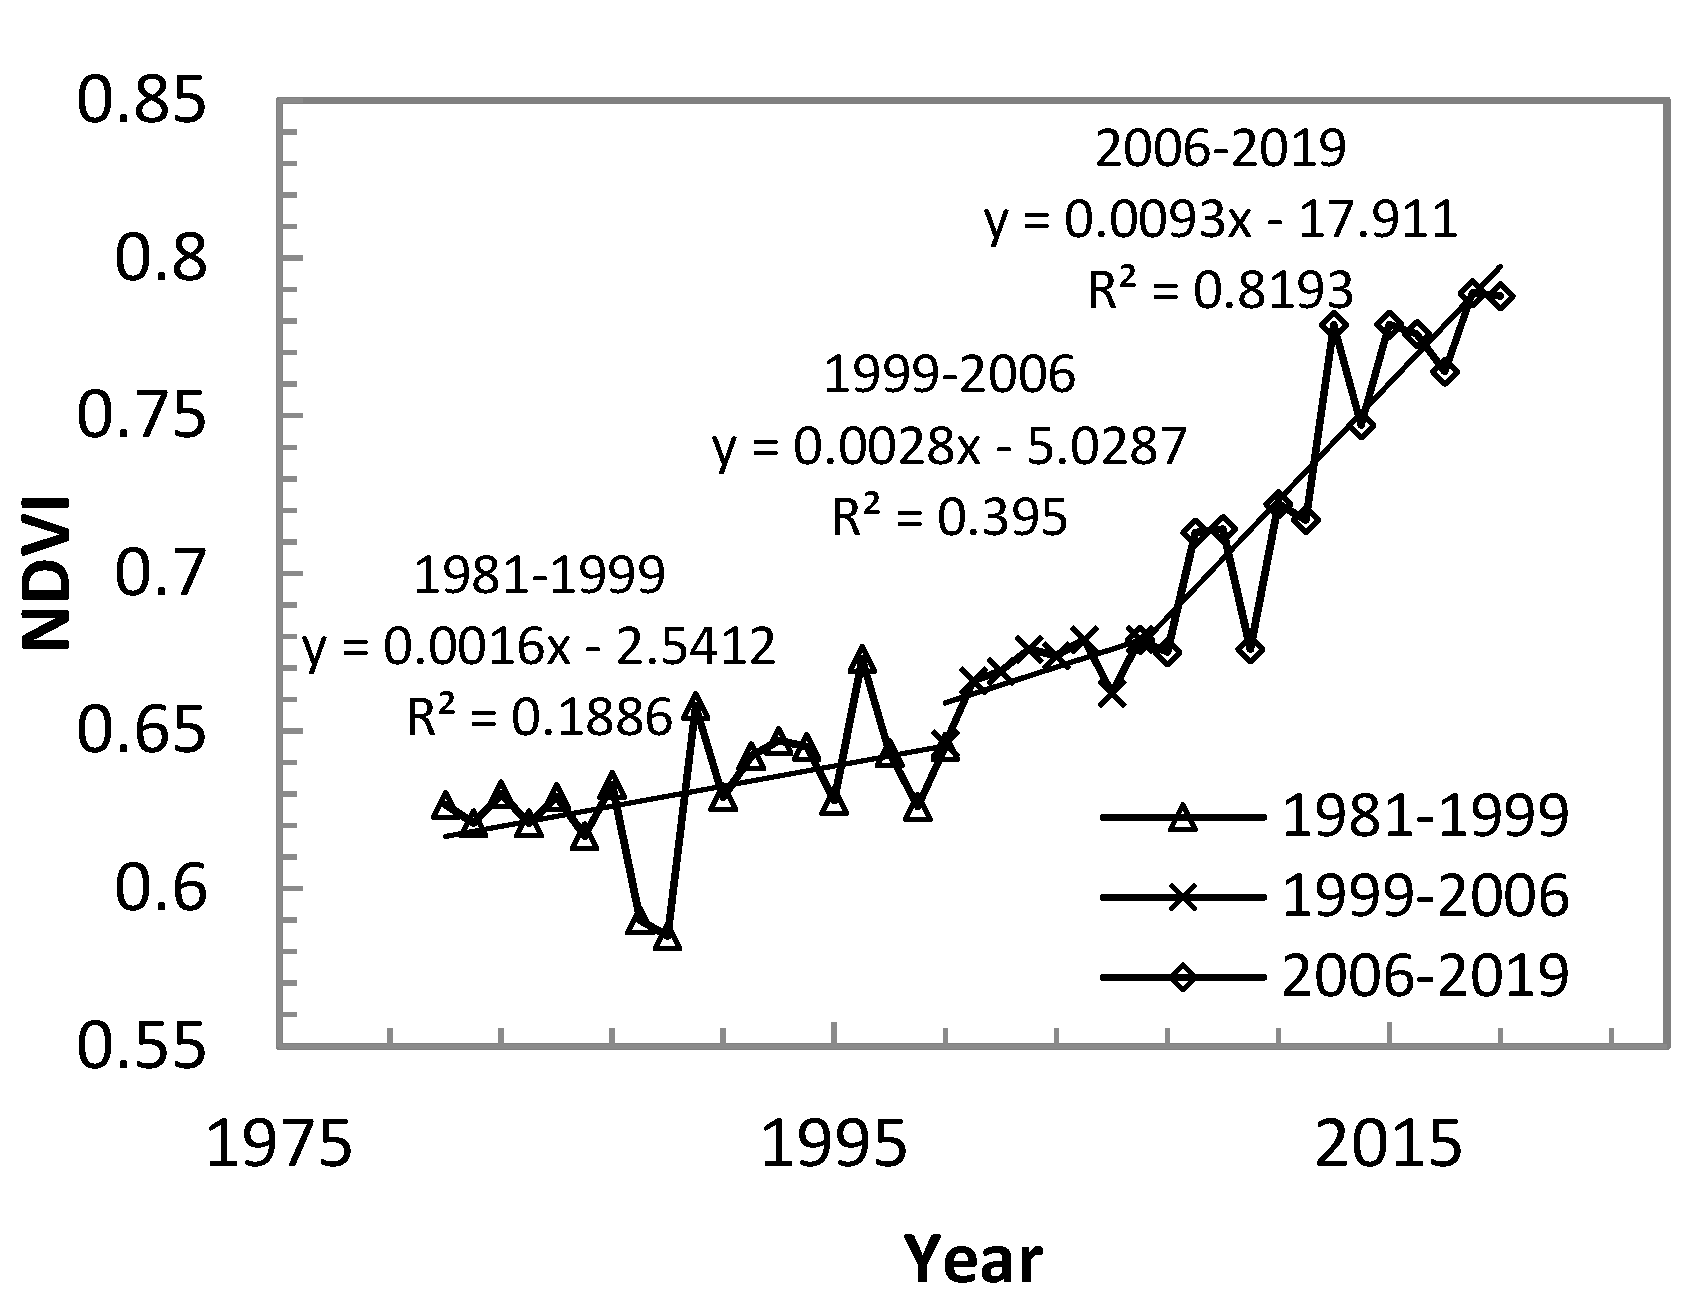
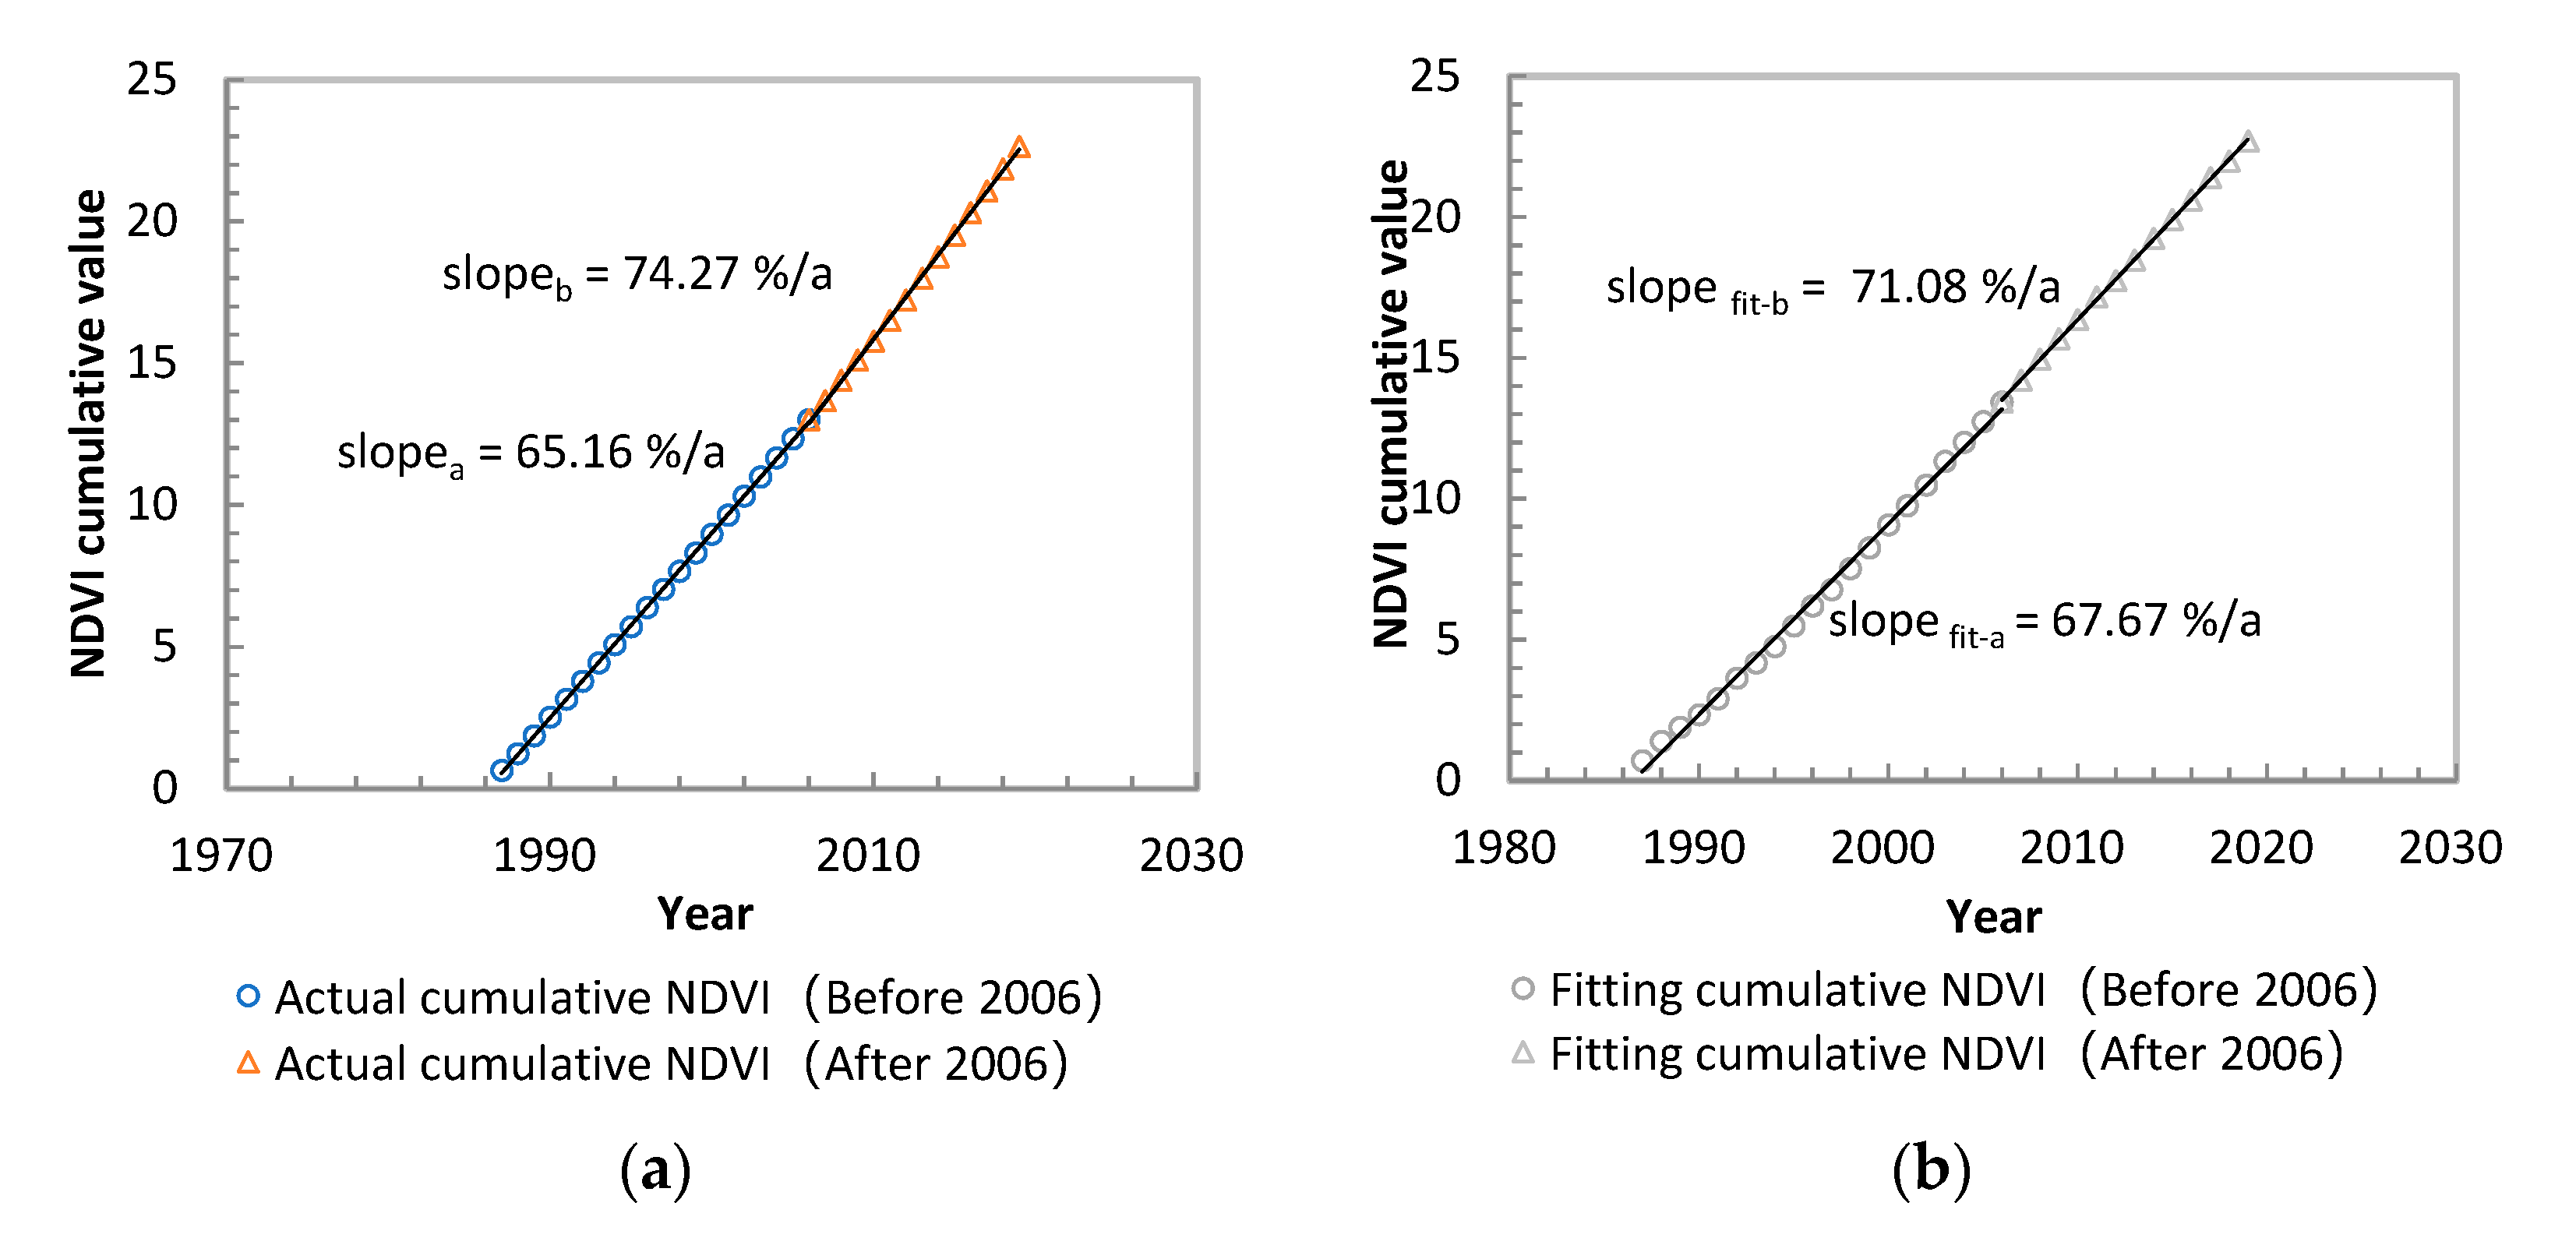
- In the past 38 years, the vegetation in the Qinling Mountains has improved significantly. Particularly after 2006, that is, 7–8 years after afforestation measures, NDVI increased rapidly with a growth rate of 0.0093/a, which is much higher than the two time periods of 1987–1999 and 1999–2006;
- (2)
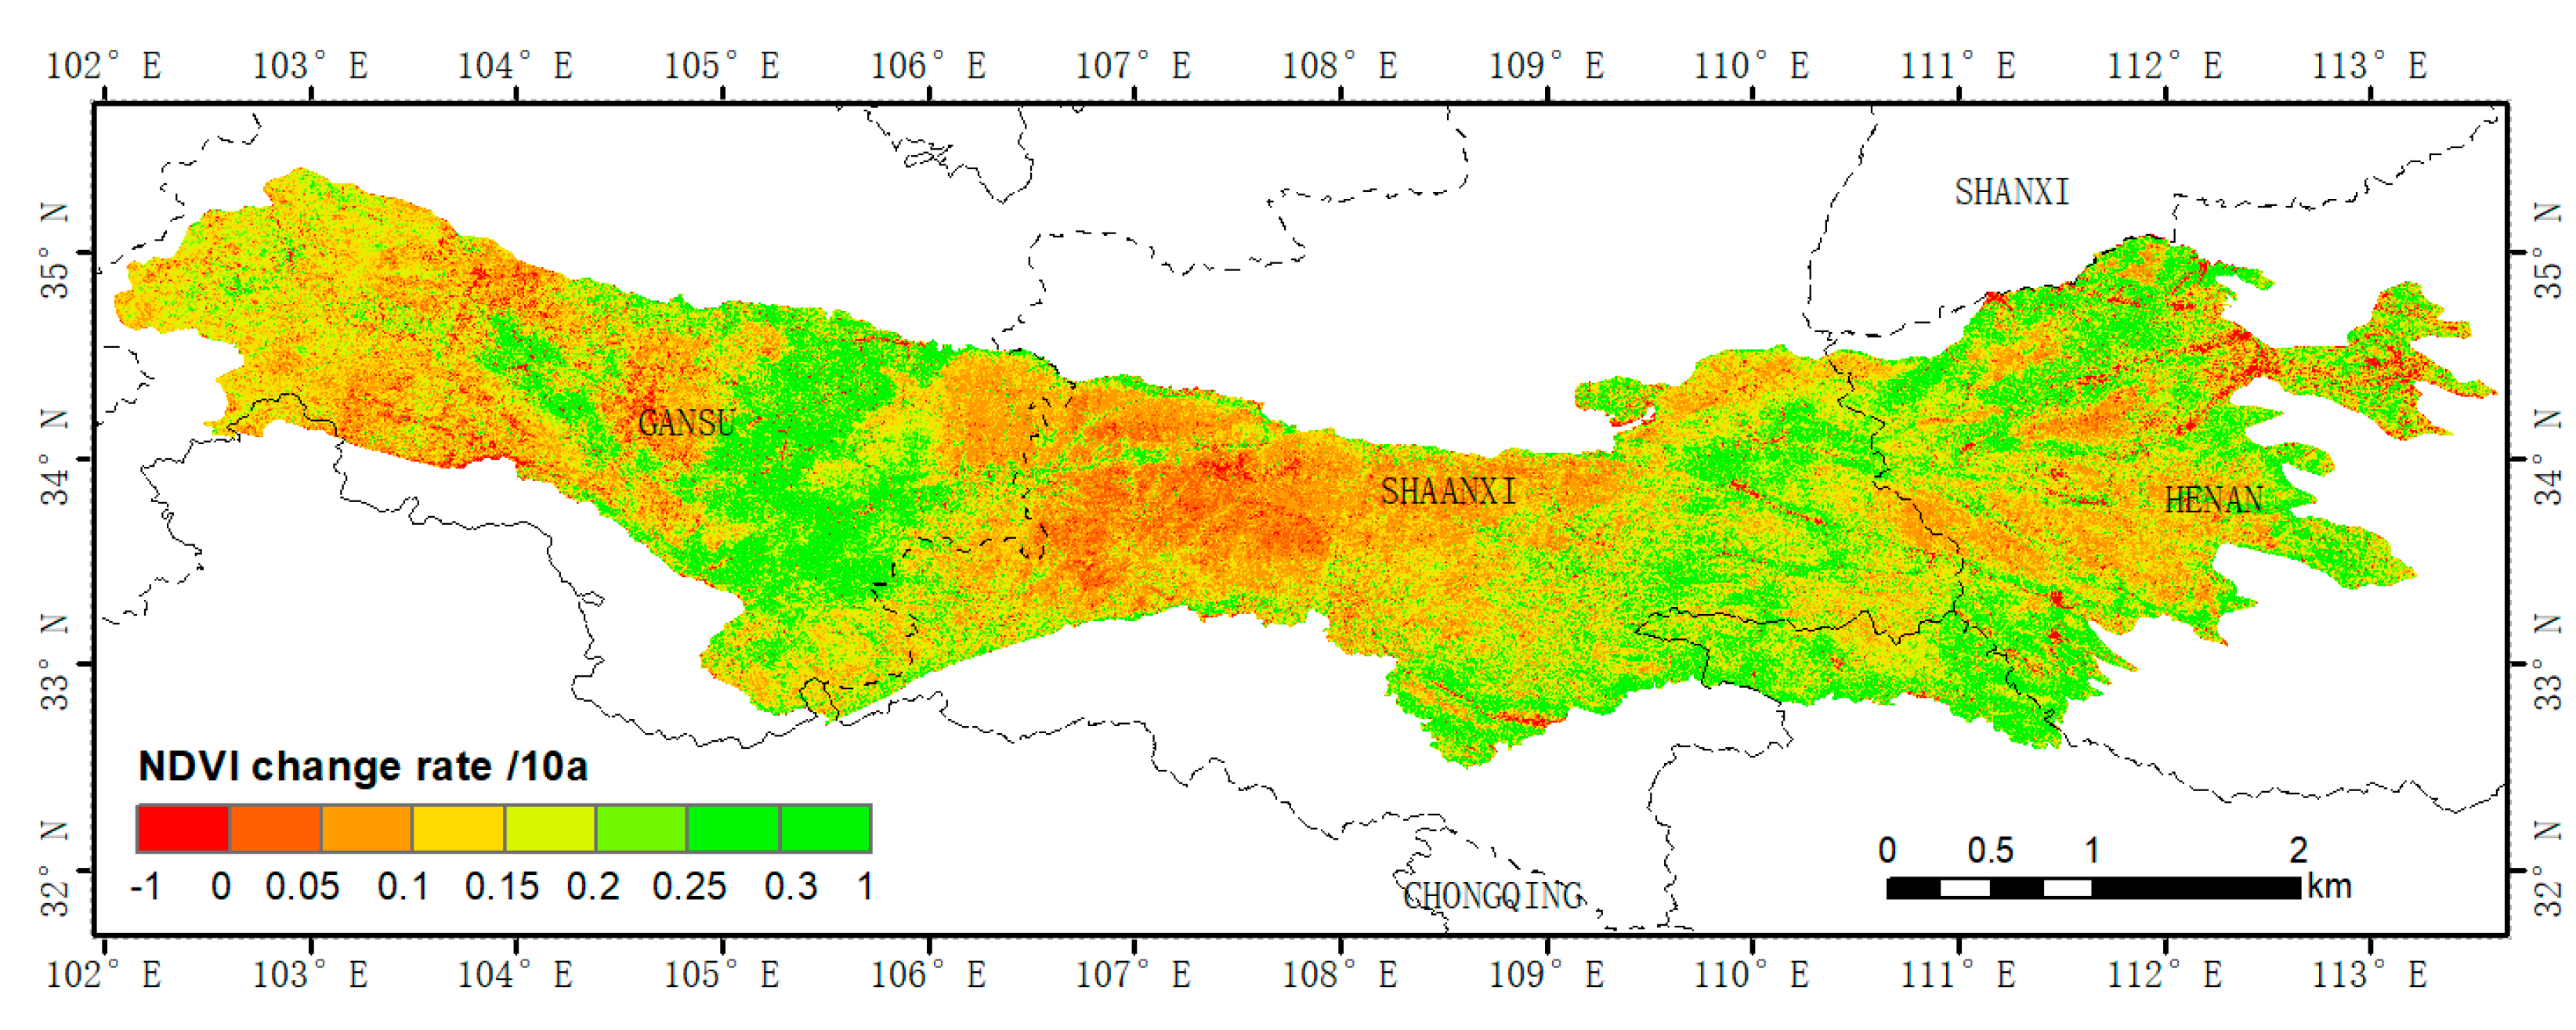
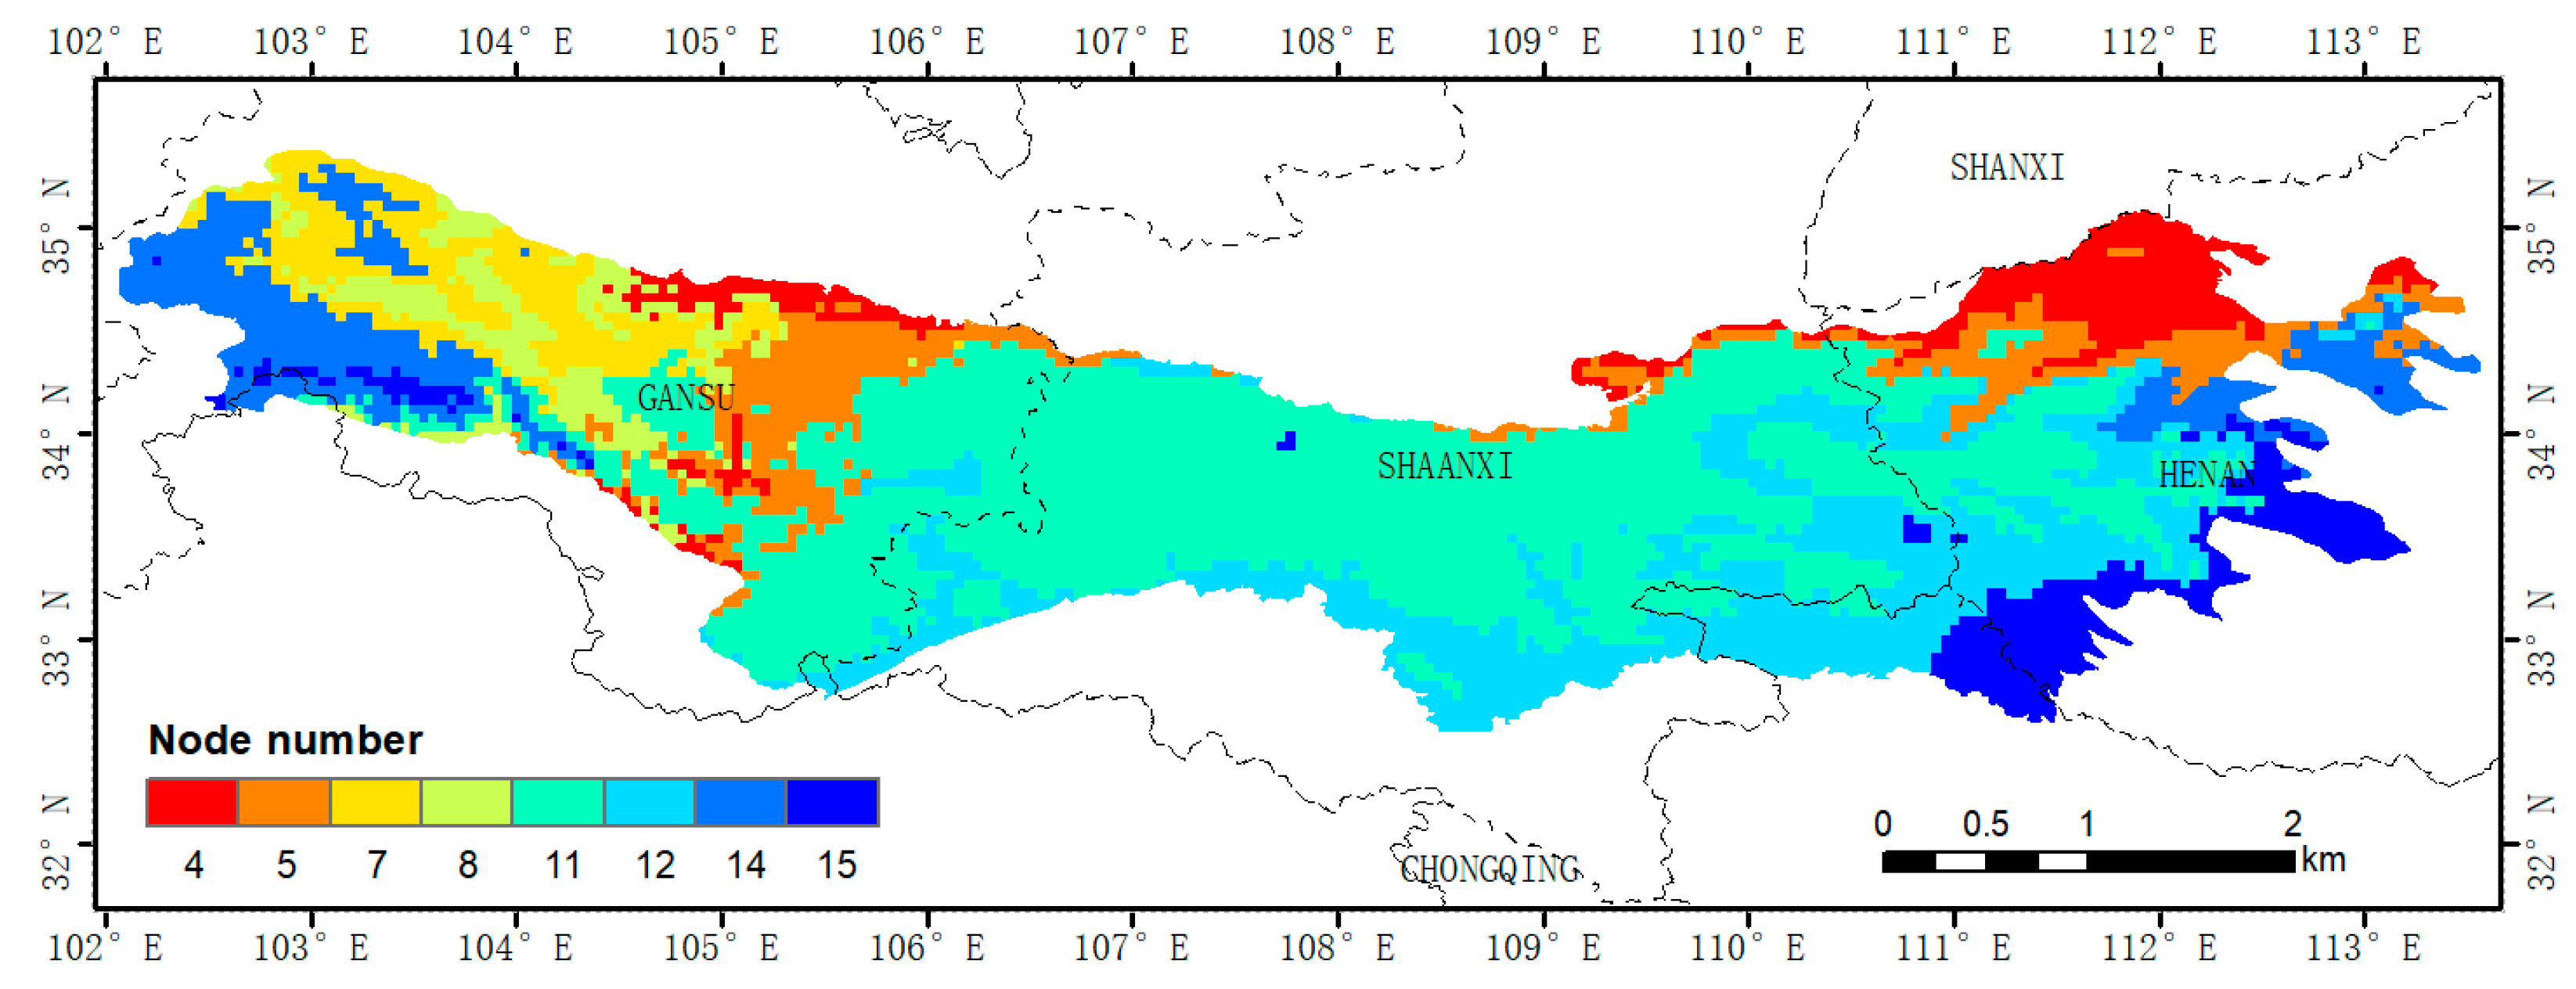
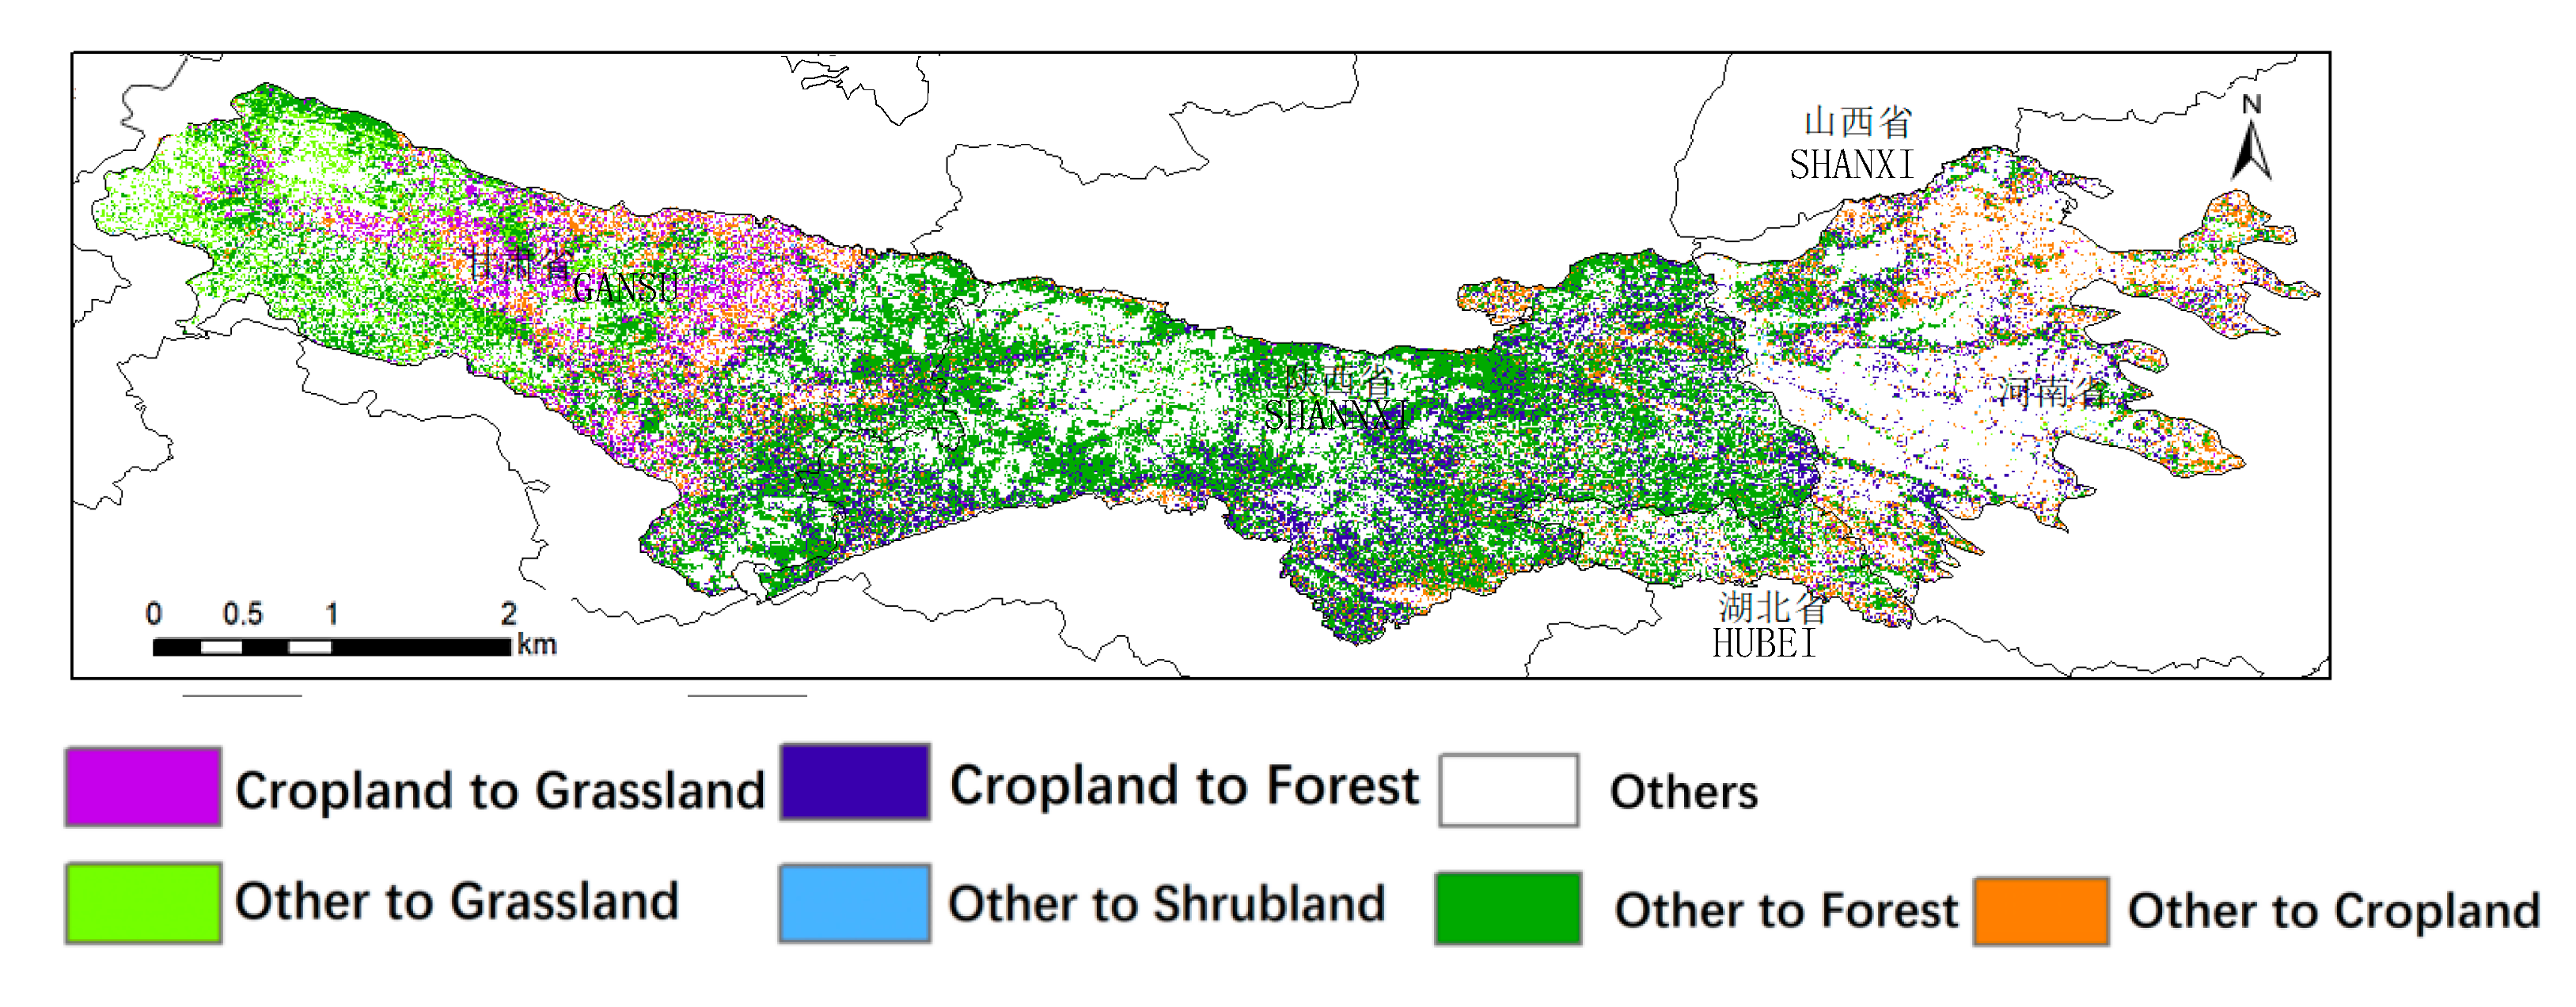
- The NDVI corresponding to areas with a multi-year average NDVI ≤ 0.6 increased significantly from 1987 to 2019, and the growth rate was greater than 0.25/10a. For example, in the southeastern part of Gansu Province, Northern Henan Province, and Southeastern Shaanxi Province, the key reason for the increase in NDVI was the conversion of farmland to forest and grassland. However, in areas where NDVI > 0.6, such as central Shaanxi Province, Gansu Province, and central Henan Province, most of the land use types in these regions have not changed, and the corresponding NDVI growth rate is not large.
- (3)
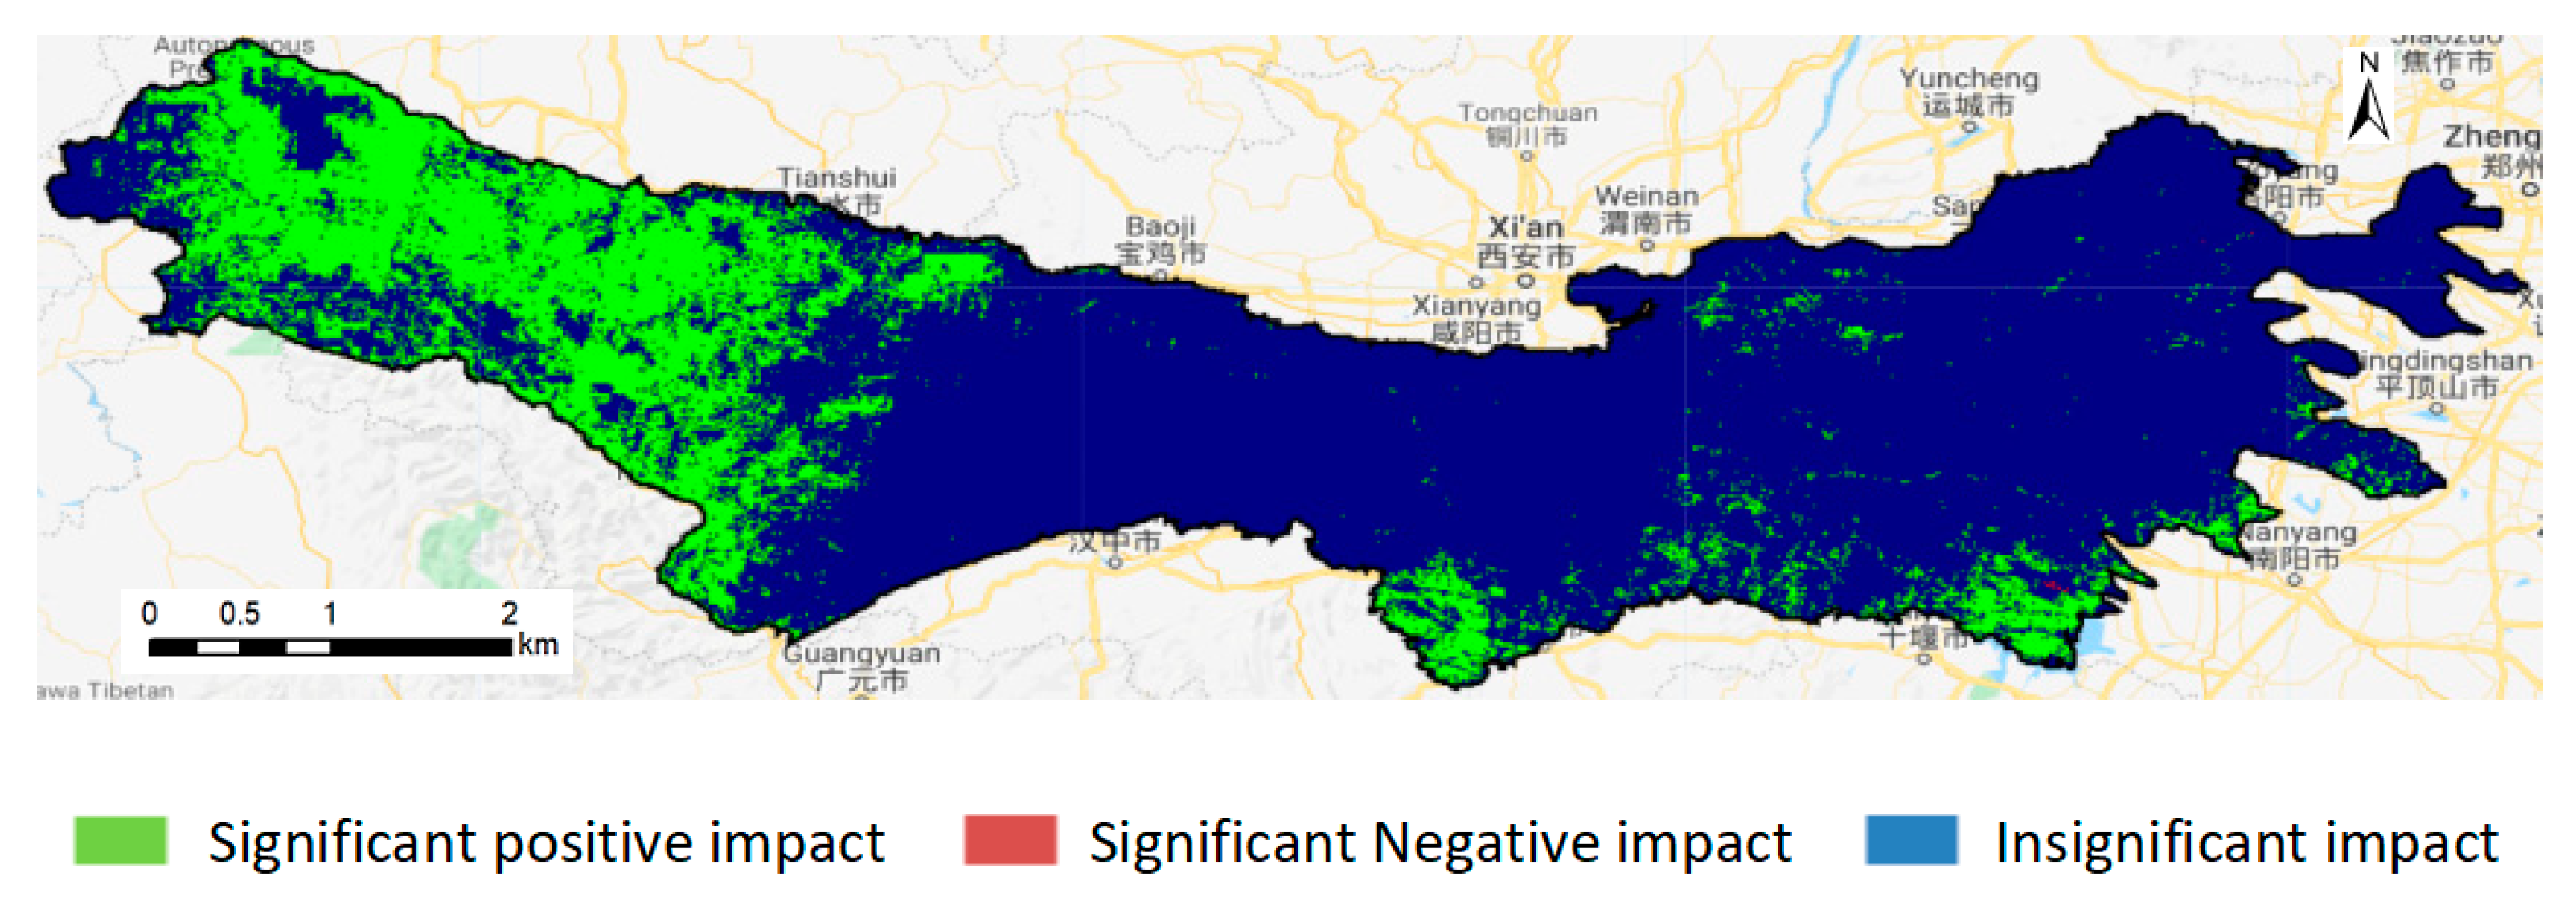
- NDVI in the central part of Qinling Mountains was significantly affected by precipitation, drought index, and temperature, while NDVI in the west and east was significantly affected by changes in precipitation and altitude. After the implementation of afforestation, human activities have become an important factor in the increase in NDVI, with a contribution rate of 63.96%. From a spatial point of view, the area of the study area that was significantly positively affected by human activities reached 36.49%, mainly distributed in most areas of Gansu Province and Southern Shaanxi Province. The corresponding land use in these areas was transformed from farmland to grassland and forest.
Author Contributions
Funding
Institutional Review Board Statement
Informed Consent Statement
Data Availability Statement
Acknowledgments
Conflicts of Interest
References
- Wu, X.; Sun, X.; Wang, Z.; Zhang, Y.; Liu, Q.; Zhang, B.; Paudel, B.; Xie, F. Vegetation changes and their response to global change based on NDVI in the Koshi river Basin of central Himalayas since 2000. Sustainability 2020, 12, 6644. [Google Scholar] [CrossRef]
- Fang, W.; Huang, S.; Huang, Q.; Huang, G.; Meng, E.; Luan, J. Reference evapotranspiration forecasting based on local meteorological and global climate information screened by partial mutual information. J. Hydrol. 2018, 561, 764–779. [Google Scholar] [CrossRef]
- Kong, D.; Miao, C.; Borthwick, A.G.L.; Lei, X.; Li, H. Spatiotemporal variations in vegetation cover on the Loess Plateau, China, between 1982 and 2013: Possible causes and potential impacts. Environ. Sci. Pollut. Res. 2018, 25, 13633–13644. [Google Scholar] [CrossRef] [Green Version]
- Piao, S.; Fang, J.; Zhou, L.; Guo, Q.; Henderson, M.; Ji, W.; Li, Y.; Tao, S. Interannual variations of monthly and seasonal normalized difference vegetation index (NDVI) in China from 1982 to 1999. J. Geophys. Res. Atmos. 2003, 108, 1–13. [Google Scholar] [CrossRef]
- Robinson, N.P.; Allred, B.W.; Jones, M.O.; Moreno, A.; Kimball, J.S.; Naugle, D.E.; Erickson, T.A.; Richardson, A.D. A dynamic landsat derived normalized difference vegetation index (NDVI) product for the conterminous United States. Remote Sens. 2017, 9, 863. [Google Scholar] [CrossRef] [Green Version]
- Kumar, L.; Mutanga, O. Google Earth Engine applications since inception: Usage, trends, and potential. Remote Sens. 2018, 10, 1509. [Google Scholar] [CrossRef] [Green Version]
- Langner, A.; Miettinen, J.; Kukkonen, M.; Vancutsem, C.; Simonetti, D.; Vieilledent, G.; Verhegghen, A.; Gallego, J.; Stibig, H.J. Towards operational monitoring of forest canopy disturbance in evergreen rain forests: A test case in continental Southeast Asia. Remote Sens. 2018, 10, 544. [Google Scholar] [CrossRef] [Green Version]
- Wang, Y.; Ziv, G.; Adami, M.; Mitchard, E.; Batterman, S.A.; Buermann, W.; Schwantes Marimon, B.; Marimon Junior, B.H.; Matias Reis, S.; Rodrigues, D.; et al. Mapping tropical disturbed forests using multi-decadal 30 m optical satellite imagery. Remote Sens. Environ. 2019, 221, 474–488. [Google Scholar] [CrossRef]
- Pekel, J.-F.; Cottam, A.; Gorelick, N.; Belward, A.S. High-resolution mapping of global surface water and its long-term changes. Nature 2016, 540, 418–422. [Google Scholar] [CrossRef]
- Johnson, D.M. Using the Landsat archive to map crop cover history across the United States. Remote Sens. Environ. 2019, 232, 111–286. [Google Scholar] [CrossRef]
- Ding, M.; Zhang, Y.; Liu, L.; Zhang, W.; Wang, Z.; Bai, W. The relationship between NDVI and precipitation on the Tibetan Plateau. J. Geogr. Sci. 2007, 17, 259–268. [Google Scholar] [CrossRef]
- Gao, Z.Q.; Dennis, O. The temporal and spatial relationship between NDVI and climatological parameters in Colorado. J. Geogr. Sci. 2001, 11, 411–419. [Google Scholar]
- Zhao, X.; Tan, K.; Zhao, S.; Fang, J. Changing climate affects vegetation growth in the arid region of the northwestern China. J. Arid Environ. 2011, 75, 946–952. [Google Scholar] [CrossRef]
- Sheng, R.; Wan, L. Evolution of vegetation coverage and its response to abrupt climate change in the Wuyi Mountains National Nature Reserve. Shengtai Xuebao Acta Ecol. Sin. 2019, 39, 3243–3256. [Google Scholar]
- Zhu, W.B.; Lv, A.F.; Jia, S.F. Study on Spatial Distribution of Vegetation Coverage and Its Affecting Factors in the Qaidam Basin Based on NDVI. Arid. Zone Res. 2010, 27, 691–698. [Google Scholar]
- Zhang, Y.; Xu, G.; Li, P.; Li, Z.; Wang, Y.; Wang, B.; Jia, L.; Cheng, Y.; Zhang, J.; Zhuang, S.; et al. Vegetation change and its relationship with climate factors and elevation on the tibetan plateau. Int. J. Environ. Res. Public Health 2019, 16, 4709. [Google Scholar] [CrossRef] [PubMed] [Green Version]
- Hennig, T.A.; Kretsch, J.L.; Pessagno, C.J.; Salamonowicz, P.H.; Stein, W.L. The shuttle radar topography mission. In Digital Earth Moving; Lecture Notes in Computer Science; Springer: Berlin/Heidelberg, Germany, 2001; Volume 2081, pp. 65–77. [Google Scholar]
- Abatzoglou, J.T.; Dobrowski, S.Z.; Parks, S.A.; Hegewisch, K.C. TerraClimate, a high-resolution global dataset of monthly climate and climatic water balance from 1958–2015. Sci. Data 2018, 5, 170–191. [Google Scholar] [CrossRef] [Green Version]
- Gong, P.; Liu, H.; Zhang, M.; Li, C.; Wang, J.; Huang, H.; Clinton, N.; Ji, L.; Li, W.; Bai, Y.; et al. Stable classification with limited sample: Transferring a 30-m resolution sample set collected in 2015 to mapping 10-m resolution global land cover in 2017. Sci. Bull. 2019, 64, 370–373. [Google Scholar] [CrossRef] [Green Version]
- Bandyopadhyay, A.; Bhadra, A.; Raghuwanshi, N.S.; Singh, R. Temporal trends in estimates of reference evapotranspiration over India. J. Hydrol. Eng. 2009, 14, 508–515. [Google Scholar] [CrossRef]
- Sen, P.K. Estimates of the Regression Coefficient Based on Kendall’s Tau. J. Am. Stat. Assoc. 1968, 63, 1379–1389. [Google Scholar] [CrossRef]
- Tabari, H.; Somee, B.S.; Zadeh, M.R. Testing for long-term trends in climatic variables in Iran. Atmos. Res. 2011, 100, 132–140. [Google Scholar] [CrossRef]
- Saltelli, A.; Tarantola, S.; Chan, K.P.S. A quantitative model-independent method for global sensitivity analysis of model output. Technometrics 1999, 41, 39–56. [Google Scholar] [CrossRef]
- De’ath, G.; Fabricius, K.E. Classification and Regression Trees: A Powerful Yet Simple Technique for Ecological Data Analysis. Ecology 2000, 81, 3178–3192. [Google Scholar] [CrossRef]
- Harper, E.B.; Stella, J.C.; Fremier, A.K. Global sensitivity analysis for complex ecological models: A case study of riparian cottonwood population dynamics. Ecol. Appl. 2011, 21, 1225–1240. [Google Scholar] [CrossRef] [PubMed]
- Evans, J.; Geerken, R. Discrimination between climate and human-induced dryland degradation. J. Arid Environ. 2004, 57, 535–554. [Google Scholar] [CrossRef]
- Guo, Y.Q.; Wang, N.J.; Chu, X.S. Analyzing vegetation coverage changes and its reasons on the Loess Plateau based on Google Earth Engine. China Environ. Sci. 2019, 39, 4804–4811. (In Chinese) [Google Scholar]
- Zhu, Z.; Piao, S.; Myneni, R.B.; Huang, M.; Zeng, Z.; Canadell, J.G.; Ciais, P.; Sitch, S.; Friedlingstein, P.; Arneth, A.; et al. Greening of the Earth and its drivers. Nat. Clim. Chang. 2016, 6, 791–795. [Google Scholar] [CrossRef]
- Song, Y.; Ma, M. A statistical analysis of the relationship between climatic factors and the normalized difference vegetation index in China. Int. J. Remote Sens. 2011, 32, 3947–3965. [Google Scholar] [CrossRef]
- Forzieri, G.; Alkama, R.; Miralles, D.G.; Cescatti, A. Satellites reveal contrasting responses of regional climate to the widespread greening of Earth. Science 2017, 356, 1180–1184. [Google Scholar] [CrossRef] [Green Version]
- Liu, Y.; Lei, H. Responses of natural vegetation dynamics to climate drivers in China from 1982 to 2011. Remote Sens. 2015, 7, 10243–10268. [Google Scholar] [CrossRef] [Green Version]
- Deng, C.H.; Bai, H.Y.; Gao, S.; Liu, R.J.; Ma, X.P.; Huang, X.Y.; Meng, Q. Spatial-temporal Variation of the Vegetation Coverage in Qinling Mountains and Its Dual Response to Climate Change and Human Activities. J. Nat. Resour. 2018, 33, 425–438. (In Chinese) [Google Scholar]
- Gu, Z.; Ju, W.; Li, L.; Li, D.; Liu, Y.; Fan, W. Using vegetation indices and texture measures to estimate vegetation fractional coverage (VFC) of planted and natural forests in Nanjing city, China. Adv. Space Res. 2013, 51, 1186–1194. [Google Scholar] [CrossRef]


| Residuals Trend > 0 | Residuals Trend < 0 | Significant Positive | Significant Negative |
|---|---|---|---|
| 99.85 | 0.15 | 36.49 | 0.006 |
Publisher’s Note: MDPI stays neutral with regard to jurisdictional claims in published maps and institutional affiliations. |
© 2021 by the authors. Licensee MDPI, Basel, Switzerland. This article is an open access article distributed under the terms and conditions of the Creative Commons Attribution (CC BY) license (https://creativecommons.org/licenses/by/4.0/).
Share and Cite
Huang, C.; Yang, Q.; Zhang, H. Temporal and Spatial Variation of NDVI and Its Driving Factors in Qinling Mountain. Water 2021, 13, 3154. https://doi.org/10.3390/w13223154
Huang C, Yang Q, Zhang H. Temporal and Spatial Variation of NDVI and Its Driving Factors in Qinling Mountain. Water. 2021; 13(22):3154. https://doi.org/10.3390/w13223154
Chicago/Turabian StyleHuang, Chenlu, Qinke Yang, and Hui Zhang. 2021. "Temporal and Spatial Variation of NDVI and Its Driving Factors in Qinling Mountain" Water 13, no. 22: 3154. https://doi.org/10.3390/w13223154
APA StyleHuang, C., Yang, Q., & Zhang, H. (2021). Temporal and Spatial Variation of NDVI and Its Driving Factors in Qinling Mountain. Water, 13(22), 3154. https://doi.org/10.3390/w13223154