Article

Optimizing ADM1 Calibration and Input Characterization for Effective Co-Digestion Modelling

Dipartimento di Ingegneria Civile e Ambientale, Politecnico di Milano, Piazza Leonardo da Vinci 32, 20133 Milano, Italy
*
Author to whom correspondence should be addressed.
Water 2021, 13(21), 3100; https://doi.org/10.3390/w13213100
Submission received: 7 October 2021 / Revised: 28 October 2021 / Accepted: 30 October 2021 / Published: 4 November 2021
(This article belongs to the Section Wastewater Treatment and Reuse)

Abstract

:
Anaerobic co-digestion in wastewater treatment plants is looking increasingly like a straightforward solution to many issues arising from the operation of mono-digestion. Process modelling is relevant to predict plant behavior and its sensitivity to operational parameters, and to assess the feasibility of simultaneously feeding a digester with different organic wastes. Still, much work has to be completed to turn anaerobic digestion modelling into a reliable and practical tool. Indeed, the complex biochemical processes described in the ADM1 model require the identification of several parameters and many analytical determinations for substrate characterization. A combined protocol including batch Biochemical Methane Potential tests and analytical determinations is proposed and applied for substrate influent characterization to simulate a pilot-scale anaerobic digester where co-digestion of waste sludge and expired yogurt was operated. An iterative procedure was also developed to improve the fit of batch tests for kinetic parameter identification. The results are encouraging: the iterative procedure significantly reduced the Theil’s Inequality Coefficient (TIC), used to evaluate the goodness of fit of the model for alkalinity, total volatile fatty acids, pH, COD, volatile solids, and ammoniacal nitrogen. Improvements in the TIC values, compared to the first iteration, ranged between 30 and 58%.

1. Introduction

It is increasingly important for wastewater treatment plants (WWTPs) to recover as much energy and material as possible from waste sludge, thus turning WWTP into more energy-efficient and cost-effective facilities. Stricter discharge limits on effluents and technology improvements in wastewater treatment processes are expected to increase the amounts of waste sludge to be treated and disposed [1]. In this context, anaerobic co-digestion (AcoD) offers several potential advantages arising from optimized organic waste treatment [2], and overcomes two main issues related to the anaerobic digestion of waste sludge: the low organic load applied and the presence of spare capacity in WWTP digesters, as much as 30% [3]. Due to its relatively low C/N ratio and high buffer capacity, waste sludge is suitable for co-digestion with easily biodegradable and poorly buffered substrates; moreover, dilution of micropollutants (i.e., heavy metals and pharmaceuticals) commonly found in sludge will be attained as well [4].
AcoD modelling plays a crucial role in the selection of the effective mixing of two or more waste streams in a digester [5]. Indeed, a modelling approach allows the assessment of optimal operational conditions (co-substrate selection, feeding composition, applied loads) of the AcoD process while minimizing the time and costs associated with laboratory experiments [6,7]. Since the development of the current state-of-the-art model for describing anaerobic digestion processes (Anaerobic Digestion Model No. 1) [8], researchers have dealt with two key constraints for model application: (i) the wide range of variability of a large number of stoichiometric and kinetic parameters, requiring the estimation of the most sensitive ones, and (ii) the lack of generally accepted guidelines for influent substrate characterization according to model input variables [9].
Default values of parameters are available from the literature [8,10] and are recommended for the digestion of municipal waste sludge, but they may not be appropriate for a wide range of organic wastes or for co-digestion applications [11,12,13]. Using dynamic data from a full-scale reactor may not be dynamic enough to cover all relevant operational conditions that the model should represent, since the quality of the results will depend on the variations that occur during normal operation [14]. Although it is controversial to apply kinetic parameters estimated from lab-scale experiments to the modelling of full-scale digesters [15,16], it has been widely demonstrated that using biochemical methane potential (BMP) tests is effective in the assessment of ADM1 hydrolysis parameters [12,13,14,17,18].
Batch experiments have been proved to be essential for two further purposes: (i) to quantify the degradability extent (fd) or the inert influent COD fractions (Xi, Si) [15,19]; and (ii) to evaluate the kinetic fractionation by interpreting methane production rate trends obtained from batch experiments [9,20,21].
A reliable analytical determination of all input state variables, as well as the full identification of all individual parameters are neither straightforward nor practical [22,23]. Several methods have been proposed to determine ADM1 input state variables with minimal analytical efforts. The most common way is to estimate substrate fractionation from direct analysis of the main biochemical fractions: carbohydrates, proteins, and lipids [7,9,24,25,26]. An alternative approach relies on the determination of the elemental mass fractions of carbon, hydrogen, oxygen, nitrogen, and phosphorus starting from practical chemical measurements [23,27,28] or directly from the elemental analysis [20]; fractions for proteins, carbohydrates, lipids, and VFAs are then calculated using stoichiometric coefficients and an ideal molecular formula for each component.
The objective of this study is the calibration of the ADM1 for AcoD of municipal waste sludge and expired food from dairy industries (yogurt) to be used in the operation of a pilot-scale digester. In more detail, a protocol for state variables determination was designed and tested, including direct analysis of the biochemical fractions on influent substrates and output digestate, and BMP batch tests. Furthermore, an iterative procedure for the estimation of kinetic parameters was adopted, based on modelling of batch tests performed using target substrates and the digestate from the pilot-scale digester.

2. Materials and Methods

2.1. Pilot Plant

A pilot-scale CSTR digester (60 L working volume) was operated over a period of 7 months. The digester was provided with a temperature control (38 °C), feeding pump, mechanical mixing, on line temperature, pH, and redox monitoring. The digester was fed once a day in a semicontinuous mode, according to an average hydraulic retention time, HRT, of 17 days. The digestate used to inoculate the reactor and the feeding substrates (waste sludge—WS and yogurt—Y) were collected from the full-scale WWTP of Sesto San Giovanni (Milan, Italy) where AcoD already takes place. Substrates were weekly sampled and stored at 4 °C. The experimentation was split into three phases: Phase I (until day 104, from 8 October 2020 to 20 January 2021) during which only WS was fed to the digester (OLR = 2.0 kgCOD∙m−3∙d−1); Phase II (days 105 to 174, from 21 January 2021 to 31 March 2021) where AcoD of WS and Y was implemented (OLR = 2.6 kgCOD∙m−3∙d−1 and 22% of the COD load coming from Y); during Phase III (days 175 to 210, from 1 April 2021 to 6 May 2021) the digester was operated again in mono-digestion, adopting the same conditions as in Phase I.

2.2. Monitoring Plan

Total (TS) and volatile solids (VS), ammoniacal nitrogen (N-NH4+), total alkalinity (Alk), volatile fatty acids (VFAs), and pH were measured weekly on the digested sludge and on the feeding substrates. Biogas composition was measured weekly. Online acquisition of the biogas production rate was made available starting from day 1 until day 83 because of a technical issue.
Additionally, every two weeks during Phase I, and every three/four weeks during Phases II and III, a more comprehensive monitoring plan was implemented for the computation of ADM1 state variables (Figure 1), including the measurement of: carbohydrates (CH), proteins (PR), and lipids (LI) on the total and soluble/suspended (liquid phase separated by centrifugation: 15 min, 4000 rpm) fractions of WS and digested sludge as well as on the total fraction of Y. In addition, with the same regularity, BMP tests on the raw sample (for WS and Y) and on the pellet separated through centrifugation (for WS only) were performed in order to derive both the inert particulate and soluble/suspended fractions of COD (Xi and Si), and an initial estimate of the disintegration/hydrolysis kinetic constant of the process. Total and soluble/suspended COD (on WS and Y) and TKN (on WS) were also measured to verify the appropriateness of the methods adopted for the analysis of the biochemical fractions.

2.3. Analytical Methods

TS, VS, TSS, and VSS were determined according to Standard Method (SM) 2540 [29]. Total COD (CODtot) and total/soluble TKN (TKNtot, TKNs) were measured according to SM 5220 [29] and ISO 5663-1984, respectively. Total/soluble carbohydrates (CHtot, CHs) were measured by means of the phenol-sulfuric acid method (Dubois method), using glucose as standard for the calibration curve (10–180 mgGlu∙L−1) [30]. The Bicinchoninic Acid method (BCA Method) was adopted for the determination of total/soluble proteins (PRtot, PRs) using BSA (Bovine Serum Albumine), a soluble protein, as standard for the calibration curve (25–2000 mgBSA∙L−1). Total/soluble lipids (LItot, LIs) were determined according to SM 5520 B, 5520 E, and 5520 F [29]. Single VFAs (acetic, propionic, isobutyric, butyric, isovaleric, and valeric) concentrations were measured through a gas chromatograph (DANI Master GC) coupled with a flame ionization detector (SM 5560, [29]). Ammoniacal nitrogen was measured using spectrophotometric test kits (Hach-Lange) on 0.45 μm filtered samples. The pH was measured by means of a portable multiprobe meter (Hach-Lange, HQ40D). Total alkalinity (TAC) was measured by automatic titration with H2SO4 up to pH 4.3 (Hach Lange BIOGAS Titration Manager). The biogas composition (CO2, CH4, H2, O2, and N2) was determined using a gas chromatograph (DANI Master GC Analyser equipped with two columns HayeSep Q and Molesieve 5A).

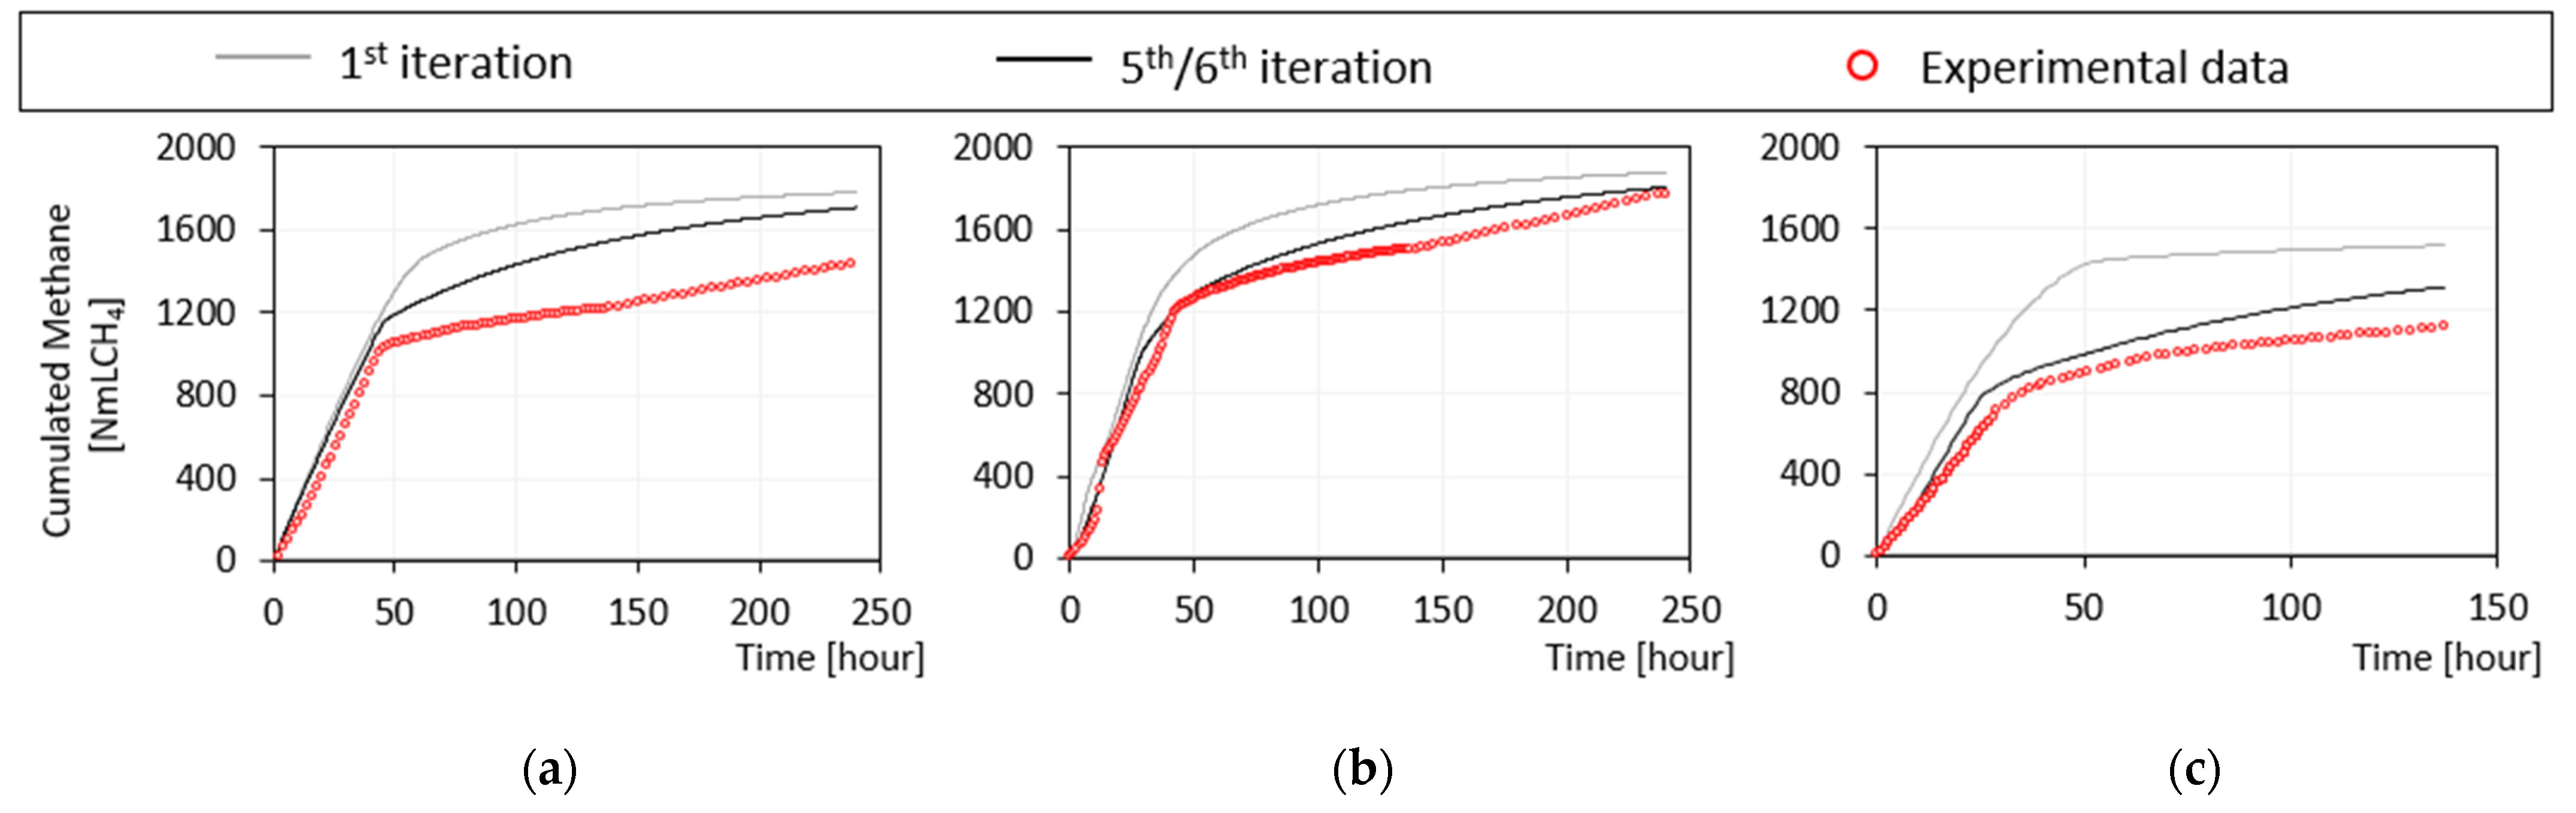
2.4. Batch Experiments

A volumetric device equipped with a CO2-trap was used to measure the methane produced from batch experiments.
BMP tests were run under mesophilic conditions (38 °C) in 1 L reactors, 800 mL working volume, and using the digested sludge sampled from the pilot-scale digester as inoculum. An inoculum to substrate (I/S) ratio of 2.0 gVS/gVS was adopted for sludge. Yogurt was tested using an I/S ratio of 3.5 gVS/gVS, while an I/S ratio of 2.5 was used when testing co-digestion of different blends of sludge and yogurt (yogurt VS fraction of 0.45–0.50–0.65 gVSY/gVStot). BMP values were finally referred to the amount of substrate quantified in terms of COD (NmLCH4∙gCOD−1).
Furthermore, in order to supply additional experimental data for ADM1 calibration, activity tests on the digested sludge sampled from the pilot-scale digester were performed weekly. A VS concentration of 10 g∙L−1 was used; acetate (3.0 gCOD∙L−1), glucose (2.5–4.0 gCOD∙L−1), and bovine serum albumin (BSA, 2.9–4.0 gCOD∙L−1) were selected to test different stages of the anaerobic digestion process, from downstream to upstream: acetoclastic methanogenesis (Xac), acidogenesis from monosaccharides (Xsu), and acidogenesis from amino acids (Xsu), respectively. Tests were stopped once the supplemented substrate was fully consumed, as suggested by the change in the rate of methane production.

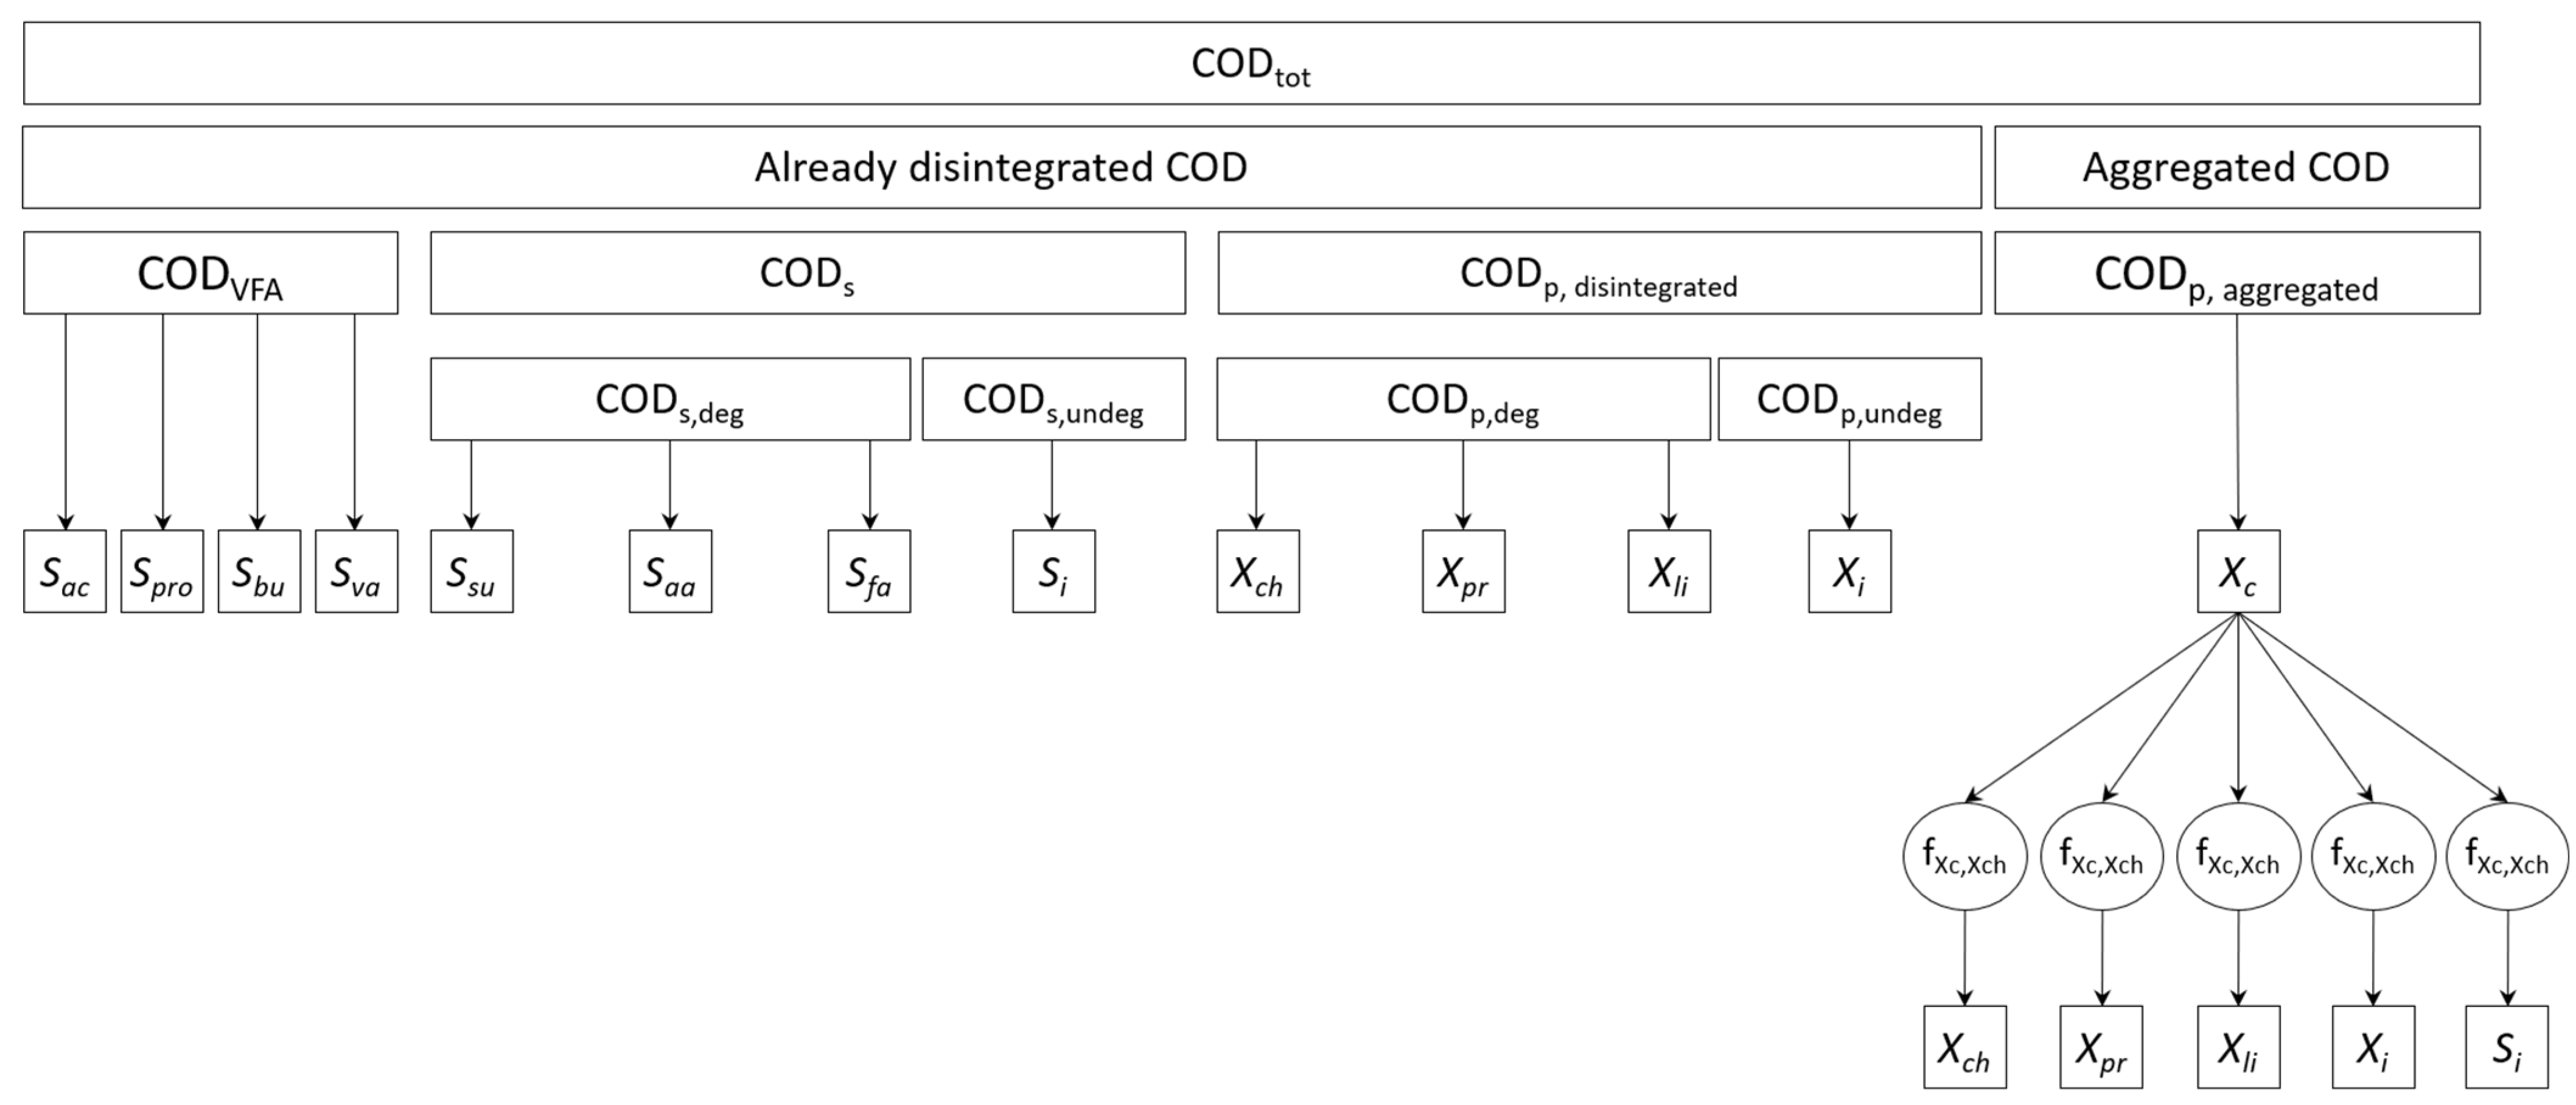
2.5. Input State Variables’ Determination

Of the 26 ADM1 input state variables, 17 were derived from measurements and BMP tests, while the concentration of the 7 biomasses were assumed as negligible in the feeding substrates; the 2 dissolved gases (Sch4 and Sh2) were taken from Rosen and Jeppsson (2006) [10] for WS and assumed as negligible for Y. An overview of substrates fractionation is shown in Figure 1.
An association procedure between experimental data and ADM1 state variables was adopted, similar to that suggested in Hassam et al. (2015) [31]. Details are reported in Appendix A (Table A1 and Table A2). Based on measurements of CH (gGlu∙L−1), PR (gBSA∙L−1), and LI (g∙L−1) in sludge, once defined the COD conversion factors for carbohydrates (αch,COD), proteins (αpr,COD) and lipids (αli,COD), and with the COD associated to VFAs (CODVFA) computed according to stoichiometry, the total, soluble (excluding VFAs), and particulate COD concentrations of the sludge were computed. The BMP value obtained for the particulate fraction of WS was used to derive the inert particulate of sludge (Xi). Thus, the inert soluble was calculated from the BMP value obtained for the total fraction of WS (BMPtot). The percentage of COD used for cell growth during the BMP test was assumed to be fY = 8% [32]. In order to derive the amount of particulate/soluble, degradable biochemical fractions, direct measurements of each of them were resized to the degradable particulate (CODpXi) or soluble (CODsSi) COD contents.
Since the waste sludge was a mixture of primary (90% on VS base) and secondary sludge (10% on VS base), the 10% of the VS of the secondary sludge was assumed to enter the digester as complex particulate (Xc), while the remaining 90% as already disintegrated variables (Xch,, Xpr, Xli, Xi). Fractionation coefficients of Xc were then derived as reported in Table A3 (Appendix A) and were introduced in the model as time-dependent parameters.
Regarding the expired yogurt, BMP tests proved that yogurt is almost completely degradable (Xi = Si ≅ 0). Furthermore, since measurements for yogurt were available only for the raw sample, with no distinction between the particulate and the soluble fractions, as first attempt the total organic matter was assumed to be particulate degradable COD, entering the digester as already disintegrated variables (Xch,, Xpr, Xli). VFAs were considered as the sole non-negligible soluble components. This approach was then changed during simulations in order to improve the fit with experimental data during Phase II, as will be further discussed in Section 3.2.2.

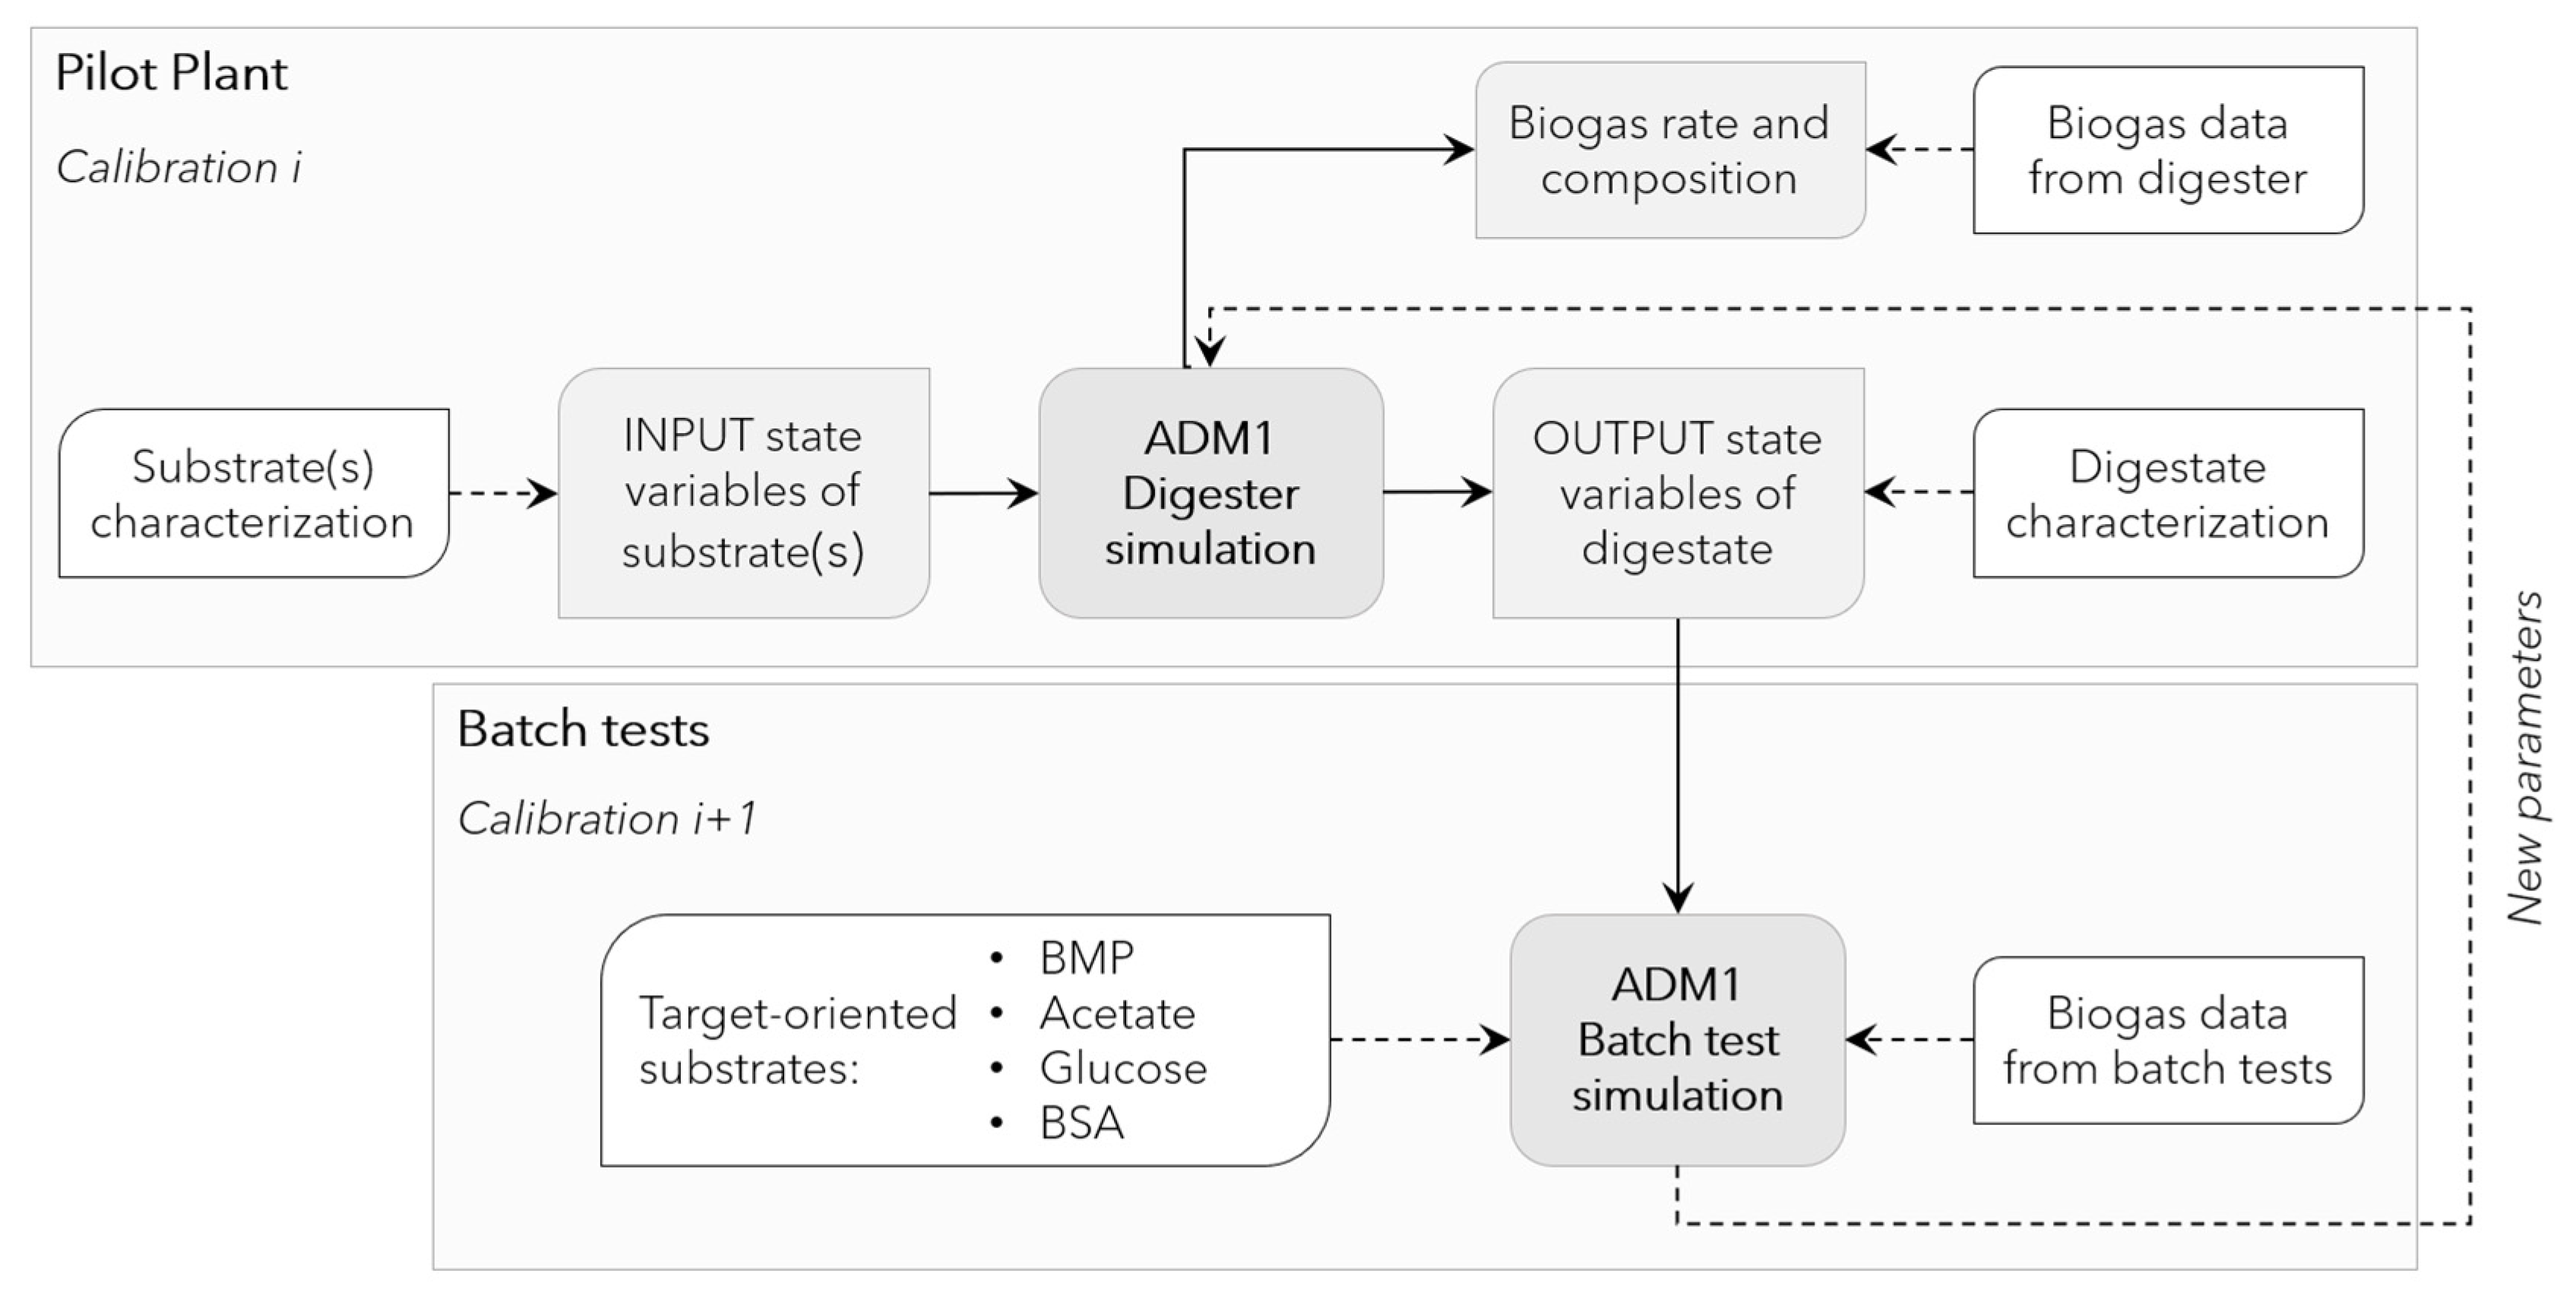
2.6. Model Implementation, Calibration, and Evaluation

The ADM1 was implemented according to Rosen and Jeppsson (2006) [10] and used for modelling both the continuous reactor and the batch experiments. The OpenModelica platform was used as a simulation tool, selecting DASSL (Differential/Algebraic System Solver) code for the numerical solution of the system of differential/algebraic equations. The initial values of the stoichiometric and kinetic parameters were taken from Rosen and Jeppsson (2006) [10] and the temperature correction coefficients for kinetic parameters from Siegrist et al. (2002) [33].
To exploit the synergy between data from batch experiments and those collected from the pilot-scale reactor, kinetic parameters were calibrated according to an iterative procedure (Figure 2) in view of a simultaneous optimization of batch and continuous tests. The modeling of the pilot-scale reactor using default initial values of ADM1 parameters provided initial values for digested sludge characteristics. Such values were then transferred to the batch tests (BMP and biomass activity tests) for kinetic parameters estimation and, iteratively, parameters estimates were passed back to the pilot-scale model to provide more accurate values for digested sludge state variables.
Sensitivity analysis was used to identify the most sensitive parameters to be evaluated in the calibration procedure, testing all kinetic parameters and input state variables (perturbation ±20%), and selecting, as response variables, the same made available for calibration from the monitoring of the pilot plant (the methane rate QCH4, alkalinity, the total concentration of volatile fatty acids TVFA, pH, N-NH4+, VS, and COD). The sensitivity index (SI), which is the ratio between perturbed and unperturbed runs, was computed to quantify sensitivity.
In order to quantitatively describe the model performance, the Theil’s Inequality Coefficient (TIC) [34] and the modified Mean Absolute Relative Error (MARE) [35] were applied (Equations (1) and (2)).
TIC = i ( y s , i y m , i ) ) 2 i y s , i 2 + i y m , i 2
MARE = 1 n i = 1 n | y m , i y s , i | y m , i + φ
where y s , i represents the value of the variable measured experimentally and y m , i the value estimated by the model. The small correction factor φ (0.1) was applied to avoid division by zero. Both criteria quantified the difference between model predictions and experimental values and normalized them according to the magnitude of each variable. TIC < 0.3 represented a good simulation result. In general, for both criteria, the closer the value to zero, the better the model performance.

3. Results

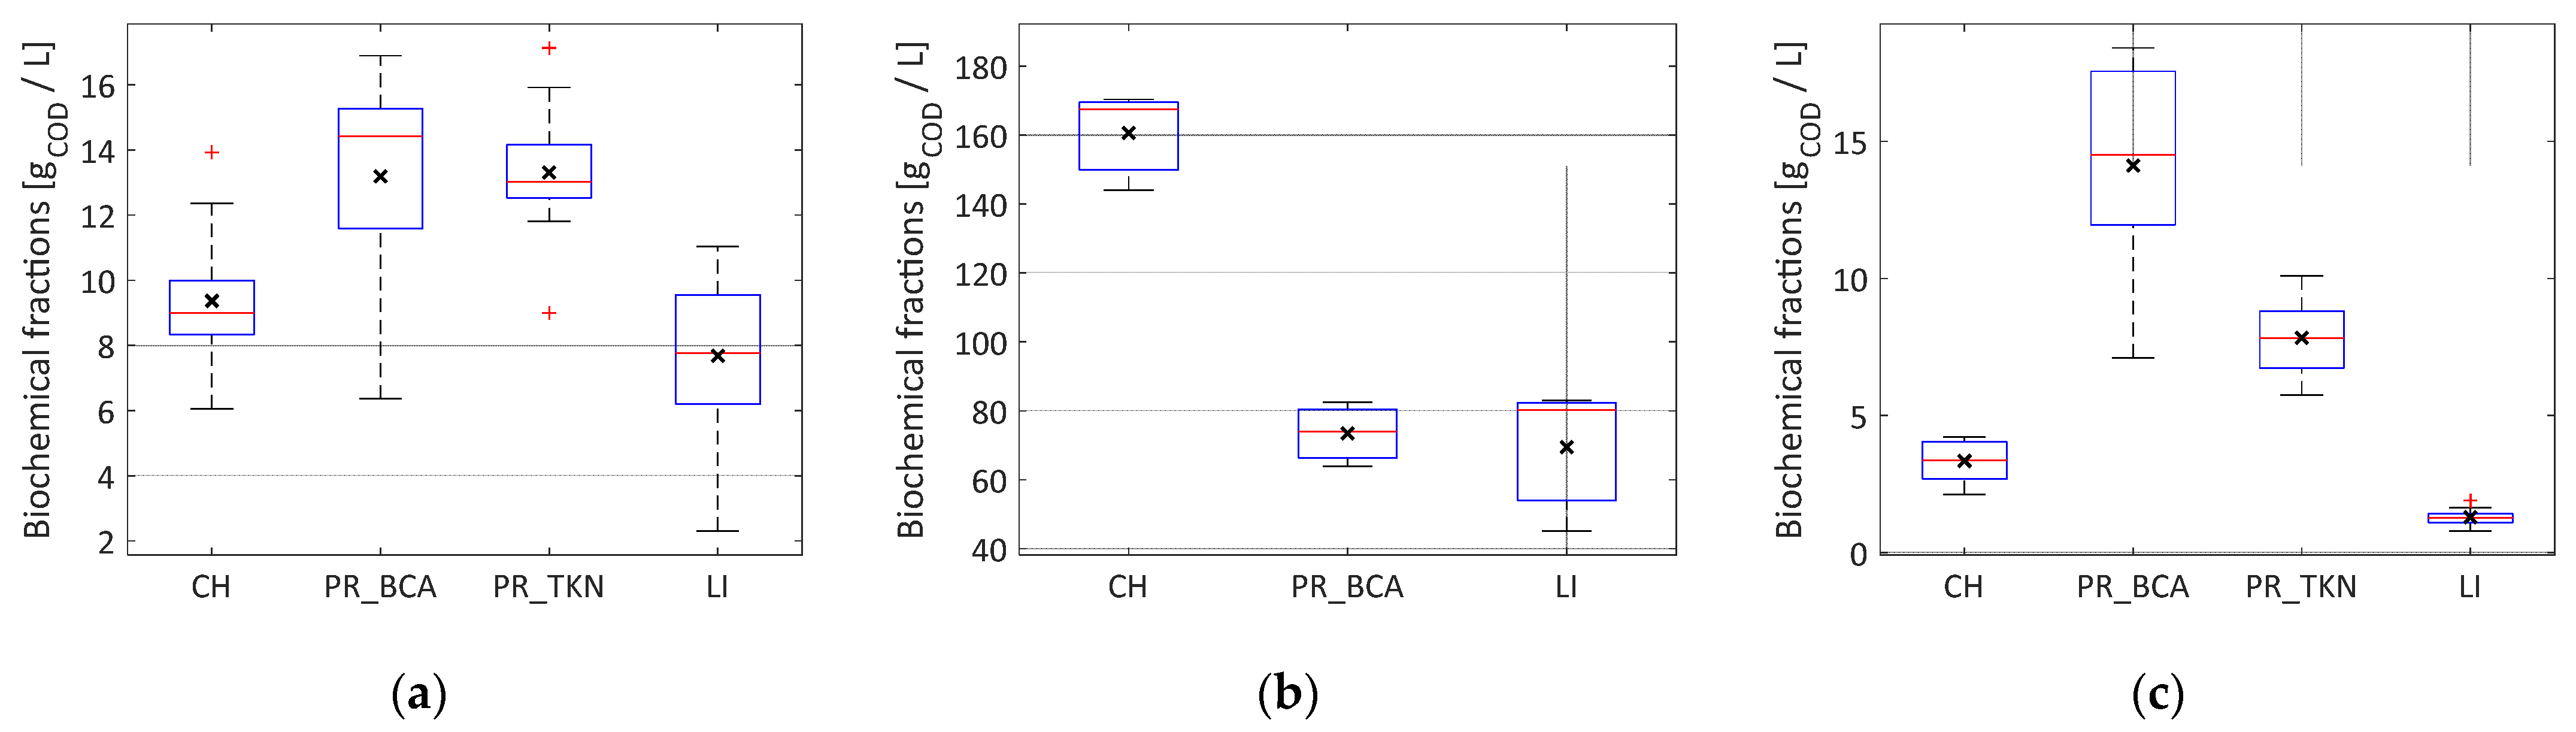
3.1. Substrates and Digestate Characterization

Results of the the measurements of CH, PR, and LI concentration in WS, Y, and digestate are reported in Figure 3. Two sets of data were available for PR estimation corresponding to the BSA or the TKN method that were reported as PR_BSA and PR_TKN, respectively. The composition of substrates is reported in Figure 3a,b. Compared to yogurt, the high variance of sludge composition reflected the seasonal variability of this substrate whose characteristics are dependent upon the wastewater as well as on WWTP operational parameters. According to the BCA Method, the total COD of the WS comprised, on average, 29% carbohydrates, 42% proteins, and 24% lipids, the remainder being VFAs. As regards Y, 52% of total COD originated from carbohydrates, 24% from proteins, and 22% from lipids.
With reference to Figure 3c, given the large difference between the protein content measured with the two methods, and in order to verify the reliability of experimental data, COD balances were assessed by comparing the available data of CODtot with that computed as the sum of components. For this purpose, a COD content of 1.58 gCOD∙gBSA−1 was assumed for the BCA method, and conversion factors of 6.25 gPR∙gN−1 and 1.42 gCOD∙gPR−1 were used for the TKN method [30]. Relative errors (errrel) were computed and negative values identified underestimations of the sum of biochemical fractions, compared to the Standard Method 5220 [29] for COD determination. For waste sludge, the COD balance was accurate enough using both BCA (errrel range −9.0% to 19%, average value of 7.7%) and TKN (errrel range −14% to 21%, average value of 7.2%) methods. Regarding digestate, the TKN method (errrel range −49% to 14%, average value of 16%) performed much better than the BCA method (errrel range −89% to 14%, average value of 47%), with errors three times lower on average. As already found by other authors [36], significant overestimations using the BCA method were observed for all digestate samples, except one. Although the BCA method was not affected by humic acids content, simple sugars such as glucose can respond like proteins, generating interference [37]. However, bacteria quickly assimilate simple sugars that are commonly less abundant in bacterial aggregates [36]. Conversely, the uncertainty related to the hypothesis of 16.5% (w/w) of nitrogen in proteins (6.25 gPR∙gN−1), which is the basis for the conversion of the organic nitrogen into COD associated to proteins, likely affected the results found in the present study. Based on the amino acid composition of reference substrates, several authors showed that this ratio varied remarkably from one substrate to another: from 5.14 to 6.26 for animal and plant products [38], 7.5 for wastewater [39], and 8.8 for sewage sludge [30].
In view of the results of the present study, the BCA method was selected for computation of input state variables, while for digestate, the COD content of the effluent digestate from simulations was fitted with measurements from SM 5220.

3.2. Model Calibration

The results from the sensitivity analysis suggest the importance of accurate measurement of the influent concentration of particulate proteins to properly predict variables such as the inorganic nitrogen concentration (SI ≅ 19%), alkalinity (SI ≅ 12%) and QCH4 (SI ≅ 7%). A ±20% perturbation of the hydrolytic constant of proteins altered the output variables to a lower extent (SI < 4%). The methane rate was also impacted by the concentration of particulate carbohydrates and lipids (SI ≅ 5%). TVFA were affected by many parameters, of which the half-saturation constant for propionate (KS,pro) and maximum uptake rate for propionate (km,pro) were the most influential (SI = 7%). According to the results of this analysis, a subset of nine parameters were selected to be calibrated on experimental data (kdis, khyd,ch, khyd,pr, khyd,li, km,su, km,aa, km,ac, KS,su, KS,aa, KS,ac, KS,pro).
A comparison of the parameters estimated at the 1st and 5th iterations is reported in Table 1, while Table S1 (Supplementary Materials) summarizes the results of the iterative calibration process and the values of the parameters estimated at each iteration. A total of six iterations on nine parameters were performed in order to reach a satisfactory agreement with the experimental data. Model performance criteria were evaluated at each step of the iterative procedure and are reported in Table S2 (Supplementary Materials) for some of the batch tests performed during the experimentation, and in Table S3 (Supplementary Materials) for the pilot plant model. Likewise, Figure 4 and Figure 5 for activity tests and BMP tests, respectively, and Figure 6 for the pilot plant visually show the improvements achieved during the iterative procedure. A detailed discussion of results is included in the following subsections to elucidate the role of the most interesting steps of the calibration procedure and to highlight insights drawn from the results obtained.
It is worth noting that, despite the limited dataset, the fit of the methane rate was very good starting from iteration n.1 (grey line, Figure 6a), which was obtained by modifying only the rate of hydrolysis and disintegration kinetic constants. However, some crucial variables for the monitoring and the control of a digester (TVFA, VS) were not satisfactorily predicted by the model at the 1st iteration (see the TIC and MARE values in Table S3, Supplementary Material). Hence, for practical use of the ADM1 model at full-scale as well as for the assessment of scenario analyses, it was essential to accurately estimate parameters by exploiting not only the biogas production rate but also the physiochemical properties measured on the digestate.

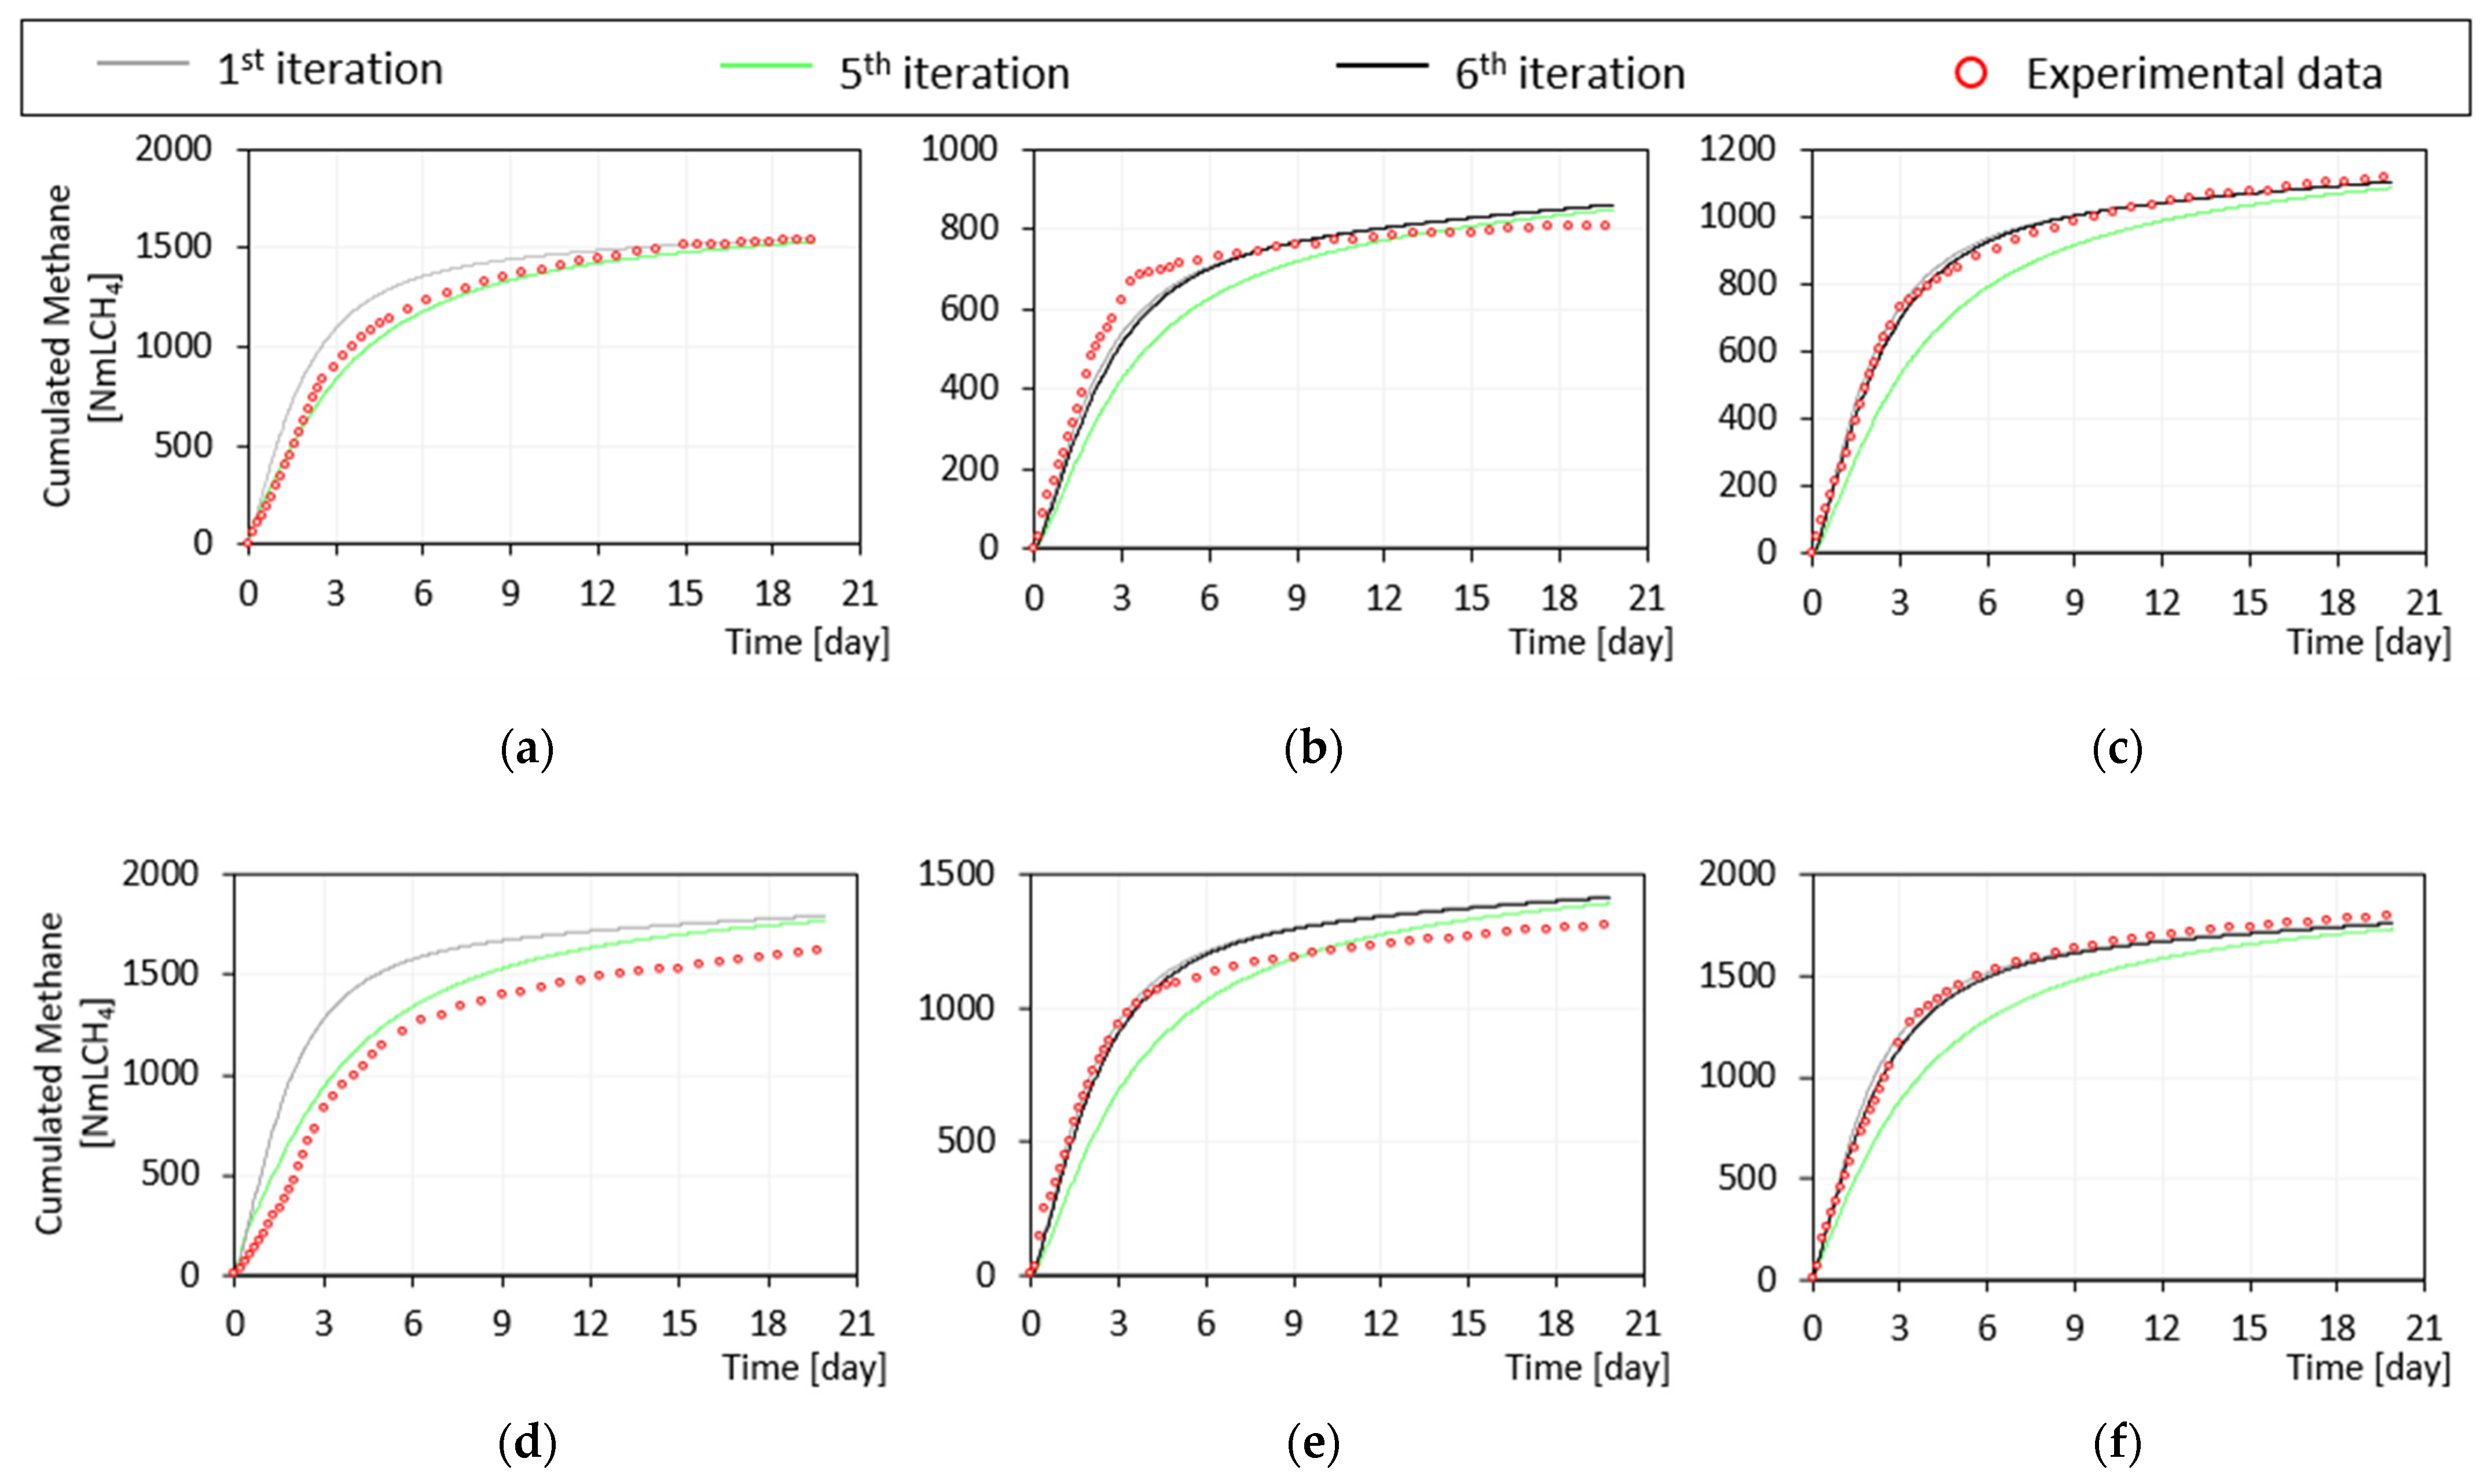
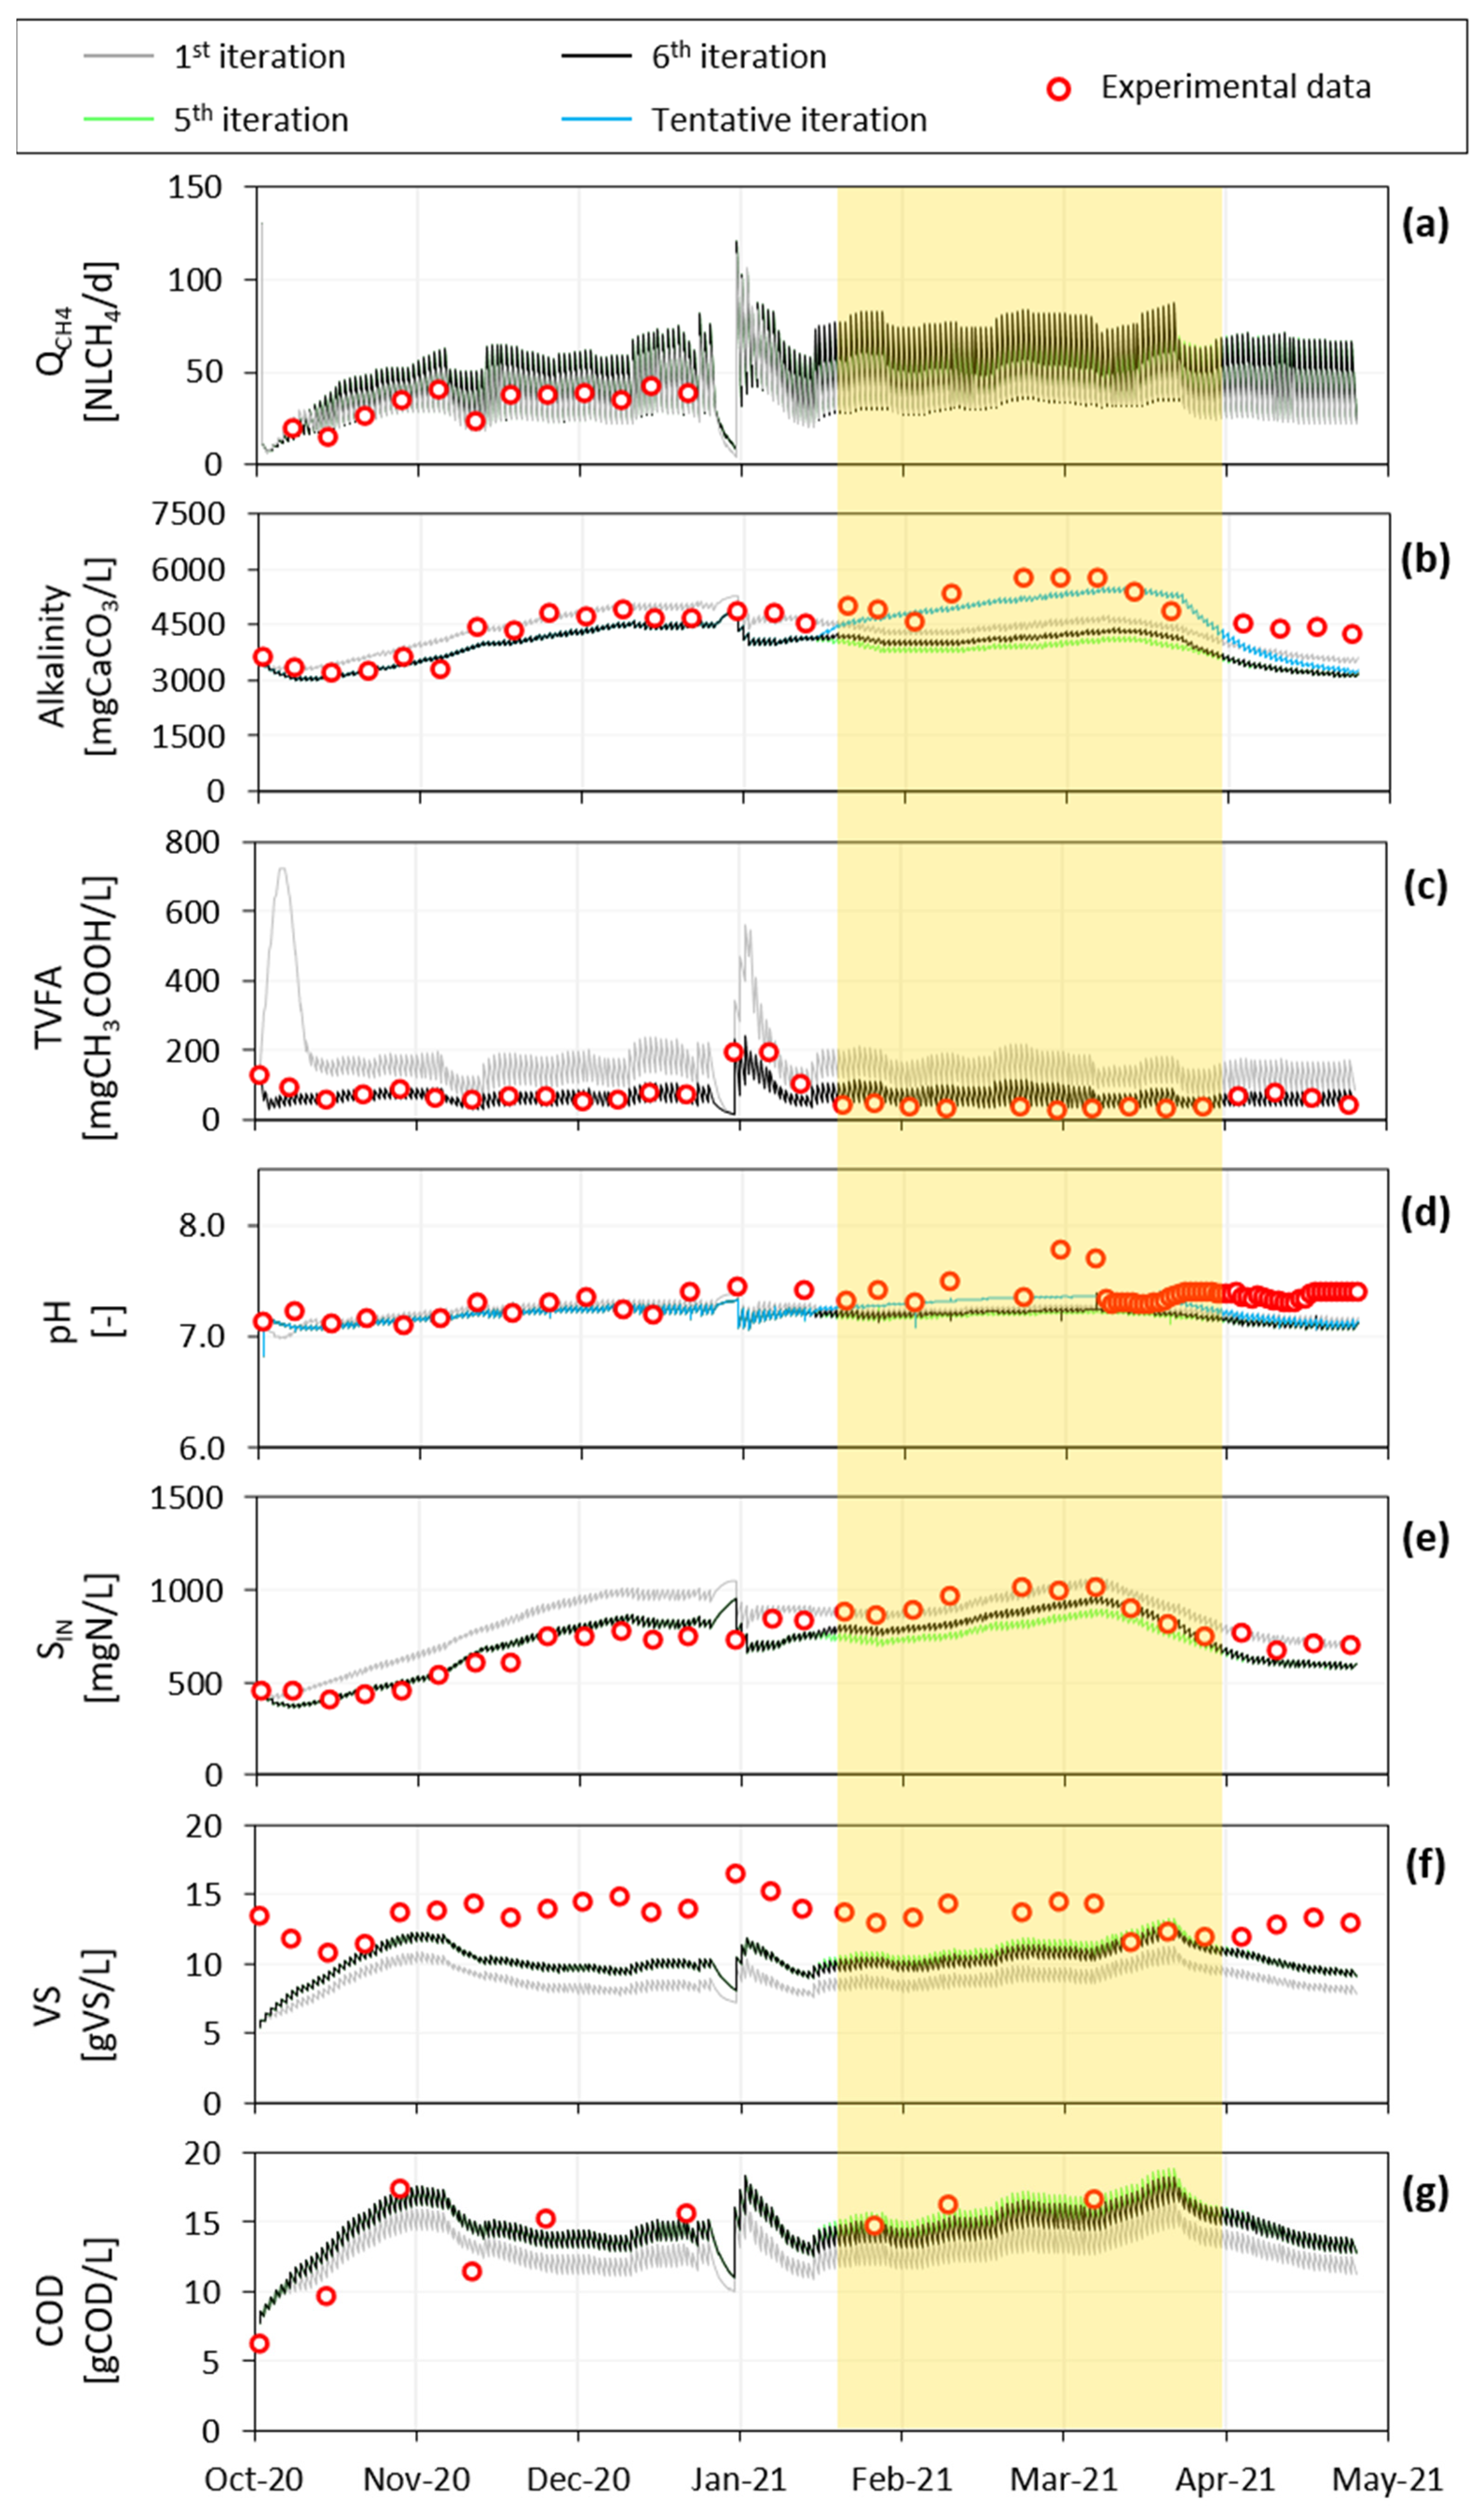
3.2.1. Iteration Steps from First to Fifth

The actual iterative process stopped at the fifth iteration (green/black line in Figure 4, Figure 5 and Figure 6). At this point, the simulations of both the pilot plant and the batch tests gave satisfactory results, as supported by the values of the TIC and MARE indicators shown in Tables S2 and S3 (Supplementary Materials). Examples of fit of experimental batch activity tests are reported in Figure 4 for acetate, glucose, and BSA. In these tests the maximum uptake rates and the half saturation constants for acetate, monosaccharide, and amino acid degrading organisms were estimated based on the fit with experimental data.
The hydrolysis constants for carbohydrate, protein, and lipid were identified from BMP tests on sludge. The modelling of activity tests on acetate and BSA remarkably improved as shown in Figure 4c, where the TIC and MARE coefficients decreased by 35% and 69%, respectively.
The simulation curve of TVFA from the pilot plant, shown in Figure 6c, had a noticeable improvement from the first to the fifth iteration. Moving from the fourth to the fifth iteration, the half saturation constant for propionate degrading microorganisms Ks,pro was modified from 0.3 to 0.2 gCOD∙L−1 for a better fit with TVFA measurements. Despite this, in Phase II the modelling of TVFA was less accurate (TIC > 0.3). The fit with the experimental data of ammoniacal nitrogen (Figure 6e), volatile solids (Figure 6f), and COD (Figure 6g) were also refined by iterations. Conversely, the slight worsening in the prediction of QCH4 was made explicit by the TIC and MARE coefficients reported in Table S3 (Supplementary Materials) that changed from 0.070 and 0.162 to 0.112 and 0.274, respectively.

3.2.2. Iteration Step from Fifth to Sixth

Using the parameters corresponding to iteration n.5, during the co-digestion phase a deviation was observed between the experimental and simulated values of some effluent variables (TVFA, alkalinity, and ammoniacal nitrogen) of the pilot plant model. The model with parameters estimated at the fifth iteration worked better for mono-digestion than for co-digestion, as supported by the model fitting criteria reported in Table S3 (Supplementary Materials). Further, BMP tests performed with yogurt or with sludge in co-digestion with yogurt (Figure 5) were not well simulated. Two hypotheses were assumed in order to explain such performance:
  • Disintegration constants are different for waste sludge and yogurt, depending on the type of substrate and not only on biomass adaptation.
  • Some soluble proteins were already available from yogurt.
In view of this, a sixth iterative step was carried out assuming that the proteins coming from yogurt were already hydrolyzed, thus entering as Saa. This modification led to the improvement of the fit of the alkalinity and ammoniacal nitrogen data in the pilot-plant during Phase II. In addition, the fit of the BMP tests performed with yogurt and in co-digestion improved significantly. A similar improvement was observed irrespective of the type of digestate (adapted—Figure 5b,c—or not—Figure 5e,f—to the co-digestion conditions). This evidence indicated that the kinetic constant of disintegration process may depend more on the type of substrate than on the type of inoculum. In addition, hydrolysis constants during mono and co-digestion may change due to synergistic effects arising during co-digestion. In this case, since the microbial population adapted to the new working conditions, different hydrolysis constants should be considered for co-digestion.
The fit with the effluent volatile solids remained poor during all iterations: nevertheless, it should be considered that the computation of volatile solids from ADM1 state variables is complex as it requires assuming several COD conversion coefficients, which may depend only on the known chemical characteristics, such as those applied to the inert components, which was assumed to be equal to 1.3 gCOD∙gVS−1. Conversely, a good fit with the total effluent COD was achieved.

3.2.3. Yogurt Alkalinity

At the end of iteration n.6, it was noticeable that the ability of the model to predict alkalinity worsened during co-digestion with yogurt (Table S3, Supplementary Material). This is likely due to a lack of the characterization of the ionic components of yogurt. To verify this hypothesis, a tentative simulation was performed, where the alkaline content of the yogurt was increased by the addition of ionic species (Scat in the yogurt characterization was increased by 0.5 mol∙L−1), which could be for instance salts of a strong base and a weak acid (e.g., organic acids or phosphate salts). The tentative simulation was represented with light blue lines in Figure 5, and it only affects the fit of alkalinity and pH.
Model prediction performances criteria TIC and MARE changed from 0.095 and 0.139 for alkalinity at the sixth iteration, to 0.054 and 0.089 at the end of the fictitious iteration and from 0.013 and 0.022 for pH to 0.011 and 0.017, respectively.

4. Discussion

The combined protocol proposed to determine ADM1 input state variables proved to be effective for the characterization of waste sludge and expired yogurt. It included several analytical determinations and the execution of BMP tests on different fractions (soluble/particulate) of the substrate. For practical purposes, it is clear that a reduction in the number of tests and analyses to be carried out to reach satisfactory predictive ability is advisable. As for the sludge, based on the results from the sensitivity analysis and from measurements, and given the predominance of the particulate matter, the determination of soluble components other than VFAs can be avoided. In this case, the biodegradability of the particulate and soluble COD fractions can be assumed to be equal to the overall degradability and the remaining biodegradable soluble COD can be divided into three equal parts (Ssu, Saa, Sli) [13,19,24] or using the same proportion found in the particulate matter, as suggested in a previous work [7].
On the other hand, the soluble content of the biochemical fractions in yogurt has to be verified through measurements in order to accurately calibrate the disintegration and the hydrolysis kinetic constants of the process. As suggested by Zaher et al. (2009) [40] through the development of the General Integrated Solid waste Co-Digestion model (GISCOD), it is difficult to find unique parameter values that are applicable to a combination of substrates. In addition, it has been recently demonstrated that the mechanisms of hydrolysis can be successfully described as a sequential degradation of substrates (according to their bioaccessibility), as opposed to the common approach used that considers simultaneous degradation of multiple substrates [41]. The present work proves that it is essential to independently evaluate disintegration constants for each co-substrate, as the hydrolysis kinetic constant mainly depends on the characteristics of the biomass and on possible adaptation due to co-digestion conditions.
As regards the ionic balance and the poor performance in the prediction of effluent alkalinity during co-digestion, results from the present study highlight the potential importance of taking into account possible ionic species other than those suggested in the ADM1, when using substrates different from sewage sludge.
The iterative procedure proposed for model calibration was effective, and a similar methodology used by Girault et al. (2011) [14] provided good results even though, in that case, the model performance was verified using only the methane production rate measured on the continuous reactor. In the present work, more variables were used for model calibration, proving that the methane rate alone might be insufficient to fully verify the model accuracy.
A more accurate estimate of VFA degradation kinetics is required and tests with single VFAs might be beneficial for this purpose. Moreover, as regards the test with glucose shown in Figure 4b (initial COD concentration of 4 gCOD∙L−1), a double change in the slope of the curve was observed, with a very fast kinetic in the middle associated with rapid degradation of the substrate. This was likely due to an initial pH lowering causing the initial slowdown of the process. As soon as the methanogens started to degrade the VFAs produced, the pH rose, and a fast methane production was observed. Tests with glucose were performed at different COD concentrations, but this behavior was found for all tested concentrations. This peculiar shape was not properly predicted by the model, since this would require the calibration of inhibitory kinetics parameters. Furthermore, activity tests varying the initial COD concentration of target substrates would be useful to improve the identifiability of parameters as also suggested by Girault et al. (2011) [14], and to assess inhibitory phenomena. For instance, by testing low concentrations of COD in tests with glucose, inhibition phenomena due to the initial lowering of the pH would be reduced, making the estimation of the kinetic parameters for the degradation of sugars more reliable. Once identified km,su, Ks,su the test can be repeated at high glucose concentrations, to estimate the parameters describing the inhibition process. Shi et al. (2019) [42] recently presented a modification to ADM1 using a variable approach to the acidogenesis stoichiometry as opposed to the common use of constant stoichiometry to describe carbohydrate fermentation.
In addition, VFAs inhibition kinetics on methanogenic biomass was not included in the model but is essential to predict the stability of the digester in response to possible yogurt overloading in a scenario analysis [4]. Regarding this aspect, testing higher yogurt loads will likely be essential for model validation.
Finally, it would be also advisable to implement an automated iterative procedure for parametric identification to make the calibration procedure more effective and less time-consuming.

5. Conclusions

The method for the characterization of the ADM1 input state variables was effective, and the iterative procedure proposed for calibration improved model prediction performances. Model fitting criteria (TIC and MARE) were significantly reduced from 0.066 and 0.100 for alkalinity at the first iteration to 0.054 and 0.089 at the end of the last iteration; from 0.475 and 2.00 for TVFA to 0.207 and 0.507; from 0.080 and 0.150 for N-NH4+ to 0.055 and 0.099; from 0.220 and 0.339 for VS to 0.156 and 0.238; and from 0.097 and 0.198 for COD to 0.070 and 0.156. Except for km,ac, which did not change during iterations, modifications of the other parameters selected for calibration ranged from 25% (kdis) to 93% (KS,ac), showing significant improvements in parameter estimation. Further refinements can be achieved mainly by: (i) automating the iterative procedure; (ii) including missing measurements within the analytical protocol and specific activity tests to predict inhibitory phenomena; and (iii) separating the disintegration/hydrolysis constants for different co-substrates.

Supplementary Materials

The following are available online at https://www.mdpi.com/article/10.3390/w13213100/s1, Table S1: Kinetic parameters estimated at each iterative step of the calibration process, Table S2: Model performance criteria (TIC and MARE) evaluated at varying iterative steps for selected batch activity tests and BMP tests, Table S3: Model performance criteria (TIC and MARE) evaluated at varying iterative steps for the seven output variables monitored during the operation of the pilot plant. A distinction is made between the mono-digestion period (Phase I and Phase III) and the co-digestion period (Phase II).

Author Contributions

Conceptualization, A.C. and E.F.; methodology, A.C. and E.F.; software, A.C. and M.G.; validation, A.C. and M.G.; formal analysis, A.C. and M.G.; data curation, A.C. and M.G.; writing—original draft preparation, A.C.; writing—review and editing, A.C., M.G., F.M. and E.F.; supervision, E.F.; project administration, A.C., F.M. and E.F.; funding acquisition, F.M. All authors have read and agreed to the published version of the manuscript.

Funding

The work was funded by: (i) the Lombardy Region in the framework of European Regional Development Fund (ERDF) 2014-2020 with the project PerFORM WATER 2030—Platform for Integrated Operation Research and Management of Public Water towards 2030 and the (ii) Fondazione Cariplo (Italy), Project 2018-0992 Wast4Bioplast.

Institutional Review Board Statement

Not applicable.

Informed Consent Statement

Not applicable.

Acknowledgments

The authors are grateful to CAP Holding for the logistic support and to Angela Nunziata and Davide Soderino for their technical support.

Conflicts of Interest

The authors declare no conflict of interest.

Nomenclature

Cac, Cpro, Cbu, Cvaconcentrations of acetic, propionic, butyric, and valeric acids [g∙L−1];
γac, γpro, γbu, γvastoichiometric conversion coefficients from moles of acetic, propionic, butyric, and valeric acids to COD [mol∙gCOD−1];
MWac, MWpro, MWbu, MWvamolecular weights of acetic, propionic, butyric, and valeric acids [g∙mol−1];
CHtot, PRtottotal concentration of carbohydrates and proteins [g∙L−1];
LIpparticulate concentration of lipids [g∙L−1];
LIssoluble concentration of lipids [g∙L−1];
CHs, PRs, LIssoluble concentrations of carbohydrates, proteins, and lipids [g∙L−1];
αch,COD, αpr,COD, αli,CODconversion coefficients from carbohydrates, proteins, and lipids to COD [g∙g COD−1];
fYpercentage of COD used for cell growth during BMP test [gCOD∙gCOD−1];
CINconcentrations of ammoniacal nitrogen [gN∙L−1];
MWNmolecular weight of nitrogen [gN∙mol−1];
Alkconcentration of alkalinity [M];
Sac-, Spro-, Sbu-, Sva-concentrations of dissociated species of acetic, propionic, butyric, and valeric acids [M].

Appendix A

Table A1. Computation of total, soluble, and particulate, degradable and undegradable COD fractions from measurements.
Variable Name Equation n.
Soluble COD from VFAs COD vfa =   C ac · γ Hac MW Hac + C pro · γ Hpro MW Hpro + C bu · γ Hbu MW Hbu + C va · γ Hva MW Hva (1)
Total COD COD tot =   COD VFA + CH tot · α ch , COD + PR tot · α pr , COD + ( LI s + LI p ) · α li , COD (2)
Soluble COD
Excluding VFAs
COD s =   CH s · α ch , COD + PR s · α pr , COD + LI s · α li , COD (3)
Particulate COD COD p =   COD tot COD s COD vfa (4)
Undegradable total COD COD tot , undeg = COD tot · (   1 f Y BMP tot 350 ) (5)
Undegradable particulate COD COD p , undeg = COD p · (   1 f Y BMP p 350 ) (6)
Undegradable soluble COD COD s , undeg = COD tot , undeg COD p , undeg (7)
Degradable total COD COD tot , deg = COD tot COD tot , undeg (8)
Degradable particulate COD COD p , deg = COD p COD p , undeg (9)
Degradable soluble COD COD s , deg = COD s COD vfa COD s , undeg (10)
Table A2. Computation of ADM1 state variables from measurements.
Variable Name 1Equationn.
Particulate inert X i = COD p , undeg (1)
Soluble inert S i = COD s , undeg (2)
Particulate carbohydrates X ch = ( CH tot CH s ) · α ch , COD · ( COD p , deg ) COD p (3)
Particulate proteins X pr = ( PR tot PR s ) · α pr , COD · ( COD p , deg ) COD p (4)
Particulate
lipids
X li = LI p · α li , COD · ( COD p , deg ) COD p (5)
Soluble
sugars
S su = CH s · α ch , COD · ( COD s , deg ) COD s (6)
Soluble
amino acids
S aa = PR s · α pr , COD · ( COD s , deg ) COD s (7)
Soluble
fatty acids
S fa = LI s · α li , COD · ( COD s , deg ) COD s (8)
Soluble total acetic acid S ac =   C ac · γ Hac MW Hac (9)
Soluble total propionic acid S pro = C pro · γ Hpro MW Hpro (10)
Soluble total butyric acid S bu = C bu · γ Hbu MW Hbu (11)
Soluble total valeric acid S va = C va · γ Hva MW Hva (12)
Soluble inorganic nitrogen S IN = C IN MW N (13)
Soluble bicarbonate S hco 3 = Alk ( S ac + S pro + S bu + S va ) (14)
1 Computations of acid-base pairs, Scat, and San are not shown: they were calculated from the charge balance and from the acid-base equilibria as reported in Rosen and Jeppson, 2006 [1].
Table A3. Computation of yields from disintegration of complex particulates.
Coefficient Name Equation n.
Yield of particulate carbohydrates f Xc _ Xch = X ch X c (1)
Yield of particulate proteins f Xc _ Xpr = X pr X c (2)
Yield of particulate lipids f Xc _ Xli = X li X c (3)
Yield of particulate inert f Xc _ Xi = X i X c · X i ( S i + X i ) (4)
Yield of soluble inert f Xc _ Si = X i X c · S i ( S i + X i ) (5)

References

  1. Hanum, F.; Yuan, L.C.; Kamahara, H.; Aziz, H.A.; Atsuta, Y.; Yamada, T.; Daimon, H. Treatment of Sewage Sludge Using Anaerobic Digestion in Malaysia: Current State and Challenges. Front. Energy Res. 2019, 7, 19. [Google Scholar] [CrossRef] [Green Version]
  2. Mata-Alvarez, J.; Dosta, J.; Romero-Güiza, M.S.; Fonoll, X.; Peces, M.; Astals, S. A Critical Review on Anaerobic Co-Digestion Achievements between 2010 and 2013. Renew. Sustain. Energy Rev. 2014, 36, 412–427. [Google Scholar] [CrossRef]
  3. Montusiewicz, A.; Lebiocka, M. Co-Digestion of Intermediate Landfill Leachate and Sewage Sludge as a Method of Leachate Utilization. Bioresour. Technol. 2011, 102, 2563–2571. [Google Scholar] [CrossRef]
  4. Mata-Alvarez, J.; Dosta, J.; Macé, S.; Astals, S. Codigestion of Solid Wastes: A Review of Its Uses and Perspectives Including Modeling. Crit. Rev. Biotechnol. 2011, 31, 99–111. [Google Scholar] [CrossRef]
  5. Zhou, H.; Ying, Z.; Cao, Z.; Liu, Z.; Zhang, Z.; Liu, W. Feeding Control of Anaerobic Co-Digestion of Waste Activated Sludge and Corn Silage Performed by Rule-Based PID Control with ADM1. Waste Manag. 2020, 103, 22–31. [Google Scholar] [CrossRef]
  6. Astals, S.; Batstone, D.J.; Mata-Alvarez, J.; Jensen, P.D. Identification of Synergistic Impacts during Anaerobic Co-Digestion of Organic Wastes. Bioresour. Technol. 2014, 169, 421–427. [Google Scholar] [CrossRef] [PubMed] [Green Version]
  7. Fisgativa, H.; Zennaro, B.; Charnier, C.; Richard, C.; Accarion, G.; Béline, F. Comprehensive Determination of Input State Variables Dataset Required for Anaerobic Digestion Modelling (ADM1) Based on Characterisation of Organic Substrates. Data Brief 2020, 29, 105212. [Google Scholar] [CrossRef] [PubMed]
  8. Batstone, D.J.; Keller, J.; Angelidaki, I.; Kalyuzhnyi, S.V.; Pavlostathis, S.G.; Rozzi, A.; Sanders, W.T.M.; Siegrist, H.; Vavilin, V.A. The IWA Anaerobic Digestion Model No 1 (ADM1). Water Sci. Technol. 2002, 45, 65–73. [Google Scholar] [CrossRef] [PubMed]
  9. Girault, R.; Bridoux, G.; Nauleau, F.; Poullain, C.; Buffet, J.; Steyer, J.-P.; Sadowski, A.G.; Béline, F. A Waste Characterisation Procedure for ADM1 Implementation Based on Degradation Kinetics. Water Res. 2012, 46, 4099–4110. [Google Scholar] [CrossRef]
  10. Rosen, C.; Jeppsson, U. Aspects on ADM1 Implementation within the BSM2 Framework; Department of Industrial Electrical Engineering and Automation, Lund Institute of Technology: Lund, Sweden, 2005. [Google Scholar]
  11. Li, P.; Pei, Z.; Liu, D.; Shi, F.; Wang, S.; Li, W.; Sun, Y.; Liu, J.; Gao, Y.; Yu, Q. Application of Anaerobic Digestion Model No. 1 for Modeling Anaerobic Digestion of Vegetable Crop Residues: Fractionation of Crystalline Cellulose. J. Clean. Prod. 2021, 285, 124865. [Google Scholar] [CrossRef]
  12. Razaviarani, V.; Buchanan, I.D. Calibration of the Anaerobic Digestion Model No. 1 (ADM1) for Steady-State Anaerobic Co-Digestion of Municipal Wastewater Sludge with Restaurant Grease Trap Waste. Chem. Eng. J. 2015, 266, 91–99. [Google Scholar] [CrossRef]
  13. Baquerizo, G.; Fiat, J.; Buffiere, P.; Girault, R.; Gillot, S. Modelling the Dynamic Long-Term Performance of a Full-Scale Digester Treating Sludge from an Urban WRRF Using an Extended Version of ADM1. Chem. Eng. J. 2021, 423, 128870. [Google Scholar] [CrossRef]
  14. Girault, R.; Rousseau, P.; Steyer, J.P.; Bernet, N.; Béline, F. Combination of Batch Experiments with Continuous Reactor Data for ADM1 Calibration: Application to Anaerobic Digestion of Pig Slurry. Water Sci. Technol. 2011, 63, 2575–2582. [Google Scholar] [CrossRef] [PubMed]
  15. Batstone, D.J.; Tait, S.; Starrenburg, D. Estimation of Hydrolysis Parameters in Full-Scale Anerobic Digesters. Biotechnol. Bioeng. 2009, 102, 1513–1520. [Google Scholar] [CrossRef]
  16. Xie, S.; Hai, F.I.; Zhan, X.; Guo, W.; Ngo, H.H.; Price, W.E.; Nghiem, L.D. Anaerobic Co-Digestion: A Critical Review of Mathematical Modelling for Performance Optimization. Bioresour. Technol. 2016, 222, 498–512. [Google Scholar] [CrossRef]
  17. Souza, T.S.O.; Carvajal, A.; Donoso-Bravo, A.; Peña, M.; Fdz-Polanco, F. ADM1 Calibration Using BMP Tests for Modeling the Effect of Autohydrolysis Pretreatment on the Performance of Continuous Sludge Digesters. Water Res. 2013, 47, 3244–3254. [Google Scholar] [CrossRef] [PubMed]
  18. Mottet, A.; Ramirez, I.; Carrère, H.; Déléris, S.; Vedrenne, F.; Jimenez, J.; Steyer, J.P. New Fractionation for a Better Bioaccessibility Description of Particulate Organic Matter in a Modified ADM1 Model. Chem. Eng. J. 2013, 228, 871–881. [Google Scholar] [CrossRef]
  19. Arnell, M.; Astals, S.; Åmand, L.; Batstone, D.J.; Jensen, P.D.; Jeppsson, U. Modelling Anaerobic Co-Digestion in Benchmark Simulation Model No. 2: Parameter Estimation, Substrate Characterisation and Plant-Wide Integration. Water Res. 2016, 98, 138–146. [Google Scholar] [CrossRef] [Green Version]
  20. Poggio, D.; Walker, M.; Nimmo, W.; Ma, L.; Pourkashanian, M. Modelling the Anaerobic Digestion of Solid Organic Waste—Substrate Characterisation Method for ADM1 Using a Combined Biochemical and Kinetic Parameter Estimation Approach. Waste Manag. 2016, 53, 40–54. [Google Scholar] [CrossRef] [PubMed] [Green Version]
  21. García-Gen, S.; Sousbie, P.; Rangaraj, G.; Lema, J.M.; Rodríguez, J.; Steyer, J.-P.; Torrijos, M. Kinetic Modelling of Anaerobic Hydrolysis of Solid Wastes, Including Disintegration Processes. Waste Manag. 2015, 35, 96–104. [Google Scholar] [CrossRef] [PubMed]
  22. Lübken, M.; Kosse, P.; Koch, K.; Gehring, T.; Wichern, M. Influent Fractionation for Modeling Continuous Anaerobic Digestion Processes. In Biogas Science and Technology; Guebitz, G.M., Bauer, A., Bochmann, G., Gronauer, A., Weiss, S., Eds.; Advances in Biochemical Engineering/Biotechnology; Springer International Publishing: Cham, Switzerland, 2015; Volume 151, pp. 137–169. ISBN 978-3-319-21992-9. [Google Scholar]
  23. Kleerebezem, R.; Van Loosdrecht, M.C.M. Waste Characterization for Implementation in ADM1. Water Sci. Technol. 2006, 54, 167–174. [Google Scholar] [CrossRef]
  24. Astals, S.; Esteban-Gutiérrez, M.; Fernández-Arévalo, T.; Aymerich, E.; García-Heras, J.L.; Mata-Alvarez, J. Anaerobic Digestion of Seven Different Sewage Sludges: A Biodegradability and Modelling Study. Water Res. 2013, 47, 6033–6043. [Google Scholar] [CrossRef] [PubMed]
  25. Koch, K.; Lübken, M.; Gehring, T.; Wichern, M.; Horn, H. Biogas from Grass Silage—Measurements and Modeling with ADM1. Bioresour. Technol. 2010, 101, 8158–8165. [Google Scholar] [CrossRef]
  26. Wichern, M.; Gehring, T.; Fischer, K.; Andrade, D.; Lübken, M.; Koch, K.; Gronauer, A.; Horn, H. Monofermentation of Grass Silage under Mesophilic Conditions: Measurements and Mathematical Modeling with ADM 1. Bioresour. Technol. 2009, 100, 1675–1681. [Google Scholar] [CrossRef]
  27. Zaher, U.; Grau, P.; Benedetti, L.; Ayesa, E.; Vanrolleghem, P. Transformers for Interfacing Anaerobic Digestion Models to Pre- and Post-Treatment Processes in a Plant-Wide Modelling Context. Environ. Model. Softw. 2007, 22, 40–58. [Google Scholar] [CrossRef]
  28. Zaher, U.; Buffiere, P.; Steyer, J.-P.; Chen, S. A Procedure to Estimate Proximate Analysis of Mixed Organic Wastes. Water Environ. Res. 2009, 81, 407–415. [Google Scholar] [CrossRef] [PubMed]
  29. Standard Methods for the Examination of Water and Wastewater, 23th ed.; American Public Health Association (APHA): Washington, DC, USA, 2017.
  30. Jimenez, J.; Vedrenne, F.; Denis, C.; Mottet, A.; Déléris, S.; Steyer, J.-P.; Cacho Rivero, J.A. A Statistical Comparison of Protein and Carbohydrate Characterisation Methodology Applied on Sewage Sludge Samples. Water Res. 2013, 47, 1751–1762. [Google Scholar] [CrossRef] [PubMed]
  31. Hassam, S.; Ficara, E.; Leva, A.; Harmand, J. A Generic and Systematic Procedure to Derive a Simplified Model from the Anaerobic Digestion Model No. 1 (ADM1). Biochem. Eng. J. 2015, 99, 193–203. [Google Scholar] [CrossRef]
  32. VDI 4630.Pdf. Available online: https://infostore.saiglobal.com/en-us/Standards/VDI-4630-2016-1115305_SAIG_VDI_VDI_2590568/ (accessed on 29 October 2021).
  33. Siegrist, H.; Vogt, D.; Garcia-Heras, J.L.; Gujer, W. Mathematical Model for Meso- and Thermophilic Anaerobic Sewage Sludge Digestion. Environ. Sci. Technol. 2002, 36, 1113–1123. [Google Scholar] [CrossRef]
  34. Decostere, B.; De Craene, J.; Van Hoey, S.; Vervaeren, H.; Nopens, I.; Van Hulle, S.W.H. Validation of a Microalgal Growth Model Accounting with Inorganic Carbon and Nutrient Kinetics for Wastewater Treatment. Chem. Eng. J. 2016, 285, 189–197. [Google Scholar] [CrossRef]
  35. Hauduc, H.; Neumann, M.B.; Muschalla, D.; Gamerith, V.; Gillot, S.; Vanrolleghem, P.A. Efficiency Criteria for Environmental Model Quality Assessment: A Review and Its Application to Wastewater Treatment. Environ. Model. Softw. 2015, 68, 196–204. [Google Scholar] [CrossRef]
  36. Ras, M.; Girbal-Neuhauser, E.; Paul, E.; Spérandio, M.; Lefebvre, D. Protein Extraction from Activated Sludge: An Analytical Approach. Water Res. 2008, 42, 1867–1878. [Google Scholar] [CrossRef] [PubMed]
  37. Raunkjær, K.; Hvitved-Jacobsen, T.; Nielsen, P.H. Measurement of Pools of Protein, Carbohydrate and Lipid in Domestic Wastewater. Water Res. 1994, 28, 251–262. [Google Scholar] [CrossRef]
  38. Sosulski, F.W.; Imafidon, G.I. Amino Acid Composition and Nitrogen-to-Protein Conversion Factors for Animal and Plant Foods. J. Agric. Food Chem. 1990, 38, 1351–1356. [Google Scholar] [CrossRef]
  39. Huang, M.; Li, Y.; Gu, G. Chemical Composition of Organic Matters in Domestic Wastewater. Desalination 2010, 262, 36–42. [Google Scholar] [CrossRef]
  40. Zaher, U.; Li, R.; Jeppsson, U.; Steyer, J.-P.; Chen, S. GISCOD: General Integrated Solid Waste Co-Digestion Model. Water Res. 2009, 43, 2717–2727. [Google Scholar] [CrossRef]
  41. Jimenez, J.; Charnier, C.; Kouas, M.; Latrille, E.; Torrijos, M.; Harmand, J.; Patureau, D.; Spérandio, M.; Morgenroth, E.; Béline, F.; et al. Modelling Hydrolysis: Simultaneous versus Sequential Biodegradation of the Hydrolysable Fractions. Waste Manag. 2020, 101, 150–160. [Google Scholar] [CrossRef]
  42. Shi, E.; Li, J.; Zhang, M. Application of IWA Anaerobic Digestion Model No. 1 to Simulate Butyric Acid, Propionic Acid, Mixed Acid, and Ethanol Type Fermentative Systems Using a Variable Acidogenic Stoichiometric Approach. Water Res. 2019, 161, 242–250. [Google Scholar] [CrossRef]
Figure 1. Scheme of substrates fractionation used to determine input state variables.
Water 13 03100 g001
Figure 2. Outline of the iterative procedure used for model calibration, exploiting experimental data (white boxes) from the pilot plant and batch tests.
Water 13 03100 g002
Figure 3. Boxplots of biochemical fractionation for (a) waste sludge (n = 9), (b) yogurt (n = 3), and (c) digestate (n = 9): the black mark is the mean, the red line is the median, and the edges of the box are the 25th and 75th percentiles. The whiskers extend to the most extreme datapoints not to be considered as outliers.
Water 13 03100 g003
Figure 4. Experimental vs. simulated cumulated CH4 volume in batch activity tests using (a) acetate (Phase I), (b) glucose (Phase I), and (c) BSA (Phase I). The y-axis shows the gross volume of methane produced (NmLCH4).
Water 13 03100 g004
Figure 5. Experimental vs. simulated cumulated CH4 volume in BMP tests on (a) sludge—Phase I, (b) yogurt—Phase I, and (c) co-digestion—Phase I, (d) sludge—Phase II, (e) yogurt—Phase II, and (f) co-digestion—Phase II. The y-axis shows the gross volume of methane produced (NmLCH4).
Water 13 03100 g005
Figure 6. Experimental vs. simulated data of the pilot-scale digester: (a) methane rate; (b) effluent alkalinity; (c) effluent total volatile fatty acids; (d) effluent pH; (e) effluent ammoniacal nitrogen; (f) effluent volatile solids; and (g) effluent COD. The yellow box identifies the period when AcoD was operated. The fictitious iteration is only shown for pH and alkalinity.
Water 13 03100 g006
Table 1. Kinetic parameters estimated at first and last iterative step of the calibration process.
IterationParameter (Unit)
kdis
(d−1)
khyd,ch
(d−1)
khyd,pr
(d−1)
khyd,li
(d−1)
km,su
(d−1)
km,aa
(d−1)
km,ac
(d−1)
KS,su
(kgCOD∙m−3)
KS,aa
(kgCOD∙m−3)
KS,ac
(kgCOD∙m−3)
KS,pro
(kgCOD∙m−3)
1st1.20.750.60.3305080.50.30.150.3
5th (6th)1.50.30.2 (0.5)0.58880.30.20.010.2
Publisher’s Note: MDPI stays neutral with regard to jurisdictional claims in published maps and institutional affiliations.

