Article

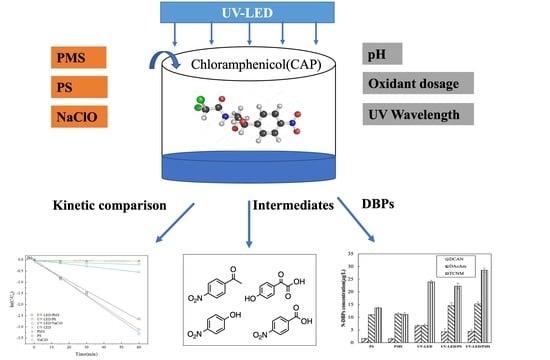
Degradation of Chloramphenicol Using UV-LED Based Advanced Oxidation Processes: Kinetics, Mechanisms, and Enhanced Formation of Disinfection By-Products

1
State Key Laboratory of Pollution Control and Resource Reuse, College of Environmental Science & Engineering, Tongji University, Shanghai 200092, China
2
Shanghai Institute of Pollution Control and Ecological Security, Shanghai 200092, China
3
Wuxi Public Utilities Environment Testing Research Institute Co., Ltd., Wuxi 214063, China
*
Author to whom correspondence should be addressed.
Water 2021, 13(21), 3035; https://doi.org/10.3390/w13213035
Submission received: 30 September 2021 / Revised: 24 October 2021 / Accepted: 26 October 2021 / Published: 29 October 2021

Abstract

:
As an emerging light source, ultraviolet light emitting diodes (UV-LEDs) are adopted to overcome the shortcomings of the conventional mercury lamp, such as mercury pollution. The degradation of chloramphenicol (CAP) using three UV-LED-based advanced oxidation processes (AOPs)—UV-LED/persulfate (UV-LED/PS), UV-LED/peroxymonosulfate (UV-LED/PMS) and UV-LED/chlorine—was investigated. Results indicate that CAP can be more effectively degraded by the hybrid processes when compared to UV irradiation and oxidants alone. Degradation of CAP using the three UV-LED-based AOPs followed pseudo-first-order kinetics. The degradation rate constants (kobs) for UV-LED/PS, UV-LED/PMS, and UV-LED/chlorine were 0.0522, 0.0437 and 0.0523 min−1, and the CAP removal rates 99%, 98.1% and 96.3%, respectively. The degradation rate constant (kobs) increased with increasing oxidant dosage for UV-LED/chlorine, whereas overdosing reduced CAP degradation using UV-LED/PS and UV-LED/PMS. Ultraviolet wavelength influenced degradation efficiency of the UV-LED based AOPs with maximum CAP degradation observed at a wavelength of 280 nm. The application of UV-LED enhanced the formation DBPs during subsequent chlorination. uUV-LED/PMS produced more disinfection by-products than UV-LED/PS. Compared to UV-LED, UV-LED/PS reduced the formation of dichloroacetonitrile and trichloronitromethane during chlorination owing to its capacity to degrade the nitro group in CAP. The intermediates dichloroacetamide, 4-nitrobenzoic acid, 4-nitrophenol were produced during the degradation of CAP using each of UV-LED, UV-LED/PS and UV-LED/chlorine. The present study provides further evidence supporting the application of UV-LED in AOPs.

Graphical Abstract

1. Introduction

Antibiotics are a new environmental contaminant that have garnered a lot of attention recently [1]. Due to biological accumulation and transformation potential in the environment, antibiotics pose a significant risk to human health [2]. The presence of antibiotics in the aquatic environment negatively impacts the growth and reproduction of organisms [3]. Trace concentrations of antibiotics in water are typically difficult to remove using conventional water treatment methods [4]. As a result, the development of techniques that effectively remove antibiotics during drinking water treatment is a top priority. Among all antibiotics, chloramphenicol (CAP) is the most widely detected in water [5,6,7]. Evidence suggests that ingestion of CAP may result in negative human health impacts such as aplastic anemia and bone marrow suppression [8]. Due to its high environmental occurrence and associated health risks, CAP was selected as the target pollutant in the present study.
UV-advanced oxidation processes (AOPs) are an effective approach for the degradation of antibiotics and are increasingly used to remove organic pollutants [9,10]. By producing highly reactive radical intermediates such as ·OH and SO4· [11], UV-AOPs are able to achieve complete oxidation or mineralization of organic contaminants near ambient temperature and pressure. Furthermore, research indicates that AOPs can transform the structure of organic contaminants and impact disinfection by-product (DBP) formation potential during subsequent chlorination [12]. Several studies suggest that treatment using advanced oxidation processes may enhance DBP formation potential [13,14,15]. The potential formation of DBPs during subsequent chlorination is a major concern for the development and application of AOPs moving forward. The light sources used for UV-AOPs are typically mercury vapor lamps which have a number of shortcomings in engineering applications. For example, the use and disposal of mercury lamps may result in the release of mercury to the environment, posing both human and environmental health risks. In addition, mercury lamps have a short service life and require a larger footprint due to their comparatively large size. The numerous drawbacks related to conventional mercury lamps have led researchers to seek alternative light sources for AOPs.
UV light-emitting diodes (UV-LEDs) provide a variety of advantages, including being mercury free as well as having high energy efficiency, compact size (no specialized circuit), rapid start-up time, and long service life [16,17]. Since 2014, UV-LEDs have received extensive application for degrading organic pollutants in aqueous media by means of photo-induced AOPs, including TiO2-based photocatalysis, UV/PS/PMS, photo-Fenton, photo-Fenton-like processes and UV/H2O2 processes [18,19,20]. And UV-LED-AOPs is proven to have a high efficiency for degradation of various organic pollutants, such as cyanotoxins [19,21], dyes [20,22], insecticide [23,24], antibiotic [25,26,27], estrogens [18]. However, the application of UV-LED equipment with different oxidants may result in different degradation behaviors. The degradation efficiency of UV-LED with different oxidants has not been analyzed and compared. And the impact of the UV-LED-AOPs on the disinfection by-products (DBPs) formation during the subsequent chlorination process requires further research.
As part of this development, investigating the degradation characteristics and mechanisms of typical organic contaminants during treatment with UV-LED based AOPs is essential. The present study aims to further validate the technical feasibility of applying UV-LED based AOPs by analyzing the degradation of CAP using UV-LED as a light source combined with the common oxidants persulfate, peroxymonosulfate and sodium hypochlorite.
The objectives of this study were: (1) to determine the degradation efficiency of CAP and degradation rate constants during treatment using UV-LED, UV-LED/PS, UV-LED/PMS, and UV-LED/chlorine; (2) to assess the effect of oxidant dosage, pH, and UV wavelength on CAP degradation; (3) to assess the impacts of UV-LED based AOPs on DBP formation during subsequent chlorination; and (4) to identify intermediate degradation products and propose possible pathways during treatment using UV-LED, UV-LED/PS, UV-LED/chlorine.

2. Materials and Methods

2.1. Chemicals and Materials

Chloramphenicol (CAP, >99.9%) was obtained from Aladdin Reagent (Shanghai) Co., Ltd. (Shanghai, China). Methanol (HPLC grade) and acetonitrile (HPLC grade) were obtained from Sigma-Aldrich (St. Louis, MO, USA). Hydrogen peroxide (H2O2, 30% w/w aqueous solution) and sodium hypochlorite solution (NaClO, available chlorine ≥ 5%) were obtained from Sinopharm Chemical Reagent Co., Ltd. (Shanghai, China). Trichloromethane (TCM), dichloroacetonitrile (DCAN), dichloroacetamide (DCAcAm), trichloronitromethane (TCNM) chemical standards, monopotassium phosphate (KH2PO4, ≥99%), potassium iodate (KIO3), and potassium iodide (KI) were also purchased from Sigma-Aldrich. All chemical reagents used for solutions (NaOH, H2SO4, NaHSO5, Na2S2O8, NaHCO3, and ascorbic acid) were of reagent grade and were supplied by Sinopharm Chemical Reagent Co., Ltd. All solutions were prepared with water from a Milli-Q system (Millipore, Billerica, MA, USA).

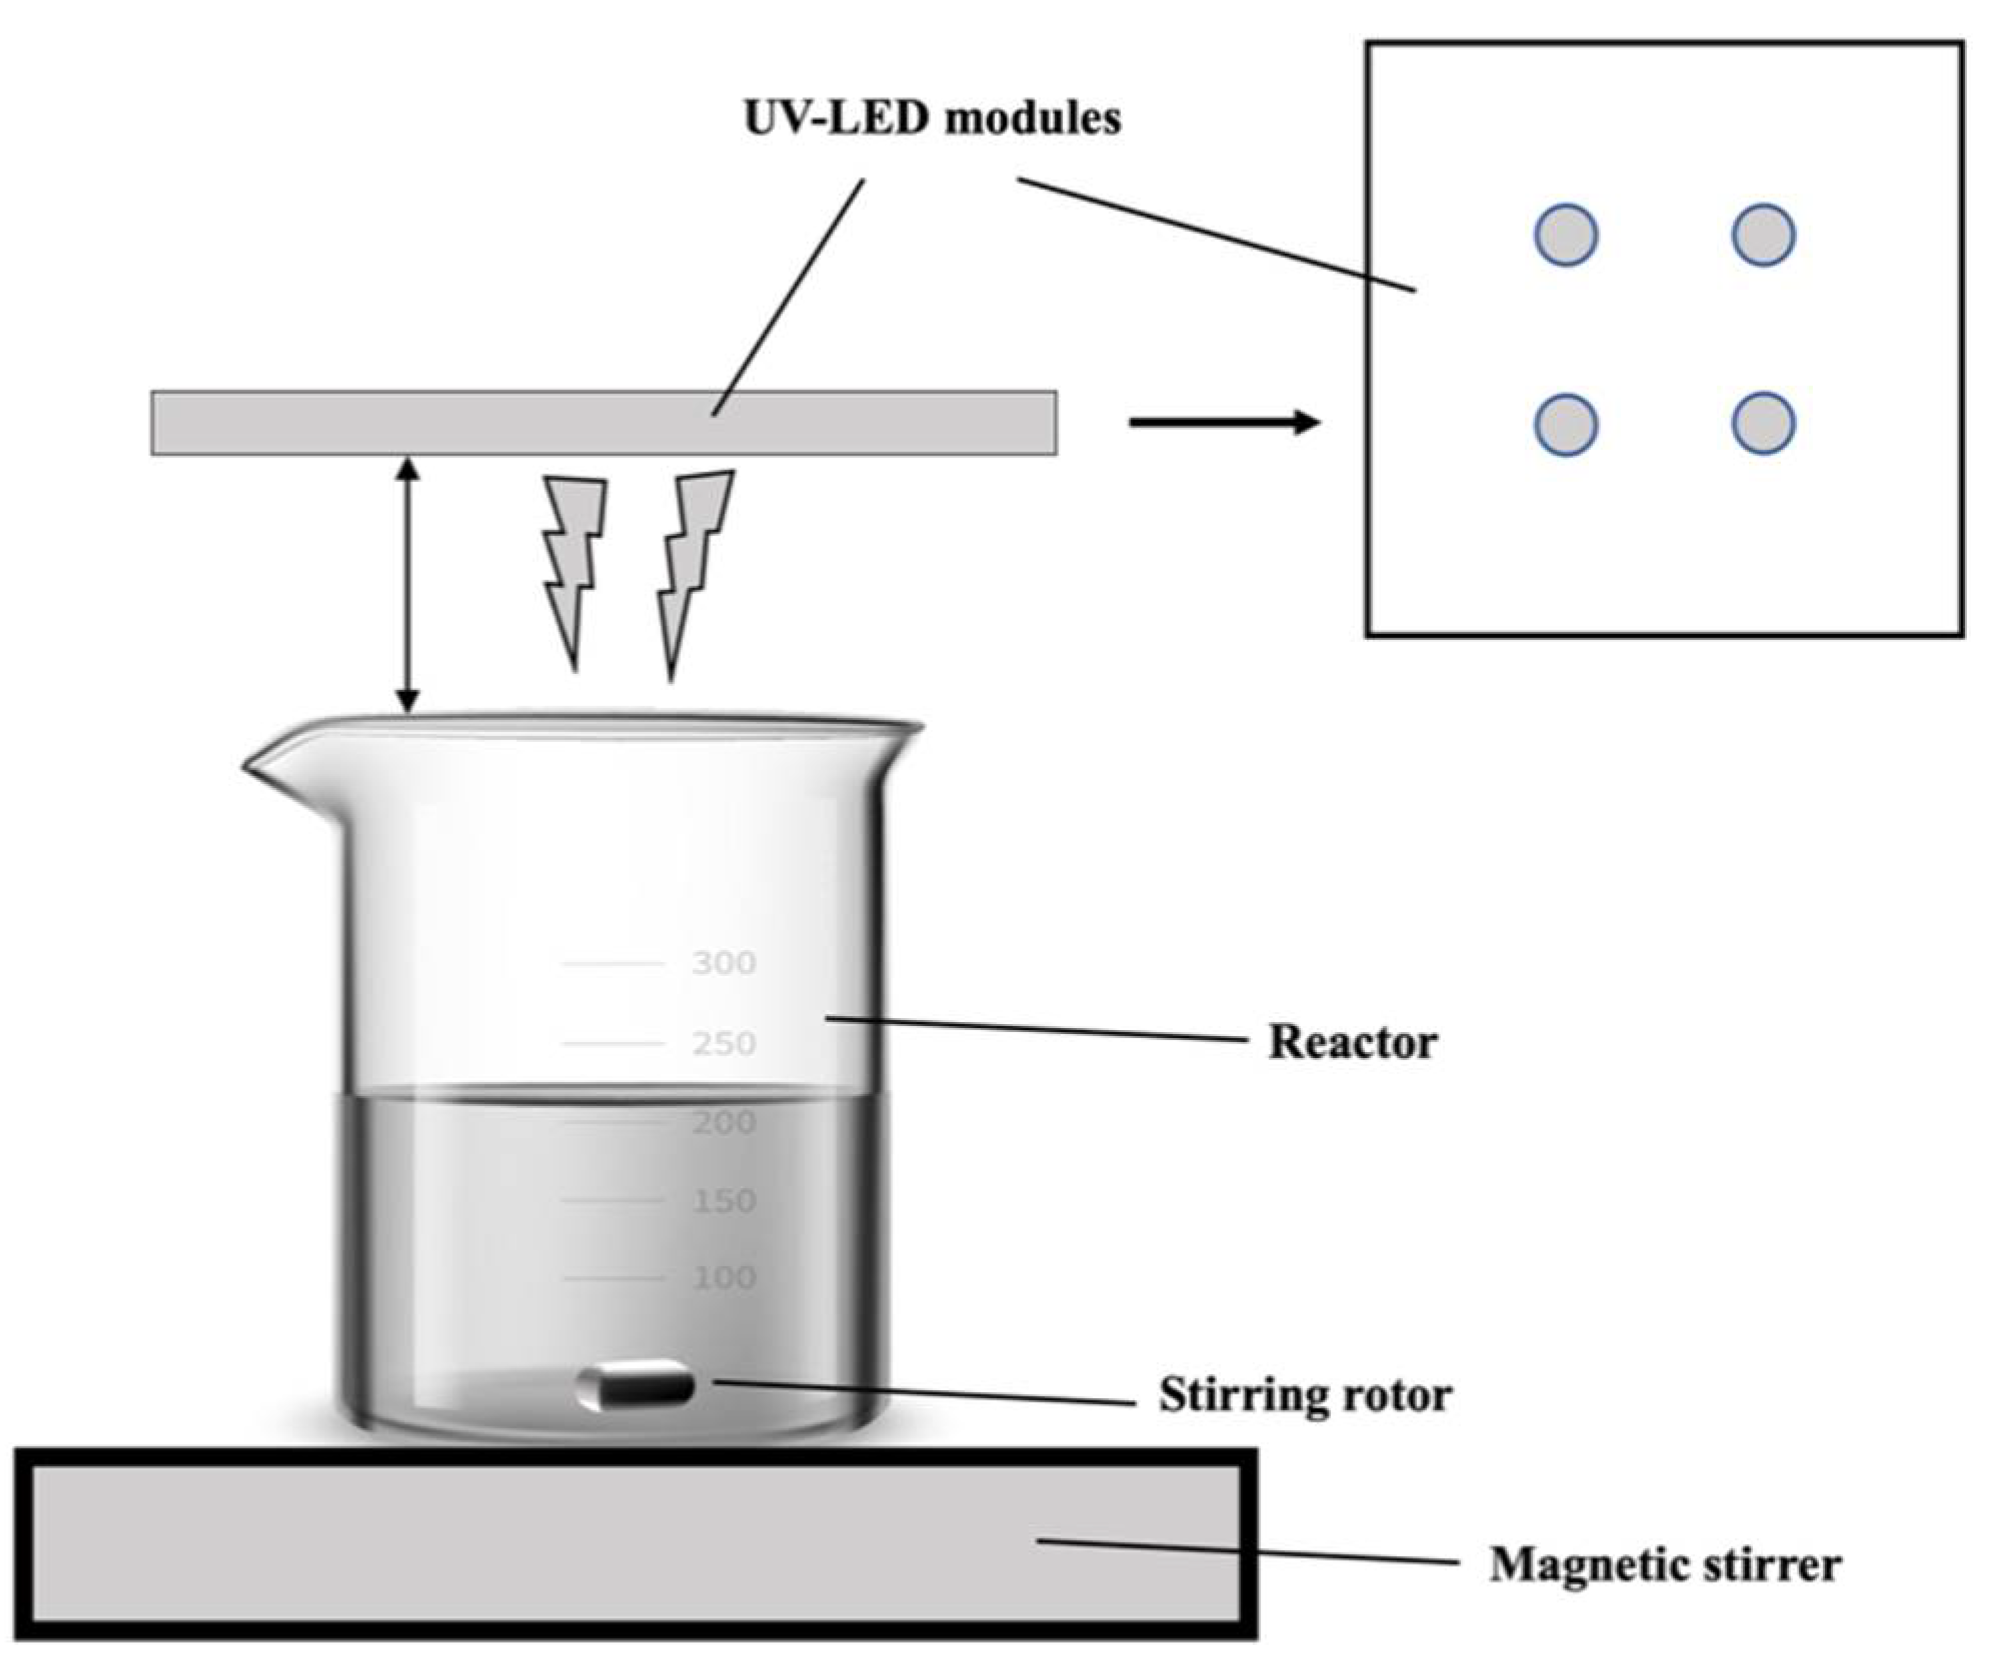
2.2. Experimental Process

LED (270, 280, 365 nm) light sources were purchased from Crystal IS Inc. (Green Island, NY, USA). The UV-LED photochemical reactor equipped with UV-LED is shown in Figure 1.
An iodide/iodate actinometer (Beijing Shida Photoelectric Technology Co., Ltd., Beijing, China) was used to measure the light intensity of LED 280 nm. Herein, four UV-LED lamp beads corresponding to a power output of 2.40 mW/cm2 were used. A beaker contained the reaction solution was positioned on top of the magnetic stirrer. The experiment was carried out at room temperature.
During each trial using UV-LED-AOPs, 100 mL of solution containing CAP (concentration = 5 mg/L was added to the reactor followed by a predetermined dose of oxidant (NaS2O8, NaHSO5, NaClO). After adding the oxidant, the solution was stirred for 2 min using a magnetic stirrer. Following 2 min of stirring, the UV-LED lamp was switched on to begin the reaction. Solution pH was adjusted to the desired value. A series of 2 mL of samples were obtained at every 2 min.
Chlorination experiments were carried out in 40 mL amber glass bottles with Teflon-faced septa at 24 ± 0.5 °C in darkness for 24 h in a headspace-free environment. Hydrochloric acid or sodium hydroxide was used to adjust the pH of the samples to 7.0 ± 0.2, and all samples were buffered with a 10 mM phosphate at pH 7. Chlorination tests were carried out by adding a chlorine dose of 0.50 mM to each sample. A portable photometer (Hach Pocket ColorimeterTM II, Loveland, CO, USA) was used to quantify the amount of residual free chlorine in the samples, which was subsequently quenched with excess ascorbic acid.

2.3. Analysis

CAP concentrations were measured using high-performance liquid chromatography (HPLC) (LC-2030, Shimadzu, Kyoto, Japan) equipped with a VP-ODS C18 reverse-phase chromatography column (250 mm × 4.6 mm, 5 μm, Shimadzu). The mobile phase consisted of methanol and water (55:45) at a flow rate of 1.0 mL/min. The injection volume was set at 10 μL. The UV wavelength during the CAP measurements was set at 278 nm.
The identification of intermediates was performed using ultra-performance liquid chromatography combined with time-of-flight mass spectrometry (UPLC-TOF-MS) (AcquityTM UPLC & Q-TOF MS Premier, Waters, Milford, MA, USA). The column temperature was maintained at 45 °C. The mobile phase consisted of acetonitrile and water (v/v, 2:98) at an elution flow rate of 0.4 mL/min. The mass spectrometer was operated in a negative ionization mode using an electrospray ionization (ESI) source.
In the present study four types of DBPs were tested: trihalomethanes (THMs), haloacetonitriles (HANs), haloacetamides (HAcAms), and halonitromethanes (HNMs). Purge and trap (P&T) (Eclipse 4660, OI Analytical, College Station, TX, USA) and gas chromatography/mass spectrometry (GC/MS) (Shimadzu-QP2010) were used to evaluate TCM, DCAN, and TCNM concentrations according to USEPA Method 524.2. Liquid-liquid extraction (LLE) and GC/mass spectrometry (MS) were used to measure DCAcAm concentrations (Shimadzu-QP2010). All of the techniques had detection limits of 0.1 μg/L. Further details regarding the analytical methods for measurement of these four DBPs were provided in a previous study [28].

3. Results

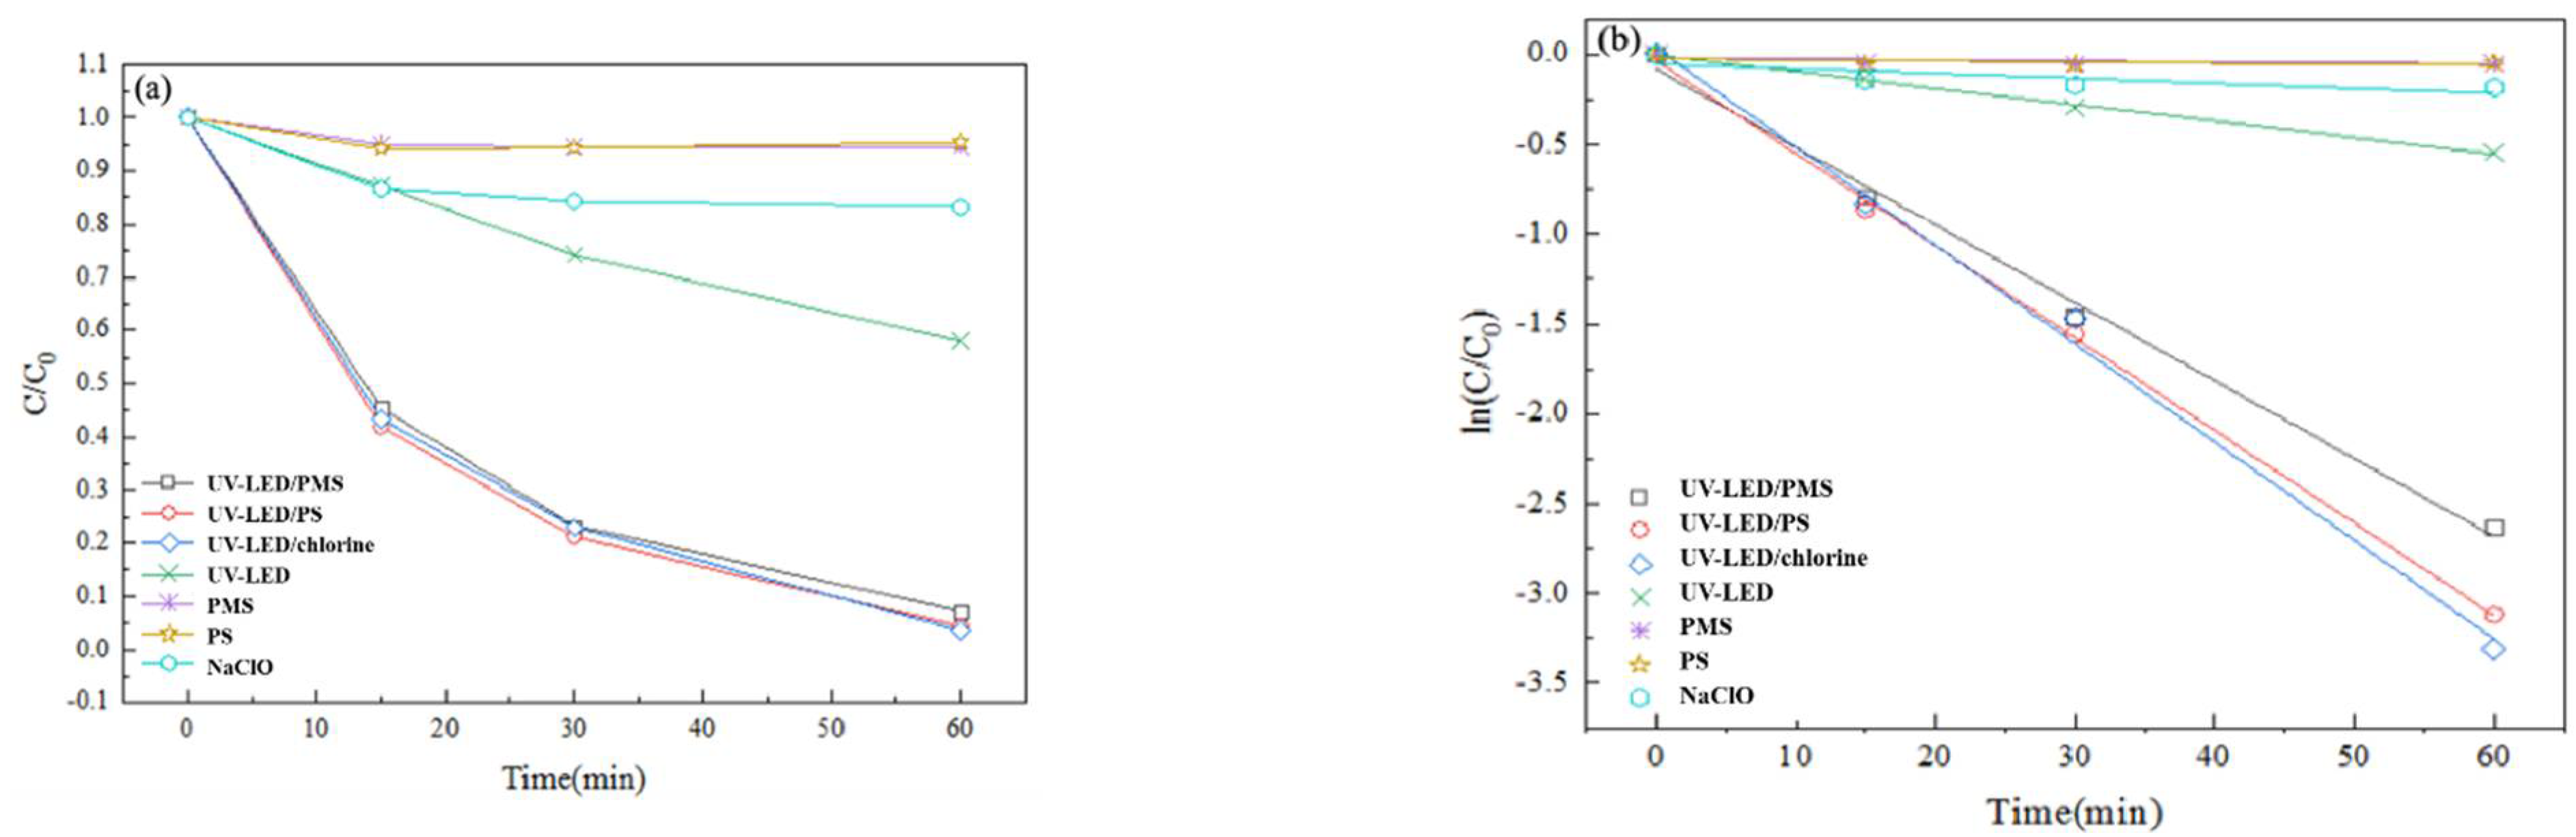
3.1. Degradation of CAP under Different Processes
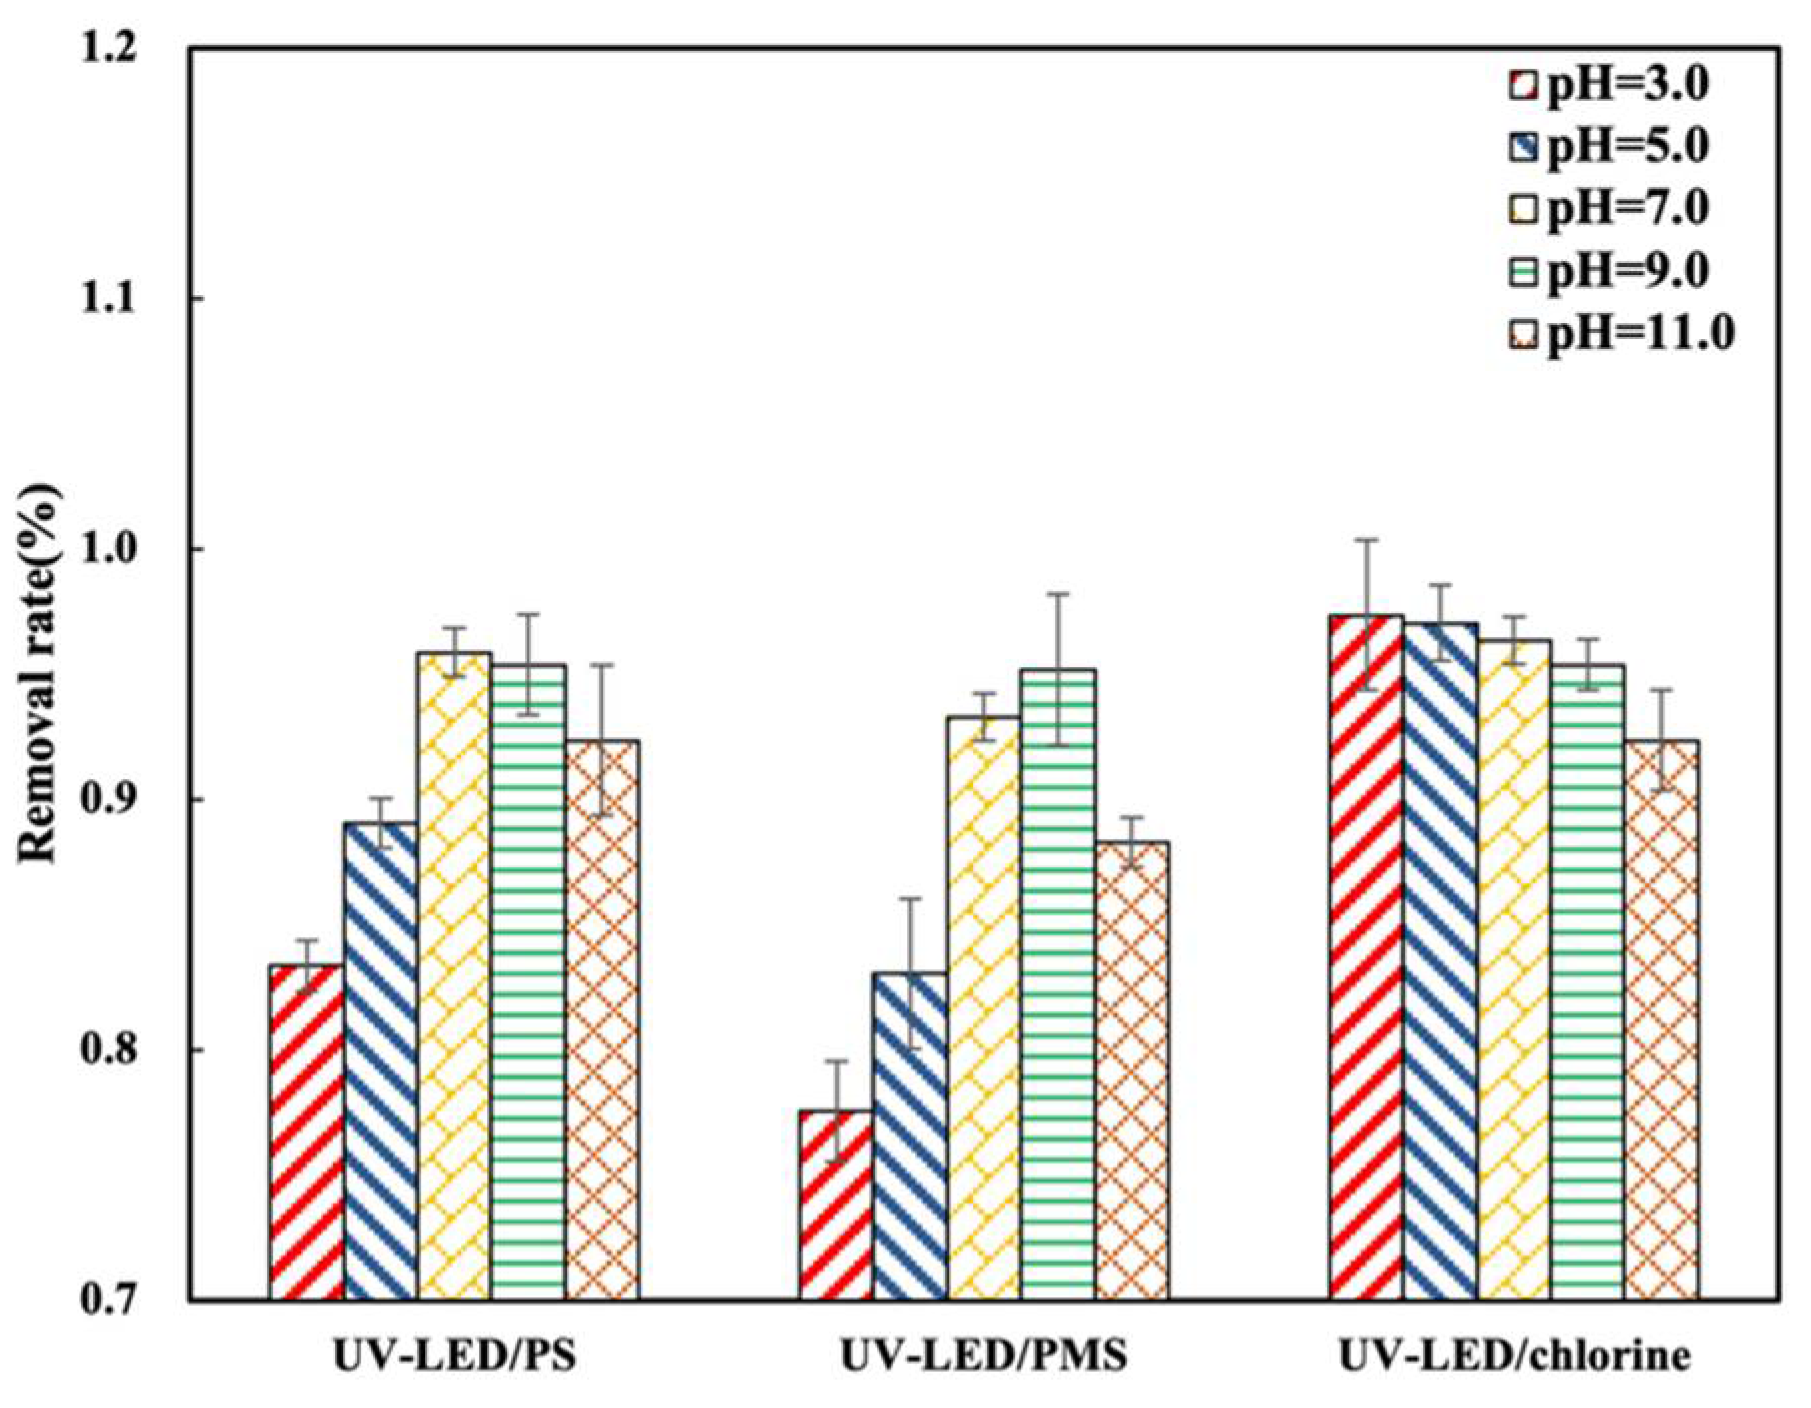
Results for the CAP degradation performance of the UV-LED based AOPs are presented in Figure 2.
A significant difference in degradation performance was observed between trials applying oxidants only versus those using LED-UV based AOPs, which is consistent with a previous study conducted with mercury lamps [14]. Using PS, PMS, or NaClO alone, CAP was reduced by 4% after 60 min. Direct UV-LED irradiation resulted in moderate CAP degradation (40% in 60 min). Using UV-LED/PS, UV-LED/PMS, and UV-LED/chlorine CAP degradation was 100%, 98.1%, and 96.3% after 60 min (Figure 2a). When compared to trials using oxidants and UV-LED only, the improvement in CAP degradation performance could be attributed to the generation of reactive radicals such as ·OH, SO4· and reactive chlorine species (Cl·, Cl2·, ClO·) by the three UV-LED based AOPs [11,16]. Results indicate that CAP degradation by photolysis closely follows pseudo-first-order kinetics. Further, results suggest that the three UV-LED based AOPs are very effective for the degradation of CAP with degradation performance in the order UV-LED/chlorine > UV-LED/PS > UV-LED/PMS. In a previous study that considered the impact of oxidant type on the degradation of acetaminophen (AAP), it was reported that the degradation performance of three UV-LED based AOPs was in the order UV-LED/PS (88.5%) > UV-LED/H2O2 (53.4%) > UV-LED/NH2Cl (45.7%) [29]. Thus results from the present study as well as those reported previously suggest that UV-LED degradation performance differs with pollutant type.

3.2. Effect of pH

It has been suggested that pH value affects the type of radical species formed by UV-LED-based AOPs [29]. As such, the impact of pH value on CAP degradation using UV-LED/PS, UV-LED/PMS, and UV-LED/chlorine was investigated in Figure 3. The UV-LED/PS process achieved its greatest degradation performance (95.9%) at a pH of 7.0, while the UV-LED/PMS process performed best (95.2%) at a pH of 9.0. The results obtained in this study differ from those reported in a previous study conducted using an Hg lamp where the maximum degradation performance for UV/PS was 56% at a pH of 3.0 [30]. Considering UV-LED/chlorine, CAP degradation performance decreased from 97.3% to 92.3%. as pH increased from 3.0 to 11.0. A similar decrease in degradation performance with rise in pH has been reported for the UV/Cl process with Hg light source which indicates that UV-LED and Hg lamps may result in comparable degradation properties [31]. Although it has been suggested that degradation efficiency decreases under alkaline conditions in which SO4· is converted to ·OH [32], results from the present study indicate that the degradation performance of 280 nm UV-LED AOPs is highest under slightly alkaline conditions. Enhanced performance at slightly alkaline pH is owing to the reaction between OH and PS to form SO4·− being more predominant than the conversion reaction of SO4· as shown in Equations (1) and (2) [30]:
S2O82 2SO4·UV or base condition
SO4· + OH  SO42− + ·OH
Under the pH conditions considered, HClO and ClO present in the UV-LED/chlorine process will undergo mutual conversion. When the pH is below 7, the system contains mostly HClO, and when the pH is high, the system contains mostly ClO. Both HClO and ClO are also ·OH scavengers as shown in Equations (3) and (4):
OH+HOClH2O+OCl
OH+OCl−OCl+OH
With a rise in pH, the UV/chlorine process becomes less effective due to the reaction rate between ·OH and ClO being greater than that between ·OH and HOCl [31]. As a result, pH will influence the rate of degradation. The degradation performance of UV-LED/PS and UV-LED/PMS both changed with a rise in pH. Initially the degradation rate increased as pH increased, followed by a decrease as pH rose beyond a certain threshold Figure 3. When UV-LED/chlorine was applied the CAP degradation performance decreased as pH increased.

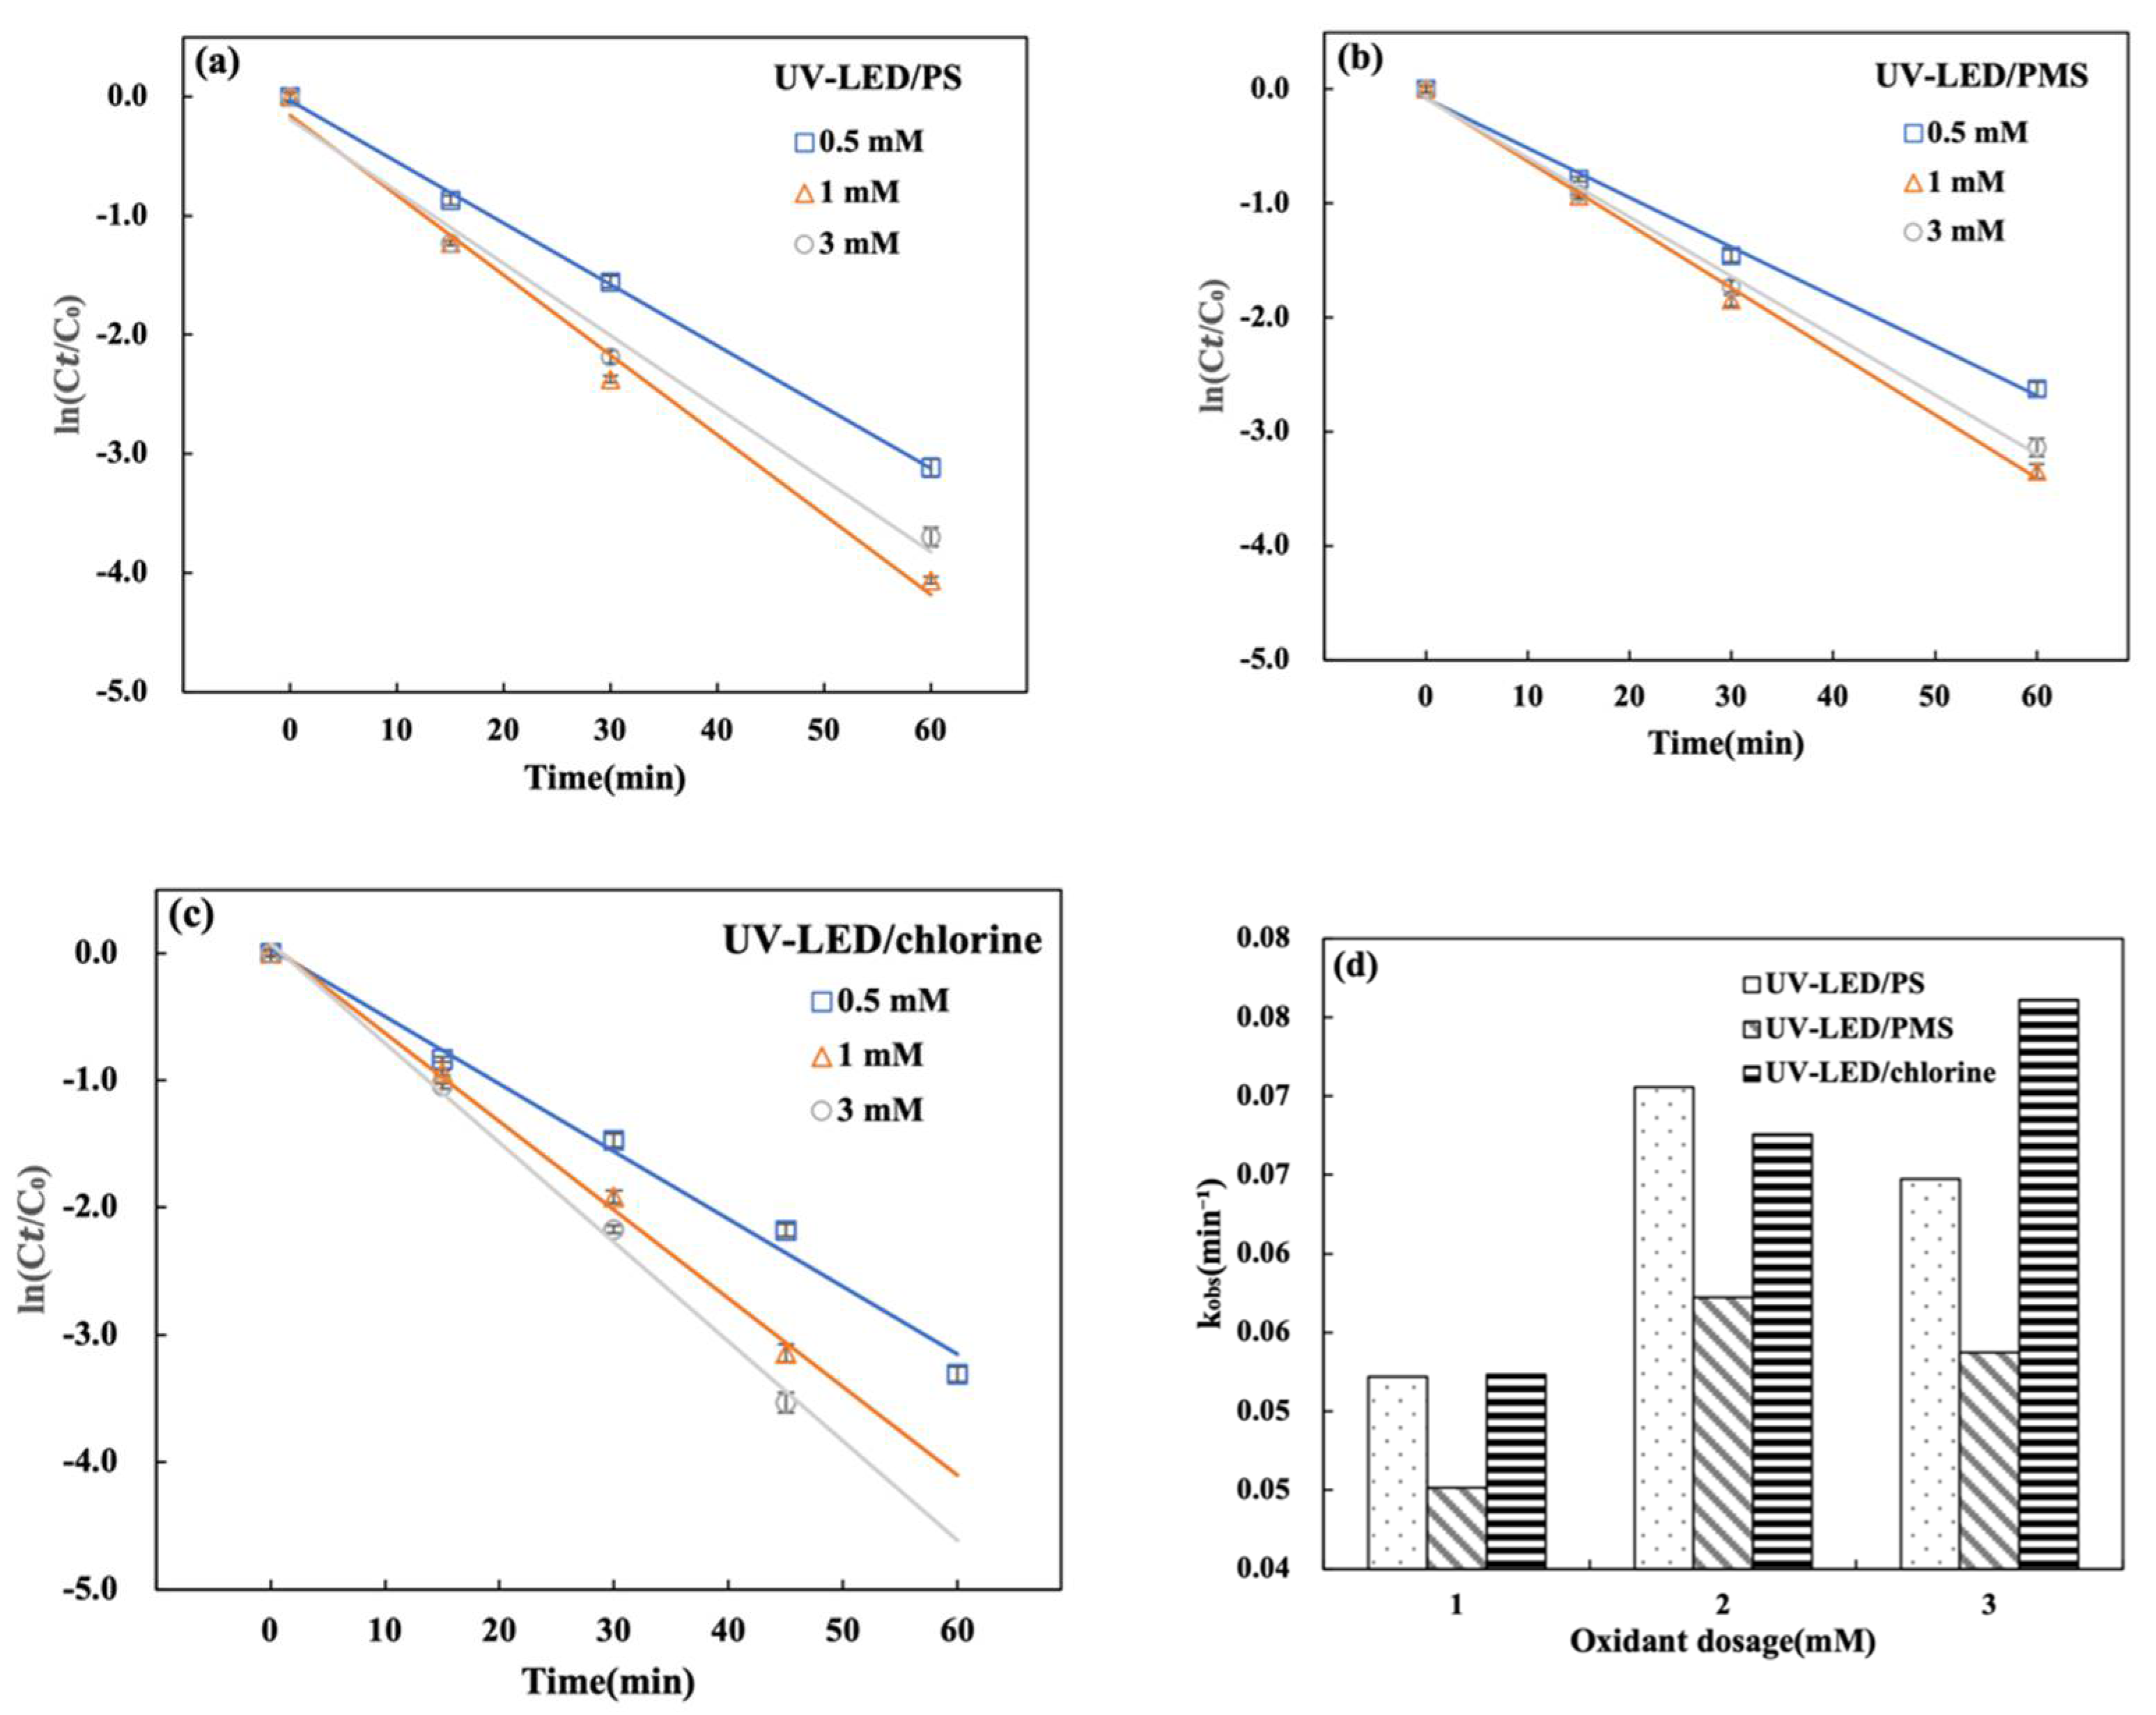
3.3. Effect of Oxidant Dosage

The CAP degradation using UV-LED/PS, UV-LED/PMS, and UV-LED/chlorine correlated well with pseudo-first-order kinetics in Figure 4a–c. When the oxidant dose was increased from 0.5 to 1.0 mM kobs for CAP degradation using UV-LED/PS and UV-LED/PMS increased from 0.0522 and 0.0451 min−1 to 0.0705 and 0.0572 min−1, respectively. This trend is due to an increase in the generation of reactive radicals (·OH, SO4·) as the oxidation dosage rises within a certain range. In contrast, when the oxidant dose was increased from 1.0 to 3.0 mM, kobs decreased to 0.0647 and 0.0537 min−1. Considering both PS and PMS, a high dosage of 3 mM imparts a negative effect on CAP degradation in the UV-LED AOPs. The phenomenon of degradation inhibition induced by PS overdosage has also been reported previously using an Hg light source [33]. At the same oxidant dose, UV-LED/PS provided more effective degradation of CAP when compared to UV-LED/PMS in Figure 4d. When the oxidant dosage was raised from 0.5 mM to 5.0 mM, the UV-LED/chlorine degradation rate increased from 88.7% to 97.2% and kobs increased from 0.0523 to 0.0761 min−1. As indicated by Equation (5), increasing the UV-LED/chlorine oxidant dosage accelerates the rate of degradation and promotes the production Cl· radical species [31]. As a result, the oxidant dosage influences degradation performance:
HOCl + hv →⋅OH + Cl

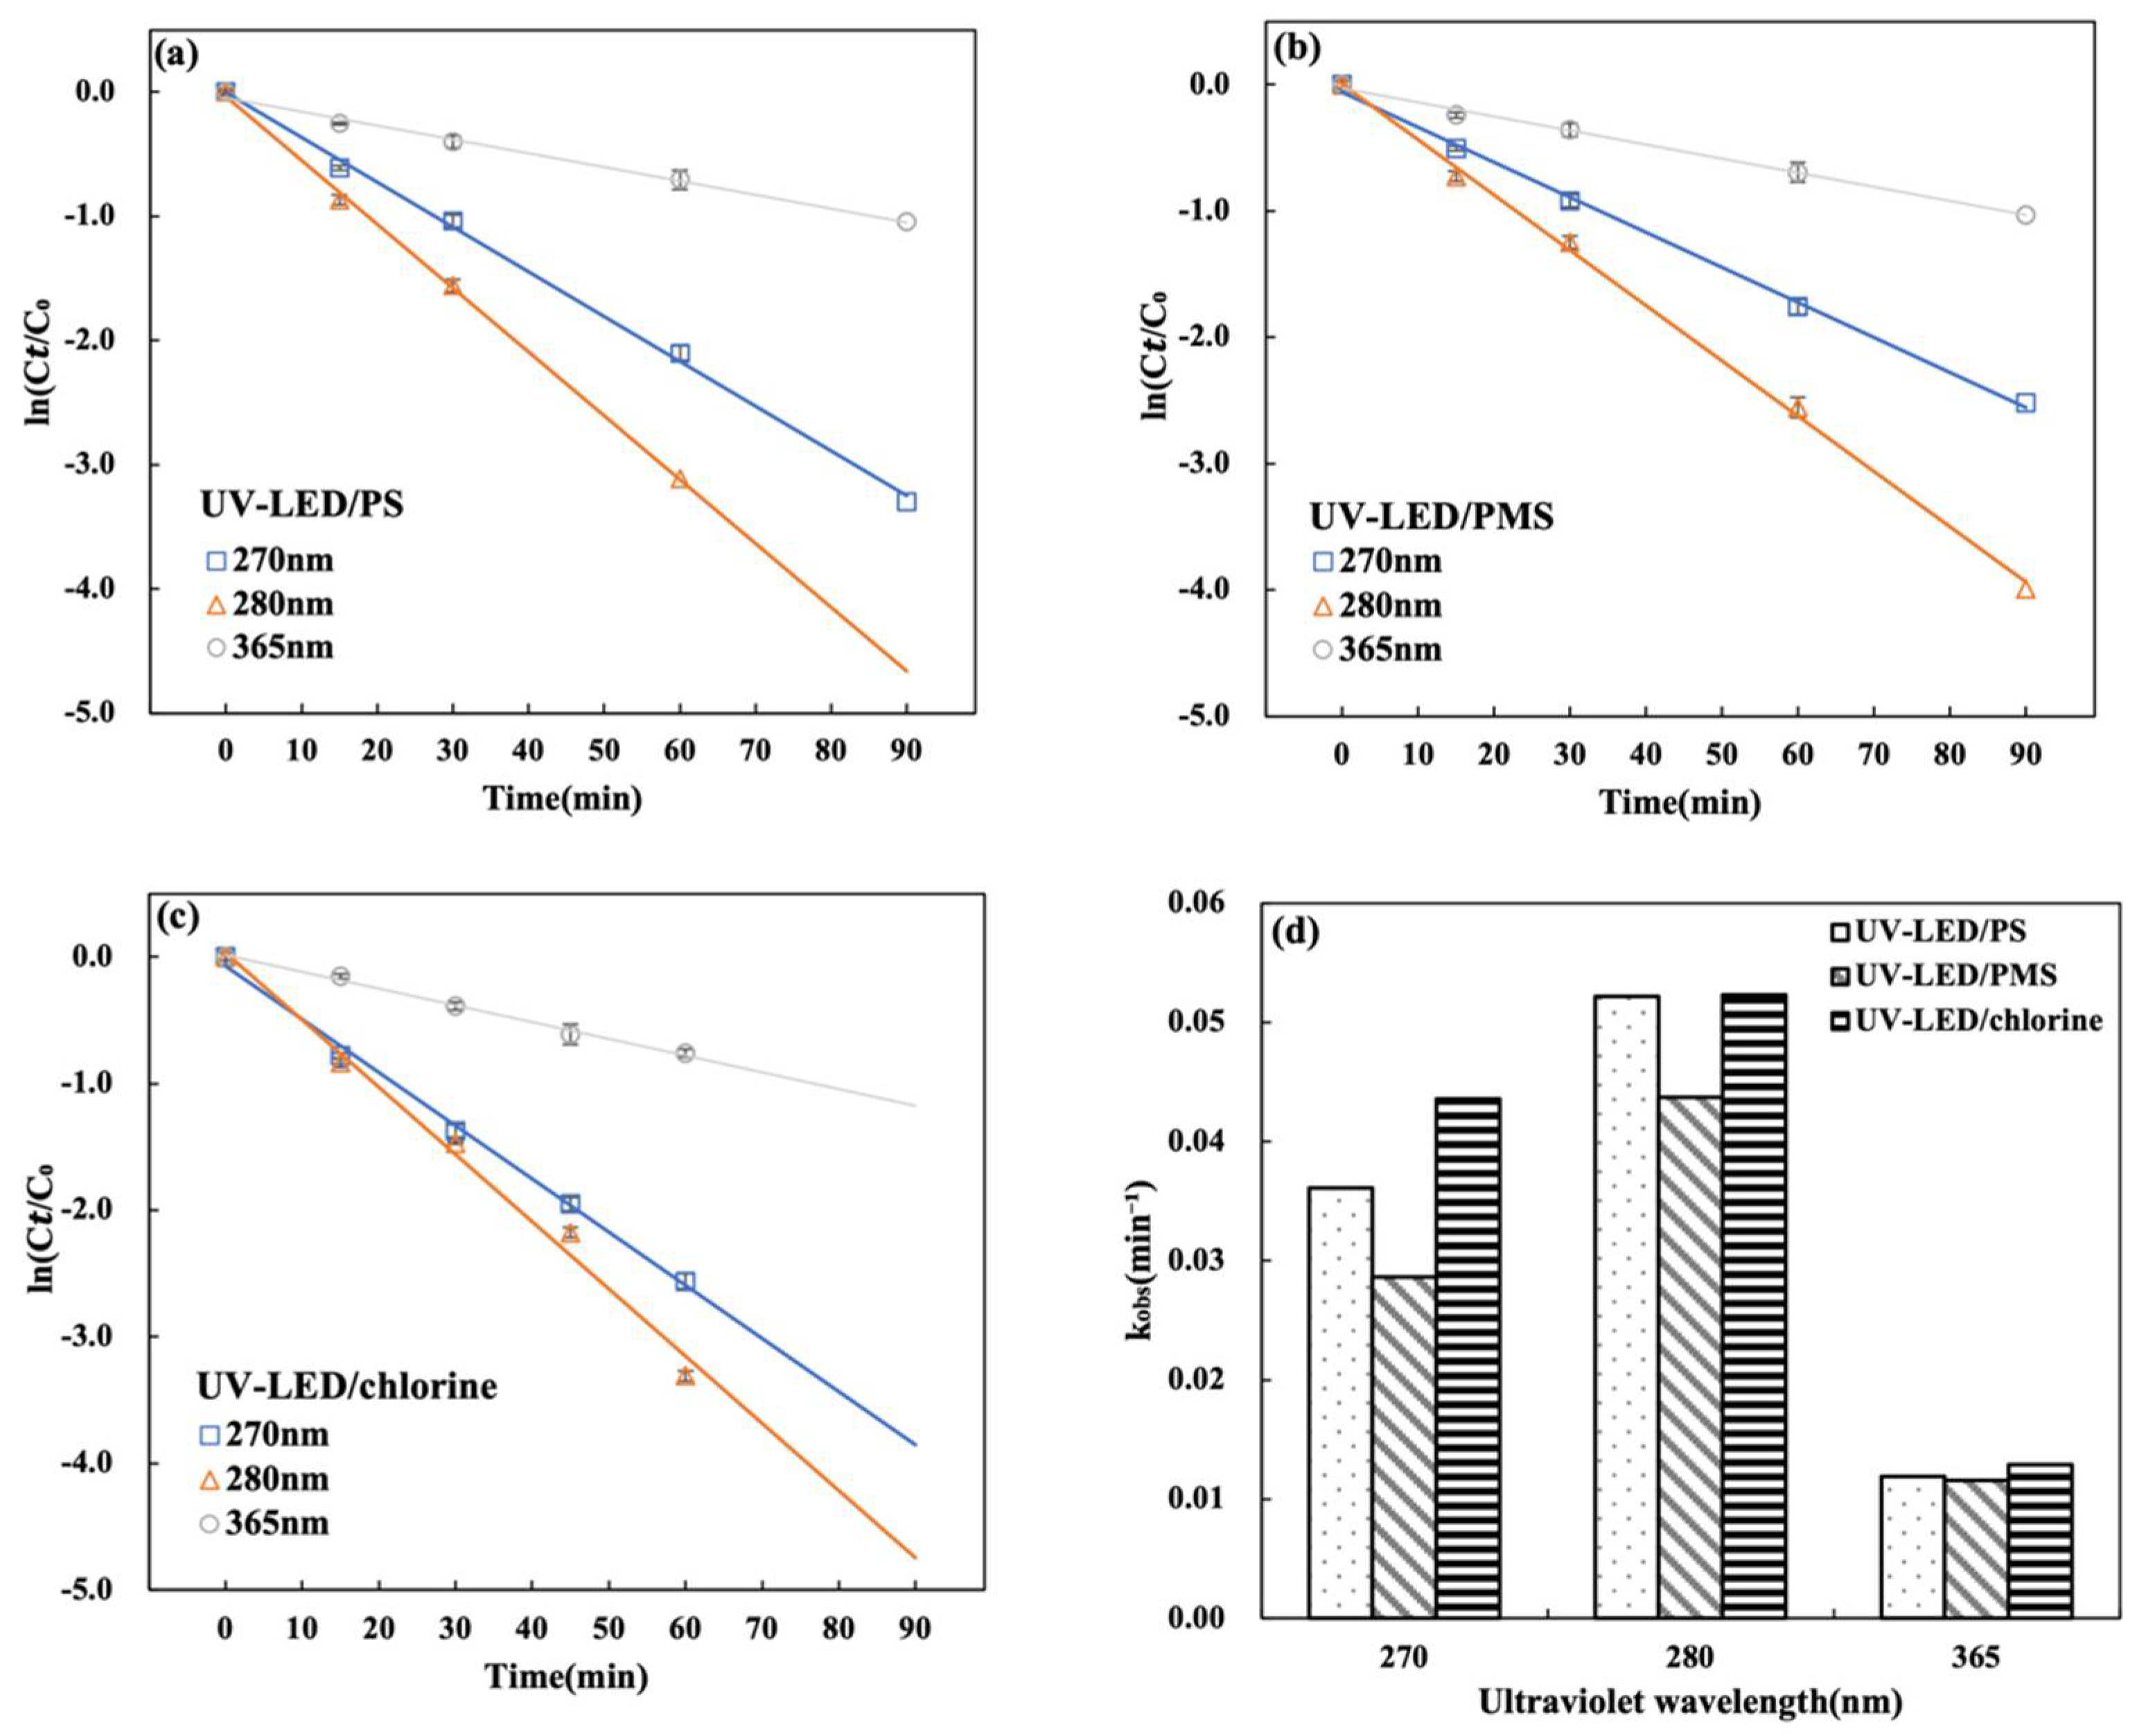
3.4. Effect of UV Wavelength on CAP Degradation by UV-LED

The UV-LED light source was tested at three distinct wavelengths to see which one produced the best CAP degradation. The impact of different UV wavelengths on CAP degradation for UV-LED/H2O2, UV-LED/PS, and UV-LED/chlorine is illustrated in Figure 4a–c. Results suggest that CAP degradation at wavelengths of 270, 280 and 365 nm correlates with pseudo-first-order kinetics. For all three wavelengths, the degradation rate is lowest at 365 nm and greatest at 280 nm. The corresponding kobs values for UV-LED/PS, UV-LED/PMS and UV-LED/chlorine were 0.0522, 0.0437 and 0.0523 min−1 at 280 nm and 0.0118, 0.0115 and 0.0129 min−1 at 365 nm, respectively. Sulfate is efficiently activated with the wavelength lower than 280 nm [34,35]. A similar observation was reported in the degradation of acetaminophen using UV-LED irradiation and UV-LED/chlorine [36]. The UV-LED system’s degradation performance was influenced by wavelength, with the greatest CAP degradation observed at 280 nm. The efficiency of the process strongly depends on UV wavelength because the photolysis of oxidants and subsequent radical formation are highly wavelength-dependent. Elsewhere it has been reported that the synergistic effects of molar absorbance and quantum yield result in maximum degradation performance at 280 nm [17].

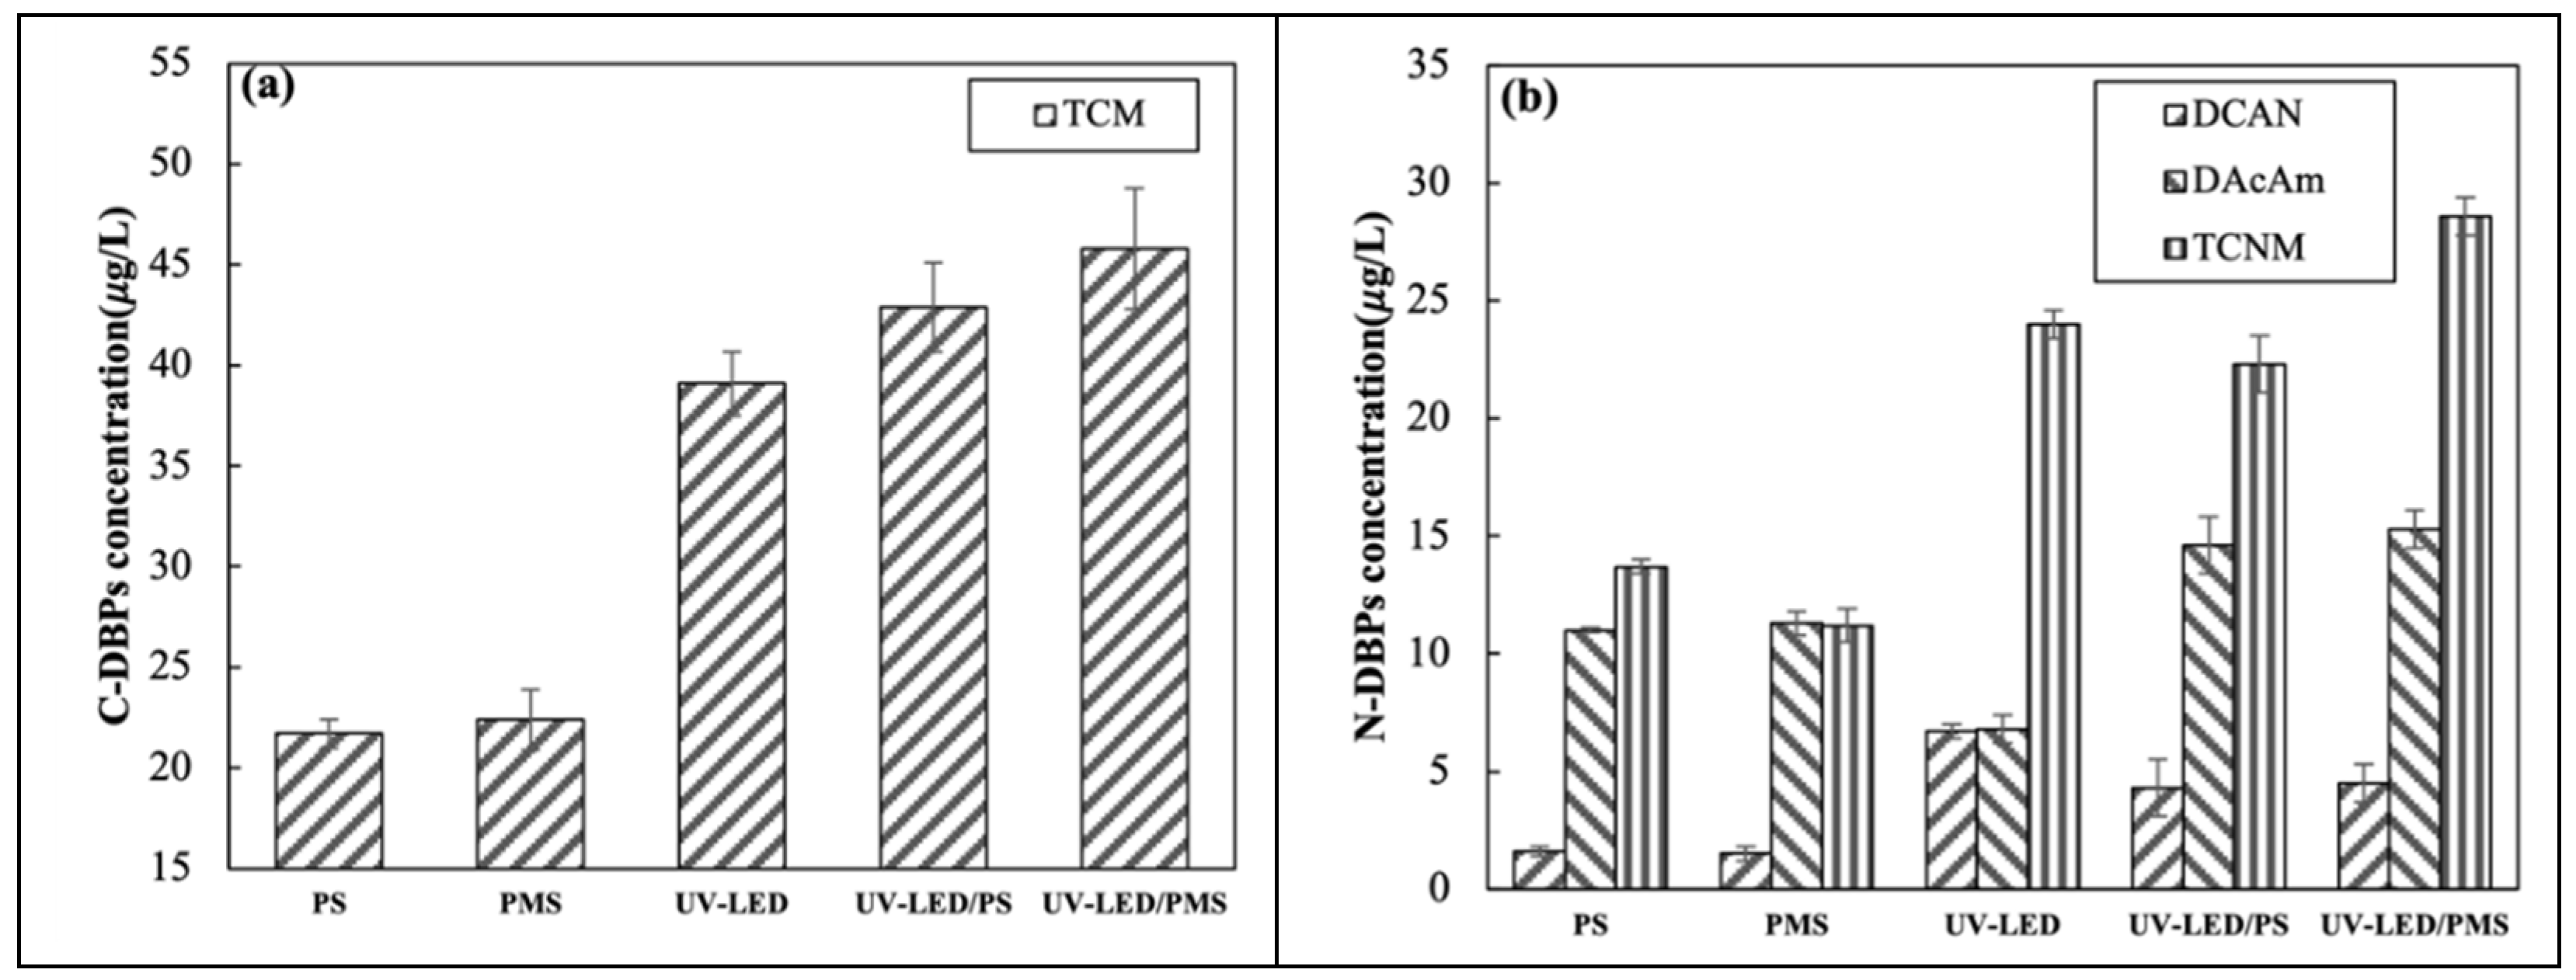
3.5. Formation Potential of DBPs

Previous studies reported that AOPs only mineralize a portion of pollutants, with the remainder forming small-molecule organic materials which are DBP percursors [37]. However, the impact of UV-LED based AOPs on the production of DBPs during chlorination has yet to be determined. The present study considered the formation of one carbonaceous DBP and three nitrogen-containing DBPs during chlorination which was performed following the application of UV-LED, PS, PMS, UV-LED/PS, and UV-LED/PMS. Figure 5a shows the production of TCM in various oxidation systems. Results indicate that the application of UV-LED/PS and UV-LED/PS approximately doubles the production of TCM from 21.7 and 22.4 μg/L to 42.9 and 45.8 μg/L, respectively. UV-LED alone produced less TCM when compared to the two AOPs, while UV-LED/PMS produced more TCM than UV-LED/PS.
Previous research which investigated UV/PS and applied an low pressure Hg light source, PS dosage of 0.5 mM, and 585 mJ/cm2 irradiation observed THM production of 0.8% following chlorination [38]. The concentration of DBPs produced by UV-LED in the present study are equivalent to those reported using an Hg lamp under the similar tested conditions.
Among the three nitrogen-containing DBPs, the concentration of TCNM produced was highest and DCAN lowest. Results suggest that the UV-LED alone can produce high concentrations of nitrogen-containing DBPs. The concentration of DCAN, DCAcAm, TCNM produced using UV-LED were 6.7, 6.8, 24 μg/L, respectively. The addition of UV light enhances N-DBP synthesis in Figure 6b which implies that the UV-LED lamp activates SO4· leading greater production of intermediates when compared to the application of PS/PMS. Using UV-LED/PS, the concentration of DCAN, DCAcAm, and TCNM produced increased from 1.6, 11, and 13.7 μg/L to 4.3, 14.6, and 22.3 μg/L, respectively. Considering UV-LED/PMS, DCAN, DCAcAm, and TCNM increased from 1.5, 11.3, and 11.2 μg/L to 4.5, 15.3, and 28.6 μg/L, respectively. Results suggest that UV-LED/PMS produces more N-DBPs than UV-LED/PS. When compared to UV irradiation alone, the production of DCAN and TCNM was slightly less than that of UV-LED/PS and UV-LED/PMS. The application of UV-LED/PS can minimize N-DBP formation, which is consistent with prior research [14]. This may be because UV-LED/PS mineralizes the nitro group in CAP forming nitrate which prevents the formation of HNMs [13]. UV/PS and UV/PMS produced slightly more dichloroacetamide (DCAcAm) when compared to UV-LED alonge. This may be because SO4· promotes the generation of DCAcAm to some extent. A previous study reported low yields (<0.12%) of DCAN following the degradation of CAP using UV/PS + NH2Cl [13]. In present study, the yield of DCAN following the degradation of CAP using UV-LED/PS was 0.86%.

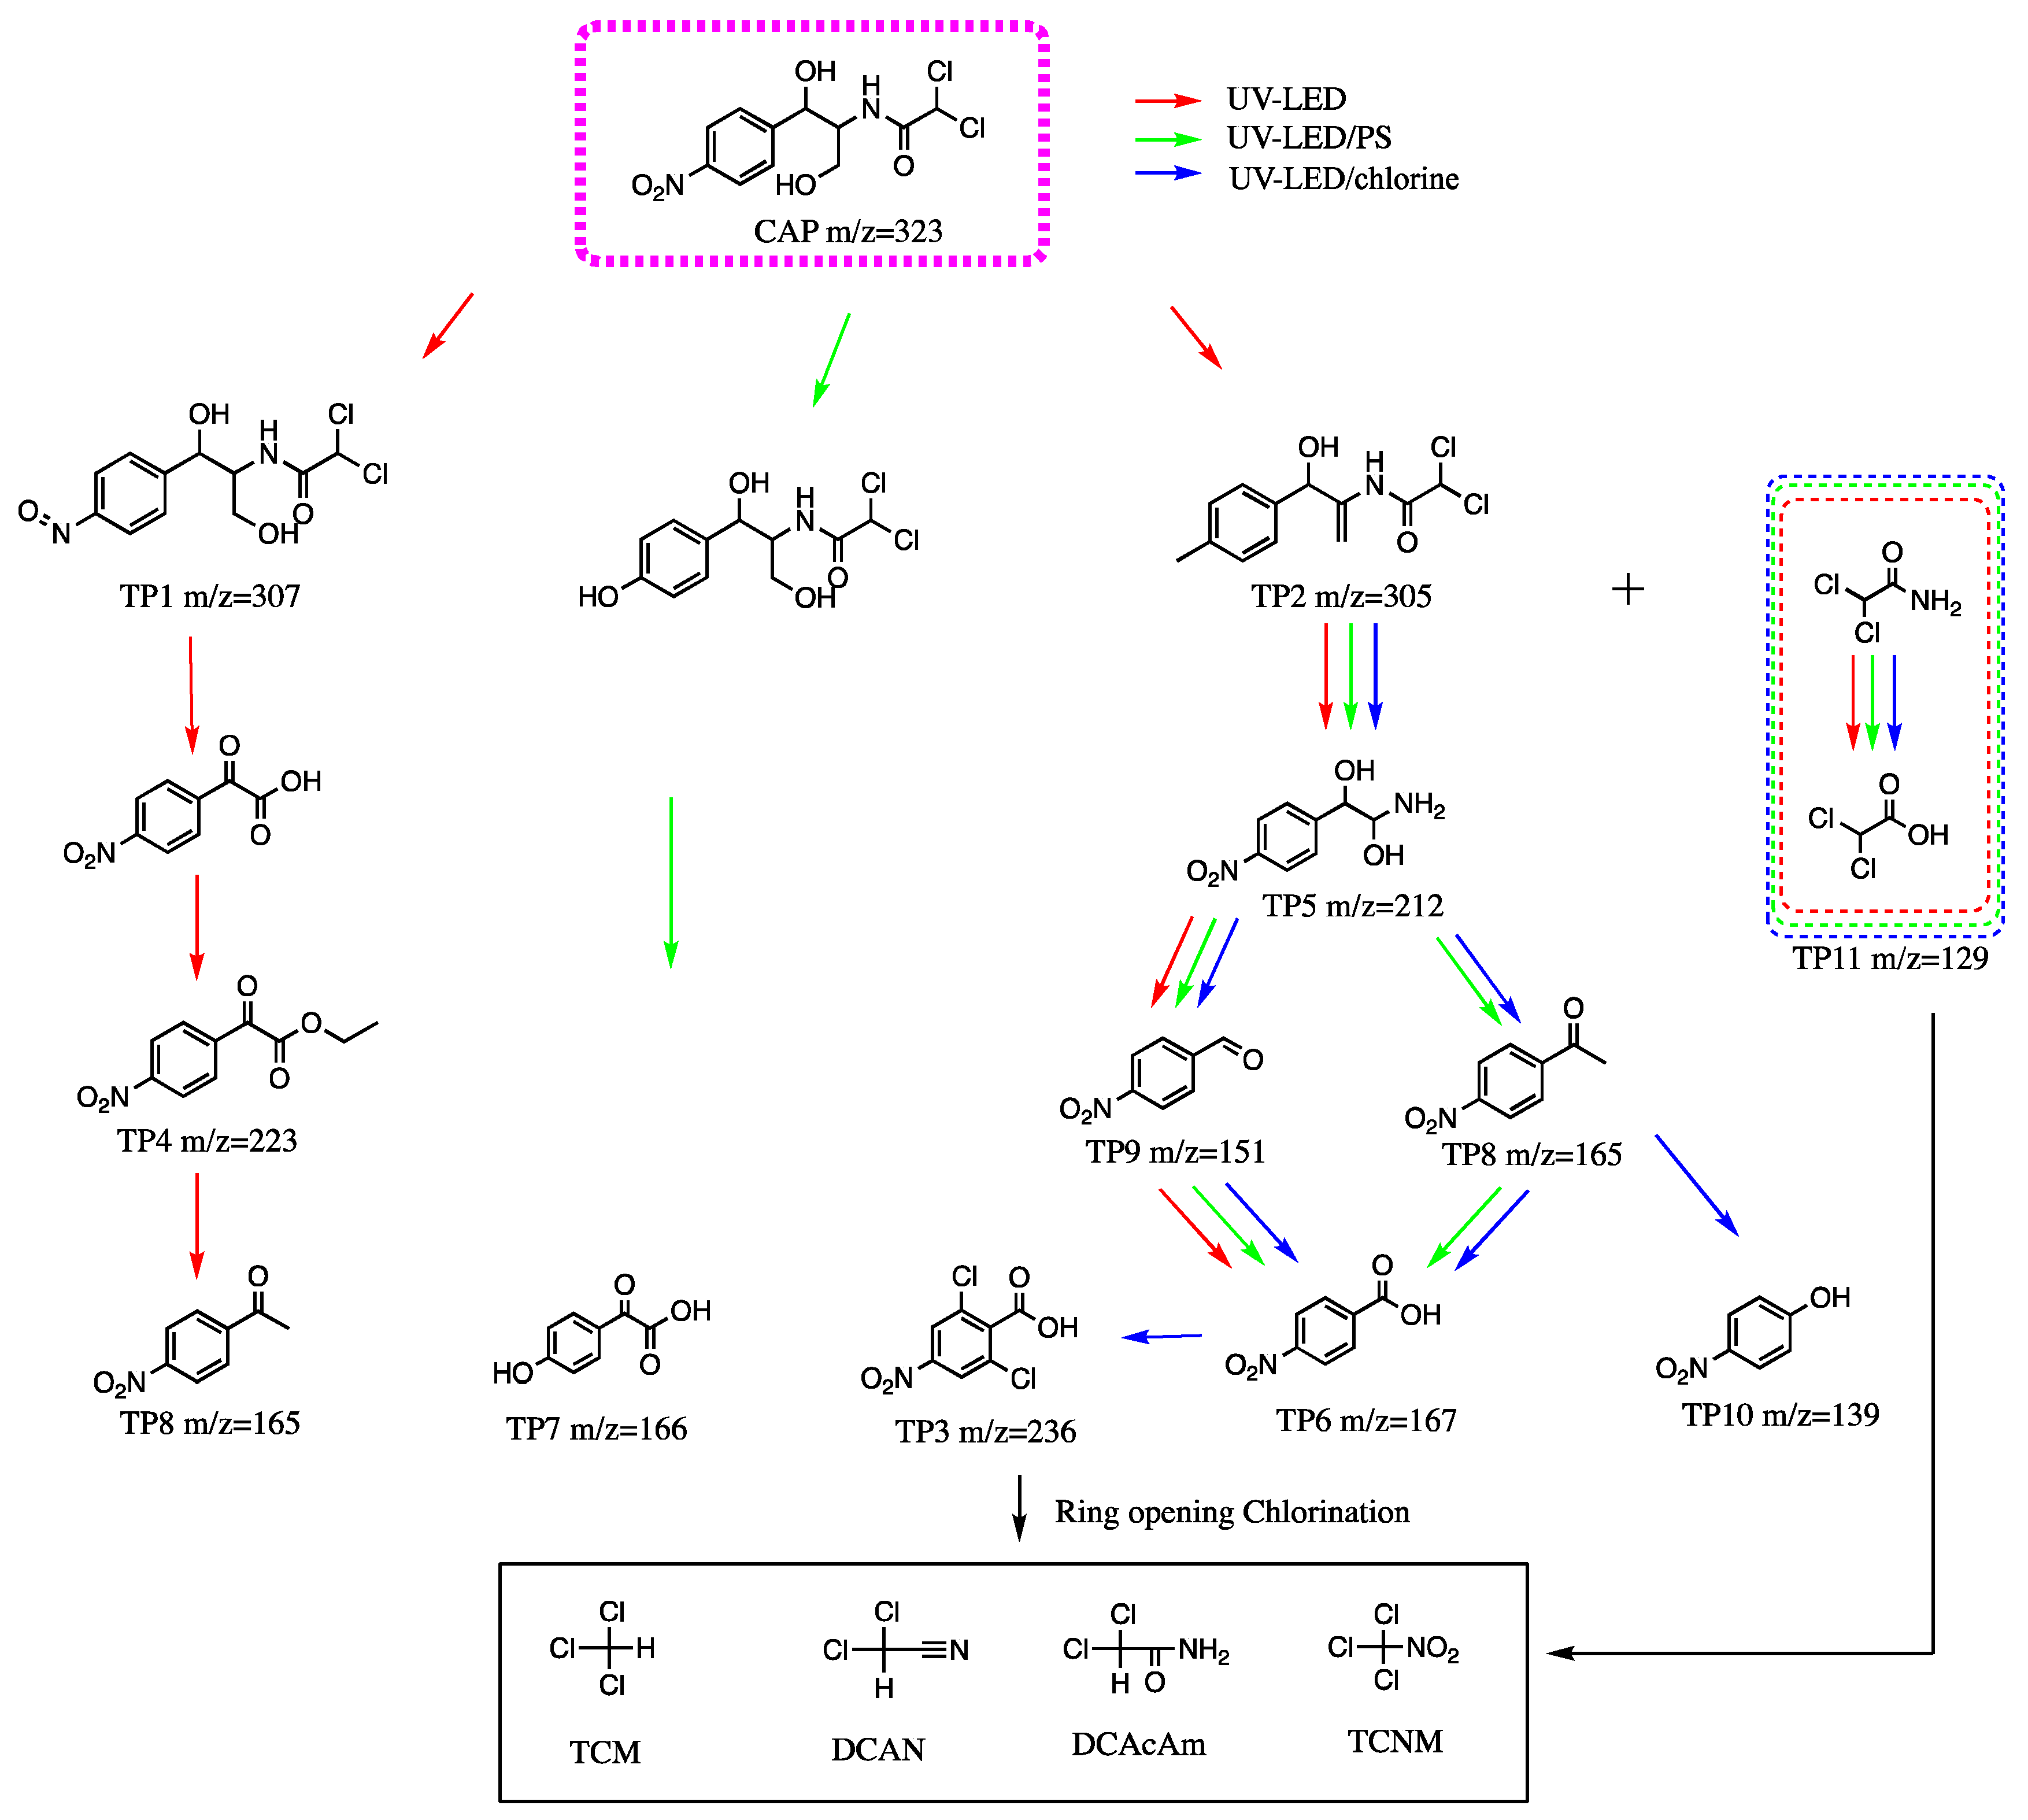
3.6. Intermediates and Degradation Pathways

To investigate the degradation mechanism of CAP during the application of UV-LED/PS and UV-LED/chlorine, intermediates were identified using UPLC-TOF-MS and possible degradation pathways of CAP are proposed in Scheme 1. Intermediates provide an indication of the presence of toxic substances during the oxidation process. The C–N bond and O–H bond in the side chain CAP have weaker dissociation energy than other chemical bonds and are easily attacked and broken resulting in the production of by-products. Under UV-LED irradiation, the degradation of CAP is initiated by the attack of·OH on the C–N bond side chain resulting in the formation of TP5 and dichloroacetamide.
The DBP TP11 can be produced by further oxidation of dichloroacetamide. The C–C bond of TP5 is then broken by the action of·OH, and the hydroxyl structure on its side chain is removed and transformed into an aldehyde group to form TP9 (m/w = 151). 4-Nitrobenzoic acid (TP6 m/z = 167) is formed when the aldehyde group is further oxidized to form a carboxyl group. Simultaneously, TP4 (m/z = 223) is formed when the C–N bond for a portion of the CAP is broken. TP8 can be further converted into TP6. During the degradation of CAP, SO4 is more active and has a higher oxidation capacity than ·OH. Considering UV-LED/PS, the nitro group on the benzene ring in the CAP may be replaced with a hydroxyl group in addition to breaking of the C–N bond. The hydroxyl group is oxidized to form a carbonyl group yielding TP7 (m/z = 166). The intermediate product of TP7 was not found during the application of UV-LED and UV-LED/chlorine in this study.
The presence of OH, Cl, Cl2 and other free radicals in the UV/chlorine system can further oxidize TP8 to 4-nitrophenol (TP10). The hydrogen on the benzene ring can be replaced by chlorine after the product p-nitrobenzoic acid is produced since there are numerous chlorine free radicals in the system, resulting in the formation of 2,6-dichloro-p-nitrobenzoic acid (TP3). In a previous study which investigated the degradation of CAP using UV/chlorine with a Hg light source, C–N fracture led to the formation of TP3, 6, and 8; however, there was no formation of TP10 [14]. The CAP degradation pathways observed using UV-LED and mercury indicated different degradation mechanisms for the two light sources.
The 4-nitrophenol is an industrial organic compound that is widely used in the chemical industry and is listed as priority pollutant by U.S. EPA [39]. In the 28-day repeated dose oral toxicity study starting at 6 weeks of age, 4-nitrophenol caused the death of most males and females at 1000 mg/kg but was not toxic at 400 mg/kg except for male rat-specific renal toxicity [40]. The toxic intermediate product of UV-LED/chlorine degradation of CAP raise the concern of the application of UV-LED/chlorine.

4. Conclusions and Discussion

The present study investigated CAP degradation using UV-LED/PS, UV-LED/PMS, and UV-LED/chlorine. Similar to the ability of Hg lamps to activate PS/PMS/NaClO and form free radicals, UV-LED lamps activate PS/PMS/NaClO to generate free radicals and accelerate CAP degradation which follows pseudo-first-order kinetics. The degradation rate constants for UV-LED/PS, UV-LED/PMS, and UV-LED/chlorine were 0.0522, 0.0437, and 0.0523 min−1, respectively, which demonstrates a high degradation efficiency.
The rate of CAP degradation increases with oxidant dosage for each UV-LED AOP, although excess oxidant concentrations inhibit radical formation. The rate constants for CAP degradation were pH dependent for each UV-LED AOPs. The highest degradation performance was observed at a UV wavelength of 280 nm. When UV-LED was introduced, DBP formation increased which indicates that UV-LED AOPs did not fully mineralize CAP but formed DBP precursors. In comparison to UV-LED, UV-LED/PS can minimize the formation of nitrogen-containing DBPs. UV-LED degradation caused the C–N bond to break, resulting in the formation of 4-nitrobenzoic acid and TP1. UV-LED/PS oxidation will result in the substitution of -NO2 with -OH in the side chain of CAP, while UV-LED/chlorine degradation will result in chlorination substitution in addition to oxidation.
The proposed treatment methods have the limitations. The degradation effect of UV-LED/PS, UV-LED/PMS decreased under acid environment while the UV-LED/chlorine process preferred an acid solution. For UV-LED/PS, UV-LED/PMS processes, it exists an optimum oxidant dosage and the degradation efficiency can’t be further improved by adding the excess oxidant. The UV-LED AOPs have a requirement for the ultraviolet wavelength. The improper ultraviolet wavelength decreases greatly the degradation effect.
The experiment was operated in a pure chemical compound solution. In real water samples, the operation effect can be influenced by other substances existing in the water, such as chloride, bicarbonate and natural organic matter (NOM). A previous study reported that NOM deceased the UV/chlorine degradation rate constants of ronidazole(RNZ) by 37% under same conditions. NOM can absorb UV light and act as an inner filter to slow down the Cl· and OH production from chlorine photolysis. NOM reacts with radicals produced in UV/chlorine at various UV wavelengths and may compete with RNZ during the reaction [41]. If possible, the polluted solution is advised to undergo treatment, such as sedimentation, filtration, to remove the NOM and other pollutants.
Furthermore, the study was carried out in bench scale and the relative effectiveness of the treatment options evaluated at small scale may not reflect the relative performance at full-scale. Future work could include full-scale comparison of UV-LED advanced oxidation.

Author Contributions

Conceptualization, Y.T.; methodology, Q.L.; software, H.W.; validation, Y.T., and M.W.; formal analysis, T.Z.; investigation, Q.L.; resources, M.W.; data curation, H.W.; writing-original draft preparation, X.Q.; writing-review and editing, Y.T., T.Z. and M.Y.; visualization, H.W.; supervision, Y.T.; project administration, Y.T.; funding acquisition, Y.T. All authors have read and agreed to the published version of the manuscript.

Funding

This research was funded by Natural Science Foundation of China (21776224) and Natural Science Foundation of Shanghai (21ZR1467300).

Institutional Review Board Statement

Not applicable.

Informed Consent Statement

Not applicable.

Data Availability Statement

All analyzed data in this study has been included in the manuscript.

Acknowledgments

This research was funded by Natural Science Foundation of China (21776224) and Natural Science Foundation of Shanghai (21ZR1467300).

Conflicts of Interest

The authors declare no conflict of interest. The funders had no role in the design of the study; in the collection, analyses, or interpretation of data; in the writing of the manuscript, or in the decision to publish the results.

Abbreviations

CAP-chloramphenicol; UV-LED-ultraviolet light emitting diode; AOPs-advanced oxidation processes; UV-LED/PS-UV-LED/persulfate; UV-LED/PMS-UV-LED/peroxymonosulfate; THMs-trihalomethanes; HANs-haloacetonitriles; HAcAms-haloacetamides; HNMs-halonitromethanes; TCM-trichloromethane; DCAN-dichloroacetonitrile; DCAcAm-dichloroacetamide; TCNM-trichloronitromethane.

References

  1. Manyi-Loh, C.; Mamphweli, S.; Meyer, E.; Okoh, A. Antibiotic Use in Agriculture and Its Consequential Resistance in Environmental Sources: Potential Public Health Implications. Molecules 2018, 23, 795. [Google Scholar] [CrossRef] [Green Version]
  2. Carvalho, I.T.; Santos, L. Antibiotics in the aquatic environments: A review of the European scenario. Environ. Int. 2016, 94, 736–757. [Google Scholar] [CrossRef]
  3. Chen, J.; Ying, G.G.; Deng, W.J. Antibiotic Residues in Food: Extraction, Analysis, and Human Health Concerns. J. Agric. Food Chem. 2019, 67, 7569–7586. [Google Scholar] [CrossRef]
  4. Zhao, R.; Feng, J.; Huang, J.; Li, X.; Li, B. Reponses of microbial community and antibiotic resistance genes to the selection pressures of ampicillin, cephalexin and chloramphenicol in activated sludge reactors. Sci. Total. Environ. 2021, 755, 142632. [Google Scholar] [CrossRef]
  5. Jiang, L.; Hu, X.; Yin, D.; Zhang, H.; Yu, Z. Occurrence, distribution and seasonal variation of antibiotics in the Huangpu River, Shanghai, China. Chemosphere 2011, 82, 822–828. [Google Scholar] [CrossRef] [PubMed]
  6. Peng, X.; Wang, Z.; Kuang, W.; Tan, J.; Li, K. A preliminary study on the occurrence and behavior of sulfonamides, ofloxacin and chloramphenicol antimicrobials in wastewaters of two sewage treatment plants in Guangzhou, China. Sci. Total. Environ. 2006, 371, 314–322. [Google Scholar] [CrossRef] [PubMed]
  7. Watkinson, A.J.; Murby, E.J.; Kolpin, D.W.; Costanzof, S.D. The occurrence of antibiotics in an urban watershed: From wastewater to drinking water. Sci. Total. Environ. 2009, 407, 2711–2723. [Google Scholar] [CrossRef] [PubMed]
  8. Berendsen, B.; Zuidema, T.; Jong, J.D.; Stolker, L.A.M.; Nielen, M.W.F. Discrimination of eight chloramphenicol isomers by liquid chromatography tandem mass spectrometry in order to investigate the natural occurrence of chloramphenicol. Anal. Chim. Acta 2011, 700, 78–85. [Google Scholar] [CrossRef]
  9. Matilainen, A.; Sillanpää, M. Removal of natural organic matter from drinking water by advanced oxidation processes. Chemosphere 2010, 80, 351–365. [Google Scholar] [CrossRef]
  10. Zhang, T.; Hu, Y.; Jiang, L.; Yao, S.; Lin, K.; Zhou, Y.; Cui, C. Removal of antibiotic resistance genes and control of horizontal transfer risk by UV, chlorination and UV/chlorination treatments of drinking water. Chem. Eng. J. 2019, 358, 589–597. [Google Scholar] [CrossRef]
  11. Matzek, L.W.; Carter, K.E. Activated persulfate for organic chemical degradation: A review. Chemosphere 2016, 151, 178–188. [Google Scholar] [CrossRef]
  12. Sun, B.; Wang, Y.; Xiang, Y.; Shang, C. Influence of pre-ozonation of DOM on micropollutant abatement by UV-based advanced oxidation processes. J. Hazard. Mater. 2020, 391, 122201. [Google Scholar] [CrossRef]
  13. Chu, W.; Chu, T.; Bond, T.; Du, E.; Guo, Y.; Gao, N. Impact of persulfate and ultraviolet light activated persulfate pre-oxidation on the formation of trihalomethanes, haloacetonitriles and halonitromethanes from the chlor(am)ination of three antibiotic chloramphenicols. Water Res. 2016, 93, 48–55. [Google Scholar] [CrossRef]
  14. Dong, H.; Qiang, Z.; Hu, J.; Qu, J. Degradation of chloramphenicol by UV/chlorine treatment: Kinetics, mechanism and enhanced formation of halonitromethanes. Water Res. 2017, 121, 178–185. [Google Scholar] [CrossRef] [PubMed]
  15. Gao, Y.; Gao, N.; Chu, W.; Zhang, Y.; Zhang, J.; Yin, D. UV-activated persulfate oxidation of sulfamethoxypyridazine: Kinetics, degradation pathways and impact on DBP formation during subsequent chlorination. Chem. Eng. J. 2019, 370, 706–715. [Google Scholar] [CrossRef]
  16. Gao, Z.; Lin, Y.; Xu, B.; Ying, X.; Hu, C.; Zhang, T.; Cao, T.; Pan, Y.; Gao, N. A comparison of dissolved organic matter transformation in low pressure ultraviolet (LPUV) and ultraviolet light-emitting diode (UV-LED)/chlorine processes. Sci. Total. Environ. 2020, 702, 134942. [Google Scholar] [CrossRef] [PubMed]
  17. Gao, Z.; Lin, Y.; Xu, B.; Xia, Y.; Hu, C.; Zhang, T.; Cao, T.; Chu, W.; Gao, N. Effect of UV wavelength on humic acid degradation and disinfection by-product formation during the UV/chlorine process. Water Res. 2019, 154, 199–209. [Google Scholar] [CrossRef]
  18. Arlos, M.J.; Liang, R.; Hatat-Fraile, M.M.; Bragg, L.M.; Zhou, N.Y.; Servos, M.R.; Andrews, S.A. Photocatalytic decomposition of selected estrogens and their estrogenic activity by UV-LED irradiated TiO2 immobilized on porous titanium sheets via thermal-chemical oxidation. J. Hazard. Mater. 2016, 318, 541–550. [Google Scholar] [CrossRef] [PubMed]
  19. Liu, J.; Ye, J.; Ou, H.; Lin, J. Effectiveness and intermediates of microcystin-LR degradation by UV/H2O2 via 265 nm ultraviolet light-emitting diodes. Environ. Sci. Pollut. Res. 2017, 24, 4676–4684. [Google Scholar] [CrossRef]
  20. Rasoulifard, M.H.; Fazli, M.; Eskandarian, M.R. Performance of the light-emitting-diodes in a continuous photoreactor for degradation of Direct Red 23 using UV-LED/S2O82 process. J. Ind. Eng. Chem. 2015, 24, 121–126. [Google Scholar] [CrossRef]
  21. Verma, S.; Sillanp, M. Degradation of anatoxin-a by UV-C LED and UV-C LED/H2O2 advanced oxidation processes. Chem. Eng. J. 2015, 274, 274–281. [Google Scholar] [CrossRef]
  22. Duckworth, K.; Spencer, M.; Bates, C.; Miller, M.E.; Almquist, C.; Grimaila, M.; Magnuson, M.; Willison, S.; Phillips, R.; Racz, L.A. Advanced oxidation degradation kinetics as a function of ultraviolet LED duty cycle. Water Sci. Technol. 2015, 71, 1375–1381. [Google Scholar] [CrossRef]
  23. Obra, I.D.L.; García, B.E.; Sánchez, J.L.G.; López, J.L.C.; Pérez, J.A.S. Low cost UVA-LED as a radiation source for the photo-Fenton process: A new approach for micropollutant removal from urban wastewater. Photochem. Photobiol. 2016, 16, 72–78. [Google Scholar] [CrossRef] [PubMed]
  24. Carra, I.; Sánchez Pérez, J.A.; Malato, S.; Autin, O.; Jefferson, B.; Jarvis, P. Application of high intensity UVC-LED for the removal of acetamiprid with the photo-Fenton process. Chem. Eng. J. 2015, 264, 690–696. [Google Scholar] [CrossRef]
  25. Cai, Q.; Hu, J. Decomposition of sulfamethoxazole and trimethoprim by continuous UVA/LED/TiO2 photocatalysis: Decomposition pathways, residual antibacterial activity and toxicity. J. Hazard. Mater. 2016, 323, 527–536. [Google Scholar] [CrossRef] [PubMed]
  26. Ye, J.; Liu, J.; Ou, H.; Wang, J. Degradation of ciprofloxacin by 280 nm ultraviolet-activated persulfate: Degradation pathway and intermediate impact on proteome of Escherichia coli. Chemosphere 2016, 165, 311–319. [Google Scholar] [CrossRef]
  27. Wu, M.; Tang, Y.; Liu, Q.; Tan, Z.; Wang, M.; Xu, B.; Xia, S.; Mao, S.; Gao, N. Highly efficient chloramphenicol degradation by UV and UV/H2O2 processes based on LED light source. Water Environ. Res. 2020, 92, 2049–2059. [Google Scholar] [CrossRef]
  28. Chu, W.; Gao, N.; Deng, Y.; Krasner, S.W. Precursors of Dichloroacetamide, an Emerging Nitrogenous DBP Formed during Chlorination or Chloramination. Environ. Sci. Technol. Am. Chem. Soc. 2010, 44, 3908–3912. [Google Scholar] [CrossRef] [PubMed]
  29. Li, B.; Ma, X.; Deng, J.; Li, Q.; Chen, W.; Li, G.; Chen, G.; Wang, J. Comparison of acetaminophen degradation in UV-LED-based advance oxidation processes: Reaction kinetics, radicals contribution, degradation pathways and acute toxicity assessment. Sci. Total. Environ. 2020, 723, 137993. [Google Scholar] [CrossRef]
  30. Tan, C.; Fu, D.; Gao, N.; Qin, Q.; Xiang, H. Kinetic degradation of chloramphenicol in water by UV/persulfate system. J. Photochem. Photobiol. A: Chem. 2017, 332, 406–412. [Google Scholar] [CrossRef]
  31. Zhou, S.; Xia, Y.; Li, T.; Yao, T.; Zhou, S.; Zhu, S.; Gao, N. Degradation of carbamazepine by UV/chlorine advanced oxidation process and formation of disinfection by-products. Environ. Sci. Pollut. Res. Int. 2016, 23, 16448–16455. [Google Scholar] [CrossRef] [PubMed]
  32. Dan, J.; Wang, Q.; Mu, K.; Pao, P.; Dong, L.; Zhang, X.; He, Z.; Gao, N.; Wang, J. Degradation of sulfachloropyridazine by UV-C/persulfate: Kinetics, key factors, degradation pathway. Environ. Sci. Water Res. Technol. R. Soc. Chem. 2020, 6, 2510–2520. [Google Scholar] [CrossRef]
  33. Zhang, Y.; Zhang, J.; Xiao, Y.; Chang, V.; Lim, T. Kinetic and mechanistic investigation of azathioprine degradation in water by UV, UV/H2O2 and UV/persulfate. Chem. Eng. J. 2016, 302, 526–534. [Google Scholar] [CrossRef]
  34. Neppolian, B.; Celik, E.; Choi, H. Photochemical oxidation of arsenic (III) to arsenic (V) using peroxydisulfate ions as an oxidizing agent. Environ. Sci. Technol. 2008, 42, 6179–6184. [Google Scholar] [CrossRef]
  35. Malato, S.; Blanco, J.; Richter, C.; Braun, B.; Maldonado, M.I. Enhancement of the rate of solar photocatalytic mineralization of organic pollutants by inorganic oxidizing species. Appl. Catal. B Environ. 1998, 17, 347–356. [Google Scholar] [CrossRef]
  36. Li, B.; Ma, X.; Li, Q.; Chen, W.; Liao, W. Factor affecting the role of radicals contribution at different wavelengths, degradation pathways and toxicity during UV-LED/chlorine process. Chem. Eng. J. 2020, 392, 124552. [Google Scholar] [CrossRef]
  37. Xie, P.; Liu, W.; Zou, J.; Yue, S. Impact of UV/persulfate pretreatment on the formation of disinfection byproducts during subsequent chlorination of natural organic matter. Chem. Eng. J. 2015, 269, 203–211. [Google Scholar] [CrossRef]
  38. Chu, W.; Gao, N.; Krasner, S.W.; Templeton, M.R.; Yin, D. Formation of halogenated C-, N-DBPs from chlor(am)ination and UV irradiation of tyrosine in drinking water. Environ. Pollut. 2012, 161, 8–14. [Google Scholar] [CrossRef] [Green Version]
  39. Uberoi, V.; Bhattacharya, S. Toxicity and degradability of nitrophenols in anaerobic systems. Water Environ. Res. 1997, 69, 146–156. [Google Scholar] [CrossRef]
  40. Koizumi, M.; Yamamoto, Y.; Ito, Y.; Takano, M.; Enami, T.; Kamata, E.; Hasegawa, R. Comparative study of toxicity of 4-nitrophenol and 2,4-dinitrophenol in newborn and young rats. J. Toxicol. Sci. 2001, 26, 299–311. [Google Scholar] [CrossRef] [PubMed] [Green Version]
  41. Zou, X.; Lin, Y.; Xu, B.; Zhang, T.; Hu, C.; Cao, T.; Chu, W.; Pan, Y.; Gao, N. Enhanced ronidazole degradation by UV-LED/chlorine compared with conventional low-pressure UV/chlorine at neutral and alkaline pH values. Water Res. 2019, 160, 296–303. [Google Scholar] [CrossRef] [PubMed]
Figure 1. Schematic diagram of UV-LED reactors.
Water 13 03035 g001
Figure 2. Degradation of CAP using UV-LED/PS, UV-LED/PMS, UV-LED/chlorine, UV-LED, PMS, PS and NaClO. (a) y axis is C/C0; (b) y axis is ln(C/C0). Conditions: [CAP]0 = 5.0 mg/L, [PS] = [H2O2] = [NaClO] = 0.5 mM, pH = 7.0, wavelength = 280 nm and lamp power I0 = 2.4 mW/cm2.
Water 13 03035 g002
Figure 3. The removal rate of CAP by UV-LED/H2O2, UV-LED/PS, UV-LED/chlorine under different pH. Conditions: [CAP]0 = 5.0 mg/L, [PS] = [H2O2] = [NaClO] = 0.5 mM, wavelength = 280 nm and lamp power I0 = 2.4 mW/cm2, t = 60 min.
Water 13 03035 g003
Figure 4. Effect of initial oxidant dosage on CAP degradation during (a) UV-LED/PS; (b) UV-LED/PMS; (c) UV-LED/chlorine processes. (d) Comparison of kobs values. Conditions: [CAP]0 = 5.0 mg/L, lamp power I0 = 2.4 mW/cm2, wavelength = 280 nm, t = 60 min, pH = 7.0.
Water 13 03035 g004
Figure 5. Effect of UV wavelength on CAP degradation during (a) UV-LED/PS; (b) UV-LED/PMS and (c) UV-LED/chlorine. (d) Comparison of kobs values. Conditions: [CAP]0 = 5.0 mg/L, [PS] = [H2O2] = [NaClO] = 0.5 mM, lamp power I0 = 2.4 mW/cm2, t = 60 min, pH = 7.0.
Water 13 03035 g005
Figure 6. Formation of (a) C-DBPs and (b) N-DBPs in UV-LED, PS, PMS, UV-LED/PS, UV-LED/PMS system ([CAP]0 = 5.0 mg/L, [H2O2] = [PS] = [PMS] = 0.5 mM, wavelength = 280 nm, pH = 7.3, lamp power I0 = 2.4 mW/cm2, [NaClO] = 0.5 mM, T = 25 °C).
Water 13 03035 g006
Scheme 1. Proposed degradation pathways of CAP using UV-LED, UV-LED/PS and UV-LED/chlorine.
Water 13 03035 sch001
Publisher’s Note: MDPI stays neutral with regard to jurisdictional claims in published maps and institutional affiliations.

