Article

Development of a Fish-Based Multimetric Index for the Assessment of Lagoons’ Ecological Quality in Northern Greece

by
Argyrios S. Sapounidis
* and
Emmanuil T. Koutrakis
Fisheries Research Institute, Hellenic Agricultural Organization “DIMITRA”, Nea Peramos, GR-64007 Kavala, Greece
*
Author to whom correspondence should be addressed.
Water 2021, 13(21), 3008; https://doi.org/10.3390/w13213008
Submission received: 17 September 2021 / Revised: 21 October 2021 / Accepted: 25 October 2021 / Published: 27 October 2021

Abstract

:
Maintaining and improving the aquatic ecosystems in the community is the aim of the Water Framework Directive (WFD) 2000/60/EC. The WFD requires the water quality to be classified into five categories. Lagoons are dynamic ecosystems. The fish communities inhabiting them are highly affected by the environmental conditions prevailing both in the freshwater systems and in the marine environment. The current paper presented the first effort to develop a fish-based index (Lagoon Fish-based Index—LFI) for the assessment of the Mediterranean shallow lagoons, as almost all indices produced to date refer to freshwater or estuarine systems. For the development and calibration of the index, data were collected from nine lagoons situated in three estuarine systems in the East Macedonia and Thrace regions. The development of the LFI was based on the principles of the Indices of Biological Integrity (IBIs) that were primary used for the assessment of aquatic ecosystems in the USA. A total number of 25 metrics were selected as potential metrics for the LFI. These metrics describe attributes such as the abundance and composition of the fish fauna, the feeding strategies of the species, and the presence of sentinel species. Finally, eight metrics were included in the LFI.

1. Introduction

Lagoons are dynamic systems of high ecological value, as they not only play an important role in nutrient recycling, but also serve as essential habitats for many aquatic organisms, especially fish [1]. Many marine, estuarine, and freshwater fish species use lagoons as foraging ground or as nesting and/or protection areas [2,3]. It is difficult to assess the ecological status of coastal lagoons as they are often described as “naturally stressed environments” [4]. This is the result of the continuous fluctuation in fresh and marine water balance affecting various water parameters (pH, salinity, etc.) [5]. In general, lagoons are eutrophic areas, due to the influx of nutrients from both the sea and the riverine systems. Such eutrophic conditions are usually found in polluted waterbodies [6], although they can be considered typical for these dynamic systems [1,6].
In the past, the water bodies’ quality assessment was exclusively associated with the impact of water pollution on human welfare. However, the degradation of water ecosystems does not always have direct human welfare implications, for example, landscape alteration by agriculture and urbanization, water flow change by channel dredging, diversion of freshwater for alternate uses, overharvesting biological resources, and nonpoint sources proliferation [7]. Therefore, environmental indicators are useful tools for studying and evaluating the ecological status of complex aquatic ecosystems, such as lagoons [8].
Maintaining and improving the aquatic ecosystems in the community is the aim of the Water Framework Directive (WFD) 2000/60/EC [9]. The WFD requires the classification of the ecological status of transitional ecosystems into five categories [10,11,12] in an integrative way, using several biological components, such as phytoplankton, benthos, and nekton, in combination with physicochemical elements [13]. Biological indicators are measurable parameters of the biotic communities, while, on the other hand, chemical indicators are used for the qualitative and quantitative identification of chemical pollution. Various authors [8,13,14,15,16] have pointed out the importance of biological indicators in the assessment of aquatic environments. Today, there are numerous biotic multimetric indices, which involve various biological quality elements, such as phytoplankton, macrophytes, phytobenthos [17,18], benthic invertebrate fauna [19,20], fish [7,8,21], or a combination of them [13]. In the case of the fish-based indices, most of them employ metrics concerning species composition, abundance, and the occurrence of disturbance-sensitive species [22] or even their trophic structure and diversity [21]. Various authors, such as Karr [23], Karr et al. [13], Fausch et al. [24], Whitfield and Elliott [21], and Pérez-Domínguez et al. [22], have highlighted the advantages of using fish as ecological indicators.
However, as lagoons represent dynamic ecosystems, the fish communities inhabiting them are highly affected by the environmental conditions prevailing in both the freshwater inflows and the coastal waters [1,22].
In order to develop an ecological index, the comparison of an impacted ecosystem with one in pristine condition is fundamental. However, today, it is difficult to identify such ecosystems, as all lagoons are impacted. Many authors [3,8,14,25] have employed the so-called “data-driven” methodology in order to overcome this problem. This methodology incorporates the use of a dataset from various ecosystems, including those that are considered least impacted or in pristine condition. From this dataset, the “best” value for each metric can be considered as a reference value and used for the calibration of the index.
This is one of the first efforts to develop a fish-based index for estimating the water quality of the transitional systems in the Mediterranean, as almost all available indicators refer to freshwater systems. An exception is the Habitat Fish Index (HFI) [3], which was developed and calibrated to assess the ecological quality of Venice Lagoon based on a habitat approach. Venice Lagoon covers an area of 550 km2 and includes a multiplicity of shallow and deep habitats (average depth, 1 m), such as marshes, mudflats, sand flats, and seagrass beds. On the contrary, Greek lagoons are shallow, covering very small areas [26]. It is indicative that the total area covered by lagoons in Northern Greece is 115 km2, whereas lagoons in Western Greece cover an area of 270 km2.
The aim of the present study was to present the development and calibration of a fish-based index, based on the Mediterranean species fish fauna that could be employed for the assessment of the Greek lagoons (Lagoon Fish-based Index (LFI)). For the development of the LFI, data were collected from five lagoons situated in three estuarine systems in the East Macedonia and Thrace Region. The LFI was later used to evaluate the ecological quality of four additional lagoons situated in the same area, and their ecological quality has already been assessed by other authors based on the condition of the macroalgae condition [27,28,29].

2. Materials and Methods
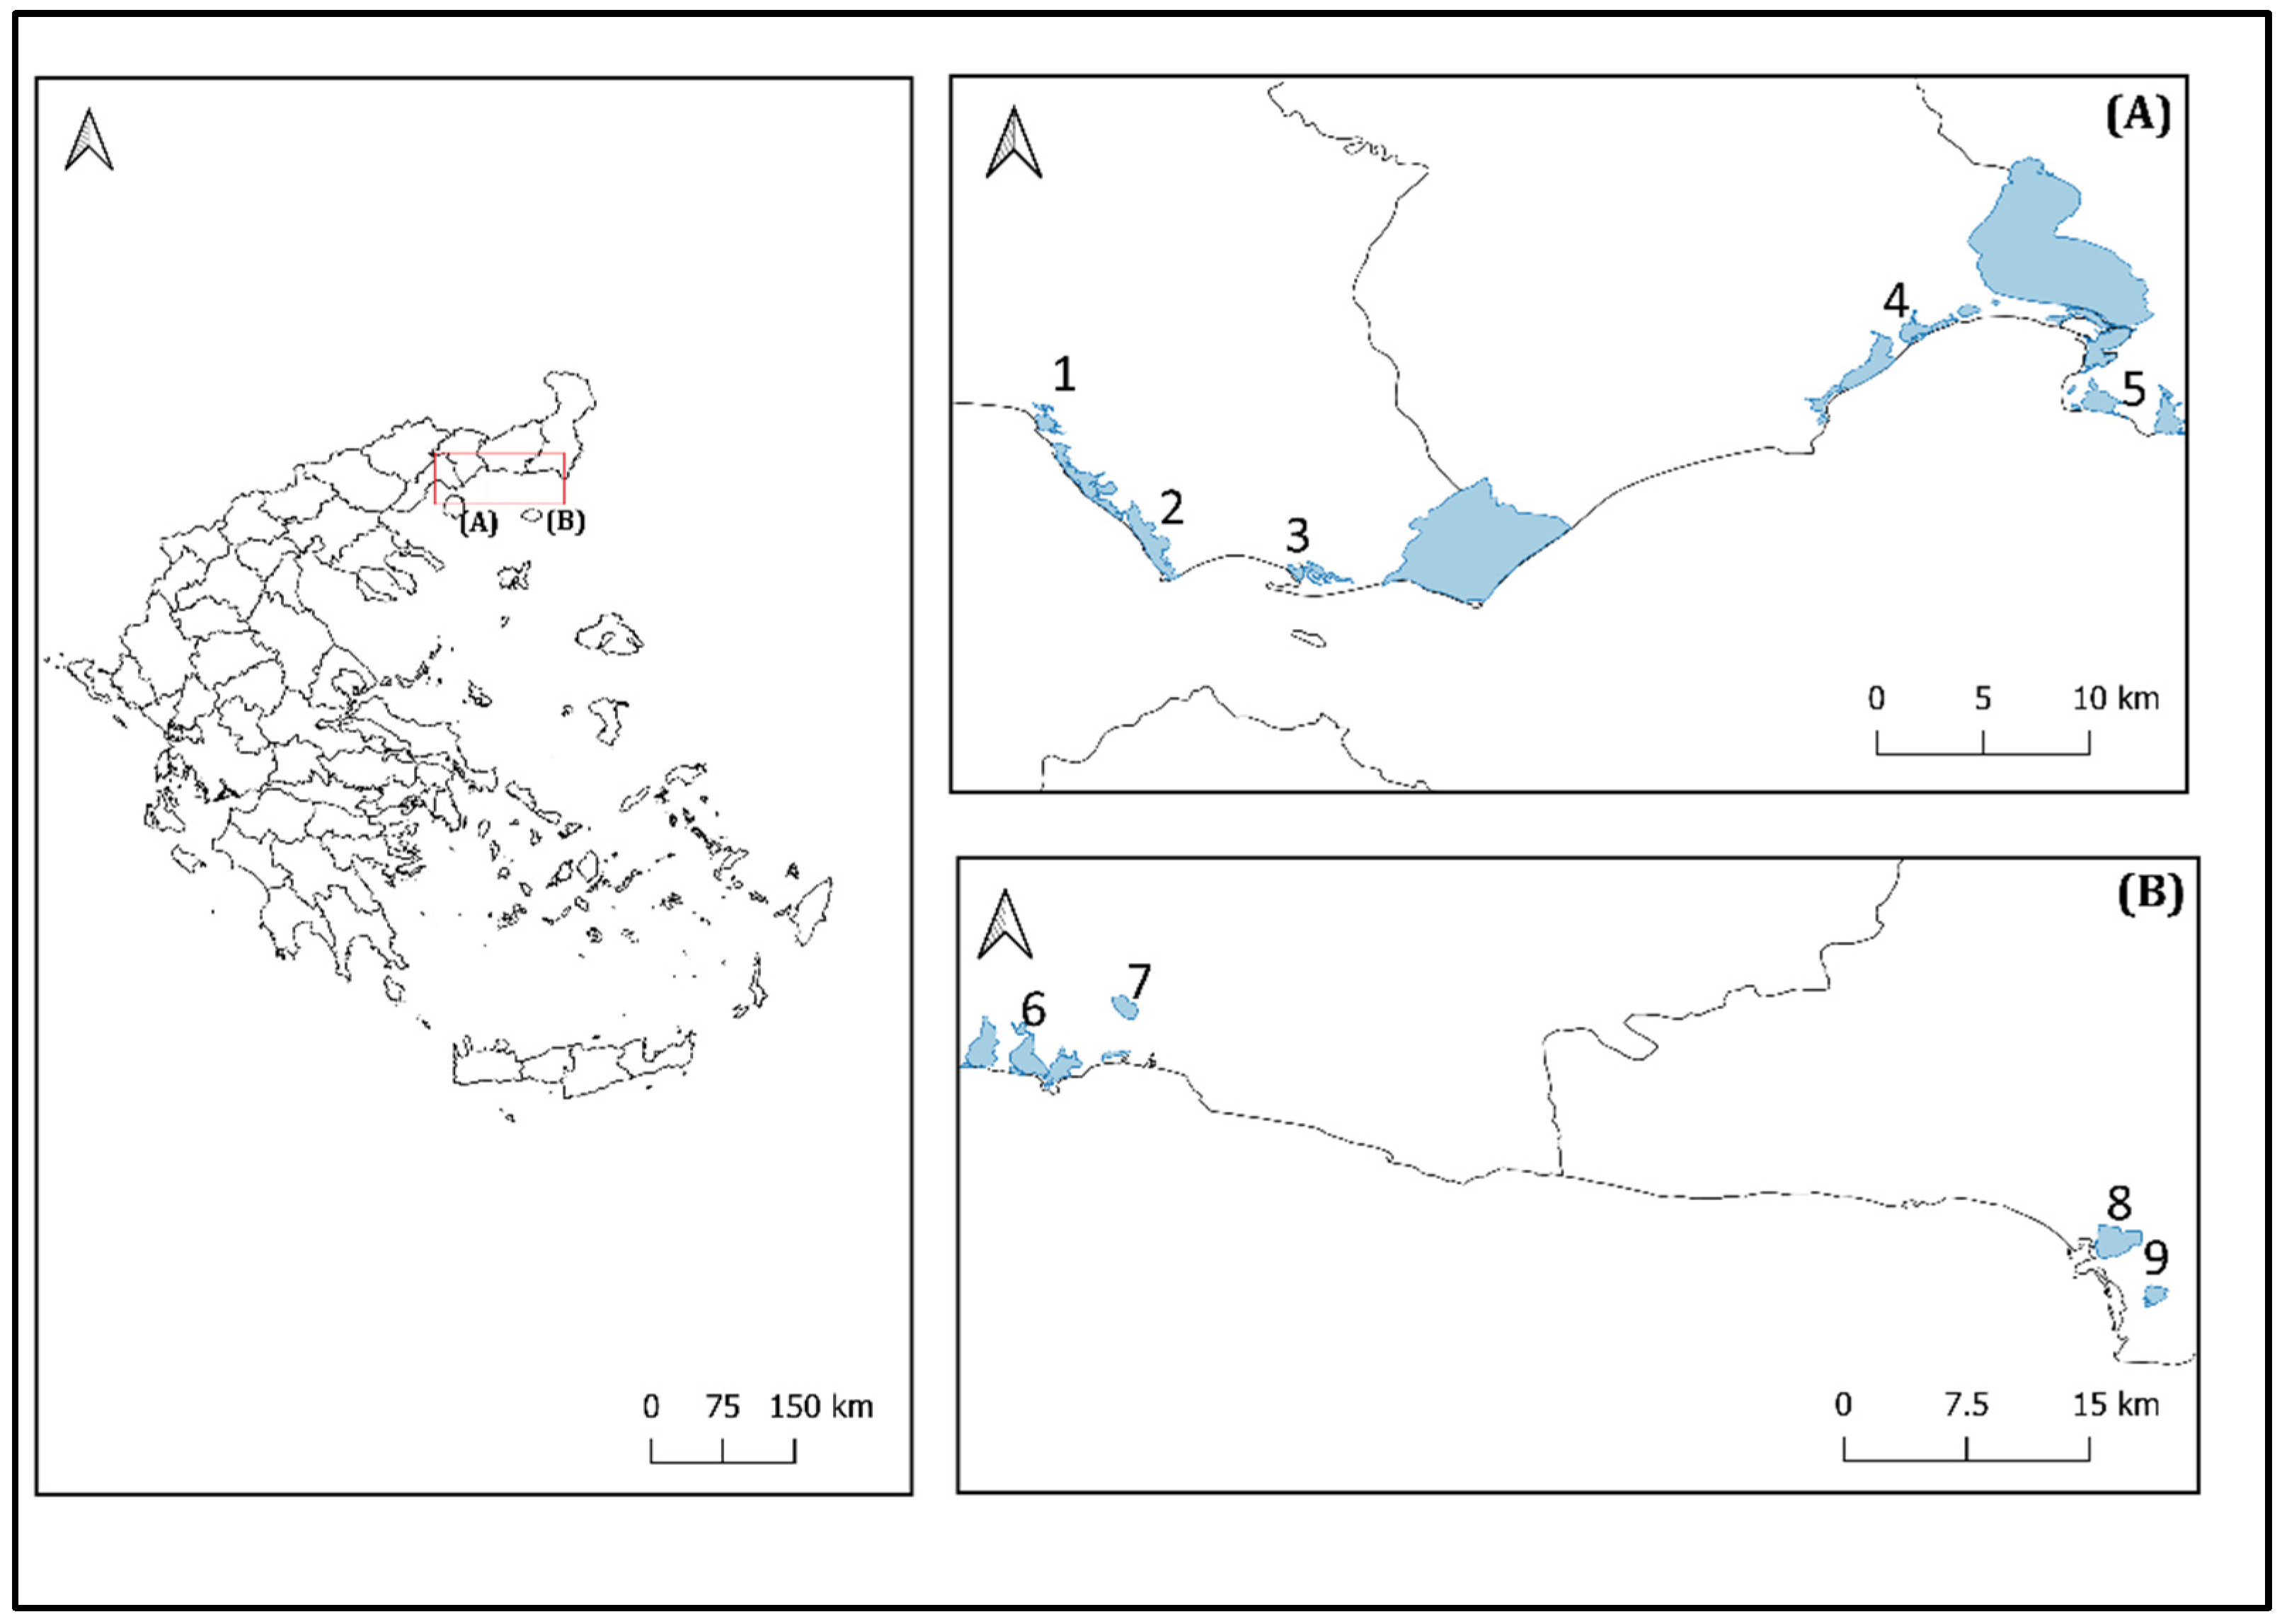
2.1. Study Area

Samplings were conducted monthly between 2013 and 2016 in nine different lagoons situated in the Region of East Macedonia and Thrace (Northern Greece) [26]. For the development of the index, the sampling data from five of these lagoons, specifically, Vassova and Keramoti lagoons in the River Nestos Delta, Monolimni and Drana lagoons in the River Evros Delta, and the Ismarida estuarine system (Figure 1), were used. The data collected from the other four lagoons, i.e., Agiasma lagoon in the River Nestos Delta, Ptelea and Xirolimni/Fanari (hereafter referred to as Fanari lagoon) from the Thracian lagoons, and Lafri from the Vistonis estuarine system, were used to test the developed index (see below) [26]. These lagoons, as mentioned before, were already assessed with indices such as CymoSkew, Ecological Evaluation Index—EEI, and CymoSkewm [27,28,29].
Vassova and Drana Lagoons, as well as the Ismarida estuarine system, are ecosystems heavily impacted by human activities, as agriculture activities take place in the neighboring areas. This has resulted in the increase in the organic and chemical load due to the fertilizers and pesticides used. Vassova is located in an area with intense cultivations (e.g., rice), close to a fertilizer production plant and a desulphurization plant, while heavy earthworks have been performed within the lagoon to improve water circulation. Drana Lagoon is situated in the River Evros Delta and was drained during the mid-1980s, as the farmers believed that the brackish water was responsible for the low productivity of the surrounding cultivations [30]. In 2004, the lagoon was re-flooded during a LIFE project, and it has been in a recovery state ever since [30]. The Ismarida estuarine system represented the last natural freshwater lake remaining in Thrace. Ismarida outflows in the Thracian Sea through a natural channel that widened in the mid-1980s to facilitate the removal of flood waters [31]. These interventions resulted in the transformation of the lake into a shallow brackish system during the dry season, as marine water enters through the channel [31].
On the other hand, Monolimni Lagoon is also situated in the River Evros Delta and used to be commercially exploited by the local Fishermen Cooperative, having fishing installations in the entrance of the lagoon. However, the lagoon’s exploitation stopped almost 20 years ago and, since then, no human intervention has been observed there [30]. Keramoti Lagoon is located in the River Nestos Delta and surrounds the Keramoti village as it extends from the east side to the west of the village. Additionally, the main road toward the village passes via a bridge over the lagoon. The construction of the bridge affects the proper water movement inside the lagoon, forming a new pressure to the normal function of the lagoon. The local Fishermen Cooperative is commercially exploiting it [26]. The urban and agricultural activities around the lagoon are the main sources of pressure on each environmental condition of the lagoon.
For the trial test of the LFI, four lagoons were used, as mentioned before: the small Agiasma Lagoon (area = 3.67 km2, average depth < 1 m) is one of the four lagoons forming the lagoonal complex of the west part of the River Nestos Delta (which also includes Vassova, Keramoti, and Eratino [26]). This lagoon is commercially exploited by the local Fishermen Cooperative and is mainly affected by the agricultural activities that have taken place around it.
Lafri Lagoon is another small-scale lagoon of area 1.42 km2 and average depth 0.50 m, situated on the East side of the River Nestos Delta. This lagoon is commercially exploited, with some agricultural activity taking place in the nearby fields, but is fairly isolated from other human activities (urban wastes) that might have an impact on it [26,32]. However, Lafri is a lagoon that suffers from algal blooms caused mainly by toxic cyanobacteria species of the genus Limnoraphis [33]. According to Orfanidis et al. [33], this is responsible for the disruption of a lagoon’s natural functions, creating unfavorable conditions for fish.
Finally, Fanari (area = 1.76 km2) and Ptelea (area = 3.38 km2) lagoons are sited on the east side of Lake Vistonida and are also commercially exploited. Fanari lagoon is situated next to the Fanari Village affected directly (i.e., urban wastes) by it, in the same way as Keramoti Lagoon [31]. On the other hand, Ptelea Lagoon is affected by the agricultural activity that is conducted around the lagoon.

2.2. Data Collection

Samplings were performed in all lagoons during summer in the period 2013–2016. Fish were collected using a 12 m × 1.2 m bag beach seine net (1.1 mm bar mesh size). The sample collection took place in both seagrass-vegetated and -unvegetated areas to verify that all fish species comprising the assemblage of each lagoon were recorded. The samplings were conducted according to the methodology proposed by Franco et al. [3] and Koutrakis et al. [31], i.e., three hauls of 30–50 m to cover an area of 250 m2 were performed during daylight in each sampling station.
All captured fish were identified at the species level and released back into the lagoon. In the case of taxonomic doubt, a sample of the unidentified specimen was kept and preserved in 6% neutralized formalin solution and transferred to the laboratory of Fisheries Research Institute, where it was identified. For each sampling, the total relative abundance was determined, by calculating the catch per unit effort (CPUE) [34]. The unit of effort for the bag seine was defined as the area swept by hauling the seine net [2,35,36] and was converted to the number of fish per 100 m2.
For the development of the index, Fishbase and available studies were used to identify the feeding strategies, habitats, and other necessary life history information for the recorded species [37].

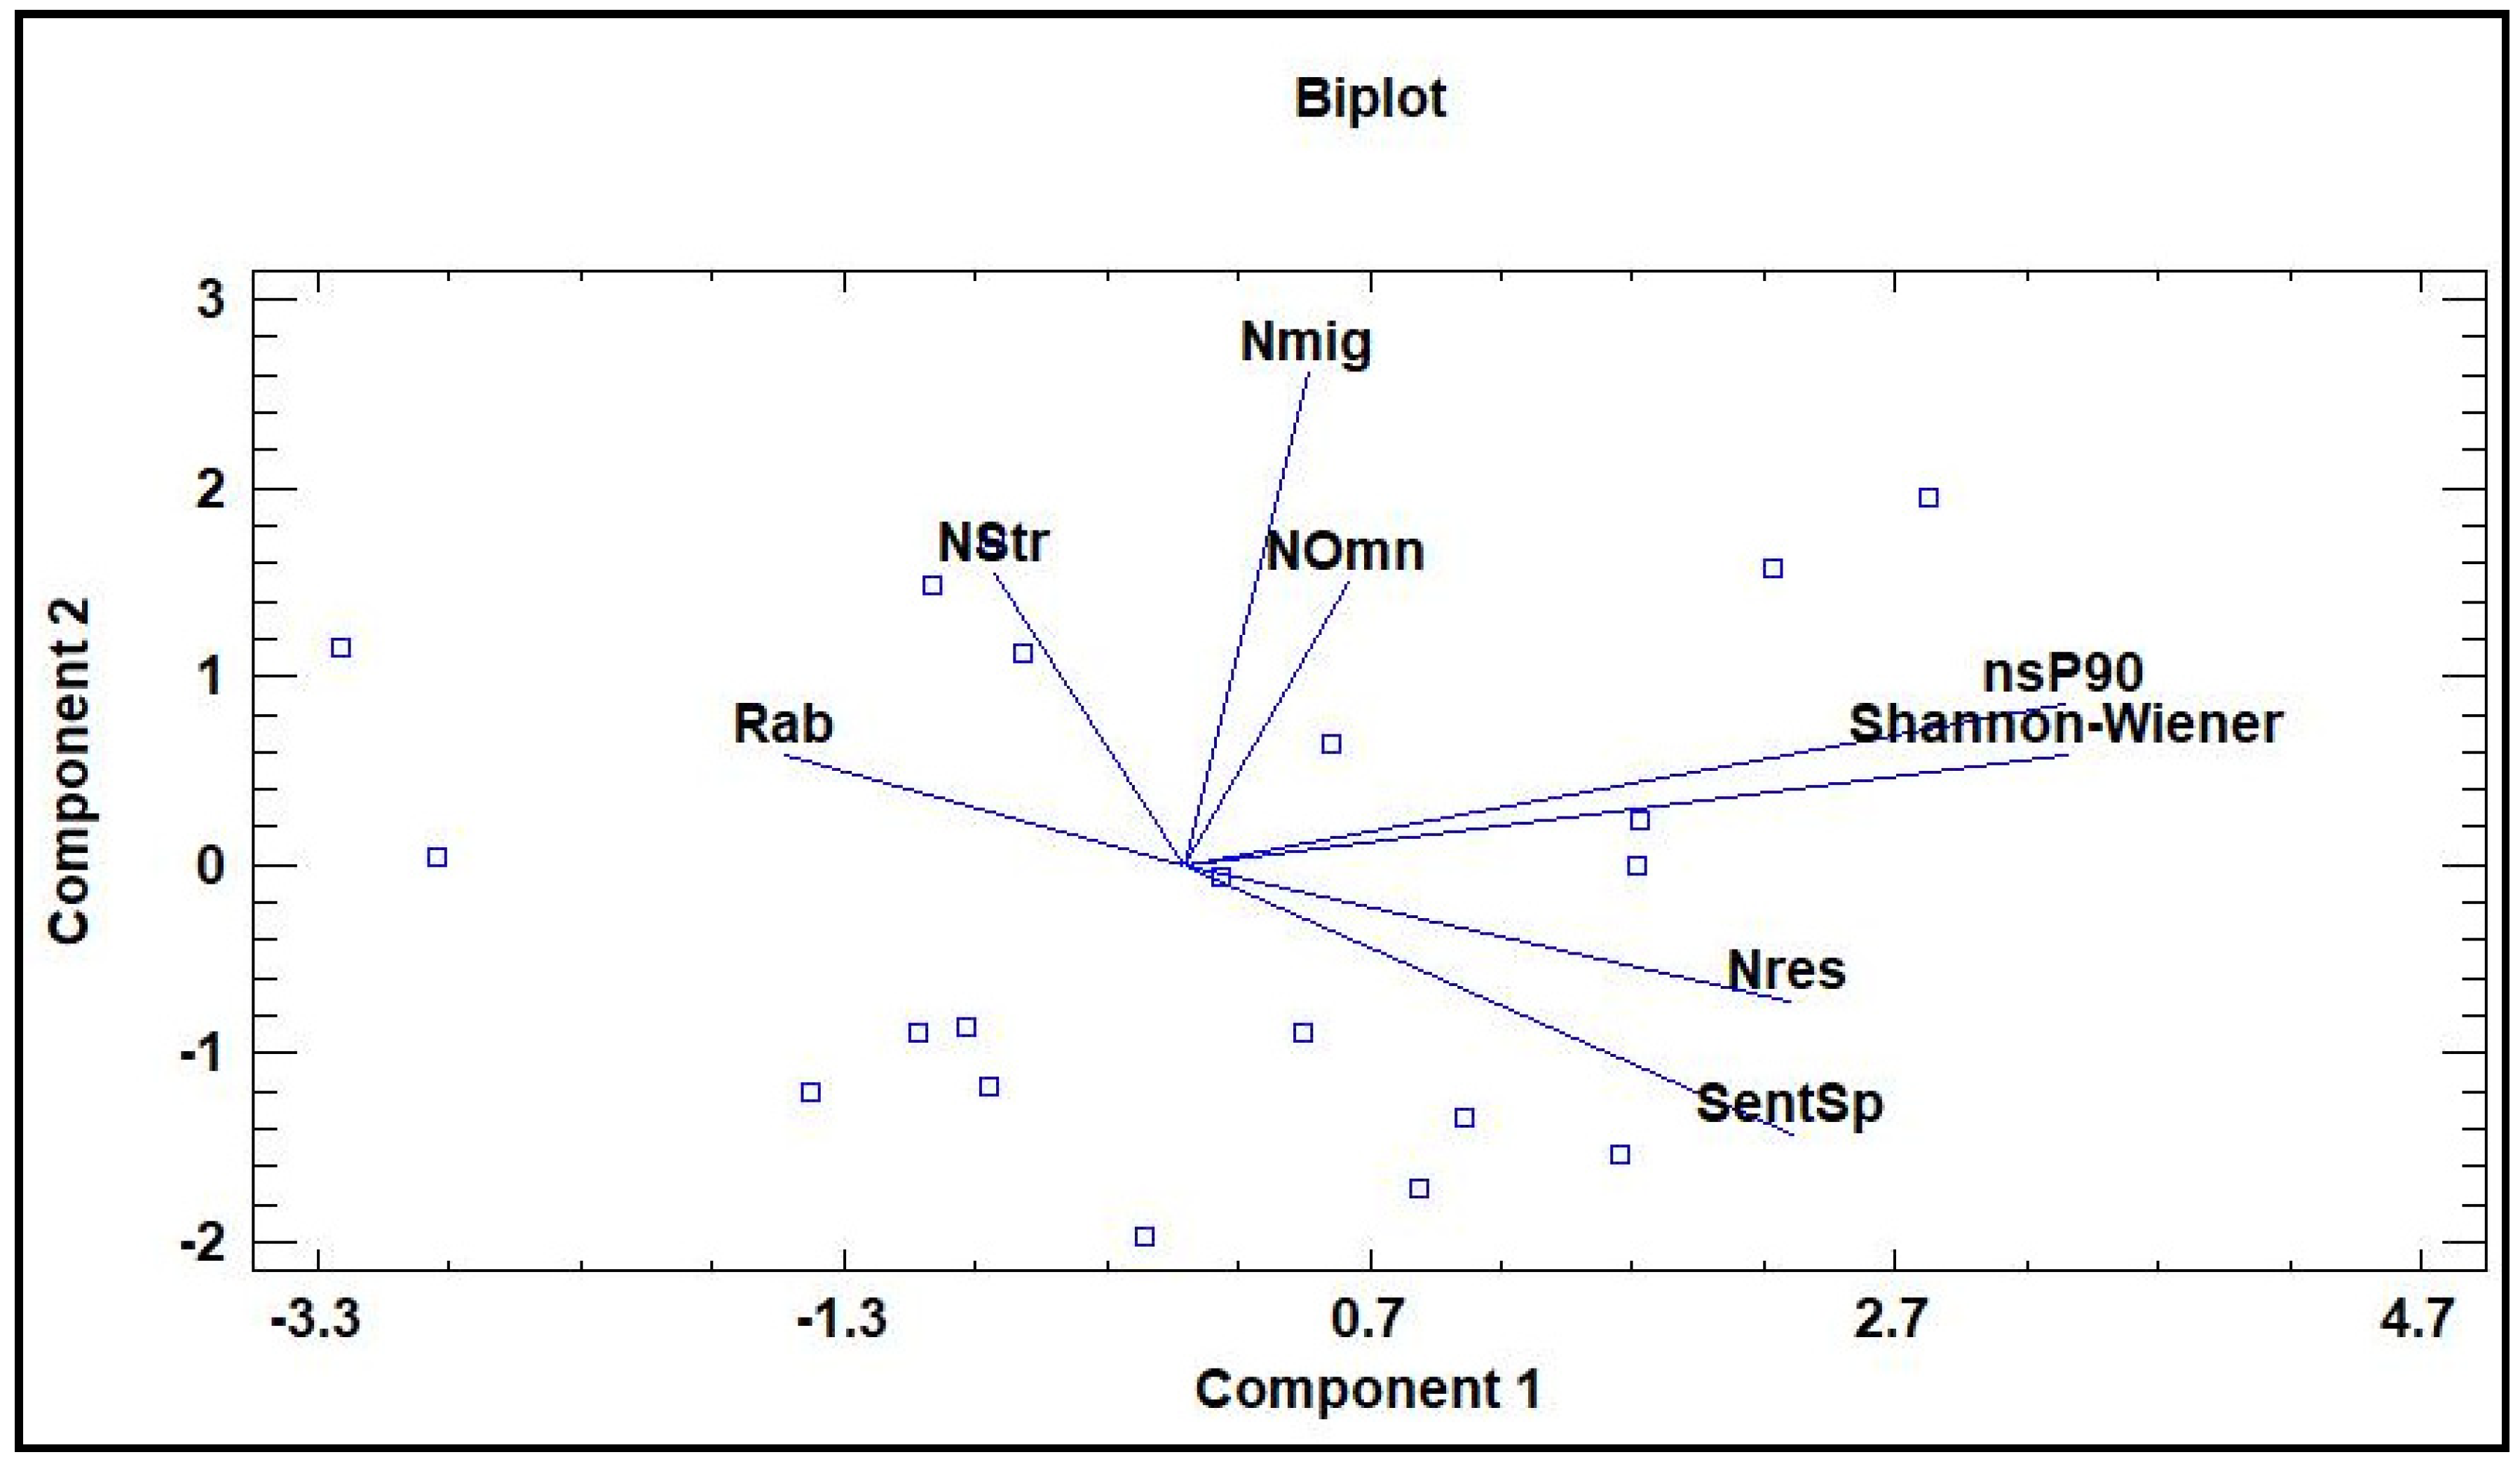
2.3. Metrics Selection

The development of the LFI was based on the principles of the Biotic Integrity Index used by Karr [23] for the assessment of the health of freshwater ecosystems in the USA based on the freshwater fish communities, but the selection of the final metrics was based on the methodology presented by Sapounidis et al. [38]. A total of 25 metrics, derived from already published and assessed indices [3,7,8,14,23,25,39,40,41,42,43,44,45,46,47], were selected based on their responsiveness to various pressures (Table 1), as has been documented by previous authors. These metrics described attributes such as the abundance and composition of the fish fauna (16 metrics) and the feeding strategies of the species (nine (9) metrics), while one metric was used to indicate the presence of a sentinel species (Table 1). The a priori hypothesis that each metric has a specific response to a disturbance, i.e., the value of a metric can increase or decrease, was accepted [3,38].

2.4. Development of Lagoon Fish-Based Index (LFI)

The WFD requires the estimation of the ecological quality/status of a water body as the deviation from reference conditions, i.e., the pristine conditions that would prevail under the absence of human interactions. Due to the inability to identify an undisturbed lagoonal ecosystem, the reference conditions were recreated from a hypothetical site in pristine condition, following the data-driven methodology [3,38,47].
The development of the index continuing with the identification of the metrics presented low responsiveness and high correlation [25,38,47,48,49]. This was performed by applying first the Spearman Rank Correlation, followed by the application of the Variation Inflation Factor (VIF), to identify which parameters inflated the overall datasets variation due to collinearity, and these parameters were removed from the further analysis. A PCA analysis was then performed, in order to exclude the metrics that failed to explain any differences among the sampling stations. The remaining metrics were those included in the Lagoon Fish-based Index.
The above-mentioned analyses were performed in R statistical and programming environment (R version 4.0.3) using the “rcorr” function from the “hmisc” package that generates the p statistic along with each correlation factor and the “vifstep” function from the “faraway” package. PCA analysis was performed in Primer v.7.0.13 software package [50].
The next step of the index development was to establish thresholds for each metric and associating a score ranging from 1 to 5. The scoring was based on the deviation of each metric’s value from the reference value established with the “data-driven methodology” [3,36,50,51,52]. The thresholds were established using the interquartile range, taking into account the deviation of each “reference value” from the median, and the maximum and minimum quartiles [53]. Depending on the deviation of each metric from the “reference value”, a value of 1 (bad ecological quality), 3 (intermediate quality), or 5 (high ecological quality), which corresponds to the hypothetical reference condition, was attributed to each metric [3,8,25,38]. The distribution range of the ecological limits in each class were determined based on the findings of Franco et al. [3] and adopted also by Sapounidis et al. [38], who established a range for each class as follows: 15% for high/bad, 20% for good/poor, and 30% for moderate condition. After the attribution of a value to each metric, the sum of the scores across metrics provides the final value of the index.
In order to comply with the WFD, the final values of the LFI were transformed into the Ecological Quality Ratio (EQR), with a value of 1 representing an excellent quality and 0 representing a bad ecological quality. The EQR was obtained by using the Equation (1) [38,54]:
EQR = (LFIlagoon − LFImin)/(LFImax − LFImin)
where LFImin is the minimum value that the index can obtain, when all the metrics score a value of 1, and LFImax is the maximum value that the index can obtain (corresponding to the hypothetical reference condition), when all the metrics score 5. LFIlagoon refers to the value of the index for the studied site.

3. Results

In total, 40 species representing 22 different families were recorded during the samplings in the nine lagoons (Table 2).

3.1. Metrics Selection and Development

The Spearman Rank Correlation test excluded 13 metrics as high correlated metrics (r > 0.95, p < 0.05). With the application of the VIF test, another 4 more metrics were excluded from the short list of the metrics composing the LFI.
The remaining eight (8) metrics (NSp90, Rab, H’ind, Nres, Nmig, NStr, SentSp, and NOmn) were tested with PCA analysis (Figure 2), which showed that four axes explained the variation among the metrics at 85.09% with an eigenvalue of 1.09. All these eight metrics were included in the Lagoon Fish-based Index (Table 3).

3.2. Defining Class Limits

The WFD requires the classification of water bodies in five categories depending on their ecological status; thus, it is necessary to define the minimum and maximum limits for each category. The values of the LFI range from a minimum value of 8, when all metrics obtain a score of “1”, and a maximum value of 38, when all metrics gain a value of “5,” except for the one corresponding to the Presence of Sensitive Species, which can only assume a value of 1 (absence) or 3 (presence) (Table 4).

3.3. Index Application

The results of the LFI assessing the ecological status of the five lagoons used for the development of the index and for the assessment of four additional lagoons located in the same region are shown in Table 5. The index categorized the lagoons as in “Moderate” or in “Poor” quality, which agreed with the expert judgment. In comparison to the benthic macrophyte species indices, the LFI was stricter considering the assessment of the ecological quality of the lagoons. The most significant example is the assessment of Fanari lagoon, categorized as “Poor” using the LFI, but scored “Good” in class categorization using CymoSkew, and even “High” using EEI.

4. Discussion

Transitional ecosystems and, specifically, the lagoons are some of the most variable and, at the same time, highly productive ecosystems [55,56]. Their variability is the result of freshwater and marine water interaction, forming dynamic systems suitable to sustain essential habitats, nursery and feeding grounds for both marine and freshwater species [1,2,3]. As a result, the fisheries’ productivity in the lagoons is very high and, thus, such systems are considered of high economic importance. However, the increased demand for fish products led to their overexploitation, which, combined with the riverine water quality deterioration, resulted in their degradation, habitats loss, and water quality deterioration.
The economic value of these areas and the implementation of the WFD have increased the efforts to develop and apply a valid system to assess the water quality [9,57], which will allow the stakeholders to implement management plans in order to improve their status, according to the WFD requirements.
The Lagoon Fish-based Index (LFI) is one of the few multimetric indices for transitional waters in the Mediterranean Region and the first index developed for the assessment of the Greek lagoons’ water quality. The fact that this index is made of only 8 metrics makes it more robust and user-friendly, compared to other more elaborate indices, such as the Habitat Fish Index (HFI) [3], which has two sets of 14 metrics (one for marshes and one for seagrass), or the Estuarine Multimetric Fish Index (EMFI) [47], with 14 metrics.
During the selection of the potential metrics, an effort was made to identify all metrics that could describe dynamic ecosystems, such as lagoons. That is the reason why metrics describing the ‘‘fish fauna composition and abundance’’ (16 metrics), such as the number of residents, and migrant and straggler species, were initially tested. The rest of the candidate metrics were those describing the fish fauna composition in terms of their feeding strategies [8]. In an ecosystem, there can be detritivores, herbivores, zooplanktivores, benthic invertebrate feeders, and piscivorous fish taxa [58], and any change in the water’s quality may affect the various food sources and, as a result, the disturbance of the equilibrium among various taxa [8]. As Karr [23], Oberdorff and Hughes [39], and Delpech et al. [56] mentioned, the omnivorous species, being opportunistic, can feed on all the available resources that can be found in an ecosystem, and thus manage to adapt to the food availability shifts. Selleslagh et al. [59] and Selleslagh and Amara [60], using trophic modeling, proved that increased anthropogenic pressure in an estuary results in a high omnivory index, i.e., high opportunistic behavior. “Total number of species” and “Relative abundance” are two of the most used metrics as the original index presented by Karr [23] and are used for both freshwater and transitional water quality assessment indices [3,13,41,42,43]. When undisturbed, a waterbody can sustain more fish species than when it is degraded as the small tolerant species tend to dominate over the numerous intolerant species.
Finally, the selection of metrics describing the composition of the fish fauna concern the life cycle of the present species (i.e., resident, migrant, and straggler) as this is indicative of the availability of habitats for spawning, feeding, and nursery grounds [3,8,46]. Thus, the resident and migrant species, being highly dependent on the lagoon system “health” and the degradation of the ecosystem, will highly affect their number [3,8,46], as a degraded ecosystem will not be able to sustain a balanced ichthyofauna [46].
The comparison of the water quality estimated by the LFI to the one estimated by other established indices using benthic macrophytic species (Ecological Evaluation Index/CymoSkew/CymoSkewm) revealed that the LFI was stricter. The LFI categorized most of the systems in the “Moderate” quality, which, according to Orfanidis et al. [27], is considered an “unstable” state, which can change to the “Bad” state without any warning. Thus, the “strictness” of our index is a desirable requirement, for enhancing the need to push for remedial actions. For the time being, the LFI could only be used for the monitoring of lagoons situated in the Region of East Macedonia and Thrace (Northern Greece). It would be worthwhile to improve the index by including data from different lagoon types such as those in Western Greece, thus enhancing its objectiveness.

Author Contributions

Conceptualization, A.S.S. and E.T.K.; methodology, A.S.S.; formal analysis, A.S.S.; investigation, A.S.S. and E.T.K.; resources, A.S.S.; data curation, A.S.S.; writing—original draft preparation, A.S.S.; writing—review and editing, A.S.S. and E.T.K.; visualization, A.S.S. All authors have read and agreed to the published version of the manuscript.

Funding

This research received no external funding.

Institutional Review Board Statement

Not applicable.

Informed Consent Statement

Not applicable.

Data Availability Statement

Not applicable.

Acknowledgments

We would like to show our gratitude to the personnel of the Department of Inland Waters and Lagoons of the Fisheries Research Institute for their contribution in data collection. Moreover, I would like to thank Papathanasiou Vasilis for his valuable help in using R statistical packages. Finally, yet importantly, we would like to thank the anonymous reviewers that helped us to improve significantly our paper.

Conflicts of Interest

The authors declare no conflict of interest.

References

  1. Elliott, M.; Hemingway, K.L. Fishes in Estuaries; Blackwell Science: Oxford, UK, 2002; p. 636. [Google Scholar]
  2. Koutrakis, E.T.; Kokkinakis, A.K.; Eleftheriadis, E.A.; Argyropoulou, M.D. Seasonal changes in distribution and abundance of the fish fauna in the two estuarine systems of Strymonikos Gulf (Macedonia, Greece). Belg. J. Zool. 2000, 130, 43–50. [Google Scholar]
  3. Franco, A.; Torricelli, P.; Franzoi, P. A habitat-specific fish-based approach to assess the ecological status of Mediterranean coastal lagoons. Mar. Pollut. Bull. 2009, 58, 1704–1717. [Google Scholar] [CrossRef] [PubMed]
  4. Lucena-Moya, P.; Pardo, I. An invertebrate multimetric index to classify the ecological status of small coastal lagoons in the Mediterranean ecoregion (MIBIIN). Mar. Freshw. Res. 2012, 63, 801–814. [Google Scholar] [CrossRef]
  5. Gamito, S.; Erzini, K. Trophic food web and ecosystem attributes of a water reservoir of the Ria Formosa (south Portugal). Ecol. Model. 2005, 181, 509–520. [Google Scholar] [CrossRef]
  6. Reizopoulou, S.; Nicolaidou, A. Index of size distribution (ISD): A method of quality assessment for coastal lagoons. Hydrobiologia 2007, 577, 141–149. [Google Scholar] [CrossRef]
  7. Deegan, L.A.; Finn, J.T.; Ayvazian, S.G.; Ryder-Kieffer, C.A.; Buonaccorsi, J. Development and validation of an estuarine biotic integrity index. Estuaries 1997, 20, 601–617. [Google Scholar] [CrossRef]
  8. Harrison, T.D.; Whitfield, A.K. A multi-metric fish index to assess the environmental condition of estuaries. J. Fish Biol. 2004, 65, 683–710. [Google Scholar] [CrossRef]
  9. Directive 2000/60/EC of the European Parliament and of the Council of 23 October 2000 Establishing a Framework for Community Action in the Field of Water Policy. Available online: https://eur-lex.europa.eu/legal-content/EN/TXT/PDF/?uri=CELEX:02000L0060-20141120&from=EN (accessed on 10 February 2021).
  10. Borja, A.; Bald, J.; Franco, J.; Larreta, J.; Muxika, I.; Revilla, M.; Rodríguez, M.I.R.; Solaun, O.; Uriarte, A.; Valencia, V. Using multiple ecosystem components, in assessing ecological status in Spanish (Basque Country) Atlantic marine waters. Mar. Pollut. Bull. 2009, 59, 54–64. [Google Scholar] [CrossRef]
  11. Borja, Á. The European water framework directive: A challenge for nearshore, coastal and continental shelf research. Cont. Shelf Res. 2005, 25, 1768–1783. [Google Scholar] [CrossRef]
  12. Borja, A. The new European Marine strategy directive: Difficulties, opportunities, and challenges. Mar. Pollut. Bull. 2006, 52, 239–242. [Google Scholar] [CrossRef]
  13. Karr, J.R.; Fausch, K.D.; Angermeier, P.L.; Yant, P.R.; Schlosser, I.J. Assessing biological integrity in running waters: A method and its rationale. Ill. Nat. Hist. Surv. Spec. Publ. 1986, 5, 28. [Google Scholar]
  14. Harris, J.H.; Silveira, R. Large-scale assessments of river health using an index of biotic integrity with low-diversity fish communities. Freshw. Biol. 1999, 41, 235–252. [Google Scholar] [CrossRef]
  15. Simon, T. The use of biological criteria as a tool for water resource management. Environ. Sci. Policy 2000, 3, 43–49. [Google Scholar] [CrossRef]
  16. Roset, N.; Grenouillet, G.; Goffaux, D.; Pont, D.; Kestemont, P. A review of existing fish assemblage indicators and methodologies. Fish. Manag. Ecol. 2007, 14, 393–405. [Google Scholar] [CrossRef]
  17. Dennison, W.C.; Orth, R.; Moore, K.A.; Stevenson, J.C.; Carter, V.; Kollar, S.; Bergstrom, P.W.; Batiuk, R.A. Assessing water quality with submersed aquatic vegetation. BioScience 1993, 43, 86–94. [Google Scholar] [CrossRef]
  18. Ballesteros, E.; Torras, X.; Pinedo, S.; García, M.; Mangialajo, L.; de Torres, M. A new methodology based on littoral community cartography dominated by macroalgae for the implementation of the European water framework directive. Mar. Pollut. Bull. 2007, 55, 172–180. [Google Scholar] [CrossRef] [PubMed]
  19. Van Dolah, R.; Hyland, J.; Holland, A.; Rosen, J.; Snoots, T. A benthic index of biological integrity for assessing habitat quality in estuaries of the southeastern USA. Mar. Environ. Res. 1999, 48, 269–283. [Google Scholar] [CrossRef]
  20. Borja, A.; Miles, A.; Occhipinti-Ambrogi, A.; Berg, T. Current status of macroinvertebrate methods used for assessing the quality of European marine waters: Implementing the water framework directive. Hydrobiologia 2009, 633, 181–196. [Google Scholar] [CrossRef]
  21. Whitfield, A.K.; Elliott, M. Fishes as indicators of environmental and ecological changes within estuaries: A review of progress and some suggestions for the future. J. Fish Biol. 2002, 61, 229–250. [Google Scholar] [CrossRef]
  22. Pérez-Domínguez, R.; Maci, S.; Courrat, A.; Lepage, M.; Borja, A.; Uriarte, A.; Neto, J.M.; Cabral, H.; Raykov, V.; Franco, A.; et al. Current developments on fish-based indices to assess ecological-quality status of estuaries and lagoons. Ecol. Indic. 2012, 23, 34–45. [Google Scholar] [CrossRef]
  23. Karr, J.R. Assessment of biotic integrity using fish communities. Fisheries 1981, 6, 21–27. [Google Scholar] [CrossRef]
  24. Fausch, K.D.; Lyons, J.; Karr, J.R.; Angermeier, P.L. Fish communities as indicators of environmental degradation. Am. Fish. Soc. Symp. 1990, 8, 123–144. [Google Scholar]
  25. Breine, J.J.; Maes, J.; Quataert, P.; Bergh, E.V.D.; Simoens, I.; van Thuyne, G.; Belpaire, C. A fish-based assessment tool for the ecological quality of the brackish Schelde estuary in Flanders (Belgium). Hydrobiologia 2007, 575, 141–159. [Google Scholar] [CrossRef]
  26. Koutrakis, E.T.; Conides, A.; Parpoura, A.C.; van Ham, E.H.; Katselis, G.; Koutsikopoulos, C. Lagoon fisheries resources in hellas. In State of Hellenic Fisheries; Papaconstantinou, C., Zenetos, A., Vassilopoulou, V., Tserpes, G., Eds.; HCMR Publications: Anavyssos, Greece, 2007; pp. 223–233. [Google Scholar]
  27. Orfanidis, S.; Papathanasiou, V.; Mittas, N.; Theodosiou, T.; Ramfos, A.; Tsioli, S.; Kosmidou, M.; Kafas, A.; Mystikou, A.; Papadimitriou, A. Further improvement, validation, and application of CymoSkew biotic index for the ecological status assessment of the Greek coastal and transitional waters. Ecol. Indic. 2020, 118, 106727. [Google Scholar] [CrossRef]
  28. Orfanidis, S.; Panayotidis, P.; Stamatis, N. Ecological evaluation of transitional and coastal waters: A marine benthic macrophytes-based model. Mediterr. Mar. Sci. 2001, 2, 45. [Google Scholar] [CrossRef]
  29. Papathanasiou, V.; Orfanidis, S. Anthropogenic eutrophication affects the body size of Cymodocea nodosa in the North Aegean Sea: A long-term, scale-based approach. Mar. Pollut. Bull. 2018, 134, 38–48. [Google Scholar] [CrossRef]
  30. Koutrakis, E.; Sylaios, G.; Kamidis, N.; Markou, D.; Sapounidis, A. Fish fauna recovery in a newly re-flooded Mediterranean coastal lagoon. Estuar. Coast. Shelf Sci. 2009, 83, 505–515. [Google Scholar] [CrossRef]
  31. Koutrakis, E.; Emfietzis, G.; Sylaios, G.; Zoidou, M.; Katsiapi, M.; Moustaka-Gouni, M. Massive fish mortality in Ismarida Lake, Greece: Identification of drivers contributing to the fish kill event. Mediterr. Mar. Sci. 2016, 17, 280. [Google Scholar] [CrossRef] [Green Version]
  32. Zoidou, M.; Sylaios, G. Ecological risk assessment of heavy metals in the sediments of a Mediterranean lagoon complex. J. Environ. Health Sci. Eng. 2021, 1–15. [Google Scholar] [CrossRef]
  33. Orfanidis, S.; Stamatis, N.; Parasyri, A.; Mente, M.S.; Zerveas, S.; Pigada, P.; Papadimitriou, A.; Paschou, M.; Nisiforou, O.; Papazi, A.; et al. Solving nuisance cyanobacteria eutrophication through biotechnology. Appl. Sci. 2019, 9, 2566. [Google Scholar] [CrossRef] [Green Version]
  34. Gulland, J.A. Catch per unit effort as a measure of abundance. Rapports et procès-verbaux des reunions. Comm. Int. Pour L’explor. Sci. Mer Méditerr. 1964, 155, 8–14. [Google Scholar]
  35. Maraisand, J.; Baird, D. Seasonal abundance distribution and catch per unit effort of fishes in the Swartkops Estuary. S. Afr. J. Zool. 1980, 15, 66–71. [Google Scholar] [CrossRef] [Green Version]
  36. Koutrakis, E.T.; Sinis, A.I.; Economidis, P.S. Seasonal occurrence, abundance and size distribution of grey mullet fry (Pisces, Mugilidae) in the Porto-Lagos Lagoon and Lake Vistonis (Aegean Sea, Greece). Isr. J. Aquac. Bamidgeh 1994, 46, 182–196. [Google Scholar]
  37. Froese, R.; Pauly, D. (Eds.) FishBase. Available online: www.fishbase.org (accessed on 10 February 2021).
  38. Sapounidis, A.; Koutrakis, E.; Leonardos, I. Fish-based river integrity index: A first attempt in developing a water quality index for the assessment of the Greek rivers. Ecohydrol. Hydrobiol. 2019, 19, 620–628. [Google Scholar] [CrossRef]
  39. Oberdorff, T.; Hughes, R.M. Modification of an index of biotic integrity based on fish assemblages to characterize rivers of the Seine-Normandie basin, France. Hydrobiologia 1992, 228, 117–130. [Google Scholar] [CrossRef]
  40. Oberdorff, T.; Pont, D.; Hugueny, B.; Porcher, J.-P. Development and validation of a fish-based index for the assessment of ‘river health’ in France. Freshw. Biol. 2002, 47, 1720–1734. [Google Scholar] [CrossRef]
  41. Moyle, P.; Randall, P. Biotic Integrity of Watesheds. Sierra Nevada Ecosystem Project: Final Report to Congress; University of California: Davis, CA, USA, 1996; Volume 2, pp. 975–985. [Google Scholar]
  42. Belpaire, C.; Smolders, R.; Auweele, I.V.; Ercken, D.; Breine, J.; van Thuyne, G.; Ollevier, F. An index of biotic integrity characterizing fish populations and the ecological quality of Flandrian water bodies. Hydrobiologia 2000, 434, 17–33. [Google Scholar] [CrossRef]
  43. Meng, L.; Orphanides, C.D.; Powell, J.C. Use of a fish index to assess habitat quality in Narragansett Bay, Rhode Island. Trans. Am. Fish. Soc. 2002, 131, 731–742. [Google Scholar] [CrossRef]
  44. Hermoso, V.; Clavero, M.; Blanco-Garrido, F.; Prenda, J. Assessing the ecological status in species-poor systems: A fish-based index for Mediterranean Rivers (Guadiana River, SW Spain). Ecol. Indic. 2010, 10, 1152–1161. [Google Scholar] [CrossRef] [Green Version]
  45. Harrison, T.D.; Kelly, F.L. Development of an estuarine multi-metric fish index and its application to Irish transitional waters. Ecol. Indic. 2013, 34, 494–506. [Google Scholar] [CrossRef]
  46. Cooper, M.J.; Lamberti, G.A.; Moerke, A.H.; Ruetz, C.R.; Wilcox, D.A.; Brady, V.J.; Brown, T.N.; Ciborowski, J.J.H.; Gathman, J.P.; Grabas, G.P.; et al. An expanded fish-based index of biotic integrity for Great Lakes coastal wetlands. Environ. Monit. Assess. 2018, 190, 1–30. [Google Scholar] [CrossRef] [PubMed] [Green Version]
  47. Bozzetti, M.; Schulz, U.H. An index of biotic integrity based on fish assemblages for subtropical streams in southern Brazil. Hydrobiologia 2004, 529, 133–144. [Google Scholar] [CrossRef]
  48. Breine, J.; Simoens, I.; Goethals, P.; Quataert, P.; Ercken, D.; van Liefferinghe, C.; Belpaire, C. A fish-based index of biotic integrity for upstream brooks in Flanders (Belgium). Hydrobiologia 2004, 522, 133–148. [Google Scholar] [CrossRef]
  49. Lyons, J. A fish-based index of biotic integrity to assess intermittent headwater streams in Wisconsin, USA. Environ. Monit. Assess. 2006, 122, 239–258. [Google Scholar] [CrossRef] [PubMed]
  50. Clarke, K.R.; Gorley, R.N. PRIMER v7. User Manual/Tutorial; PRIMER-e: Plymouth, UK, 2015. [Google Scholar]
  51. Paganelli, D.; Forni, G.; Marchini, A.; Mazziotti, C.; Occhipinti-Ambrogi, A. Critical appraisal on the identification of reference conditions for the evaluation of ecological quality status along the Emilia-Romagna coast (Italy) using M-AMBI. Mar. Pollut. Bull. 2011, 62, 1725–1735. [Google Scholar] [CrossRef]
  52. Borja, Á.; Dauer, D.M.; Grémare, A. The importance of setting targets and reference conditions in assessing marine ecosystem quality. Ecol. Indic. 2012, 12, 1–7. [Google Scholar] [CrossRef]
  53. Zar, J.H. Biostatistical Analysis; Prentice Hall: Hoboken, NJ, USA, 1999; 663p. [Google Scholar]
  54. Romero, J.; Martínez-Crego, B.; Alcoverro, T.; Pérez, M. A multivariate index based on the seagrass Posidonia oceanica (POMI) to assess ecological status of coastal waters under the water framework directive (WFD). Mar. Pollut. Bull. 2007, 55, 196–204. [Google Scholar] [CrossRef] [PubMed]
  55. Franco, A.; Pérez-Ruzafa, A.; Drouineau, H.; Franzoi, P.; Koutrakis, E.; Lepage, M.; Verdiell-Cubedo, D.; Bouchoucha, M.; López-Capel, A.; Riccato, F.; et al. Assessment of fish assemblages in coastal lagoon habitats: Effect of sampling method. Estuar. Coast. Shelf Sci. 2012, 112, 115–125. [Google Scholar] [CrossRef]
  56. Delpech, C.; Courrat, A.; Pasquaud, S.; Lobry, J.; le Pape, O.; Nicolas, D.; Boët, P.; Girardin, M.; Lepage, M. Development of a fish-based index to assess the ecological quality of transitional waters: The case of French estuaries. Mar. Pollut. Bull. 2010, 60, 908–918. [Google Scholar] [CrossRef] [Green Version]
  57. Elliott, M.; McLusky, D. The need for definitions in understanding estuaries. Estuar. Coast. Shelf Sci. 2002, 55, 815–827. [Google Scholar] [CrossRef] [Green Version]
  58. Whitfield, A.K. Biology and Ecology of Fishes in Southern African Estuaries; J.L.B. Smith Institute of Ichthyology: Grahamstown, South Africa, 1998; p. 244. [Google Scholar]
  59. Selleslagh, J.; Lobry, J.; Amara, R.; Brylinski, J.-M.; Boët, P. Trophic functioning of coastal ecosystems along an anthropogenic pressure gradient: A French case study with emphasis on a small and low impacted estuary. Estuar. Coast. Shelf Sci. 2012, 112, 73–85. [Google Scholar] [CrossRef]
  60. Selleslagh, J.; Amara, R. Are estuarine fish opportunistic feeders? The case of a low anthropized nursery ground (the Canche Estuary, France). Chesap. Sci. 2014, 38, 252–267. [Google Scholar] [CrossRef]
Figure 1. Map of the East Macedonia and Thrace Region (A, B), where the studied lagoons are situated (1 = Vassova L., 2 = Agiasma L., 3 = Keramoti L., 4 = Lafri L., 5 =Fanari/Xirolimni, 6 = Ptelea L., 7 = Ismarida system, 8 = Drana L., 9 = Monolimni L.).
Water 13 03008 g001
Figure 2. PCA analysis of the eight metrics that were included in the LFI. The first four axes explained the variation among those metrics at 85.09% with an eigenvalue of 1.09. The analysis indicates that the eight parameters are important in explaining the differences between the sampling stations.
Water 13 03008 g002
Table 1. The 25 potential metric indicators that were tested during the development of the Fish-based River Integrity Index and their predicted response to various stressors. All potential metrics were included in other indices [3,7,8,14,23,26,39,40,41,42,43,44,45,46,47].
Candidate MetricsAbbreviationResponse to Environmental Stress
Fish fauna composition
1Total number of speciesTotNSp
2Number of familiesNfam
3Number of species comprising 90% of total individuals90%TotInd
4Relative abundance of all speciesRab
5H’ (Shannon–Wiener index)H’ind
6J’ (Pielou’s evenness)J’ind
71-_λ’ (Simpson diversity index)1-_λ’
8Number of Resident speciesNres
9Residents (% species)%ResSp
10Number of migrant speciesNmig
11Migrants (% species)%MigrSp
12Number of Straggler speciesNstr
13Stragglers (% species)%StrgSp
14Number of Benthic species (Soleidae, Gobiidae, etc.)NBenthSp
15(Pelagic+Benthopelagic)/Benthic
16Presence of Sentinel speciesSentSp
Feeding strategies
17Number of OmnivoresNOmn
18Omnivores (% species)%OmnSp
19Number of CarnivoresNCarn
20Carnivores (% species)%CarnSp
21Number of benthic feedersNBenth
22Benthic Feeders (% species)%BenthSp.
23Piscivores (% species)%PiscSp
24Dentrivores (% species)%DentrSp
25Number of Trophic guildsTrophGuil
Table 2. The fish species recorded during the samplings conducted in the nine lagoons of East Macedonia and Thrace Region in 2013–2016. The basic traits of each species, i.e., diet, life history, and the habitat they prefer (F = Freshwater, B = Brackish, M = Marine), as they are depicted in www.fishbase.se (accessed on 10 February 2021), are also provided.
FamilySpeciesTrophic GuildLife Cycle CategoryHabitat
1AnguillidaeAnguilla anguilla (Linnaeus, 1758)CarnivoreDiadromousF, B, M
2ArgentinidaeArgentina sphyraena (Linnaeus, 1758)CarnivoreStragglerM
3AtherinidaeAtherina boyeri (Risso, 1810) CarnivoreResidentB, M
4BlenniidaeSalaria pavo (Risso, 1810)OmnivoreResidentB, M
5BothidaeArnoglossus thori (Kyle, 1913)CarnivoreStragglerM
6CallionymidaeCallionymus risso (Lesueur, 1814)CarnivoreMigrantM
7Callionymus pusillus (Delaroche, 1809)CarnivoreMigrantM
8ClupeidaeSardina pilchardus (Walbaum, 1792)CarnivoreStragglerM
9CyprinidaeCarassius gibelio (Linnaeus, 1758)OmnivoreStragglerF
10Vimba melanops (Heckel, 1837)OmnivoreStragglerF
11CyprinodontidaeAphanius faschiatus (Valenciennes, 1821)OmnivoreResidentB
12GobiidaeZosterisessor ophiocephalus (Pallas, 1814)CarnivoreResidentB
13EngraulidaeEngraulis engrasicholus (Linnaeus, 1758)CarnivoreStragglerM
14GasterosteidaeGasterosteus aculeatus (Linnaeus, 1758)CarnivoreMigrantF, B, M
15GobiidaeGobius niger (Linnaeus, 1758)CarnivoreResidentB, M
16Knipowitschia caucasica (Berg, 1916)CarnivoreMigrantF, B, M
17Pomatoschistus marmoratus (Risso, 1810)CarnivoreResidentF, B, M
18Pomatoschistus microps (Krøyer, 1838)CarnivoreResidentF, B, M
19Thorogobius ephipiatus (Lowe, 1839)CarnivoreStragglerM
20LabridaeSymphodus cinereus (Bonnaterre, 1788)CarnivoreStragglerM
21Symphodus roissali (Risso, 1810)CarnivoreStragglerM
22MoronidaeDicentrarchus labrax (Linnaeus, 1758)CarnivoreMigrantM, E
23MugilidaeChelon labrosus (Risso, 1826)OmnivoreMigrantM, E
24Liza ramada (Risso, 1826)OmnivoreMigrantM, E
25Liza saliens (Risso, 1810)OmnivoreMigrantM, E
26Mugil cephalus (Linnaeus, 1758)OmnivoreMigrantM, E
27MullidaeMullus barbatus (Linnaeus, 1758)CarnivoreStragglerM
28PoeciliidaeGambusia holbrooki (Baird and Girard, 1853)CarnivoreIntroducedF, M
29ScophthalmidaeScophthalmus rhombus (Linnaeus, 1758)CarnivoreStragglerM
30SoleidaeMicrochirus variegatus (Donovan, 1808) CarnivoreMigrantM
31Solea solea (Linnaeus, 1758)CarnivoreMigrantM
32SparidaeDentex marocanus (Valenciennes, 1830)CarnivoreStragglerM
33Diplodus annularis (Linnaeus, 1758)CarnivoreMigrantM
34Diplodus sargus (Linnaeus, 1758)OmnivoreMigrantM
35Lithognathus mormyrus (Linnaeus, 1758)CarnivoreMigrantM, E
36Liza aurata (Risso, 1810)OmnivoreMigrantM, E
37Sparus aurata (Linnaeus, 1758)CarnivoreMigrantM, E
38SyngnathidaeSyngnathus abaster (Risso, 1826)OmnivoreMigrantF, B, M
39Syngnathus acus (Linnaeus, 1758)OmnivoreResidentB, M
40Syngnathus typhle (Linnaeus, 1758)OmnivoreResidentF, B, M
Table 3. The thresholds obtained for each metric consisting of the multimetric index for the assessment of the water quality of Greek lagoons (LFI), using the interquartile range and taking into consideration the deviation of each “reference value” from the median, and the maximum and minimum quartiles.
MetricAbbreviation of the Metric135
1Total Number of Species consisting the 90% of the total recordedNSp90<22–4>4
2Relative AbundanceRab<77.677.6–879.69>879.69
3Shannon-Wiener IndexH’ind<0.600.60–1.33>1.33
4Number of ResidentsNres<33–5>5
5Number of MigrantsNmig>33–5<5
6Number of StragglersNStr<22–4>4
7Presence of Sensitive SpeciesSentSpAbsentPresent
8Number of OmnivoresNOmn>42–4<2
Table 4. The distribution range of LFI’s ecological limits in each class, according to Franco et al. [3] and Sapounidis et al. [38]. The column “LFI” provides the ecological limits using the total scores of the proposed index, while LFIEQR provides the limits among the classes after the transformation of LFI scores to EQR based on the requirements of the WFD.
ClassLFILFIEQR
High≥33.5–38≥0.85–1.00
Good≥27.5–<33.5≥0.65–<0.85
Moderate≥18.5–<27.50.35≥–<0.65
Poor≥12.5–<18.5≥0.15–<0.35
Bad8–<12.50–<0.15
Table 5. Implementation of the LFI in lagoons situated in Northern Greece (Region of East Macedonia and Thrace). Shown in bold are the lagoons used for the development of the index. The results of the LFI are compared to expert judgment and three other indices using benthic macrophytic species (CymoSkew/Ecological Evaluation Index EEI/CymoSkewm).
LagoonLFIExpert JudgmentCymoSkew [28]EEI [29]CymoSkewm [30]
DranaModerateModerate Good
MonolimniGoodModerate
KeramotiPoorPoorModeratePoor
IsmaridaModeratePoor Poor
VassovaModeratePoor Moderate
AgiasmaModerateModerateGoodModerate
PteleaModerateModerate Good
Xirolimni/FanariPoorModerate HighGood
LafriModerateModerate
Publisher’s Note: MDPI stays neutral with regard to jurisdictional claims in published maps and institutional affiliations.

