
Matrix Suction Evaluation of Soil-Rock Mixture Based on Electrical Resistivity


Abstract
1. Introduction
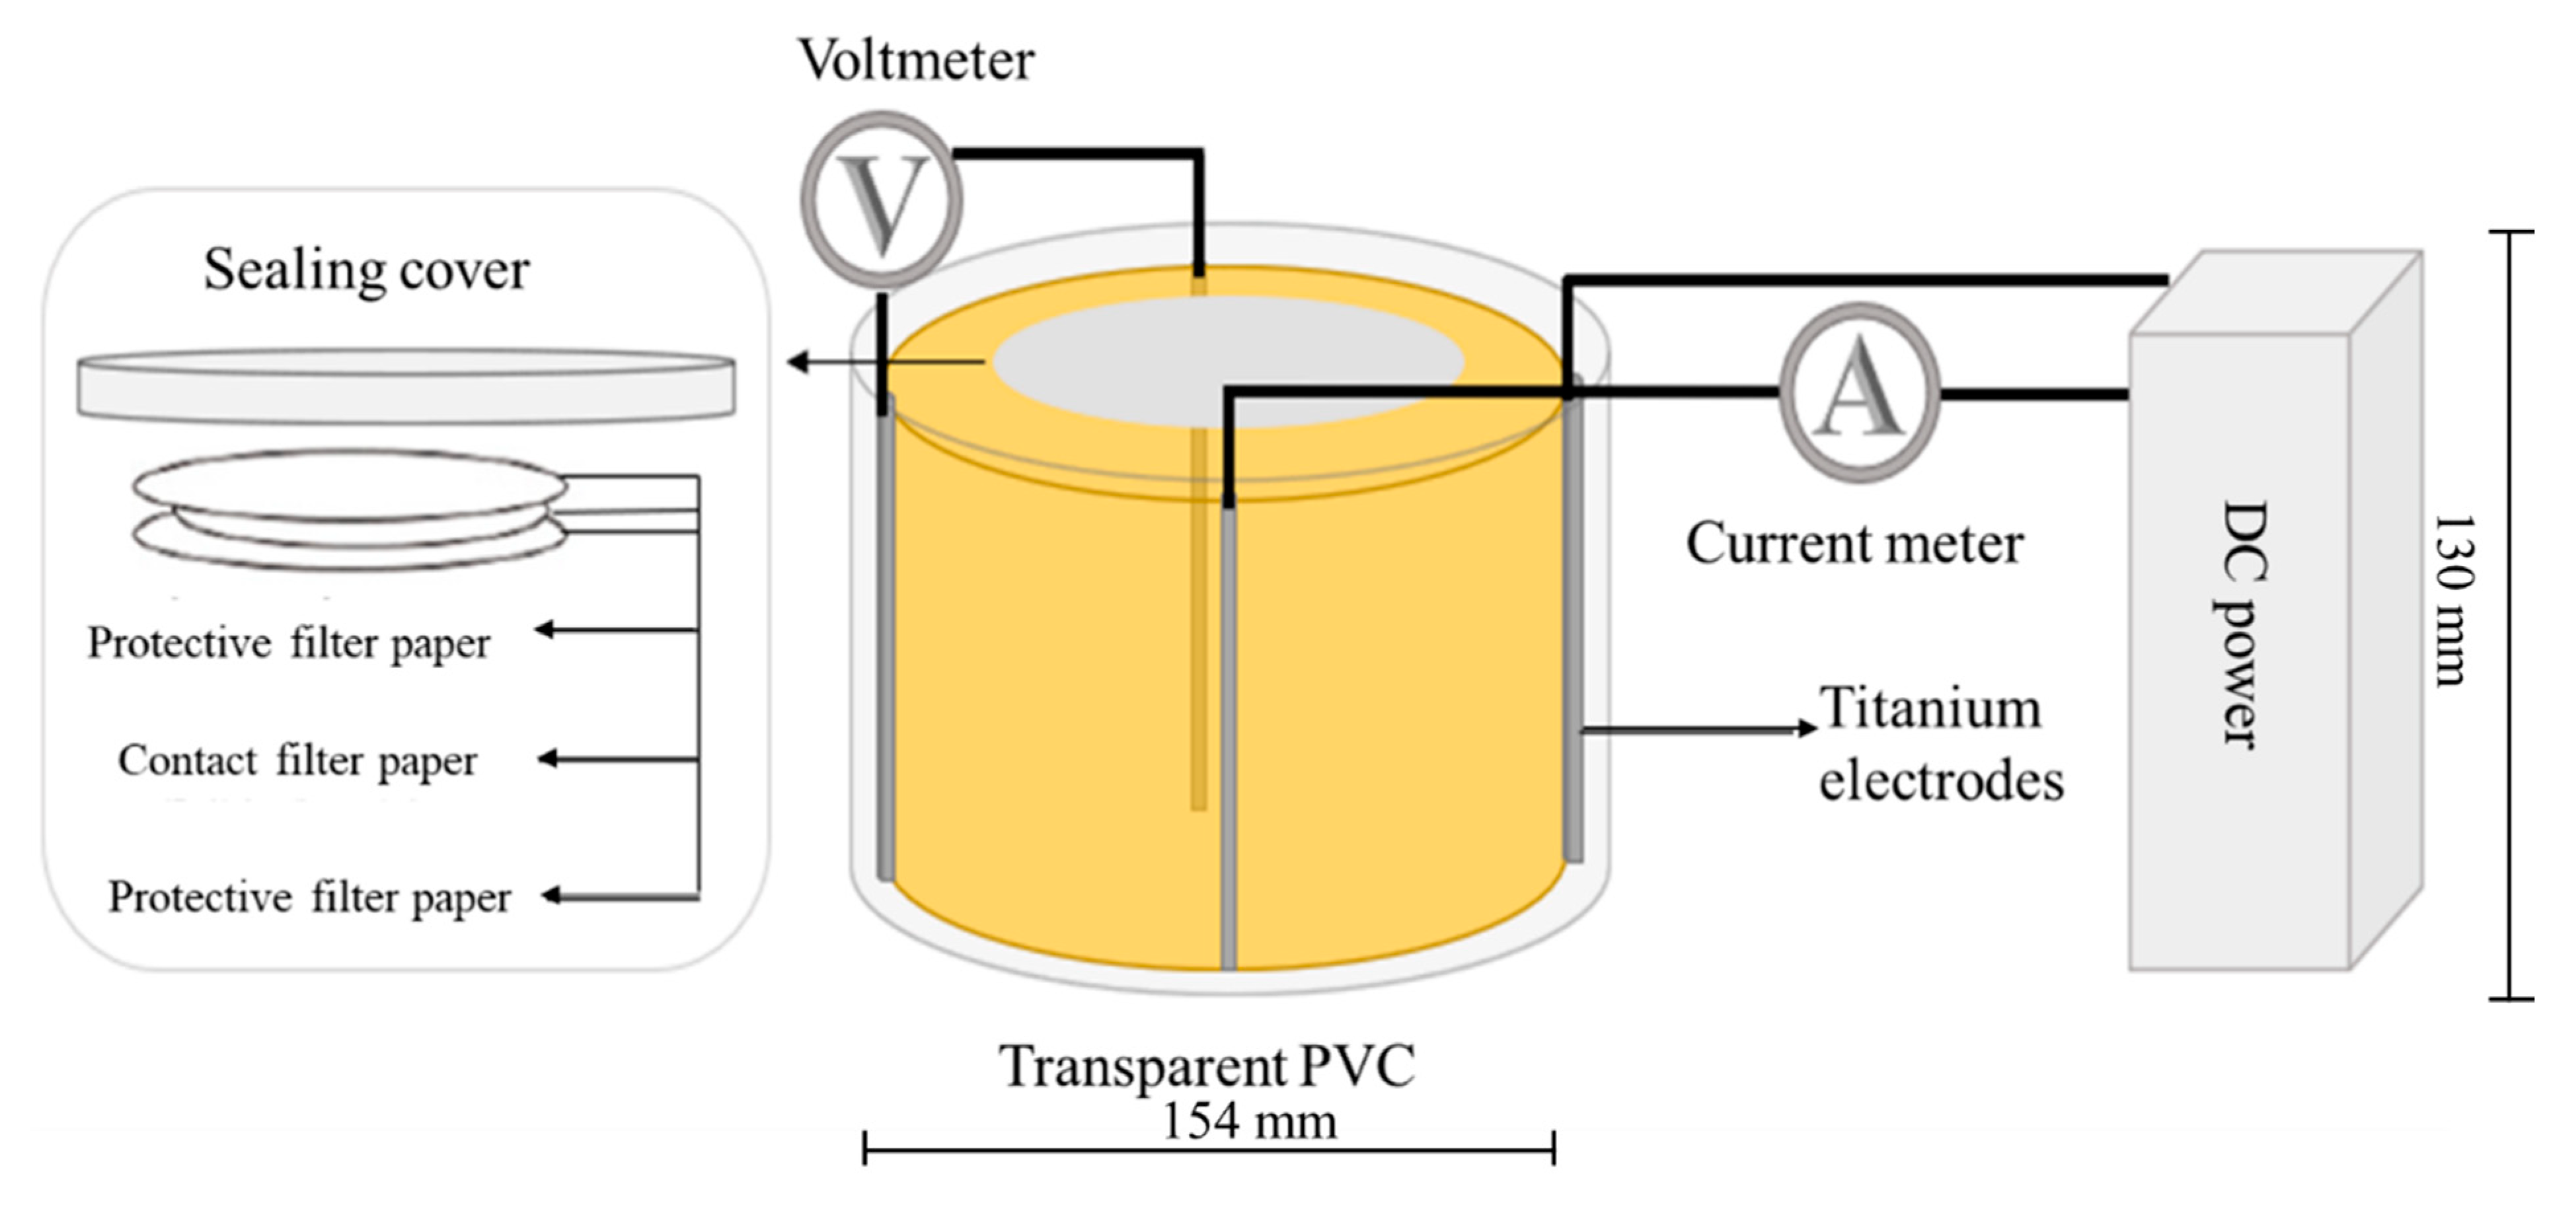
2. Test Setup
2.1. Test Electrode
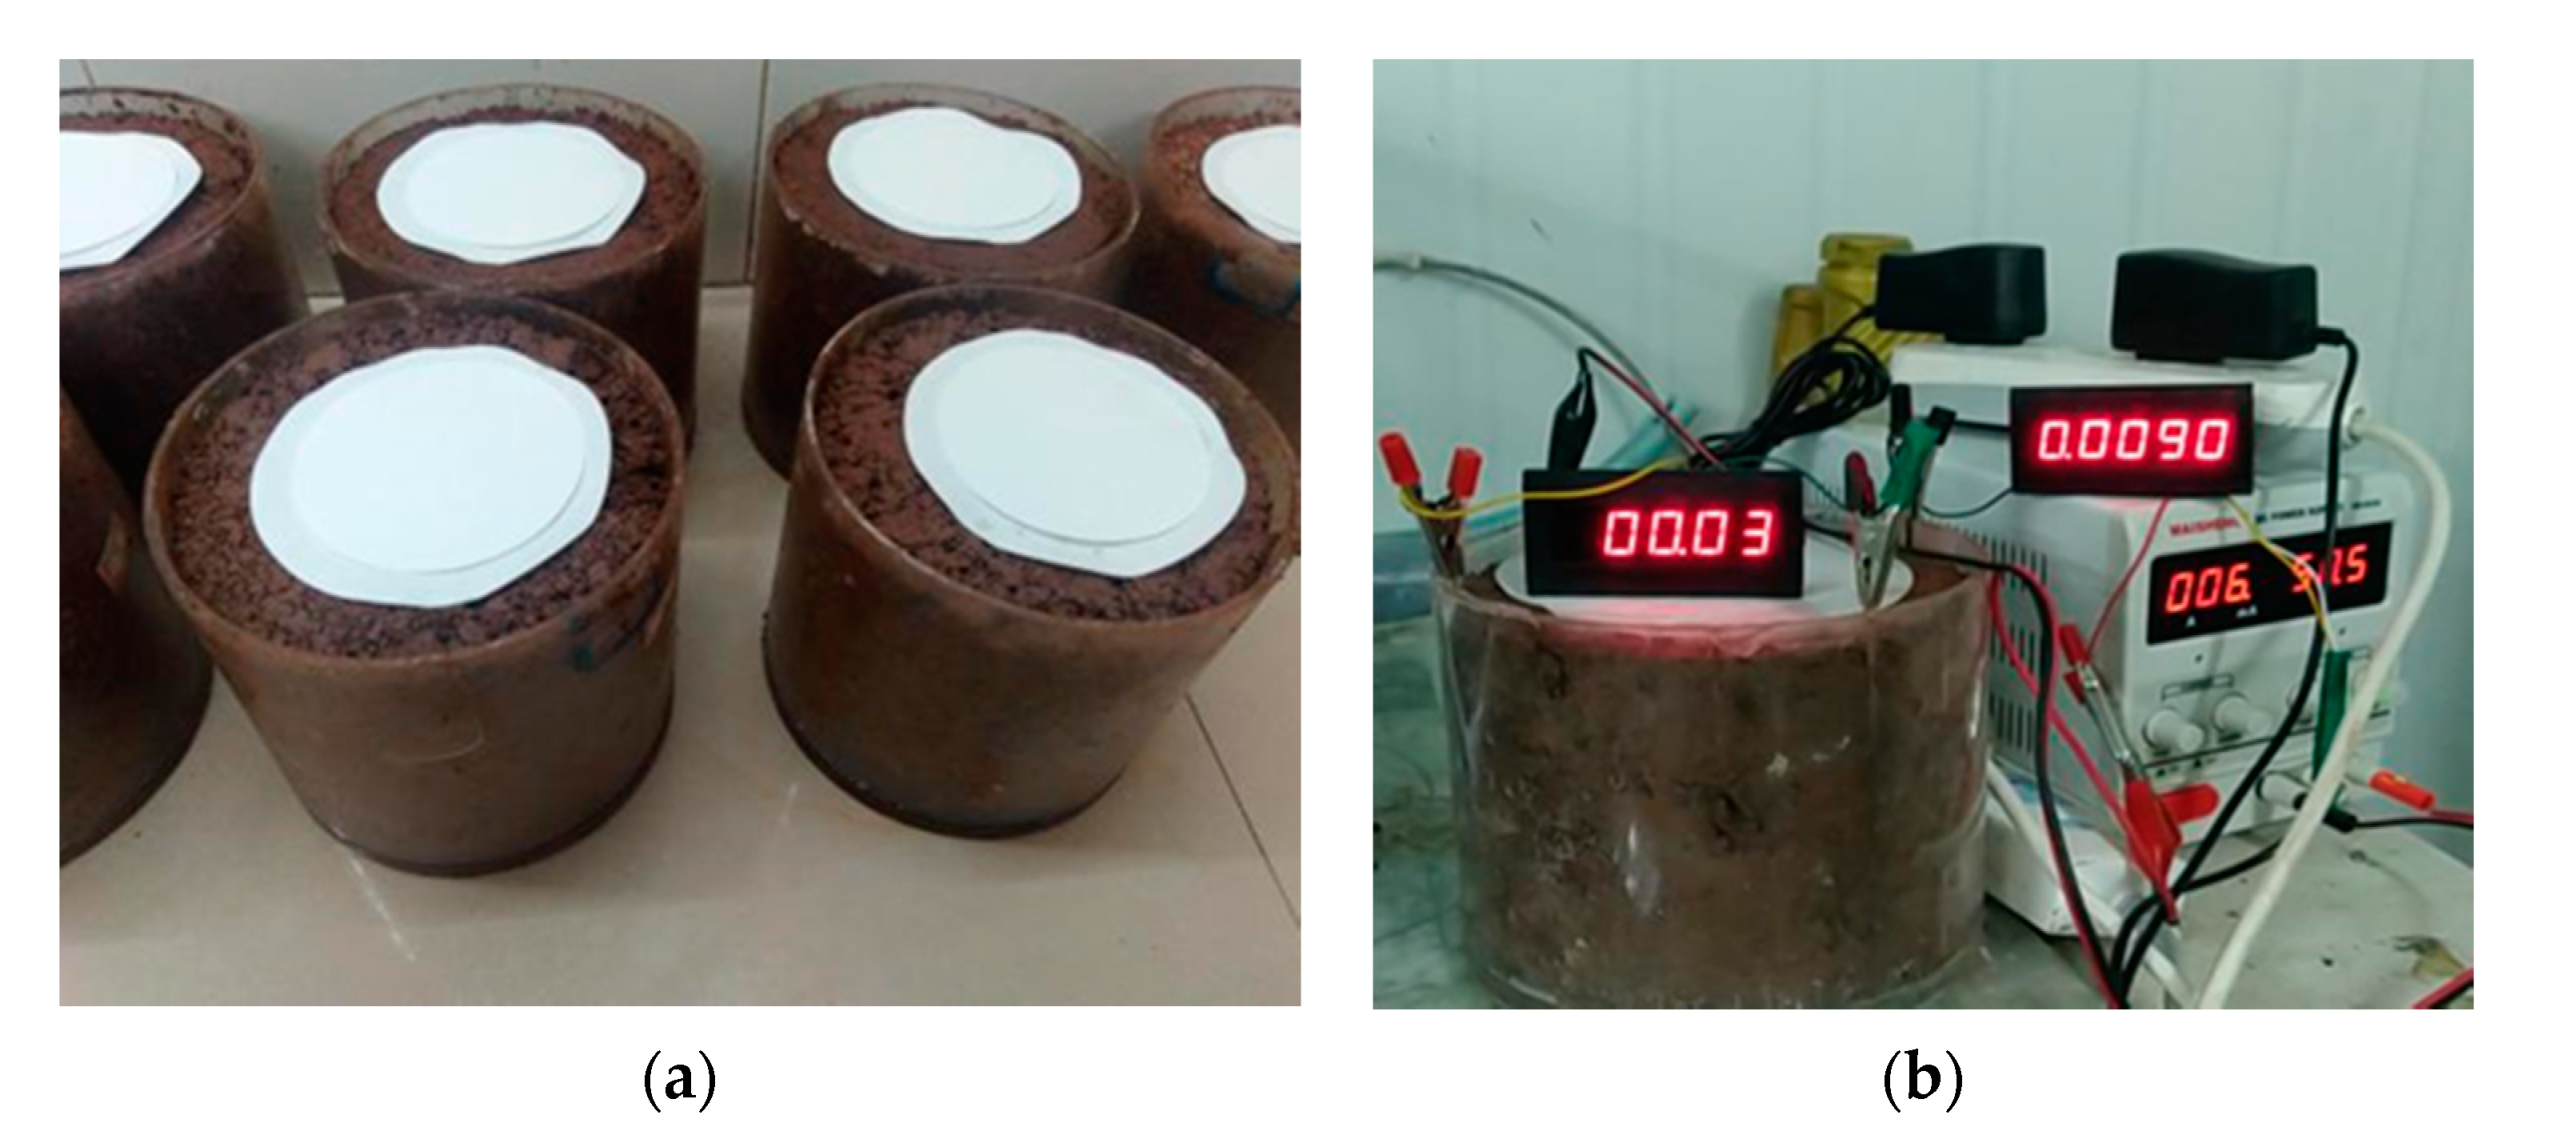
2.2. Measuring Equipment
2.3. Specimen Container
2.4. Filter Paper
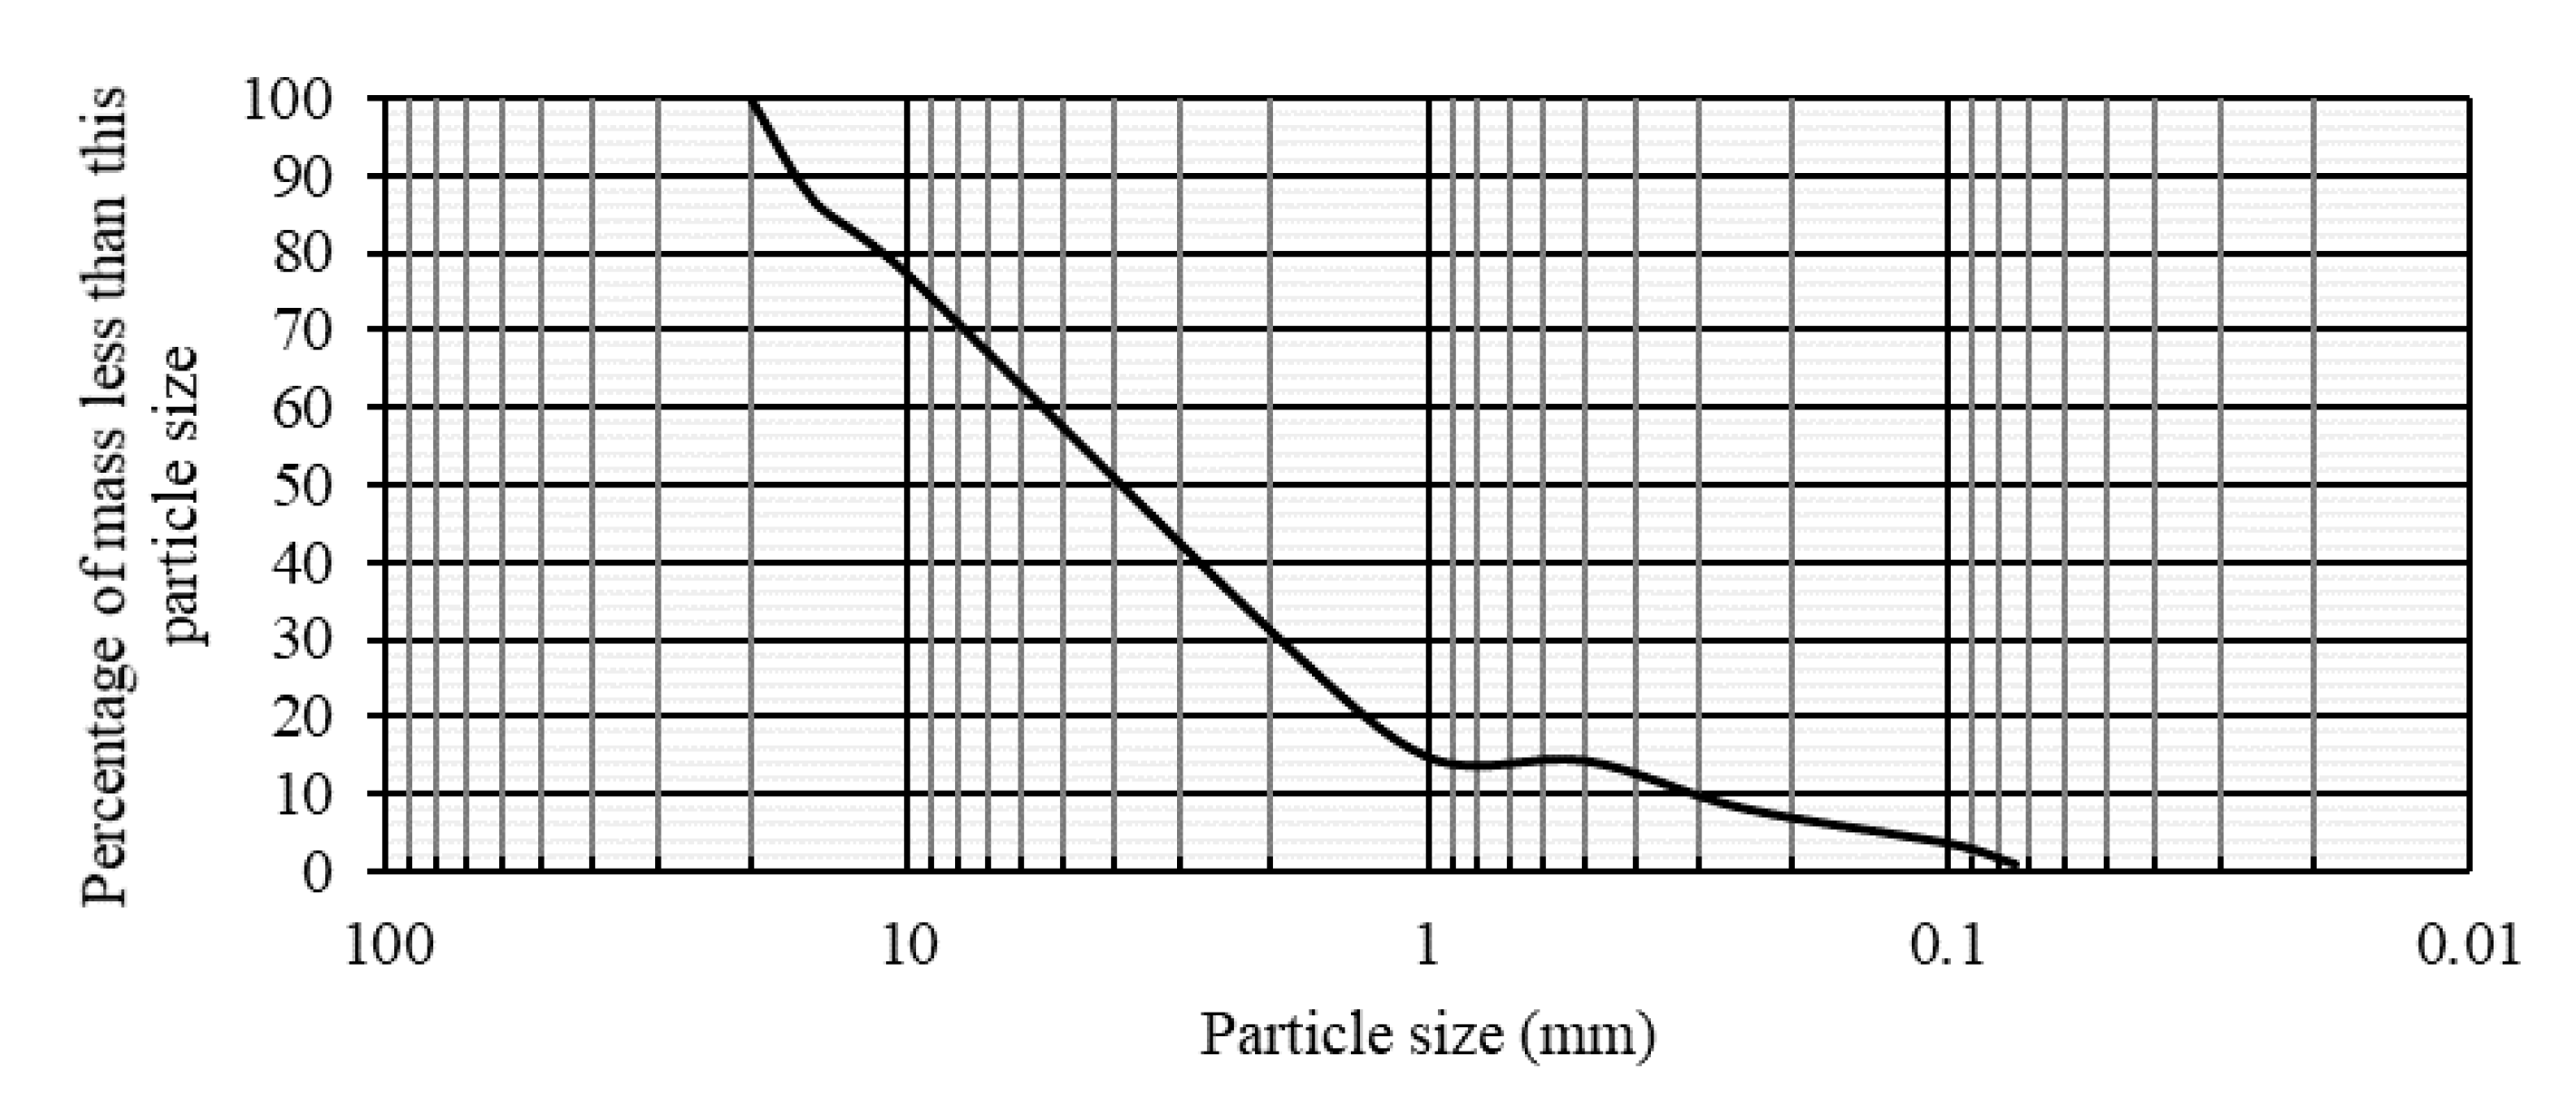
3. Test Materials and Methods
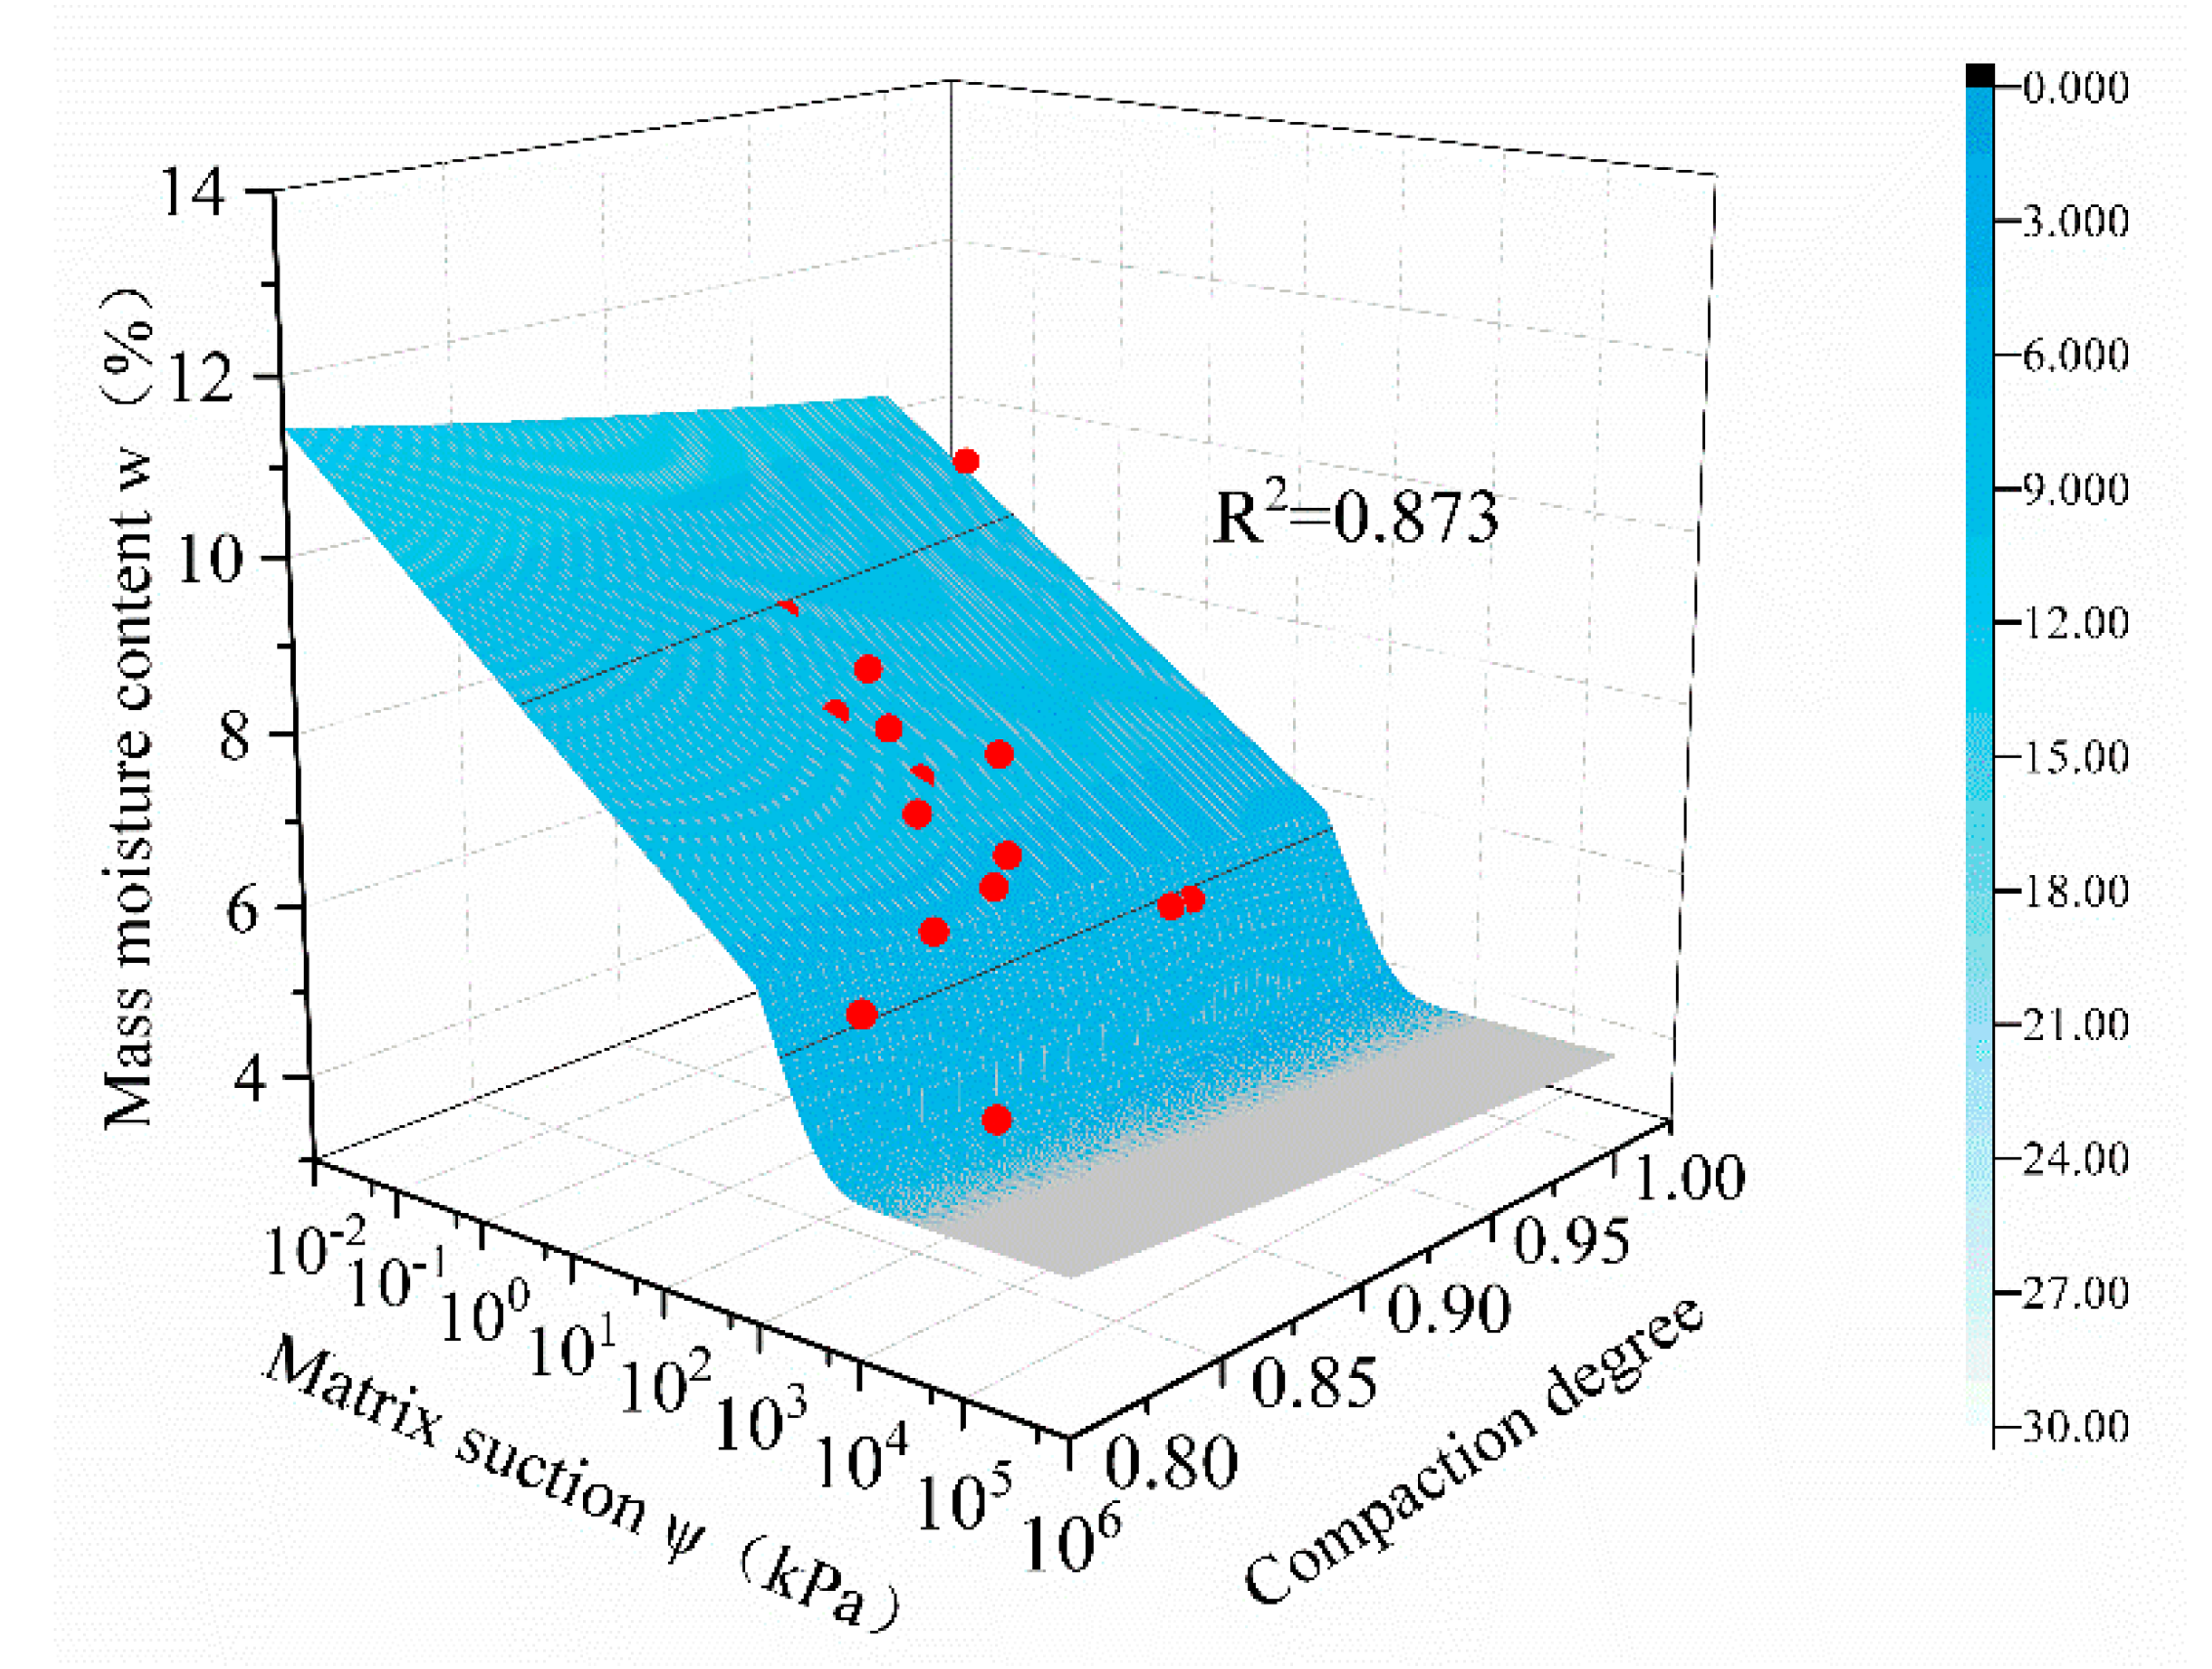
4. Matrix Suction–Electrical Resistivity Model for Soil-Rock Mixtures
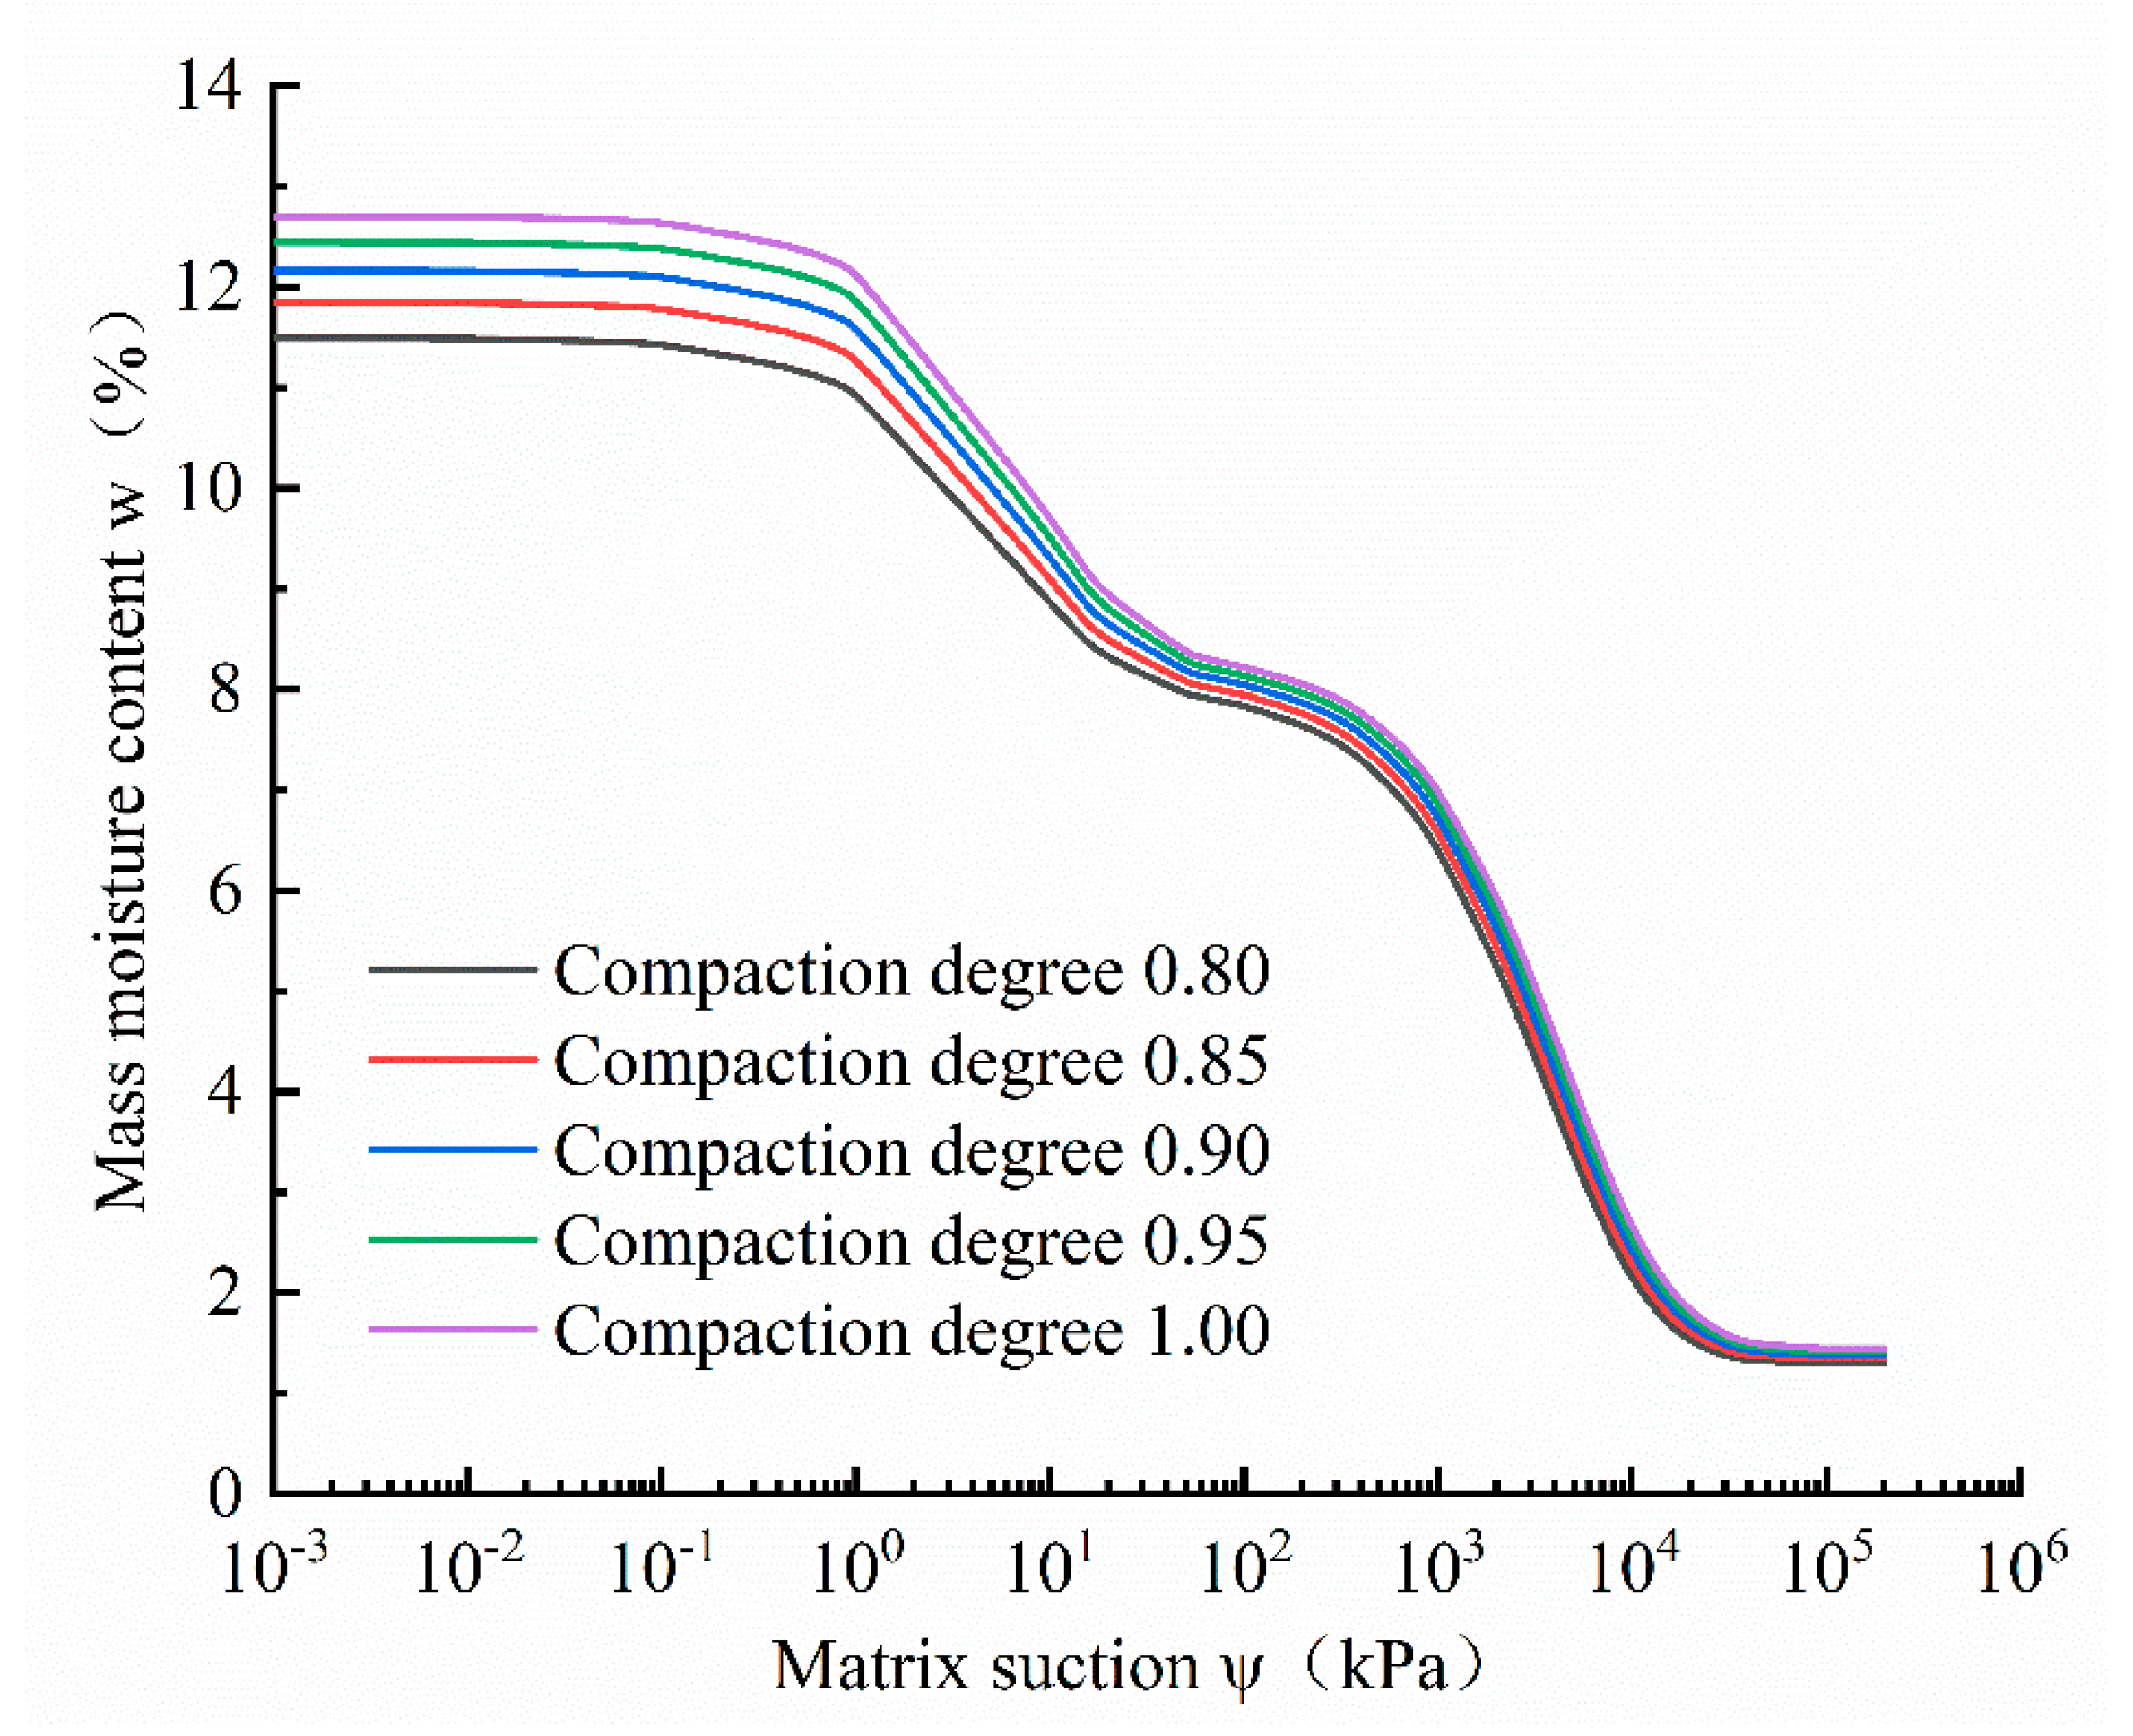
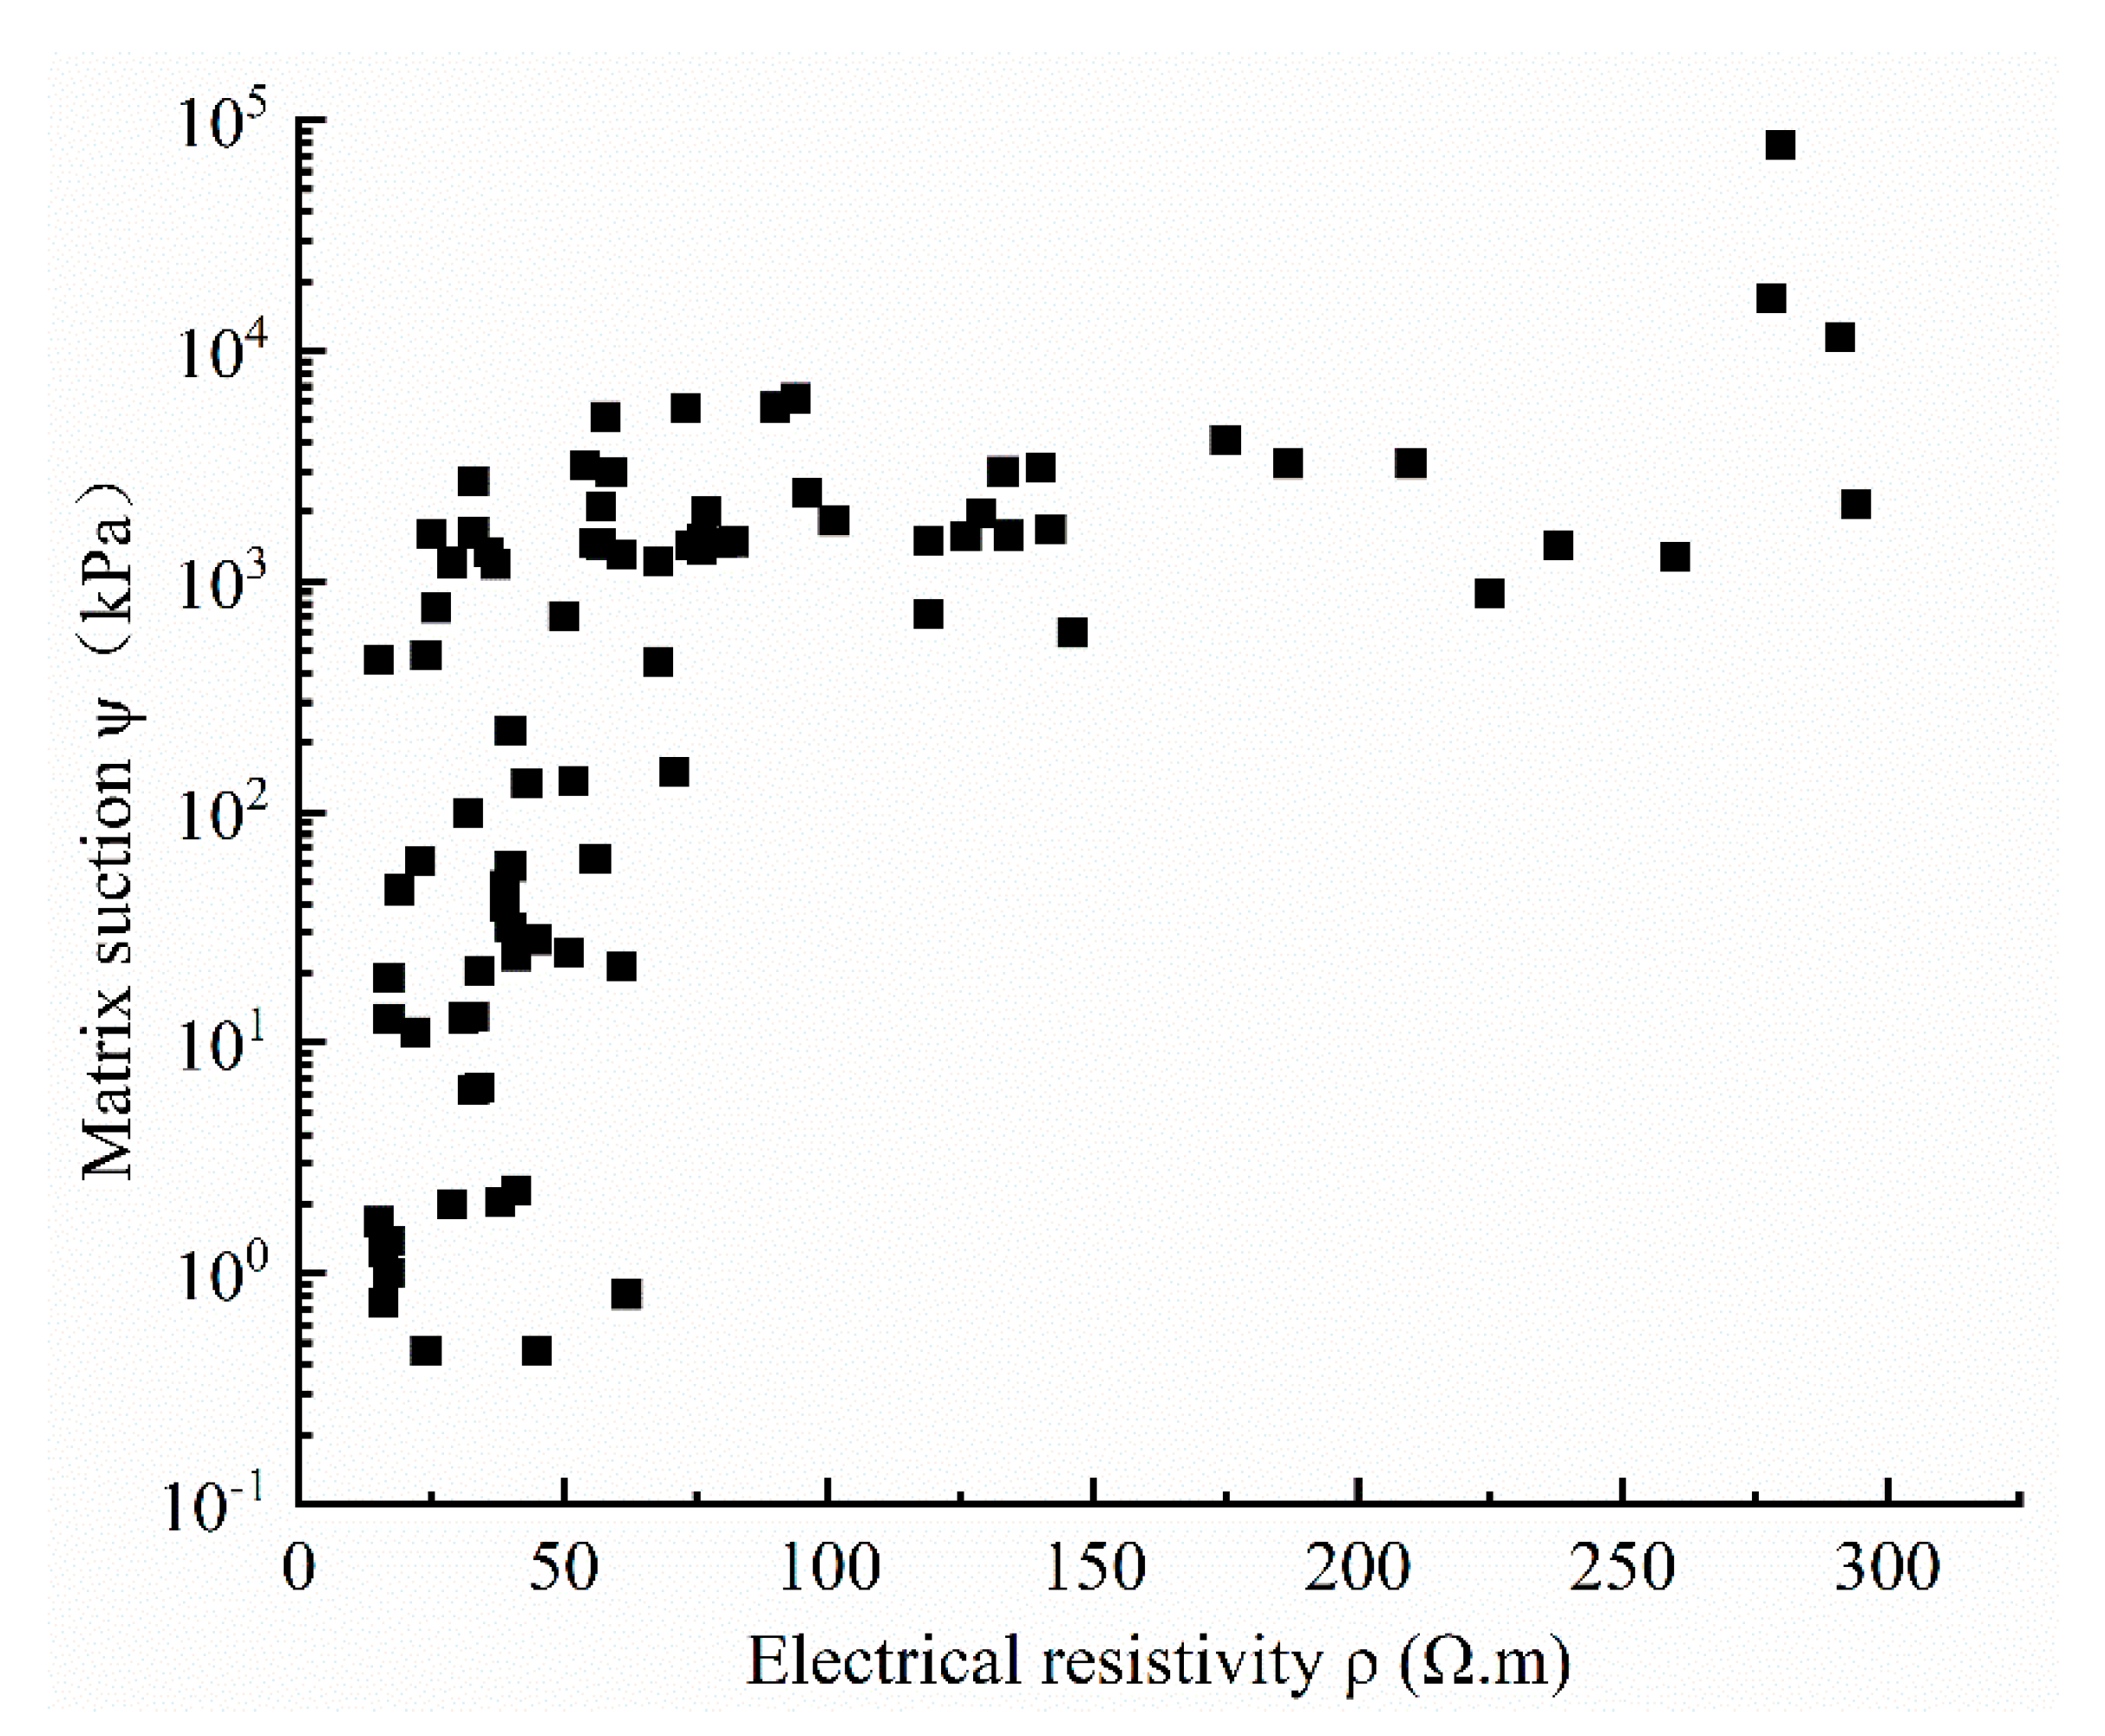
4.1. Experimental Results
4.2. Electrical Resistivity Comprehensive Parameter
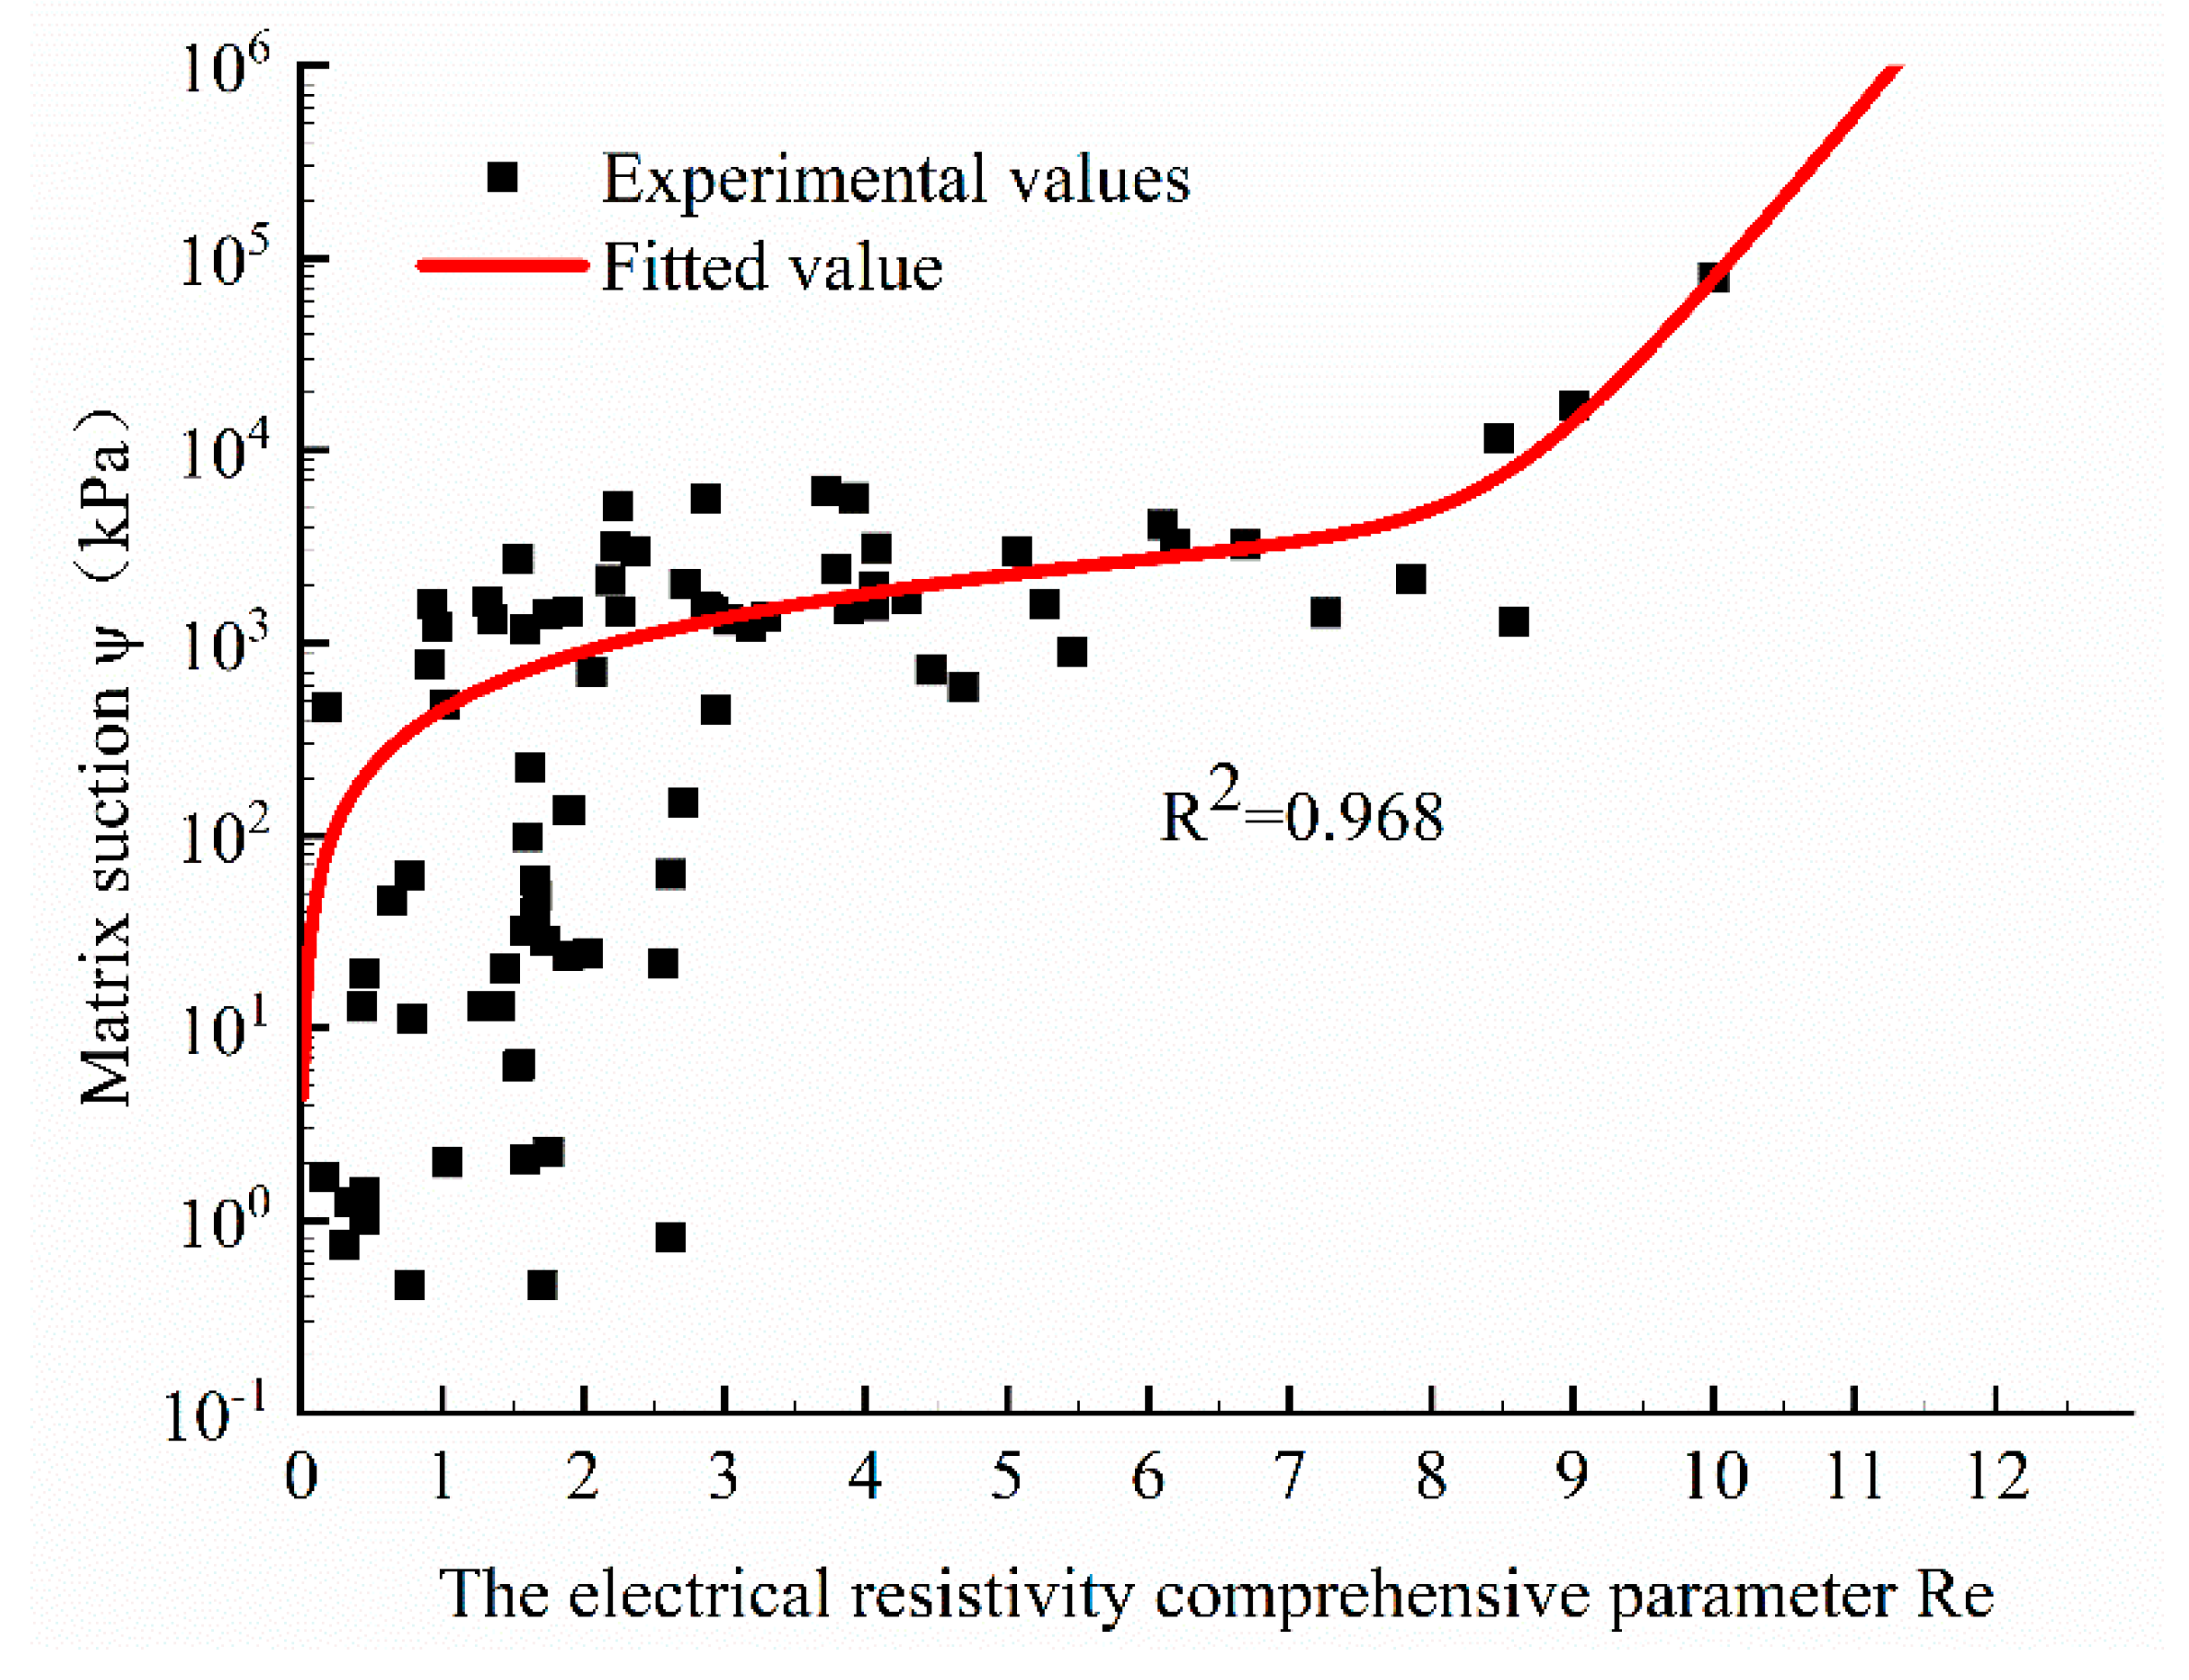
4.3. - Curve
- (1)
- Fitting of the - curve
- (2)
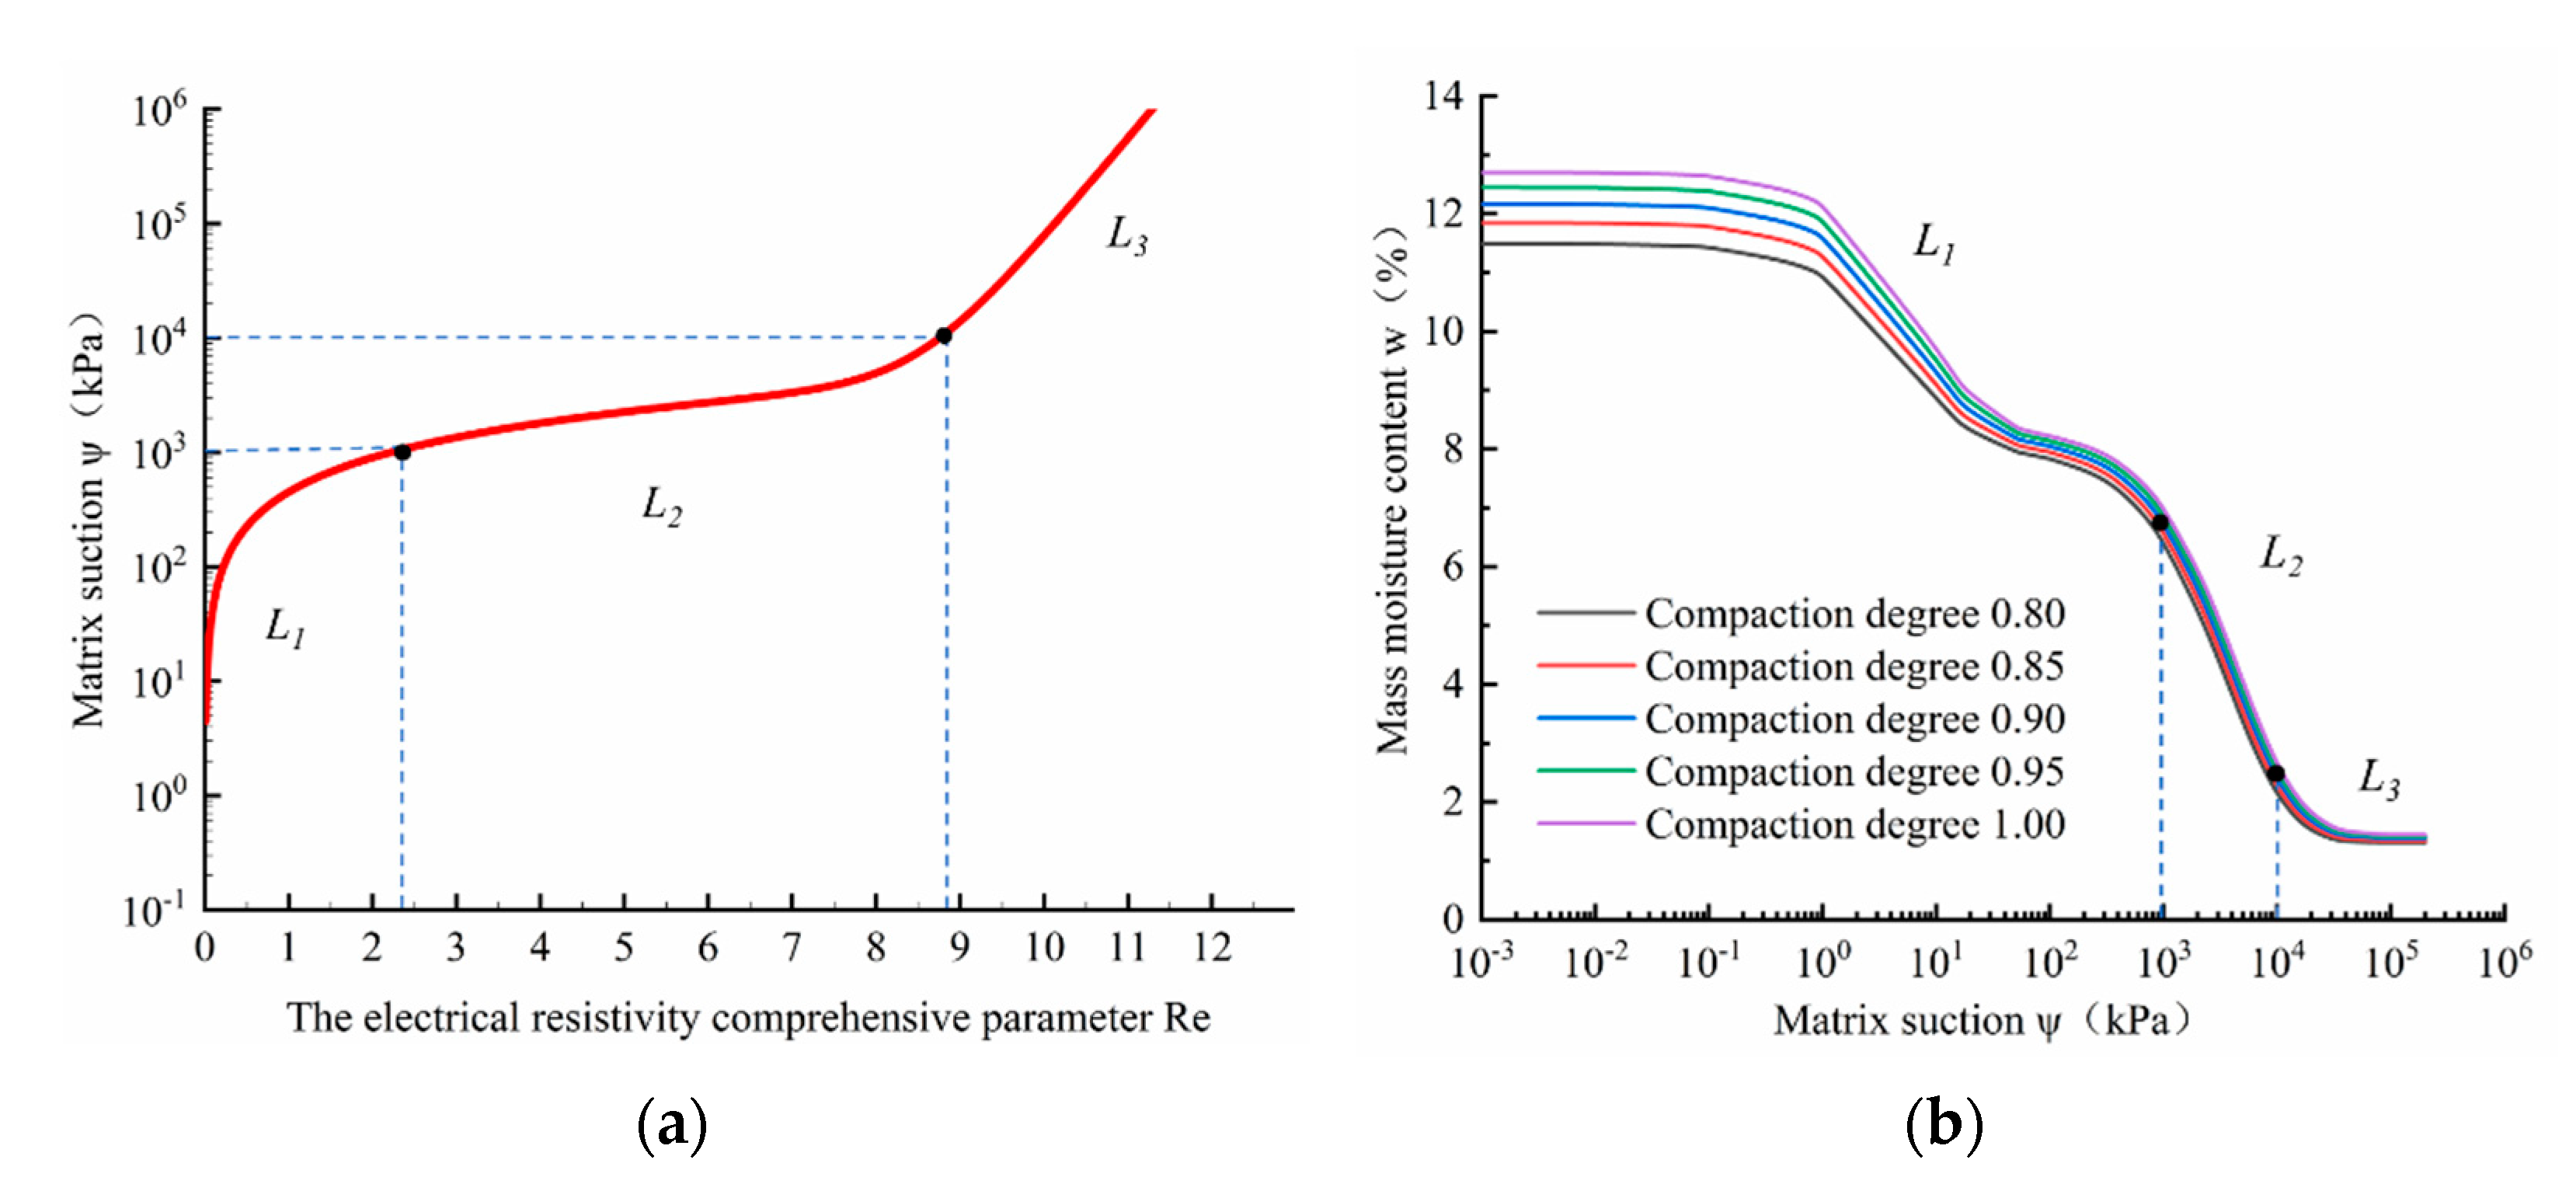
- Physical meaning of the - curve
4.4. Parameter Sensitivity Analysis of - Model
5. Conclusions
Author Contributions
Funding
Institutional Review Board Statement
Informed Consent Statement
Data Availability Statement
Conflicts of Interest
References
- Zhai, Q.; Rahardjo, H.; Satyanaga, A. Priono Effect of bimodal soil-water characteristic curve on the estimation of permeability function. Eng. Geol. 2017, 230, 142–151. [Google Scholar] [CrossRef]
- Cao, J.; Jung, J.; Song, X.; Bate, B. On the soil water characteristic curves of poorly graded granular materials in aqueous polymer solutions. Acta Geotech. 2017, 13, 103–116. [Google Scholar] [CrossRef]
- Hosseini Balam, N.; Mostofinejad, D.; Eftekhar, M. Effects of bacterial remediation on compressive strength, water absorption, and chloride permeability of lightweight aggregate concrete. Constr. Build. Mater. 2017, 145, 107–116. [Google Scholar] [CrossRef]
- De Sarno, D.; Vitale, E.; Deneele, D.; Nicotera, M.V.; Papa, R.; Russo, G.; Urciuoli, G. Effects of cement and foam addition on chemo-mechanical behaviour of lightweight cemented soil (LWCS). E3S Web Conf. 2019, 92, 11006. [Google Scholar] [CrossRef]
- Hedayati, M.; Ahmed, A.; Hossain, M.; Hossain, J.; Sapkota, A. Evaluation and comparison of in-situ soil water characteristics curve with laboratory SWCC curve. Transp. Geotech. 2020, 23, 100351. [Google Scholar] [CrossRef]
- Wang, Y.; Zhang, A.; Ren, W.; Niu, L. Study on the soil water characteristic curve and its fitting model of Ili loess with high level of soluble salts. J. Hydrol. 2019, 578, 124067. [Google Scholar] [CrossRef]
- Alowaisy, A.; Yasufuku, N.; Ishikura, R.; Hatakeyama, M.; Kyono, S. Continuous pressurization method for a rapid determination of the soil water characteristics curve for remolded and undisturbed cohesionless soils. Soils Found. 2020, 60, 634–647. [Google Scholar] [CrossRef]
- Ren, X.; Kang, J.; Ren, J.; Chen, X.; Zhang, M. A method for estimating soil water characteristic curve with limited experimental data. Geoderma 2019, 360, 114013. [Google Scholar] [CrossRef]
- Ridley, A.M.; Dineen, K.; Burland, J.B.; Vaughan, P.R. Soil matrix suction: Some examples of its measurement and application in geotechnical engineering. Géotechnique 2003, 53, 241–253. [Google Scholar] [CrossRef]
- Wang, X.-Q.; Xie, N.i.; Zou, W.e.i.-l.i.e.; Luo, Y.-D.; Liu, W. Field trial for characteristics of matrix suction and infiltration of slope of unsaturated subgrade under artificial rainfall. Wuhan Ligong Daxue Xuebao/J. Wuhan Univ. Technol. 2010, 32, 107–110. [Google Scholar]
- Jeng, C.-J.; Lin, T.-A. A Case Study on the in-situ Matrix Suction Monitoring and Undisturbed-Sample Laboratory Test for the Unsaturated Colluvium Slope. Soils Found. 2011, 51, 321–331. [Google Scholar] [CrossRef]
- Leong, E.; Lee, C.; Low, K.S. An Active Control System for Matric Suction Measurement. Soils Found. 2009, 49, 807–811. [Google Scholar] [CrossRef][Green Version]
- Suwal, L.P.; Kuwano, R. Triaxial apparatus equipped with elastic waves and matric suction measurement techniques. Soils Found. 2018, 58, 1553–1562. [Google Scholar] [CrossRef]
- Di Maio, R.; Piegari, E.; Todero, G.; Fabbrocino, S. A combined use of Archie and van Genuchten models for predicting hydraulic conductivity of unsaturated pyroclastic soils. J. Appl. Geophys. 2015, 112, 249–255. [Google Scholar] [CrossRef]
- Lee, H.; Lee, J.-W.; Oh, T.-M. Permeability evaluation for artificial single rock fracture according to geometric aperture variation using electrical resistivity. J. Rock Mech. Geotech. Eng. 2021, 13, 787–797. [Google Scholar] [CrossRef]
- Merritt, A.; Chambers, J.; Wilkinson, P.; West, L.; Murphy, W.; Gunn, D.; Uhlemann, S. Measurement and modelling of moisture—electrical resistivity relationship of fine-grained unsaturated soils and electrical anisotropy. J. Appl. Geophys. 2016, 124, 155–165. [Google Scholar] [CrossRef]
- de Cássia Goulart Ferreira, Q.; de Almeida Prado Bacellar, L.; Moreira Viana, J.H. Evaluation of soil moisture by electrical resistivity in Oxisols of the central Brazilian savanna. Geoderma Reg. 2021, 26, e00408. [Google Scholar] [CrossRef]
- Loke, M.; Chambers, J.; Rucker, D.; Kuras, O.; Wilkinson, P. Recent developments in the direct-current geoelectrical imaging method. J. Appl. Geophys. 2013, 95, 135–156. [Google Scholar] [CrossRef]
- Chambers, J.E.; Gunn, D.A.; Wilkinson, P.B.; Meldrum, P.I.; Haslam, E.; Holyoake, S.; Kirkham, M.; Kuras, O.; Merritt, A.; Wragg, J. 4D electrical resistivity tomography monitoring of soil moisture dynamics in an operational railway embankment. Near Surf. Geophys. 2012, 12, 61–72. [Google Scholar] [CrossRef]
- Brunet, P.; Clement, R.; Bouvier, C. Monitoring soil water content and deficit using Electrical Resistivity Tomography (ERT)—A case study in the Cevennes area, France. J. Hydrol. 2010, 380, 146–153. [Google Scholar] [CrossRef]
- Supper, R.; Ottowitz, D.; Jochum, B.; Kim, J.H.; Römer, A.; Baron, I.; Pfeiler, S.; Lovisolo, M.; Gruber, S.; Vecchiotti, F. Geoelectrical monitoring: An innovative method to supplement landslide surveillance and early warning. Near Surf. Geophys. 2013, 12, 133–150. [Google Scholar] [CrossRef]
- Ma S-k Huang M-s Hu, P.; Yang, C. Soil-water characteristics and shear strength in constant water content triaxial tests on Yunnan red clay. J. Cent. South Univ. 2013, 20, 1412–1419. [Google Scholar]
- Jiang, Y.; Chen, W.; Wang, G.; Sun, G.; Zhang, F. Influence of initial dry density and water content on the soil-water characteristic curve and suction stress of a reconstituted loess soil. Bull. Int. Assoc. Eng. Geol. 2016, 76, 1085–1095. [Google Scholar] [CrossRef]
- Su, Y.; Cui, Y.-J.; Dupla, J.-C.; Canou, J. Soil-water retention behaviour of fine/coarse soil mixture with varying coarse grain contents and fine soil dry densities. Can. Geotech. J. 2021. [Google Scholar] [CrossRef]
- Shan, P.; Lai, X. Mesoscopic structure PFC∼2D model of soil rock mixture based on digital image. J. Vis. Commun. Image Represent. 2019, 58, 407–415. [Google Scholar] [CrossRef]
- Feng, H.P.; Ma, D.L.; Wang, Z.P.; Chang, J.M. Measurement of resistivity of unsaturated soils using van der Pauw method [J]. Chin. J. Geotech. Eng. 2017, 39, 690–696. [Google Scholar]
- ASTM D5298-10, Standard Test Method for Measurement of Soil Potential (Suction) Using Filter Paper. ASTM International: West Conshohocken, PA, USA, 2010. Available online: www.astm.org (accessed on 8 September 2021).
- Sun, D.; Zhang, J.; Song, G. Experimental Study of Soil-Water Characteristic Curve of Chlorine Saline Soil. Rock Soil Mech. 2013, 34, 955–960. [Google Scholar]
- Bao, D.; Yu, Y.; Yang, K. Study on Soil-Water Characteristic Curve of Salt-Bearing Red Bed Mudstone in Lanzhou Area. J. Lanzhou Jiaotong Univ. 2019, 38, 25–34. [Google Scholar]
- Cai, G.; Liu, Y.; Xu, R.; Li, J.; Zhao, C. Experimental Investigation For Soil-Water Characteristic Curve Of Red Clay In Full Suction Range. Chin. J. Geotech. Eng. 2019, 41, 13–16. [Google Scholar]
- Huang, K.; Wan, J.; Chen, G.; Zeng, Y. Testing Study Of Relationship Between Water Content And Shear Strength Of Unsaturated Soils. Rock Soil Mech. 2012, 33, 2600–2604. [Google Scholar]
- Zha, F.; Liu, S.; Du, Y.; Cui, K. Prediction Of Matric Suction Of Unsaturated Soil Based On Electrical Resistivity. Rock Soil Mech. 2010, 31, 1003–1008. [Google Scholar]


| NO. | Target Compaction | Target Mass Moisture Content (%) |
| 1 | 0.85 | 3.0 |
| 4.0 | ||
| 5.0 | ||
| 6.5 | ||
| 7.0 | ||
| 7.5 | ||
| 8.0 | ||
| 9.0 | ||
| 10.0 | ||
| 2 | 0.9 | 3.0 |
| 4.0 | ||
| 5.0 | ||
| 6.5 | ||
| 7.0 | ||
| 7.5 | ||
| 8.0 | ||
| 9.0 | ||
| 10.0 | ||
| 3 | 0.95 | 3.0 |
| 4.0 | ||
| 5.0 | ||
| 6.5 | ||
| 7.0 | ||
| 7.5 | ||
| 8.0 | ||
| 9.0 | ||
| 10.0 |
| Fitting Parameters | Fitted Value | RMSE | R2 | Adjusted R-Square | Fitting State |
|---|---|---|---|---|---|
| 1.37 × 10⁻⁴ | 1.84 × 10⁻⁴ | 0.9681 | 0.96731 | Success | |
| 2.01025 | 0.12729 | ||||
| −450.3301 | 60.63361 |
Publisher’s Note: MDPI stays neutral with regard to jurisdictional claims in published maps and institutional affiliations. |
© 2021 by the authors. Licensee MDPI, Basel, Switzerland. This article is an open access article distributed under the terms and conditions of the Creative Commons Attribution (CC BY) license (https://creativecommons.org/licenses/by/4.0/).
Share and Cite
Wang, K.; Xia, Z.; Li, X. Matrix Suction Evaluation of Soil-Rock Mixture Based on Electrical Resistivity. Water 2021, 13, 2937. https://doi.org/10.3390/w13202937
Wang K, Xia Z, Li X. Matrix Suction Evaluation of Soil-Rock Mixture Based on Electrical Resistivity. Water. 2021; 13(20):2937. https://doi.org/10.3390/w13202937
Chicago/Turabian StyleWang, Kui, Zhengting Xia, and Xue Li. 2021. "Matrix Suction Evaluation of Soil-Rock Mixture Based on Electrical Resistivity" Water 13, no. 20: 2937. https://doi.org/10.3390/w13202937
APA StyleWang, K., Xia, Z., & Li, X. (2021). Matrix Suction Evaluation of Soil-Rock Mixture Based on Electrical Resistivity. Water, 13(20), 2937. https://doi.org/10.3390/w13202937