Article

Spatial Distributions of Nitrogen and Phosphorus in Surface Sediments in Intertidal Flats of the Yellow River Delta, China

1
State Key Laboratory of Environmental Criteria and Risk Assessment, Chinese Research Academy of Environmental Sciences, Beijing 100012, China
2
College of Water Sciences, Beijing Normal University, Beijing 100875, China
3
State Environment Protection Key Laboratory of Regional Eco-Process and Function Assessment, Chinese Research Academy of Environmental Sciences, Beijing 100012, China
*
Authors to whom correspondence should be addressed.
Water 2021, 13(20), 2899; https://doi.org/10.3390/w13202899
Submission received: 22 August 2021 / Revised: 8 October 2021 / Accepted: 9 October 2021 / Published: 15 October 2021

Abstract

:
The spatial distributions of nitrogen (N) and phosphorus (P) in surface sediments are of great significance in studying the ecological process of nutrient cycling in intertidal flats. However, little is known about N and P’s spatial distribution in intertidal flats of the Yellow River Delta (YRD). We analyzed the N and P contents in surface sediments and Suaeda glauca density at the low-tidal level to identify the spatial distributions of nutrients and their influencing factors in coastal tidal flat sediments. The results showed that the total nitrogen (TN) and total phosphorus (TP) concentrations in this study were both lower than the background values of China’s shallow sea sediments. The spatial distributions of N and P had significantly spatial heterogeneity, while those of the nutrients at different distances from the low-tidal level to the coastline showed no significant distance effects. The spatial distribution of S. glauca in coastal tidal flats had significant location characteristics and was closely related to the distribution of TN and pH. The TN in non-estuarine intertidal flats was less than that in estuaries; in contrast, the TP was higher in non-estuaries. There are some differences of N and P between estuary and non-estuary areas.

1. Introduction

The environmental pollution of the Bohai Sea is serious. In recent years, the Bohai Sea economic zone has rapidly developed. More than 40 rivers carry a large amount of industrial and agricultural wastewater and domestic sewage into the Bohai Sea [1,2]. In 2018, the Action Plan for the Environmental Comprehensive Management and Control of the Bohai Sea (https://www.mee.gov.cn/xxgk2018/xxgk/xxgk15/201812/t20181211_684274.html) (accessed on 11 December 2018) was jointly issued by the Ministry of Ecology and Environment of the People’s Republic of China, the National Development and Reform Commission, and the Ministry of Natural Resources of the People’s Republic of China. The plan aims to improve the environmental quality and protect the natural ecosystems of the Bohai Sea. Eutrophication is a serious environmental pollution problem in the Bohai Sea [3]. Large amounts of nitrogen and phosphorus have led to eutrophication and red tides [4,5], which have done great harm to the marine ecological balance and aquatic resources [6]. The occurrence of red tides in the Bohai Sea is increasing. From 1952 to 1999, there were 24 red tides, while from 2000 to 2016, the number of red tides in the Bohai Sea reached 165 [3]. The most serious red tides occurred in the west of Bohai Bay, the west of Liaodong Bay, and the estuary of the Yellow River [3,7], and nitrogen (N), and phosphorus (P) are the main factors influencing eutrophication in these areas.
The Yellow River Delta (YRD), which is located on the south bank of the Bohai Sea, between Bohai Bay and Laizhou Bay, is an alluvial plain formed in the estuary of the Yellow River. The YRD is the youngest and fastest-growing sedimentary delta in the world, and the coastal tidal flats comprise the largest area of natural wetlands in the YRD [8]. A century and a half ago, a great course shifting of the lower Yellow River channel created a new river channel and delta [9]; furthermore, it brought a large amount of sediment that gradually raised the mudflats of the Bohai Sea, creating new land. Decades ago, a new city was established on this new land, and it was also one of the areas with the fasted urbanization and population growth in China. As the Yellow River has been carrying large amounts of sediment into the estuary and the deposition of sediments is a primary driver for the growth of tidal flats, the area of the YRD’s tidal flats is still rapidly increasing. Moreover, these sediments are highly aggregated in character, with 3/4 of the total sediments coming from the Loess Plateau. With the development of industry and agriculture, a large amount of nitrogen and phosphorus are released into the Bohai Sea from the Yellow River, thus increasing the risk of eutrophication. Although coastal tidal flat ecosystems could improve the water quality [10,11,12,13], little is known about the removal of nitrogen and phosphorus in coastal tidal flats, as they could affect their spatial distributions in the tidal flats [14,15]. Previous studies focused on the nitrogen and phosphorus in the Yellow River estuary wetland [16,17]. Little is known about the concentrations and distributions of nitrogen and phosphorus in the coastal tidal flats, which makes it difficult to effectively evaluate their spatial distributions [18].
The nitrogen and phosphorus in the Yellow River Delta mainly come from sediments carried by the Yellow River and various organic pollutants that are intentionally or unintentionally discharged into the Yellow River by human beings; thus, these nutrients spread from the estuary to the sea and non-estuarine mudflats as the river water enters the sea. As the intertidal flats are active buffer zones for the transport of nutrients between the sea and land, the biophysical processes in the intertidal flats can significantly affect the spatial distributions of nitrogen and phosphorus [19]. We assume that the spatial distribution of nitrogen and phosphorus in the intertidal flats of the YRD are possibly affected by the sediment characteristics, plants, and the violent tidal actions. According to the intensity and frequency of tidal action, we sampled at equal intervals from the low-tide level to the coastline to analyze the spatial distributions of N and P in coastal tidal flats. Thus, the objectives of this study were as follows: comparing the concentrations of the nitrogen and phosphorus fractions in the coastal tidal flat sediments in different locations of the YRD; verifying if the increased distance from the low-tidal level to the coastline changes the concentrations of the N and P fractions of the sediments in the tidal flats of the YRD, meanwhile, we regarded this influence as the distance effect; and identifying the influence of the environmental factors on nitrogen and phosphorus in the tidal flat sediments of the YRD.

2. Materials and Methods
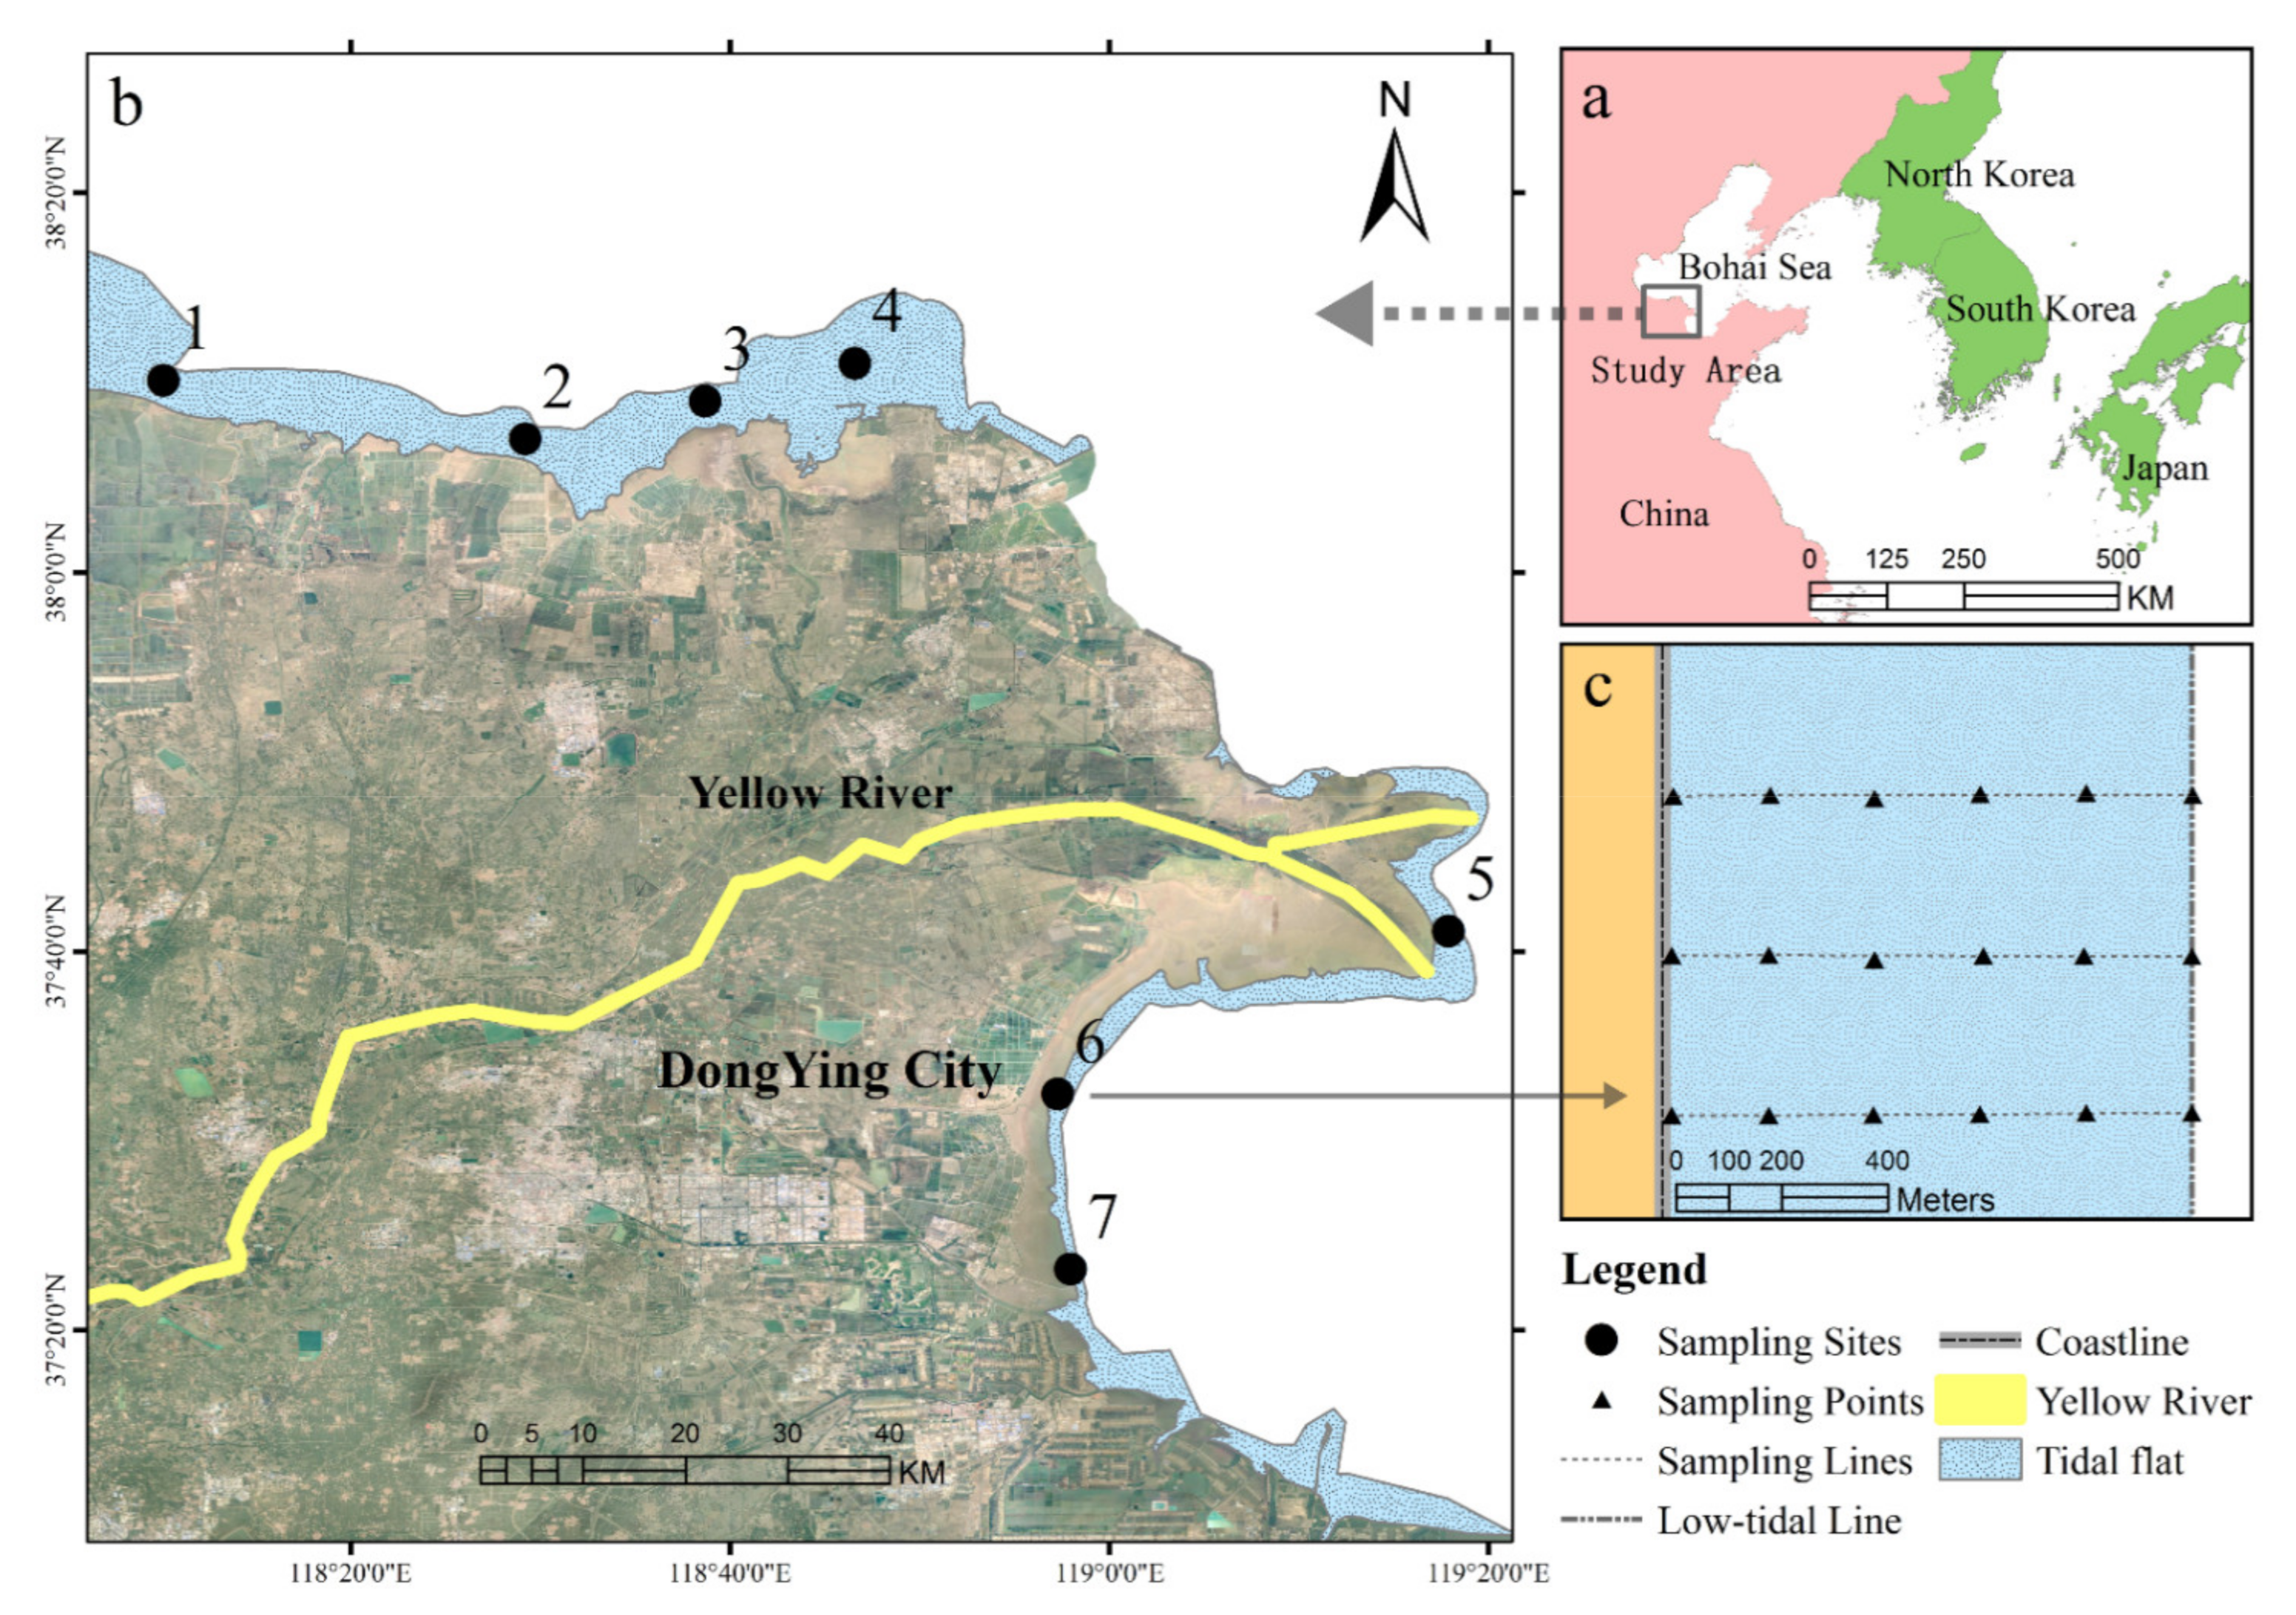
2.1. Study Area

This study was carried out in the coastal tidal flats of the YRD. The YRD, located in the northern part of Shandong Province, China, covers an area of about 6000 km2. A century and a half ago, this vast area was part of the Bohai Sea, the youngest river delta formed by the shift of the Yellow River’s route. The YRD is characterized by a temperate, semi-humid continental monsoon climate. The average annual temperature in the YRD is 12.1 °C, and the average maximum and minimum temperatures are 26 °C in July and −4 °C in January, respectively. The average annual precipitation is 600 mm, of which 70% is rainfall during the summer. The mean annual potential evaporation is 2049 mm·year−1, which far exceeds the rainfall of this area [20,21].

2.2. Sample Collection

In this study, sampling sites were selected on the tidal flats along the coastline of the YRD from the Tuhai River estuary to the Guangli River estuary (Figure 1). In September 2017, in total, seven sampling sites and 21 sampling lines were selected, all of which were located in non-estuary intertidal flats with the same plant communities (single populations of Suaeda glauca) (Figure 2). At each sample site, there were 3 sample lines perpendicular to the shoreline, and the distance between the sample lines was 200–300 m. We set 7 sample points evenly from the low-tidal level to the coastline in each sample line, and the distance between the sample points was 200 m. Due to the construction of seawalls and roads, we only set five sample points for each sample line at sample sites 2 and 4. Surface sediments (0–5 cm) were collected at each sample point by 5-spot sampling. A total of 102 sediment samples were collected. The sediment samples were kept in plastic bags and taken back to the laboratory to be air-dried. If there was vegetation at the sample points, we randomly selected three plant quadrates (1 m × 1 m) and recorded the number of plants.

2.3. Characteristics and Analyses of the Sediments

The total nitrogen (TN) in the sediments was analyzed using the HT1300 solid module of the Multi N/C3100 (Analytik Jena AJ, Jena, Germany). The sediments were extracted with potassium chloride, the amount of nitrate nitrogen (NO3–N) was determined with an ultraviolet spectrophotometer (UV754N, Inesa Analytical Instrument Co., Ltd, Shahnghai, China), and the amount of ammonium nitrogen (NH4–N) was determined with the indophenol blue method [22]. The total phosphorus (TP) in the sediments was determined using HClO4–H2SO4 digestion [23] followed by a Mo-Sb colorimetric assay. The available phosphorous (AP) in the sediments was measured using the Olsen bicarbonate extractable P method, followed by the Mo-Sb colorimetric method.
The pH was measured with a pH meter (FE20-FiveEasyTM pH, Mettler Toledo, Changzhou, China) after shaking the soil-water (1:2.5 w/w) suspension for 30 min. The total organic carbon (TOC) in the sediments was analyzed using the HT1300 solid module of the Multi N/C3100 (Analytik Jena AJ, Jena, Germany). Sediments were first acidified with a 10% HCl solution to remove carbonate, then baked for 3 to 12 h at 100 °C and analyzed for the TOC. The particle size of the sediment samples was measured using a Mastersizer 2000 (Malvern, UK) and classified as clay (<4 μm), silt (4–63 μm), or sand (>63 μm).

2.4. Statistical Analyses

One-way ANOVA was used to analyze the effects of the sample sites and the distances from the sea on the TN, NO3–N, NH4–N, TP, and AP in the sediments. After carrying out one-way ANOVA, Fisher’s Protected LSD test was used to detect significant differences (p < 0.05) among the sample sites or the different distances from the low-tidal level to the coastline. Pearson’s correlation analysis was performed to test the relationship between the TN, NO3–N, NH4–N, TP, AP, TOC, pH, and grain size fractions in the sediments.

3. Results

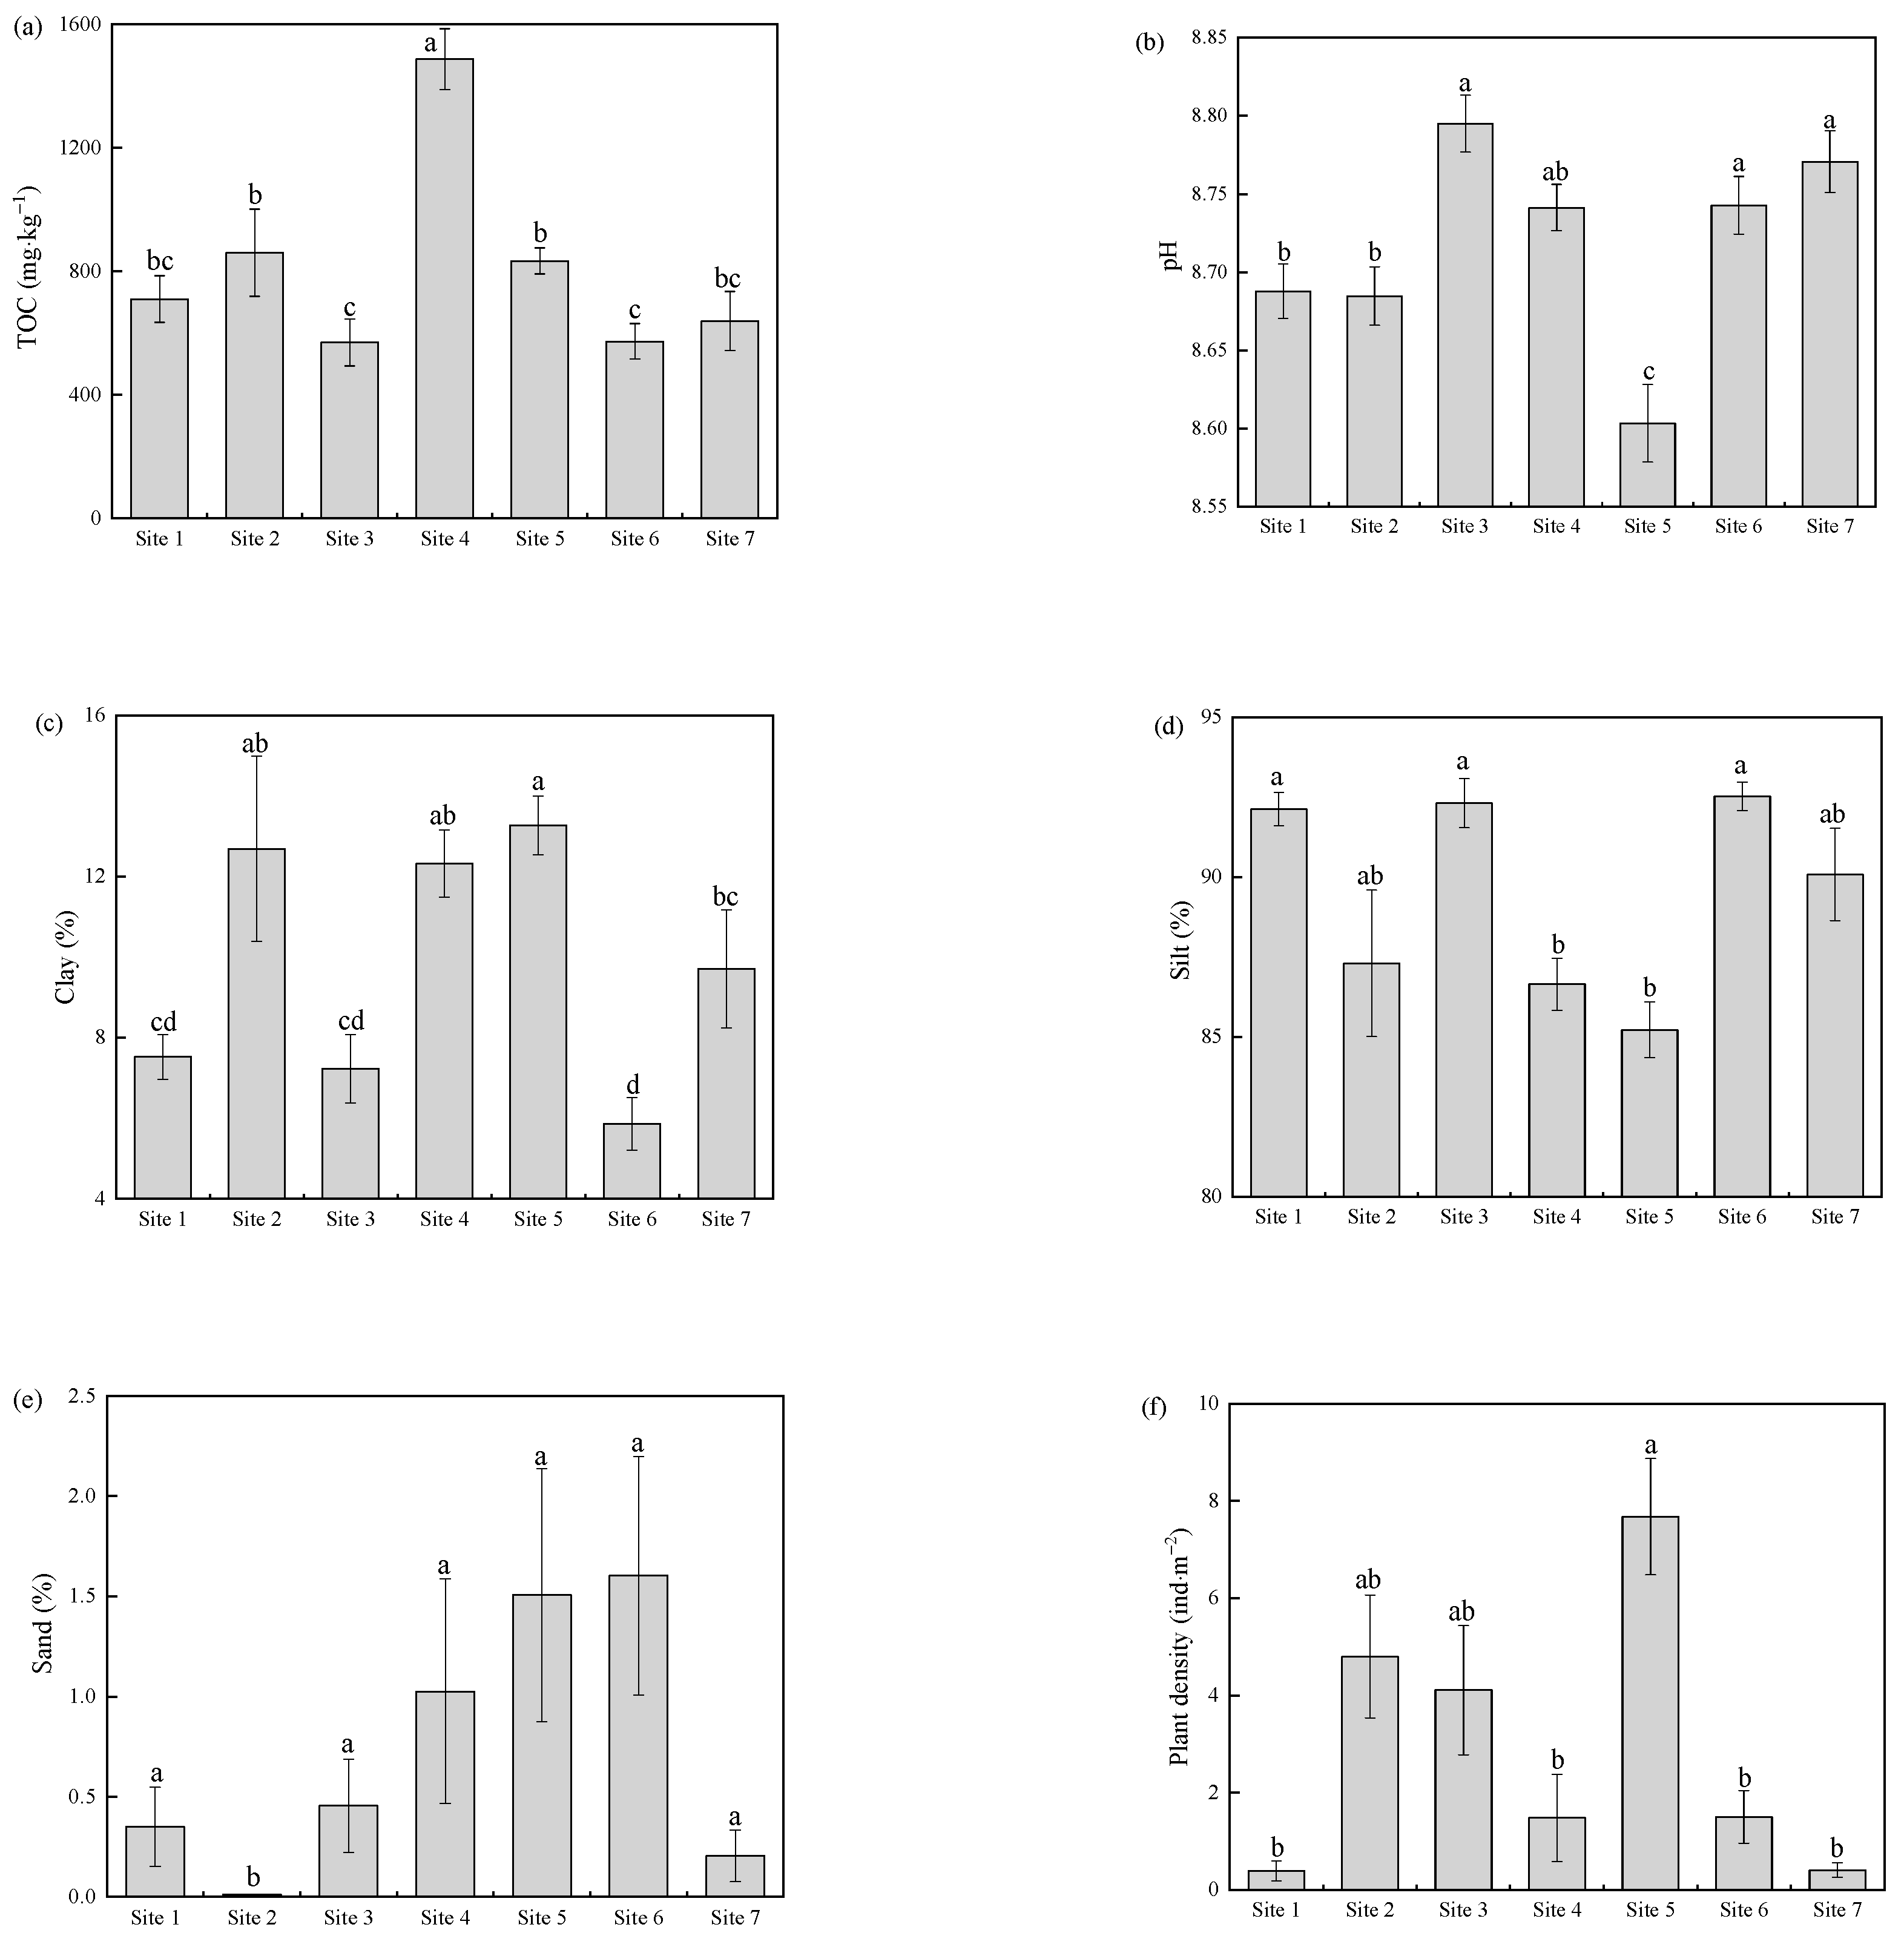
3.1. The Physicochemical Characterization and Plant Distribution Characteristics of the Sediments

The spatial distribution of the sediments’ physicochemical characterization had obvious spatial heterogeneity. Although the sediments in intertidal flats might have the same source, the results showed that the TOC contents of the sediments at the sample sites were significantly different, as well as significant differences in the pH and grain sizes of the sediments (Table 1). The distributions of the TOC content, pH, and grain sizes of the sediments at the seven sample sites were not consistent (Figure 3). For example, the TOC content of the sediments from site 4 was the highest of the seven sample sites, and the TOC content of the sediments from sites 3 and 6 was the lowest of the seven sample sites (Figure 3a). The pH of the sediments from site 3 was the highest, and the pH of the sediments from site 5 was the lowest of the seven sample sites (Figure 3b). In addition, the TOC content, pH value, clay particle content, and silt particle content of the sediments at different distances from the low-tidal level had no significant differences; only the sand content of the sediments to varying distances from the low-tidal level changed significantly (Table 1).
The S. glauca was the main plant growing in the estuarine intertidal flats of the YRD. The S. glauca densities at the seven sample sites were significantly different (Table 1). At each sample site, S. glauca grew in a range from 200 to 1000 m away from the low-tide level, and the S. glauca density in the range from 400 to 800 m away from the low-tide level was the highest. The areas within 200 m of the low-tide level were bare tidal flats with no S. glauca growth. The distance effect showed that the S. glauca grew best in areas with moderate tidal inundation. This indicated that had the S. glauca densities can be affected by the distance effect of tidal action in some extend. Meanwhile, the S. glauca densities in the estuary were significantly higher than those in the non-estuary areas. There were about eight S. glauca per square meter at site 5, while less than one S. glauca per square meter at sites 1 and 7 (Figure 3f) was found.

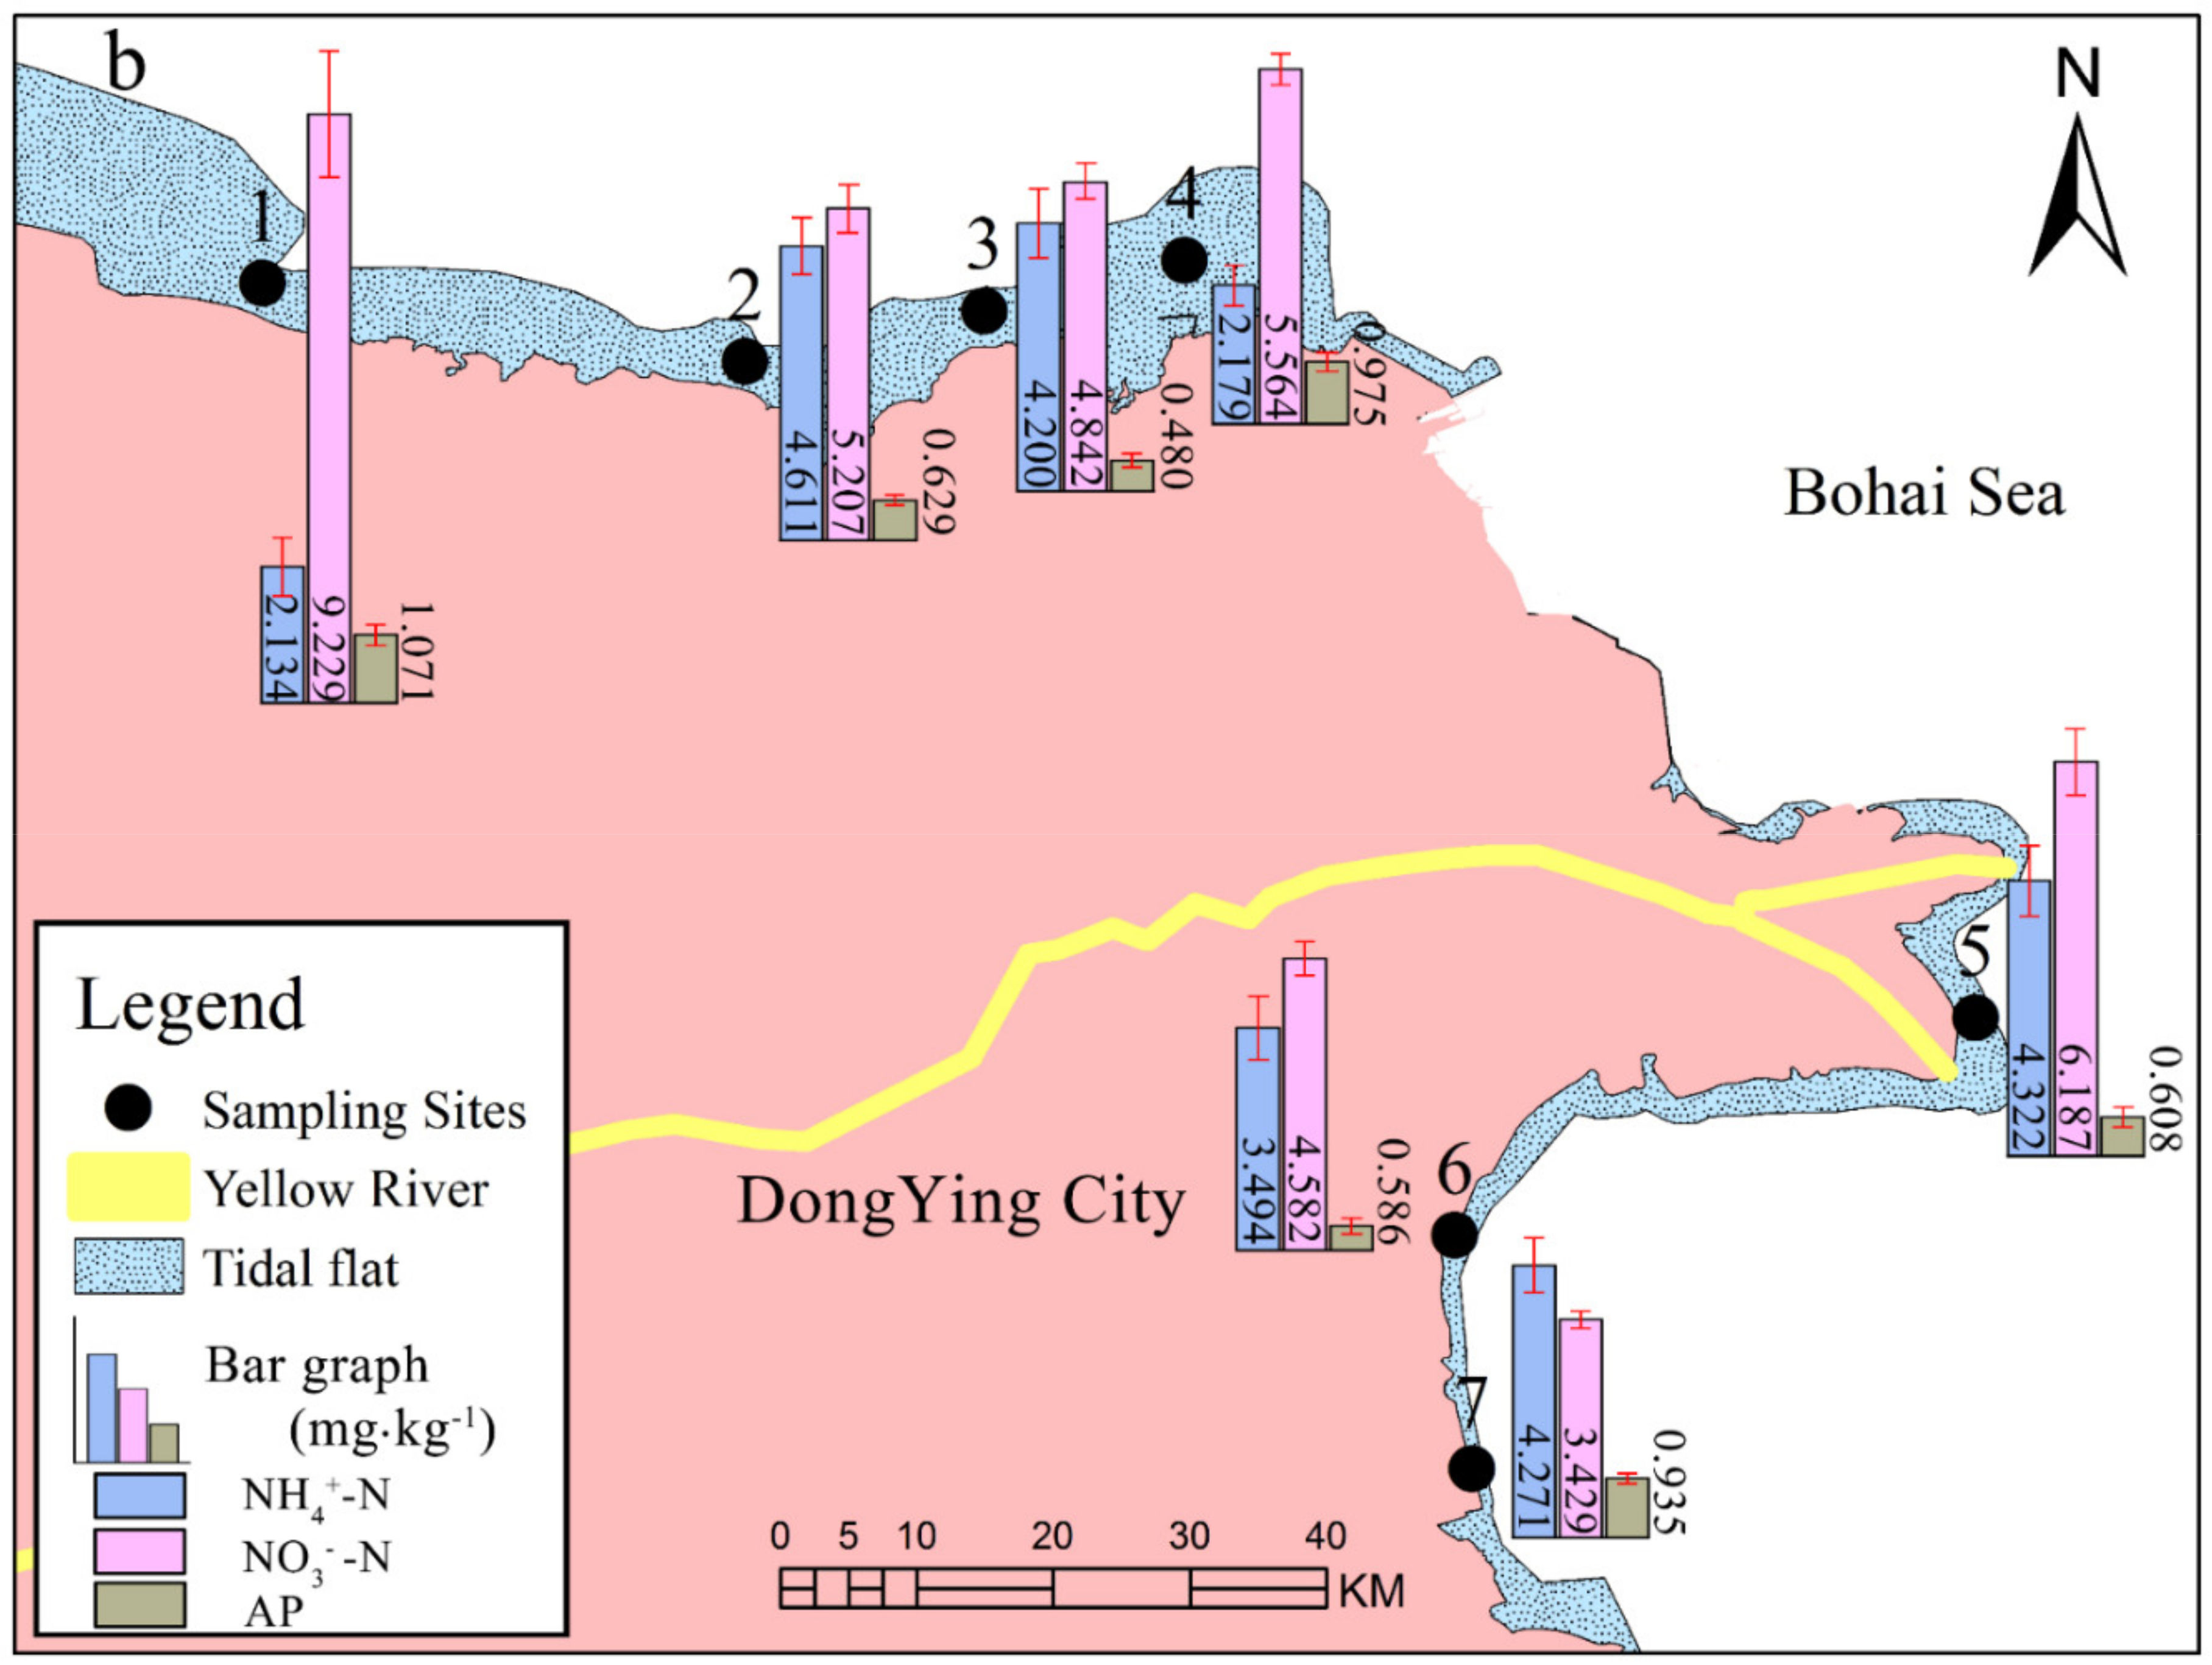
3.2. Nitrogen (N) and Phosphorus (P) Fractions of the Sediments at Different Locations

The spatial distribution of the N and P fractions of the sediments in the intertidal flats had obvious spatial heterogeneity. Moreover, the correlation matrix for the N and P fractions in all samples showed that only TN was significantly negatively correlated with TP (Table 2). The TN concentrations of the sediments at the seven sample sites ranged from 233.20 to 418.50 mg·kg−1 (average: 311.62 mg·kg−1). The average TN concentration of the sediments from sample site 5 was the highest, while the average TN concentration of the sediments from sample site 4 was the lowest (Figure 4). The NH4–N concentrations of the sediments at the seven sample sites ranged from 2.13 to 4.61 mg·kg−1 (average: 3.60 mg·kg−1). The maximum average concentration of NH4–N was in the sediments of sample site 2, while the minimum average concentration was in the sediments of sample site 1. The concentrations of NO3–N in the sediments of the seven sample sites ranged from 3.43 to 9.23 mg·kg−1 (average: 5.58 mg·kg−1). The maximum average concentration of NO3–N was in the sediments of sample site 1, while the minimum average concentration of NO3–N was in sample site 7.
The N and P fractions of the sediments in the intertidal flats of the YRD had some differences. The TP concentrations of the sediments in the sites ranged from 115.30 to 162.80 mg·kg−1 (average 134.57 mg·kg−1). The average TP concentration of the sediments from sample site 2 was the highest, while the average TN concentration of the sediments from sample site 5 was the lowest (Figure 4). The AP concentrations of the sediments at the seven sample sites ranged from 0.48 to 1.07 mg·kg−1 (average 0.75 mg·kg−1). The average AP concentration of the sediments from sample site 1 was the highest, while the average AP concentration of the sediments from sample site 3 was the lowest.

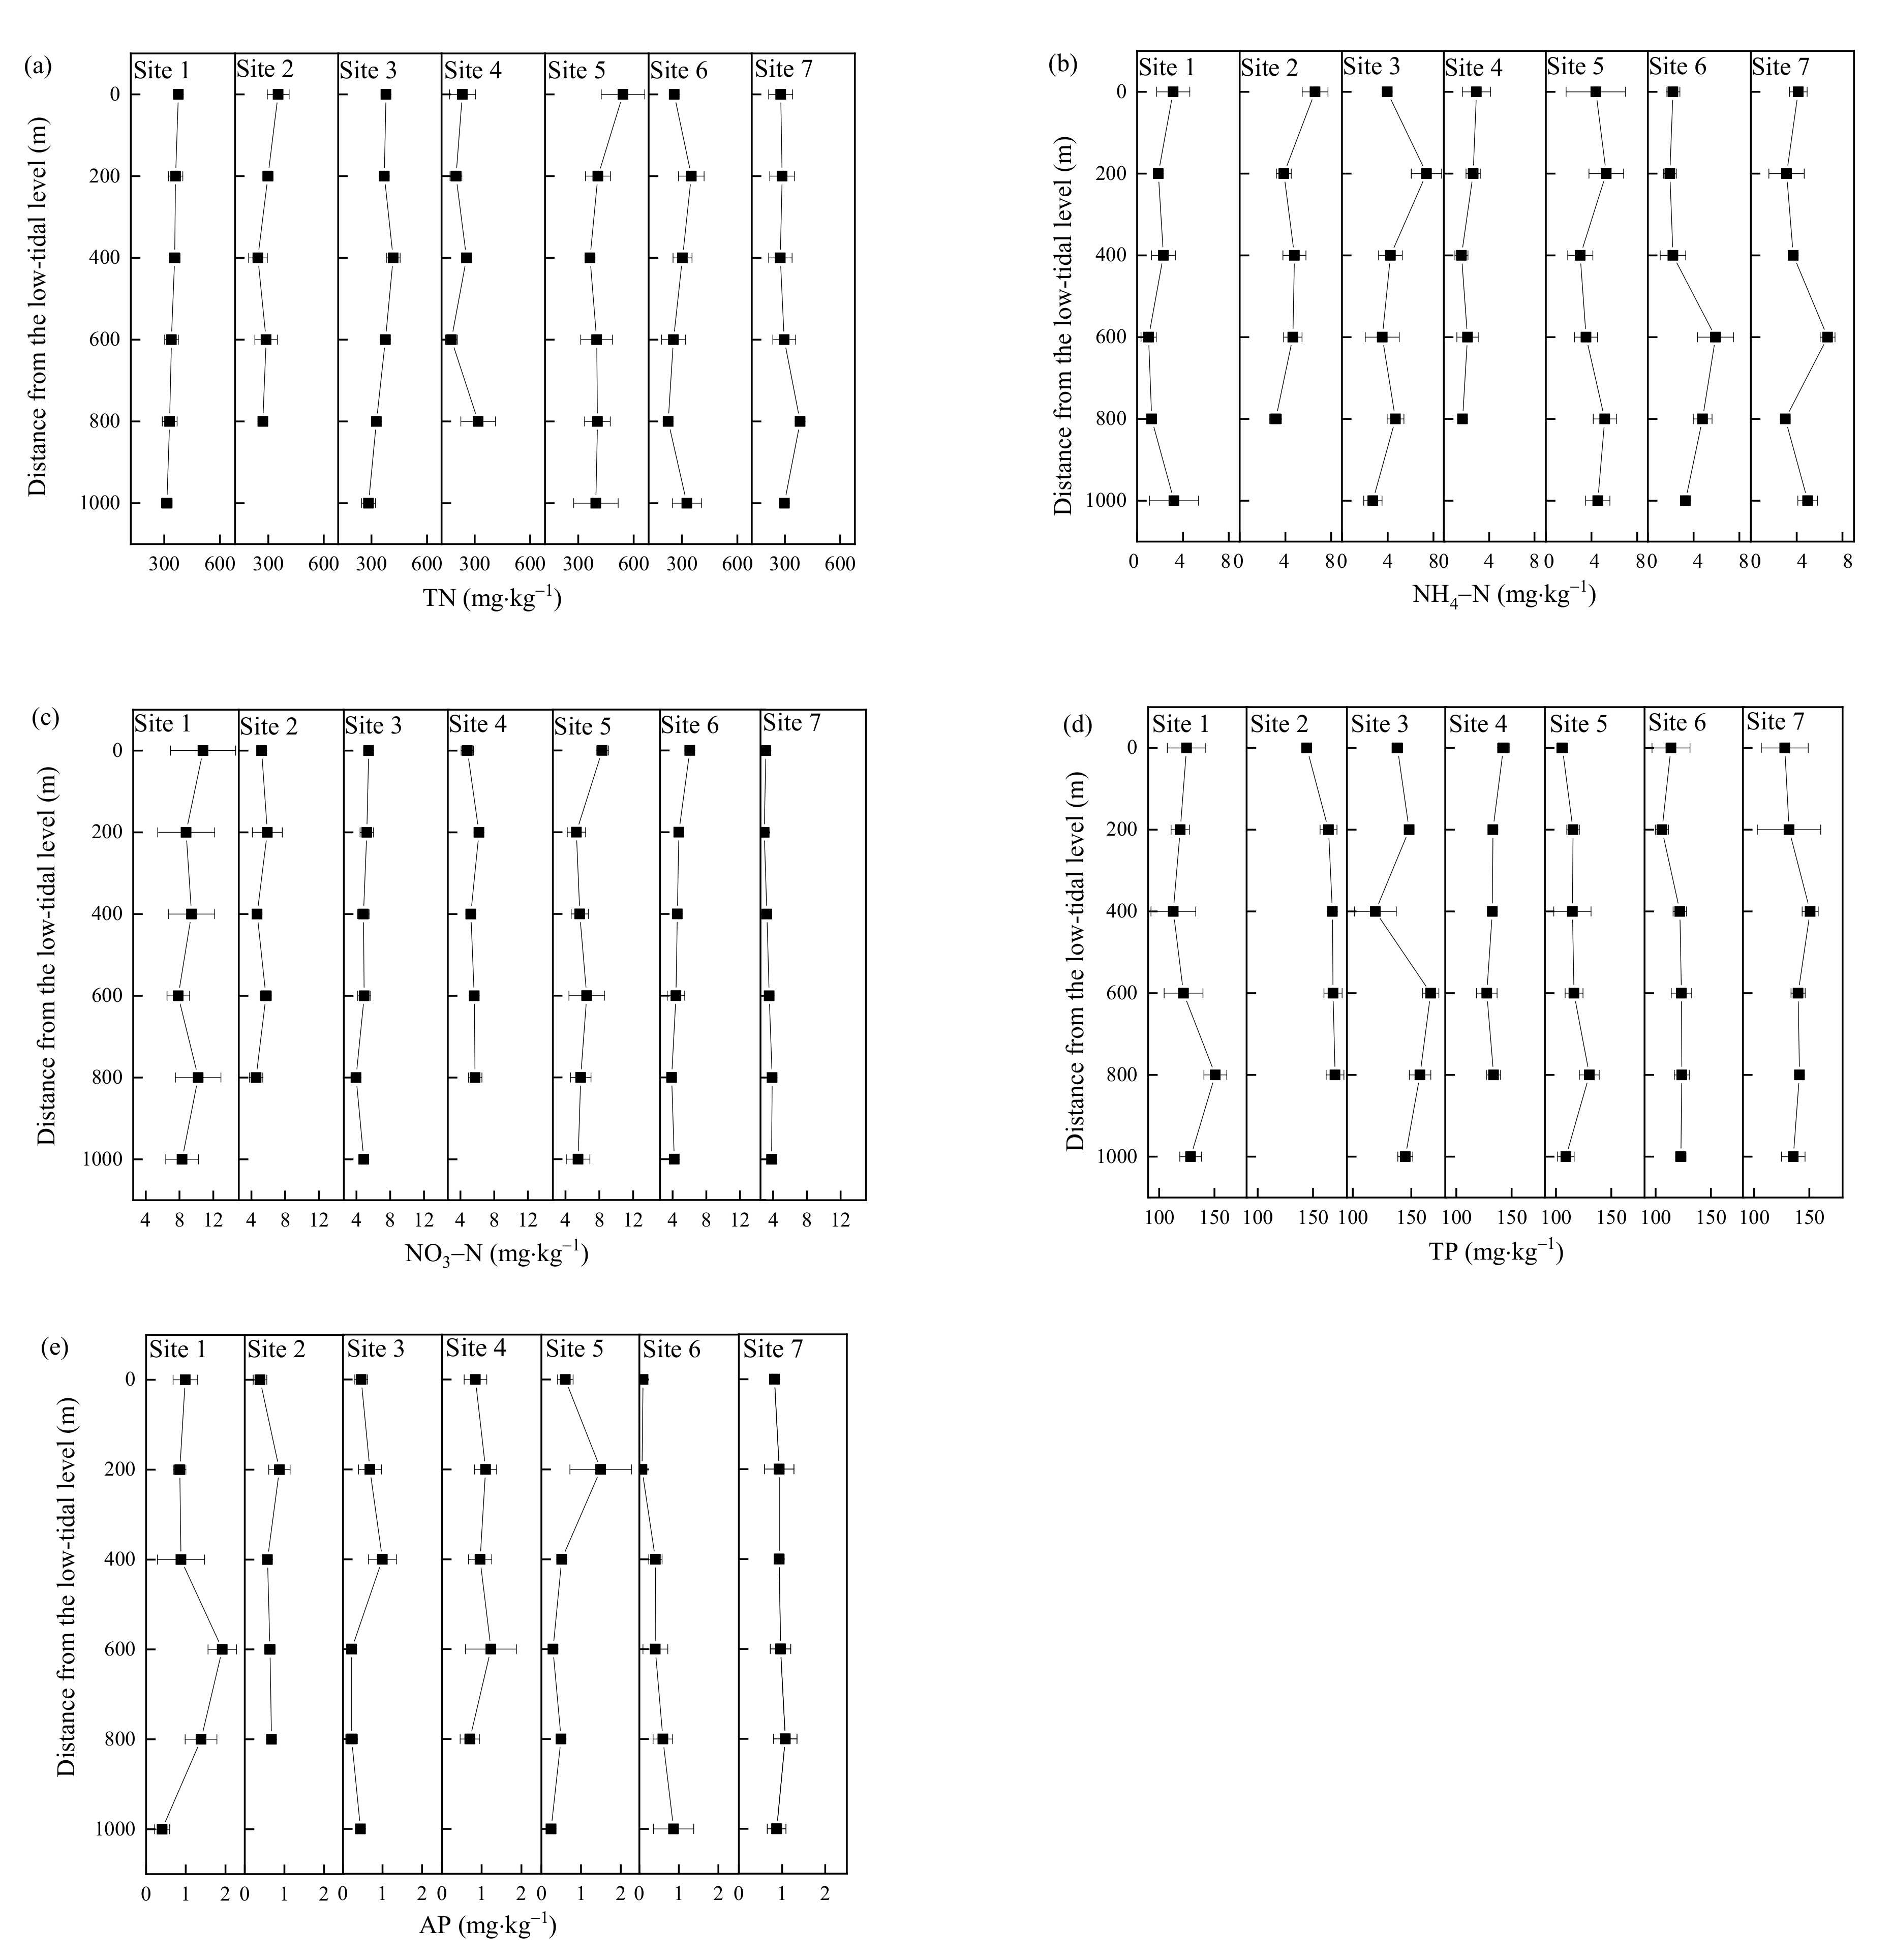
3.3. N and P Fractions of the Sediments at Different Distances from the Low-Tidal Level

The distance effects of the N and P fractions reflected the changes of increased distance from the low-tidal level to the coastline. However, the results showed no significant distance effects. At all of the sample sites, the spatial distribution of the TN content in the sediments at different distances from the low-tidal level was not wholly consistent (Figure 5a), while the differences between the distances were not significant (Table 1); NH4–N and NO3–N also did not present similar characteristics of changing trends, and this might indicate that the spatial distributions of the N fractions in the sediments were heterogeneous between different sampling sites. Except for sample sites 3 and 5, the spatial distributions of the TP (Figure 5e) and AP (Figure 5d) of the sediments at different distances from the low-tidal level were similar, but the differences in the TP and AP of sediments between different distances were not significant (Table 1).

3.4. The Influencing Factors of Spatial Distributions of N and P

Table 2 showed that some N and P fractions were highly correlated with the sediment characteristics, especially with the pH of the sediments. The sediment characteristics might have been controlling the distributions of those fractions. The correlation matrix for the N and P fractions and the environmental factors in all samples showed that the TN, NH4–N and NO3–N were significantly negatively correlated with the pH of the sediments (Table 2). NH4–N was positively correlated with the clay particle content and negatively correlated with the silt particle content. The TP was significantly positively correlated with the pH of the sediments, and the AP was significantly positively correlated with the TOC (Table 2). Plant density was only positively correlated with the TN.
The distributions of TN and TP between the estuary and non-estuary areas of the intertidal flats were significantly different. Among them, the TN in non-estuarine intertidal flats was less than that in the estuaries, and in contrast, the TP was higher in non-estuaries (Figure 4a). However, there were no significant differences in other nutrient components.

4. Discussion

4.1. Spatial Changes in the N and P Fractions in the Coastal Tidal Flat Sediments of China

The distribution characteristics of N and P in the coastal tidal flat sediments were complex [17]. In this study, the average concentrations of the TN and TP in the tidal flat sediments of the YRD were both lower than the background values of China’s shallow sea sediments (TN: 620 mg·kg−1, TP: 500 mg·kg−1) [24], and even the nutrient concentrations in this study were lower than those in other studies in the YRD. It is possible that this is the result of differences in sampling methods, with our sample sites being closer to the low-tide line. The TN, NH4–N, NO3–N, TP, and AP contents of the sediments from the coastal tidal flats were all significantly different between different locations of the YRD (Figure 4), which may indicate that the transport of nutrients in tidal flat is had high spatial heterogeneity. Furthermore, the distributions in nutrients of sediments in the coastal tidal flats of China varied from location to location (Table 3), and these play different roles in the water purification function and ecological balance of wetlands [17,25,26,27,28].
The concentrations of nutrients in non-estuarine coastal tidal flats may not be the same as those in the adjacent estuarine tidal flats (Table 3). The TP and AP contents of the sediments in this study were lower than those in the sediments of the Yellow River estuary tidal flats in previous studies [16,27,28]. However, the TN content in this study was lower or higher than that found in the sediments of the Yellow River estuary tidal flats in previous studies [16,28]. The sources of N and P in the sediments of estuarine and non-estuarine coastal tidal flats may be different [30,37], thus determining their distinct distribution characteristics [38]. Moreover, the distribution of N and P in coastal tidal flat sediments have changed over time. For example, previous studies found that [37,39], compared to around the year 2000, the N and P contents of the sediments in the coastal wetlands of China have increased. As the spatial distribution of N and P are highly heterogeneous (Figure 4), and some nutrients (e.g., TN and TP) differ significantly between estuarine and non-estuarine tidal flats. Therefore, researchers should be very cautious when using the characteristics of N and P in estuarine tidal flat sediments to make inferences about nearby non-estuarine tidal flat sediments.
Contrary to our assumptions, there were no significant differences in the contents (e.g., TN, NH4–N, NO3–N, TP, and AP) of the sediments as the distance increased in the tidal flats from the low-tide level to the coastline (Table 2). This finding is similar to those of other studies in high tidal flats, and middle tidal flats [35]. Furthermore, those findings might indicate that the distance effects of tidal action had no significant correlations with the distributions of N and P. However, the distribution characteristics of N and P in coastal wetlands outside the study areas cannot be inferred with this result. The samples from each site in this study were collected from low-tidal flats with similar elevations and hydrological characteristics, which could directly or indirectly affect the distribution of N and P in the sediments [35,40]. In addition, the coastal tidal flats are threatened by human activities in the YRD [41,42], which could change the N and P sequestration potential [30,31].

4.2. Effects of the Sediments’ Environmental Factors on N and P in the Sediments

The sediments’ environmental factors have important effects on the N and P fractions in the coastal tidal flats [16]; the sediment pH is an especially important factor that affects the nutrient distribution of sediments [43,44], and the effects of the sediment pH on different nutrients may even vary. This study showed a significant negative correlation between the AP and the pH of the sediments, which was in agreement with the findings of previous studies [17,45]. Changes in the soil pH can greatly influence P sorption or desorption in coastal wetlands [44], and the gross N mineralization and NH4–N immobilization processes were related closely to the sediment pH [46]. Sediments N and P levels were affected by soil organic matter [47]. The initial soil organic matter content was found to be an important factor influencing P sorption and desorption [44], and our data supported this conclusion. The TOC of the sediments was significantly positively correlated with the AP in this study.
The spatial variations in the sediment distributions in the tidal flats played an essential role in controlling the concentration, transformation, and redistribution of nutrients [37]. The YRD has a zigzag coast and is a complex delta formed by the superposition of multiple flower-petal-like accumulations [48]. Different geomorphic units have diverse and dynamic sedimentary environments, so sediments have different grain size gradations on the coast of the YRD [49]; our data on the grain size distribution also supported the above view. Variations in the grain size distribution can influence the spatial-patch characteristics of N and P in coastal wetlands [37]. Although the TN content of the sediments was reported to be associated with the clay particle content [37], no significant correlations were observed between them or with NO3–N and AP in this study.

4.3. Effects of Vegetation on N and P in the Sediments

S. glauca is a local therophyte that is widely distributed in the coastal wetlands of the YRD (Figure 2a), and its single populations forms a “red beach” landscape (Figure 2b). It has a strong salt resistance and could improve saline soil [50,51]. N and P are essential nutrients for the growth of S. glauca and can directly affect the primary production of wetland ecosystems [27,52]. Meanwhile, plants affect sediments’ nutrient concentrations and distributions [53,54]. In this study, a significant correlation between the S. glauca density and the TN content of the sediments (Table 2) supported the above conclusions. However, the S. glauca density had different effects on different nutrients in the sediments. There was no significant correlation between the S. glauca density and the TP, NO3–N, NH4–N, and AP contents, unlike on the TN. We believe that the relationship between plants and TN may be related to the lower salt concentrations in estuarine intertidal flats, which are more suitable for plant growth.
The coastal annual plant density may not be the leading determinant of nutrient distributions in sediments. Compared to mangroves and Tamarix, S. glauca may have a weaker capacity to reduce tidal transport and nutrient enrichment [36,55]. Coastal perennials have much larger underground structures and stronger stems compared with annuals. Only parts of their perennial tissues decompose as litter, while the litter of the S. glauca community can completely decompose into the wetland soil within one year [32,56]. It may be challenging to change the nutrient distribution in sediments significantly by increasing the annual plant density. In this study, although there were significant differences in the plant densities between the sample sites, the relationship between plant density and nutrients must be further studied because there was only one species of plants. In addition, compared to the influences of plants, the influence of altitude and hydrological conditions on nutrient distribution may be more intense [35,40].
This study did not consider the ecological effects of microorganisms and algae on nitrogen and phosphorus, so there may be limitations. Some studies indicated that microbial community had high purification capacity in the tidal flats [3]. Thus, not only plant communities but also marine algae and soil microbial microorganisms are needed to quantitatively confirm the distribution of the nitrogen and phosphorus of surface sediments in intertidal flats.

5. Conclusions

The spatial distributions of N and P in the surface sediments in coastal tidal flats of the YRD were investigated. Generally, higher spatial variations in the TN, NO3–N, NH4–N, TP, and AP contents of the sediments were observed between the sample sites in the YRD, while there were no significant differences in the TN, NO3–N, NH4–N, TP, and AP contents of the sediments at different distances from the low-tide level to the coastline. The average concentrations of the TN, NH4–N, NO3–N, TP, and AP of the sediments were 311.62, 3.60, 5.58, 134.57, and 0.75 mg·kg−1, respectively. The average concentrations of the TN and TP in this study were both lower than the background values of China’s shallow sea sediments (TN: 620 mg·kg−1, TP: 500 mg·kg−1). Furthermore, the sediment pH (range: 8.52–8.91) was an important factor that affected the N and P fractions of sediments in the intertidal flats. The S. glauca density affected the distribution of nutrients in the sediments, but it may not be the main effect. Only the S. glauca density and TN had a significant correlation. Therefore, the spatial distributions of the N and P fractions in intertidal flats had obvious spatial heterogeneity in the coastal tidal flats of the YRD. The distance effects of tidal action affected the spatial distributions of plants and sand, but had no significant correlation on the distributions of N and P. Moreover, the distributions of TN and TP between estuarine and non-estuarine intertidal flats were significantly different.

Author Contributions

Conceptualization, G.F., Y.Q. and J.L.; methodology, G.F., Y.Q. and C.Z.; formal analysis, G.F., Y.Q., J.H., Y.M. and J.Z.; investigation, G.F., Y.Q., J.H., Y.M. and J.Z.; writing—original draft preparation, G.F., Y.Q. and J.L.; writing—review and editing, G.F. and Y.Q.; visualization, G.F.; supervision, J.L. and C.Z.; project administration, J.L. and C.Z.; funding acquisition, J.L. and C.Z. All authors have read and agreed to the published version of the manuscript.

Funding

This research was funded by the National Key Research and Development Program of China, grant number 2017YFC0506200; and the Biodiversity Survey and Assessment Project of Ministry of Ecology and Environment, China (2019–2023), grant number 2019HJ2096001006.

Institutional Review Board Statement

Not applicable.

Informed Consent Statement

Not applicable.

Data Availability Statement

The data presented in this study are available on request from the corresponding authors.

Conflicts of Interest

The authors declare no conflict of interest.

References

  1. Xu, Y.; Qu, K.; Zhao, J.; Cui, Z.; Xia, B. Assessment of Environmental Water Quality in the Central Region of the Bohai Sea in Summer. Pro. Fish. Sci. 2017, 38, 8–15. [Google Scholar]
  2. Zhou, K.; Fan, J.; Liu, H. Spatiotemporal patterns and driving forces of water pollutant discharge in the Bohai Rim Region. Pro. Geogr. 2017, 36, 171–181. [Google Scholar]
  3. Song, N.; Wang, N.; Wu, N.; Lin, W. Temporal and spatial distribution of harmful algal blooms in the Bohai Sea during 1952~2016 based on GIS. China Environ. Sci. 2018, 38, 1142–1148. [Google Scholar]
  4. Conley, D.J.; Paerl, H.W.; Howarth, R.W.; Boesch, D.F.; Seitzinger, S.P.; Havens, K.E.; Lancelot, C.; Likens, G.E. Controlling Eutrophication: Nitrogen and Phosphorus. Science 2009, 323, 1014–1015. [Google Scholar] [CrossRef]
  5. Li, X.; Yu, R.; Geng, H.; Li, Y. Increasing dominance of dinoflagellate red tides in the coastal waters of Yellow Sea. China. Mar. Pollut. Bull. 2021, 168, 112439. [Google Scholar] [CrossRef] [PubMed]
  6. Diaz, R.J.; Rosenberg, R. Spreading dead zones and consequences for marine ecosystems. Science 2008, 321, 926–929. [Google Scholar] [CrossRef] [PubMed]
  7. Yu, C.; Li, M.; Bao, C.; Lan, D.; Xu, Y.; Ma, M. Evaluation and risk prediction of eutrophication in Bohai Sea. Mar. Environ. Sci. 2015, 34, 373–376. [Google Scholar]
  8. Liu, Z.-J.; Li, P.-Y.; Zhang, X.-L.; Li, P.; Zhu, L.-H. Regional distribution and ecological risk evaluation of heavy metals in surface sediments from coastal wetlands of the Yellow River Delta. Huanjing Ke Xue 2012, 33, 1182–1188. [Google Scholar]
  9. Wang, Y.; Su, Y. The geo-pattern of course shifts of the Lower Yellow River. J. Geogr. Sci. 2011, 21, 1019–1036. [Google Scholar] [CrossRef]
  10. Kim, J.E.; Park, S.E.; Kim, D.J.; Moon, W.M. Investigation of physical characteristics of intertidal zone using NASA/JPL fully polarimetric AIRSAR data. In Proceedings of the 25th IEEE International Geoscience and Remote Sensing Symposium (IGARSS 2005), New York, NY, USA, 25–29 July 2005; pp. 2082–2085. [Google Scholar] [CrossRef]
  11. Nishio, T.; Nishijima, W.; Hamada, K.; Hata, K.; Nakata, K. Model estimation of the water purification capacity of lost tidal flats. Jarq-Jpn. Agric. Res. Q. 2016, 50, 345–352. [Google Scholar] [CrossRef] [Green Version]
  12. Xu, C.; Pu, L.; Zhu, M. Effect of reclamation activity on coastal ecological environment: Progress and perspectives. Acta Ecologica Sinica 2018, 38, 1148–1162. [Google Scholar]
  13. Murray, N.J.; Phinn, S.R.; DeWitt, M.; Ferrari, R.; Johnston, R.; Lyons, M.B.; Clinton, N.; Thau, D.; Fuller, R.A. The global distribution and trajectory of tidal flats. Nature 2019, 565, 222. [Google Scholar] [CrossRef] [PubMed]
  14. Ro, H.M.; Kim, P.G.; Park, J.S.; Yun, S.I.; Han, J. Nitrogen removal through N cycling from sediments in a constructed coastal marsh as assessed by N-15-isotope dilution. Mar. Pollut. Bull. 2018, 129, 275–283. [Google Scholar] [CrossRef]
  15. Widney, S.; Klein, A.K.; Ehman, J.; Hackney, C.; Craft, C. The value of wetlands for water quality improvement: An example from the St. Johns River watershed, Florida. Wetl. Ecol. Manag. 2018, 26, 265–276. [Google Scholar] [CrossRef]
  16. Gao, Z.Q.; Bai, J.H.; Jia, J.; Wen, X.J.; Zhang, G.L.; Zhao, Q.Q. Spatial and temporal changes of phosphorus in coastal wetland soils as affected by a tidal creek in the Yellow River Estuary. China Phys. Chem. Earth 2015, 89, 114–120. [Google Scholar] [CrossRef]
  17. Gao, Z.Q.; Fang, H.J.; Bai, J.H.; Jia, J.; Lu, Q.Q.; Wang, J.J.; Chen, B. Spatial and seasonal distributions of soil phosphorus in a short-term flooding wetland of the Yellow River Estuary, China. Ecol. Inform. 2016, 31, 83–90. [Google Scholar] [CrossRef] [Green Version]
  18. Watabe, Y.; Sassa, S. Application of MASW technology to identification of tidal flat stratigraphy and its geoenvironmental interpretation. Mar. Geol. 2008, 252, 79–88. [Google Scholar] [CrossRef]
  19. Kim, T.; Noh, J.; Kwon, B.; Lee, C.; Kim, B.; Kwon, I.; Hong, S.; Chang, G.S.; Chang, W.K.; Nam, J.; et al. Natural purification capacity of tidal flats for organic matters and nutrients: A mesocosm study. Mar. Pollut. Bull. 2020, 154, 111046. [Google Scholar] [CrossRef]
  20. Li, S.; Cui, B.; Xie, T.; Zhang, K. Diversity pattern of macrobenthos associated with different stages of wetland restoration in the Yellow River Delta. Wetlands 2016, 36, 57–67. [Google Scholar] [CrossRef]
  21. Li, X.W.; Hou, X.Y.; Song, Y.; Shan, K.; Zhu, S.Y.; Yu, X.B.; Mo, X.Q. Assessing changes of habitat quality for shorebirds in stopover sites: A case study in Yellow River Delta, China. Wetlands 2019, 39, 67–77. [Google Scholar] [CrossRef]
  22. Bolleter, W.T.; Bushman, C.J.; Tidwell, P.W. Spectrophotometric determination of ammonia as indophenol. Anal. Chem. 1961, 33, 592–594. [Google Scholar] [CrossRef]
  23. Parkinson, J.A.; Allen, S.E. Wet oxidation procedure suitable for determination of nitrogen and mineral nutrients in biological. Commun. Soil Sci. Plant Anal. 1975, 6, 1–11. [Google Scholar] [CrossRef]
  24. Zhao, Y.Y.; Yan, M.C. Abundance of chemical elements in China’s shallow sea sediments. Scientia Sinica (Chimica B) 1993, 23, 1084. [Google Scholar]
  25. Neumann, T.; Stogbauer, A.; Walpersdorf, E.; Stuben, D.; Kunzendorf, H. Stable isotopes in recent sediments of Lake Arendsee, NE Germany: Response to eutrophication and remediation measures. Palaeogeogr. Palaeoclimatol. Palaeoecol. 2002, 178, 75–90. [Google Scholar] [CrossRef]
  26. Weissteiner, C.J.; Bouraoui, F.; Aloe, A. Reduction of nitrogen and phosphorus loads to European rivers by riparian buffer zones. Knowl. Manag. Aquat. Ecosyst. 2013, 408, 8. [Google Scholar] [CrossRef]
  27. Sun, J.N.; Xu, G.; Shao, H.B.; Xu, S.H. Potential retention and release capacity of phosphorus in the newly formed wetland soils from the Yellow River delta, China. Clean-Soil Air Water 2012, 40, 1131–1136. [Google Scholar] [CrossRef]
  28. Zhang, S.; Liu, F.; Liu, Q.; Liu, Y.; Li, D. Characteristics of N: P stoichiometry and the adaptation strategies for different coastal wetland communities in the Yellow River Delta. Chinese J. Ecol. 2015, 34, 2983–2989. [Google Scholar]
  29. Wang, J.; Zhang, W.; Guo, N.; Li, C.; Wang, J. The Key Factor of Impact on Temporal and Spatial Variation of Soil Organic Matter, TN and TP in Coastal Salt Marsh: Tide and Vegetation. Sci. Geogr. Sin. 2016, 36, 247–255. [Google Scholar]
  30. Yin, A.J.; Gao, C.; Zhang, M.; Wu, P.B.; Yang, X.H. Rapid changes in phosphorus species in soils developed on reclaimed tidal flat sediments. Geoderma 2017, 307, 46–53. [Google Scholar] [CrossRef]
  31. Xu, Y.; Pu, L.J.; Liao, Q.L.; Zhu, M.; Yu, X.; Mao, T.Y.; Xu, C.X. Spatial variation of soil organic carbon and total nitrogen in the coastal area of mid-eastern China. Intern. J. Environ. Res. Pub. Health 2017, 14, 12. [Google Scholar] [CrossRef] [Green Version]
  32. Cao, L.; Song, J.M.; Li, X.G.; Yuan, H.M.; Li, N.; Duan, L.Q.; Wang, Q.D. Geochemical characteristics of soil C, N, P, and their stoichiometrical significance in the coastal wetlands of Laizhou Bay, Bohai Sea. Clean-Soil Air Water 2015, 43, 260–270. [Google Scholar] [CrossRef]
  33. Hou, L.J.; Wang, R.; Yin, G.Y.; Liu, M.; Zheng, Y.L. Nitrogen fixation in the intertidal sediments of the Yangtze estuary: Occurrence and environmental implications. J. Geophys. Res. Biogeosci. 2018, 123, 936–944. [Google Scholar] [CrossRef]
  34. Shao, X.X.; Liang, X.Q.; Wu, M.; Gu, B.H.; Li, W.H.; Sheng, X.C.; Wang, S.X. Influences of sediment properties and macrophytes on phosphorous speciation in the intertidal marsh. Environ. Sci. Pollut. Res. 2014, 21, 10432–10441. [Google Scholar] [CrossRef]
  35. Zhang, W.L.; Zeng, C.S.; Tong, C.; Zhai, S.J.; Lin, X.; Gao, D.Z. Spatial distribution of phosphorus speciation in marsh sediments along a hydrologic gradient in a subtropical estuarine wetland, China. Estuar. Coast. Shelf Sci. 2015, 154, 30–38. [Google Scholar] [CrossRef]
  36. Guo, P.Y.; Sun, Y.S.; Su, H.T.; Wang, M.X.; Zhang, Y.X. Spatial and temporal trends in total organic carbon (TOC), black carbon (BC), and toted nitrogen (TN) and their relationships under different planting patterns in a restored coastal mangrove wetland: Case study in Fujian, China. Chem. Speciat. Bioavail. 2018, 30, 47–56. [Google Scholar] [CrossRef] [Green Version]
  37. Zhou, J.L.; Wu, Y.; Kang, Q.S.; Zhang, J. Spatial variations of carbon, nitrogen, phosphorous and sulfur in the salt marsh sediments of the Yangtze Estuary in China. Estuar. Coast. Shelf Sci. 2007, 71, 47–59. [Google Scholar] [CrossRef]
  38. Liu, S.; Zhang, J.; Leng, Y.; Cui, W. Nutrient distribution characteristics and its annual variations in the vicinity waters of the Yellow River estuary. Mari. Sci. Bull. 2013, 32, 383–388. [Google Scholar]
  39. Hou, L.J.; Liu, M.; Xu, S.Y.; Ou, D.N.; Yu, J.; Cheng, S.B.; Lin, X.; Yang, Y. The effects of semi-lunar spring and neap tidal change on nitrification, denitrification and N2O vertical distribution in the intertidal sediments of the Yangtze estuary, China. Estuar. Coast. Shelf Sci. 2007, 73, 607–616. [Google Scholar] [CrossRef]
  40. Steinman, A.D.; Ogdahl, M.E.; Weinert, M.; Uzarski, D.G. Influence of water-level fluctuation duration and magnitude on sediment-water nutrient exchange in coastal wetlands. Aquat. Ecol. 2014, 48, 143–159. [Google Scholar] [CrossRef]
  41. Xu, S.Q.; Wang, Y.D.; Guo, C.C.; Zhang, Z.G.; Shang, Y.T.; Chen, Q.; Wang, Z.L. Comparison of microbial community composition and diversity in native coastal wetlands and wetlands that have undergone long-term agricultural reclamation. Wetlands 2017, 37, 99–108. [Google Scholar] [CrossRef]
  42. Yim, J.; Kwon, B.O.; Nam, J.; Hwang, J.H.; Choi, K.; Khim, J.S. Analysis of forty years long changes in coastal land use and land cover of the Yellow Sea: The gains or losses in ecosystem services. Environ. Pollut. 2018, 241, 74–84. [Google Scholar] [CrossRef]
  43. Adhami, E.; Owliaie, H.R.; Molavi, R.; Rashti, M.R.; Esfandbod, M. Effects of soil properties on phosphorus fractions in subtropical soils of Iran. J. Soil Sci. Plant Nutr. 2013, 13, 11–21. [Google Scholar] [CrossRef] [Green Version]
  44. Bai, J.H.; Ye, X.F.; Jia, J.; Zhang, G.L.; Zhao, Q.Q.; Cui, B.S.; Liu, X.H. Phosphorus sorption-desorption and effects of temperature, pH and salinity on phosphorus sorption in marsh soils from coastal wetlands with different flooding conditions. Chemosphere 2017, 188, 677–688. [Google Scholar] [CrossRef] [PubMed]
  45. Gustafsson, J.P.; Mwamila, L.B.; Kergoat, K. The pH dependence of phosphate sorption and desorption in Swedish agricultural soils. Geoderma 2012, 189, 304–311. [Google Scholar] [CrossRef] [Green Version]
  46. Lin, X.B.; Hou, L.J.; Liu, M.; Li, X.F.; Zheng, Y.L.; Yin, G.Y.; Gao, J.; Jiang, X.F. Nitrogen mineralization and immobilization in sediments of the east China sea: Spatiotemporal variations and environmental implications. J. Geophys. Res. Biogeosci. 2016, 121, 2842–2855. [Google Scholar] [CrossRef]
  47. Yang, W.J.; Hao, F.H.; Cheng, H.G.; Lin, C.Y.; Ouyang, W. Phosphorus fractions and availability in an albic bleached meadow soil. Agron. J. 2013, 105, 1451–1457. [Google Scholar] [CrossRef]
  48. Peng, J.; Chen, S.; Liu, F.; Lu, Q.; Chen, Y. Erosion and siltation processes in the lower Yellow River during different river courses into the sea. Acta Geographica Sinica 2010, 65, 613–622. [Google Scholar]
  49. Xu, W.; Chen, S.; Li, P.; Gu, G. Distribution characteristics of sedimentation and suspended load and their indications for erosion-siltation in the littoral of Yellow River Delta. J. Sed. Res. 2016, 3, 24–30. [Google Scholar]
  50. Zhao, K.; Fan, H.; Jiang, X.; Song, J. Improvement and utilization of saline soil by planting halophytes. Chin. J. Appl. Environ. Biol. 2002, 8, 31–35. [Google Scholar]
  51. Li, Q.; Luo, L.; Chen, Y.; Wang, W. Selection of salt-tolerant plants for high-salinity wastewater treatment by constructed wetlands. Chin. J. Appl. Environ. Biol. 2017, 23, 873–878. [Google Scholar]
  52. Matzke, S.; Elsey-Quirk, T. Spartina patens Productivity and soil organic matter response to sedimentation and nutrient enrichment. Wetlands 2018, 38, 1233–1244. [Google Scholar] [CrossRef]
  53. Hayes, M.A.; Jesse, A.; Tabet, B.; Reef, R.; Keuskamp, J.A.; Lovelock, C.E. The contrasting effects of nutrient enrichment on growth, biomass allocation and decomposition of plant tissue in coastal wetlands. Plant Soil 2017, 416, 193–204. [Google Scholar] [CrossRef]
  54. Phillips, D.H.; Kumara, M.P.; Jayatissa, L.P.; Krauss, K.W.; Huxham, M. Impacts of Mangrove Density on Surface Sediment Accretion, Belowground Biomass and Biogeochemistry in Puttalam Lagoon, Sri Lanka. Wetlands 2017, 37, 471–483. [Google Scholar] [CrossRef]
  55. Du, N.; Wu, P.; Eller, F.; Zhou, D.Y.; Liu, J.; Gan, W.H.; Yang, R.R.; Dai, M.; Chen, Y.D.; Wang, R.Q.; et al. Facilitation or competition? The effects of the shrub species tamarix chinensis on herbaceous communities are eependent on the successional stage in an impacted coastal wetland of north China. Wetlands 2017, 37, 899–911. [Google Scholar] [CrossRef]
  56. Mou, X.J.; Sun, Z.G.; Wang, L.L.; Wang, C.Y. Nitrogen cycle of a typical Suaeda salsa marsh ecosystem in the Yellow River estuary. J. Environ. Sci. 2011, 23, 958–967. [Google Scholar] [CrossRef]
Figure 1. Locations of the study area and sampling sites. (a) Location map of the study area; (b) Distribution map of the sampling sites; (c) Schematic drawing of the experimental designs in sampling site 6.
Water 13 02899 g001
Figure 2. Suaeda glauca (a) and the population of S. glauca (b) in the intertidal flats of the Yellow River Delta (YRD).
Water 13 02899 g002
Figure 3. The physical and chemical properties of the sediments and plant density at the seven sample sites. (a) Total organic carbon (TOC) (mg·kg−1); (b) The pH of surface sediments; (c) Clay (%); (d) Silt (%); (e) Sand (%); (f) Plant density (ind·m−2). The whiskers in the charts are standard errors, each letter (a, b, c, d) indicates a significant difference according to Fisher’s LSD test, and the same letter means that there were no significant differences.
Water 13 02899 g003
Figure 4. The average concentrations of the nitrogen and phosphorus fractions in surface sediments at the seven sample sites. (a) Spatial distributions of total nitrogen (TN), and total phosphorus (TP) (mg·kg−1); (b) Spatial distributions of ammonium nitrogen (NH4–N), nitrate nitrogen (NO3–N), and available phosphorous (AP) (mg·kg−1). The whiskers in the charts are standard errors.
Water 13 02899 g004aWater 13 02899 g004b
Figure 5. The concentrations of the nitrogen and phosphorus fractions of the sediments at different distances from the low-tidal level to the coastline at the seven sample sites. (a) Total nitrogen (TN) (mg·kg−1); (b) Ammonium nitrogen (NH4–N) (mg·kg−1); (c) Nitrate nitrogen (NO3–N) (mg·kg−1); (d) Total phosphorus (TP) (mg·kg−1); (e) Available phosphorous (AP) (mg·kg−1). The whiskers in the charts are standard errors.
Water 13 02899 g005
Table 1. One-way ANOVA results (F values) for testing for the sample sites and the distance from the low-tidal level with nitrogen and phosphorus in the surface sediments.
Source of
Variation
d.f.TNNH4–NNO3–NTPAPTOCpHClaySiltSandPlant Density
Sample sites67.562 ***5.211 ***14.448 ***12.875 ***4.274 ***13.366 ***11.462 ***6.897 ***7.327 ***2.359 *8.313 ***
Distance from the low-tidal level 60.9290.4290.4921.4440.8031.0050.4460.9530.3683.621 ***1.766
Note: TN = Total nitrogen content, NH4–N = Ammonium nitrogen content, NO3–N = Nitrate nitrogen content, TP = Total phosphorus content, AP = Available phosphorus content. d.f.: degrees of freedom; ns: not significant; * p < 0.05; *** p < 0.001. The data conform to normality (Shapiro-Wilk Test, p > 0.05) and homogeneity of variance (Levene Test, p > 0.05).
Table 2. The Pearson correlation coefficients for different forms of nitrogen and phosphorus and the environmental factors of the sediments (n = 120).
NH4–NNO3–NTNAPTPClaySiltSandpHTOC
NO3–N−0.1471
TN−0.0170.1271
AP−0.0940.124−0.0061
TP0.084−0.118−0.183 *−0.1561
Clay0.272 **−0.0370.0930.0850.0261
Silt−0.236 *−0.008−0.047−0.0220.105−0.519 **1
Sand0.0720.037−0.014−0.038−0.141−0.139−0.774 **1
pH−0.206 *−0.210 *−0.276 **−0.217 *0.250 **−0.488 **0.441 **−0.1511
TOC−0.0430.134−0.0660.228 *−0.0340.595 **−0.394 **0.017−0.376 **1
Plant density0.0700.0810.310 **0.010−0.1650.133−0.1660.094−0.315 **0.139
Note: ns: not significant; * p < 0.05; ** p < 0.01.
Table 3. Total nitrogen (TN), NH4–N, NO3–N, total phosphorus (TP), and available phosphorous (AP) concentrations (mg·kg−1) in the surface sediments of coastal tidal flats reported from various geographic locations in China compared to our results.
Study AreaTNNH4–NNO3–NTPAPReference
Non-estuary regionThe Yellow River Delta233.2–358.52.130–4.6103.430–9.230118.6–162.80.410–1.070this study
The Northern coast of Jiangsu Province in Mid-Eastern China300.0–560.0--590.0–1150.0-[29]
The Northern coast of Jiangsu Province in Mid-Eastern China---594.8–887.9-[30]
The Southeast coast of Jiangsu Province in Mid-Eastern China210.0----[31]
EstuaryThe Yellow River Estuary418.54.3226.187115.30.608this study
The Yellow River Estuary608.0--716.0-[28]
The Yellow River Estuary120.0–340.0--585.8–633.52.750–4.900[16]
The Yellow River Estuary---692.0-[27]
The Yihong River Estuary in Laizhou Bay213.0–317.0--336.0–393.0-[32]
The Yangtze Estuary-34.100–106.3002.600–5.500--[33]
The Qiantang River Estuary---560.0–680.0-[34]
The Min River Estuary---338.0–930.0-[35]
The Jinjiang Estuary1100.0–2560.0----[36]
Publisher’s Note: MDPI stays neutral with regard to jurisdictional claims in published maps and institutional affiliations.

