Article

Quantitative Analysis of Malachite Green in Environmental Samples Using Liquid Chromatography-Mass Spectrometry

by
Afnan Ali Hussain Hakami
1,
Mohammed Asif Ahmed
2,
Moonis Ali Khan
1,
Zeid A. AlOthman
1,
Mohd Rafatullah
3,*,
Md. Ataul Islam
4 and
Masoom Raza Siddiqui
1,*
1
Chemistry Department, College of Science, King Saud University, Riyadh 11451, Saudi Arabia
2
Department of Food Science and Nutrition, Faculty of Food and Agriculture Science, King Saud University, Riyadh 11451, Saudi Arabia
3
School of Industrial Technology, Universiti Sains Malaysia, Penang 11800, Malaysia
4
Division of Pharmacy and Optometry, School of Health Sciences, Faculty of Biology, Medicine and Health, University of Manchester, Manchester M13 9PL, UK
*
Authors to whom correspondence should be addressed.
Water 2021, 13(20), 2864; https://doi.org/10.3390/w13202864
Submission received: 12 August 2021 / Revised: 27 September 2021 / Accepted: 9 October 2021 / Published: 14 October 2021

Abstract

:
Water is an essential part of life, however, with continued modernization, it has become a dumping place for many pollutants including dyes. The polluted water can severely affect human health. Polluted water can enter into the human body through different channels, including the food web. Thus, it is very important for human beings and animals to have access to pollution free water. To get the knowledge of the pollutants, in this case, a dye, we need sensitive analytical procedure which could tell the amount of dye in water and also steps to get the pollutant removed from water. In this work, a liquid chromatography–mass spectrometry (LC-MS/MS) based analytical method was developed to determine malachite green. The method was developed after proper optimization of the experimental conditions, where finally, ethanol, a green solvent and formic acid, a food additive was selected to constitute the mobile phase in ratio 1.5:1.0. Different validation parameters were used to authenticate the reliability of the method. Based on the experiment results, the method was found to be linear in the range of 0.1 to 10 mg/L with an excellent correlation coefficient of 0.9995. The corresponding linear regression equation was found to be A = −6863.2 + 105,520 C; where A is the area of the peak and C is the concentration of malachite green. The precision study proves the reproducibility of LC-MS/MS procedure, throughout the precision experiment percent relative standard deviation (% RSD) was found to be between 0.709–1.893%. Similarly, the experiments on the recovery suggest a recovery of 97.28–98.75%. The new method was applied to check the amount of malachite green in environmental samples including the industrial wastewater. The wastewater sample was extracted using the solid phase extraction (SPE) technique, where a new adsorbent—wood apple hydrochar—was synthesized and used as the solid phase for the preparation of a solid phase extraction column to extract the malachite green. The synthesized adsorbent was characterized using different techniques. To conclude, the developed method can be used for determination of malachite green in environmental samples, and the SPE technique using wood apple hydrochar can successfully extract the dye from the water samples.

1. Introduction

Malachite green (MG) is a triarylmethane class of dye and chemically known as [4-[[4-(dimethylamino)phenyl]-phenylmethylidene]cyclohexa-2,5-dien-1-ylidene]-dimethylazanium chloride. Apart from as a dyestuff it is widely used as an antimicrobial agent in aquaculture, although the use remains controversial as MG was detected in a number of fish samples. As MG is classified as a class II health hazard, its presence in food material raises concerns for regulatory authorities [1]. It is a water-soluble basic dye and available as a green crystalline powder. Although not approved by the USFDA, MG has been extensively used throughout the world for dyeing of jute, wool, leather products, paper and cotton. The usage of MG for human applications is also reported where it acts as fungicidal agent and antibacterial agent [2]. The reports on MG suggest that it has toxic effects on human beings. In the literature, MG usage in food industries too has also been described, where, it was reportedly used as food coloring agent, unscrupulously. Anthelminthic and medical disinfectant properties of MG are also highlighted in the literature. Apart from the number of benefits and uses, MG is linked to several disadvantages, which could cause several ill effects for humans both in the short or long term. The dye is reported to be environmentally persistent and to accumulate within the tissue of the living organism. Once ingested it can cause damage to different organs such as the brain, liver and nervous system. Additionally, other ill effects associated with MG are eye burn, sweating, fast breathing and multiple organ cancer. Dyscrasia, anemia and leukocytosis are also reported to be associated with MG [3]. Looking at the significance of the MG and its usability in different field, it is one of the many dyes which is widely studied by analytical chemists. In the literature, numerous articles are present which involves different analytical instruments for the quantitative investigation of MG, with several different matrices. Spectrophotometry is one of the oldest analytical techniques, which are still prevalent these days [4,5,6,7]. Electrochemical methods too were used for the quantitative analysis of MG [8,9,10,11]. Chromatographic technique is an important tool for the determination of dyes in general and MG in this article the technique involves HPLC [12,13,14,15] and LC-MS/MS [16,17]. Some recent review articles were published dealing in the analysis of dyes and low cost adsorbent [18,19]. The literature is also flooded with several articles related to the removal of dyes, where hydrochar and marine algae was used as adsorbent [20,21]. Considering its widespread applicability, it is very important to assay the compound using accurate analytical techniques including liquid chromatographic (LC) procedure, which requires a suitable mobile phase for the analysis of such an analyte. The reported procedures indicate analytical investigation of MG was done using several LC-MS/MS techniques, including the fast ultra-performance technique, where most of the authors used acetonitrile (MeCN) and methanol (CH3OH) as organic modifier while the other contributor of the mobile phase was ammonium chloride or ammonium acetate buffer. However, concerning the environmental factors, it is important to opt for an ecofriendly mobile phase. In this study ethanol and 0.1% formic acid was considered as mobile phase. Ethanol is a green solvent while formic acid is used as a food additive in sweets, bakery products, ice-cream and beverages. The E-number, using the codes for the food additives, is 236, which is the same as for formic acid. The two-component combination has been employed in the LC-MS/MS studies in the past for the pharmaceutical compound [22]. For the method development, the adsorbent was synthesized to serve as solid phase in the solid phase extraction (SPE) of MG. As it is resistant to biological degradation, then it is foremost task to get it removed using alternate method, one such method is SPE. The literature is not so enriched in terms of the number of publications of solid phase extraction, although there are few analytical techniques available [23,24,25]. In our work wood apple was used to synthesize hydrochar, which served as sorbent material for the SPE. Hydrochar is the product of the hydrothermal carbonization process, which is an environment friendly process involving the use of water. Dry biomass material is totally avoided, which enables to set-aside costly separation method and drying arrangements. The pollution free procedure is yet another advantage of hydrothermal carbonization [26].

2. Materials and Methods

2.1. Chemicals and Reagents

All the chemicals and the reagents used in the current study were of analytical reagents grade or spectroscopic grade. MG was procured from sigma Aldrich. Formic acid and ethanol produced by BDH, Poole, England, were purchased from local supplier. Methanol, acetonitrile, dichloromethane, formic acid, hydrochloric acid and NaOH used during different stages of the experiments were produced by Merck. Purified water from the Millipore water system was used throughout the experiment. The individual apparatuses involved in the solid phase extraction such as vacuum manifold, empty Extrelut-20 columns, coupling pieces, stopcocks were obtained from Supelco, Germany; Darmstadt, Germany, and Varian, Harbour City, respectively. MG stock solution was prepared by dissolving 15 mg in 1 L of water. The stock solution was prepared in larger volume so that larger amount of analyte can be taken to prepare accurate dye solution. The stock solution was further diluted to prepare eight working solution in the range of 0.1 to 10 mg/L. To attain the optimal SPE conditions, 5 mg/L MG solution was taken up for the study.

2.2. Instrumentation

The condition for the quantitative investigation of MG was developed on an Agilent 1260 HPLC-MS system, that contained a binary pump and auto sampler. Other components included a temperature controlled column oven and a DAD detector that was not used during the current study. In our study the MG was quantitatively examined using an Agilent triple quadrupole mass spectrometer. The solid phase extraction was accomplished on Supelco solid phase extraction assembly. The assembly was comprised of the extraction column, vacuum manifold, and the stopcocks and coupling pieces which were applied to complete the extraction columns. Sample weighing is an important aspect of the quantitative analysis, during the experiments all the samples that required weighing were weighed on a Prescica XB 220A weighing balance. Spectrophotometric measurements were performed on a UV-visible spectrophotometer; manufactured by Thermos Scientific; Model: evolution 600; country: UK. Other accessories included a Quartz UV cell for absorbance measurement. The study also involved the characterization of the sorbent materials used during the solid phase extraction.

2.3. Sample Collection

Samples for the wastewater were collected from few places of Riyadh as well as from the Indian industries waste. The sample was collected in glass bottles, amber in color. The collected samples were filtered using Whatman No. 1 filter paper. The samples taken up for the study were collected as the last fraction, whereby the filter paper is saturated and there are negligible additional adsorption possibilities on the filter paper. Precursor material for the sorbent, i.e., apple wood, was collected from the local hypermarket in Riyadh, Saudi Arabia and was labelled to be of Indian origin.

3. Experimental

3.1. Preparation of Standard Solution

The standard solution was prepared by dissolving 15 mg of MG in 1000 mL of milli Q water to prepare a standard stock solution of 15 mg/L. Further, the standard stock solution was diluted as required. Eight calibration samples were prepared by further diluting the standard solution.

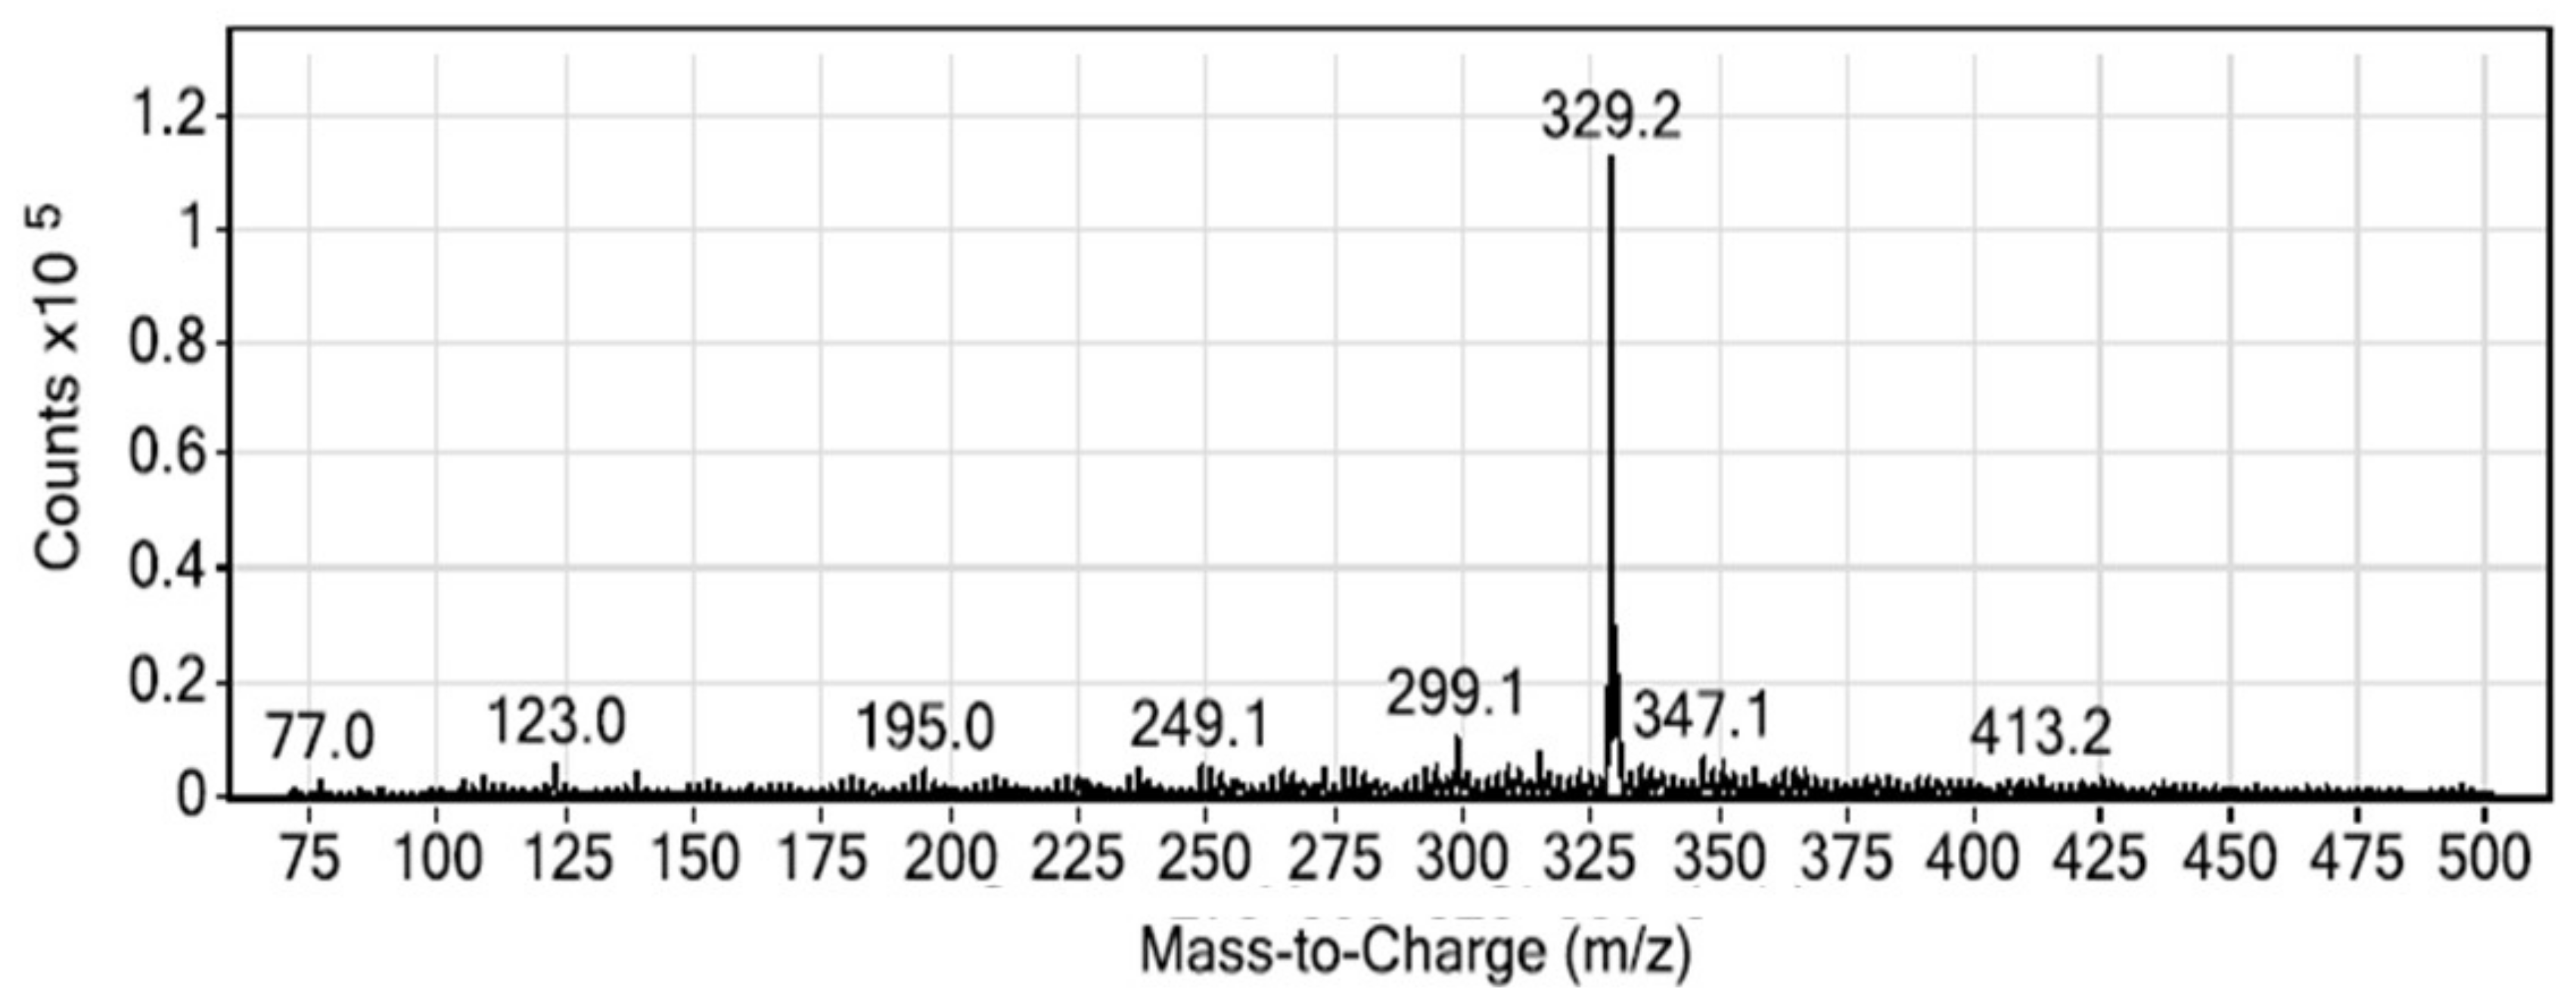
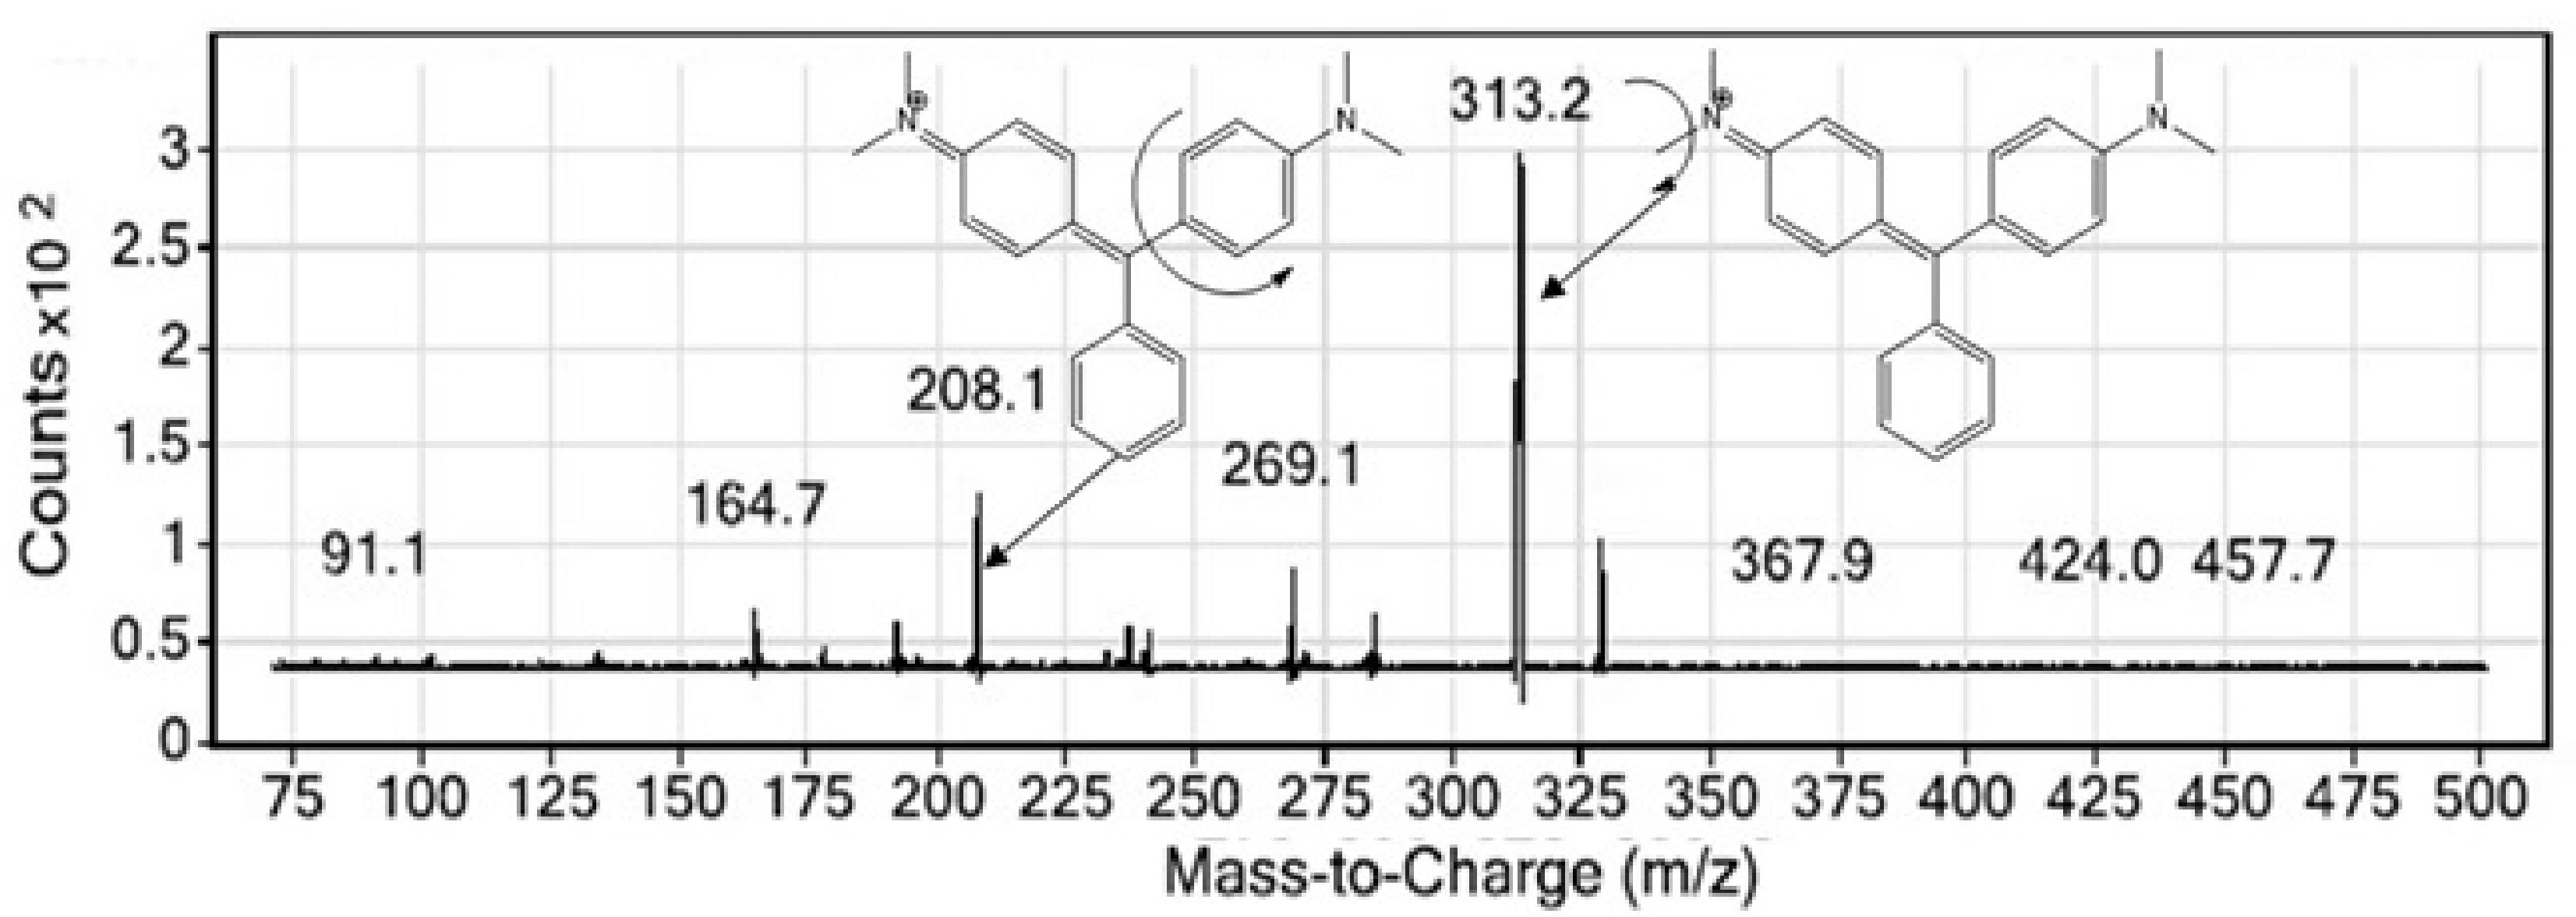
3.2. LC-MS/MS Investigation of MG

Liquid Chromatographic Conditions

As mentioned above, the Agilent LC-MS system was used for the current study. The separation of the dye was achieved on Shimpack CLC-ODS column (4.6 × 150 mm), guard column too was used throughout the chromatographic runs. Mobile phase consists of ethanol (solvent A) and 0.1% formic acid in water (Solvent B). Ethanol serves as an organic modifier and contributed 60% of the total mobile phase composition, while involvement of formic acid, which is the other constituent, remained 40%. In an attempt to get reproducible results including the retention time and stable signals, the mobile phase was run at the experimental condition for the equilibration of the LC column.

3.3. MS/MS Conditions

After proper optimization, the qualitative investigation of MG was achieved using MRM, i.e., multiple reaction monitoring mode with positive-ion electrospray ionization. The optimized MS condition were gas temperature 350 °C, gas flow 11 L/min, Nebulizer-35 psi and capillary voltage 4000 V.

3.4. Synthesis of Adsorbent Materials

Aegle marmelos L., commonly known as wood apple or stone apple was purchased from the local market in Riyadh. After consumption of the pulp, the shell was washed to remove the fibers and attached fleshy material. The washed wood apple shell was sun dried and crushed to small pieces followed by grinding in ball mill to get a mixture of powder and tiny sized wood apple shell. Further, 10 g of the crushed wood apple shell was mixed with 25 mg of citric acid and dissolved in 90 mL of milli Q water and stirred for 1 h. The next day, the whole content was put in hydrothermal reactor equipped with stainless steel shell and 200 cm2 Teflon chamber, the reactor was sealed and heated at 523.15 K. After 5 h of hydrothermal carbonization the reactor was allowed to cool at 20 °C which was the room temperature at the period of analytical investigation. The synthesized hydrochar material was removed dried, grounded and powdered manually. The powdered hydrochar material was then treated with 10% H2O2 for 2 h and was allowed to dry. After drying the material was collected for further studies.

3.5. Sample Extraction Procedure

The wastewater sample collected from different locations within and outside Riyadh. The collected samples were initially passed through the Whatman filter paper and the last 250 mL portion of 1 L of the sample was collected for analysis purpose. Prior to the start of the MG extraction, the extraction column was equipped with solid phase by taking 0.5 gm of the sorbent materials (wood apple hydrochar), the sorbent material was compressed in between the two coupling pieces to complete the SPE column. Then, the prepared column was flushed by passing 15 mL of milli Q water followed by drying of the prepared SPE column under vacuum for time duration of 15 min. Fifty mL of wastewater or water samples spiked with the MG were chosen for extraction purpose. The investigation samples were allowed to pass through the SPE column at a controlled flow rate of 0.75 mL per minute. After passing the complete 50 mL volume of the wastewater, the SPE column was again flushed with milli Q water with two fractions each of 25 mL and dried under vacuum condition. After the adsorption process, elution of the adsorbed dye is equally important to get the quantitative information of MG. For elution, methanolic formic acid was used that was comprised of 1% formic acid prepared in methanol. The extracted dye that was desorbed in the methanolic formic acid, dried and reconstituted in methanol: water (50:50) and was subjected to LC-MS/MS analysis.

4. Results and Discussion

4.1. Method Development and Optimization

The optimization of the instrumental condition starts with the optimization of the MS conditions. The selection of a proper electrospray ionization is vital in selecting the parent ion, chemical ionization characteristics of the analyte decides the most favorable ionization mode. The MG sample was electrosprayed and ionized in an MRM approach where the positive ionization and negative ionization mode was checked to achieve the best outcomes. The obtained result suggests that the positive ionization suits best for the MG. The spectra resulting from the positive ionization mode is cited as Figure 1. It is evident from the figure that the precursor ion 329.2 exists in the positive mode, which was not found in the negative ionization, possibly meaning that it failed to fragment the desired ion. Similarly, the fragmentation pattern of the daughter ions in positive ionization mode can be seen from the spectra mentioned in Figure 2. As evident from the figure that predominantly, two daughter ions resulted from the fragmentation of the parent ion, MG or the precursor ion (MG). The daughter ions at m/z; 313.2 and 208.1 are the two product ions formed where, owing to higher sensitivity, 313.2 was used for quantitative purpose, while 208.1, the other fragment, was taken up for the confirmation purpose. The details of the MS source parameters are mentioned in Table 1.
Besides the MS parameter, the liquid chromatography (LC) condition also needs to be optimized for correct analysis of the MG dye, a known environmental pollutant. As per the regulatory guidelines, any change in the existing procedure or a new analytical procedure must be validated using the recommended parameters so that it qualifies for quantitative investigation. In this study too, analytical method involving LC-MS technique was developed and later validated. While developing new method, there are several trails on experimental LC conditions including multiple mobile phase combinations. The optimization of the experimental conditions proceeded in such a manner that the resulting analyte signal as chromatograms and the corresponding peak area ought to be even and should have excellent sensitivity.
Few research articles are accessible from the journals database for MG determination, the study reveals that almost all the method involves the use of toxic solvents as mobile phase constituent. One of the substitutes for these toxic organic modifiers is ethanol. The study conducted to highlight the comparison of methanol and acetonitrile to that of ethanol suggests that ethanol can be used for the organic modifier role with excellent chromatographic properties [27]. The toxicity profile of ethanol is well known and is consumed by a huge population, as is formic acid, owing to its low toxicity is used as food additive (E236) and comes under the category of organic preservatives where it is believed to have antimicrobial properties [28]. In this chromatographic experimental condition exploration, ethanol and formic acid was selected as mobile phase. The first trial of the ethanol:formic acid (20:80) was unsuccessful with a small broad peak with uneven baseline was observed. Further trials were performed, where there was little towards perfection in the peak shape accompanied by a better base line, which still requires further improvement. The retention time also required improvement, as the signal response was at 18 min (ethanol: formic acid (40:60). Changing the mobile phase composition to 50:50 (ethanol: 0.1% formic acid) further improved the peak shape and the sensitivity with a stable base line but the peak was not completely resolved and a shoulder appeared in the peak. In addition to the distorted peak, the retention time was also a matter of concern, as the peak appeared at about 14 min. Another attempt was taken by varying the ratio of the mobile phase with the ethanol contributing 60%, formic acid being 40%, this produced stable baseline, excellent sensitivity, equally excellent peak character in terms of shape and more importantly lower retention time. Besides the mobile phase, a few other essential parameters required optimization, these parameters include flow rate and injection volume. Post optimization, the mobile phase was finally made to flow at 0.3 mL/min and the injection volume of 10 μL was selected. After final optimization of the experimental conditions, an excellent MG peak appeared at 9.98 min (Figure 3).

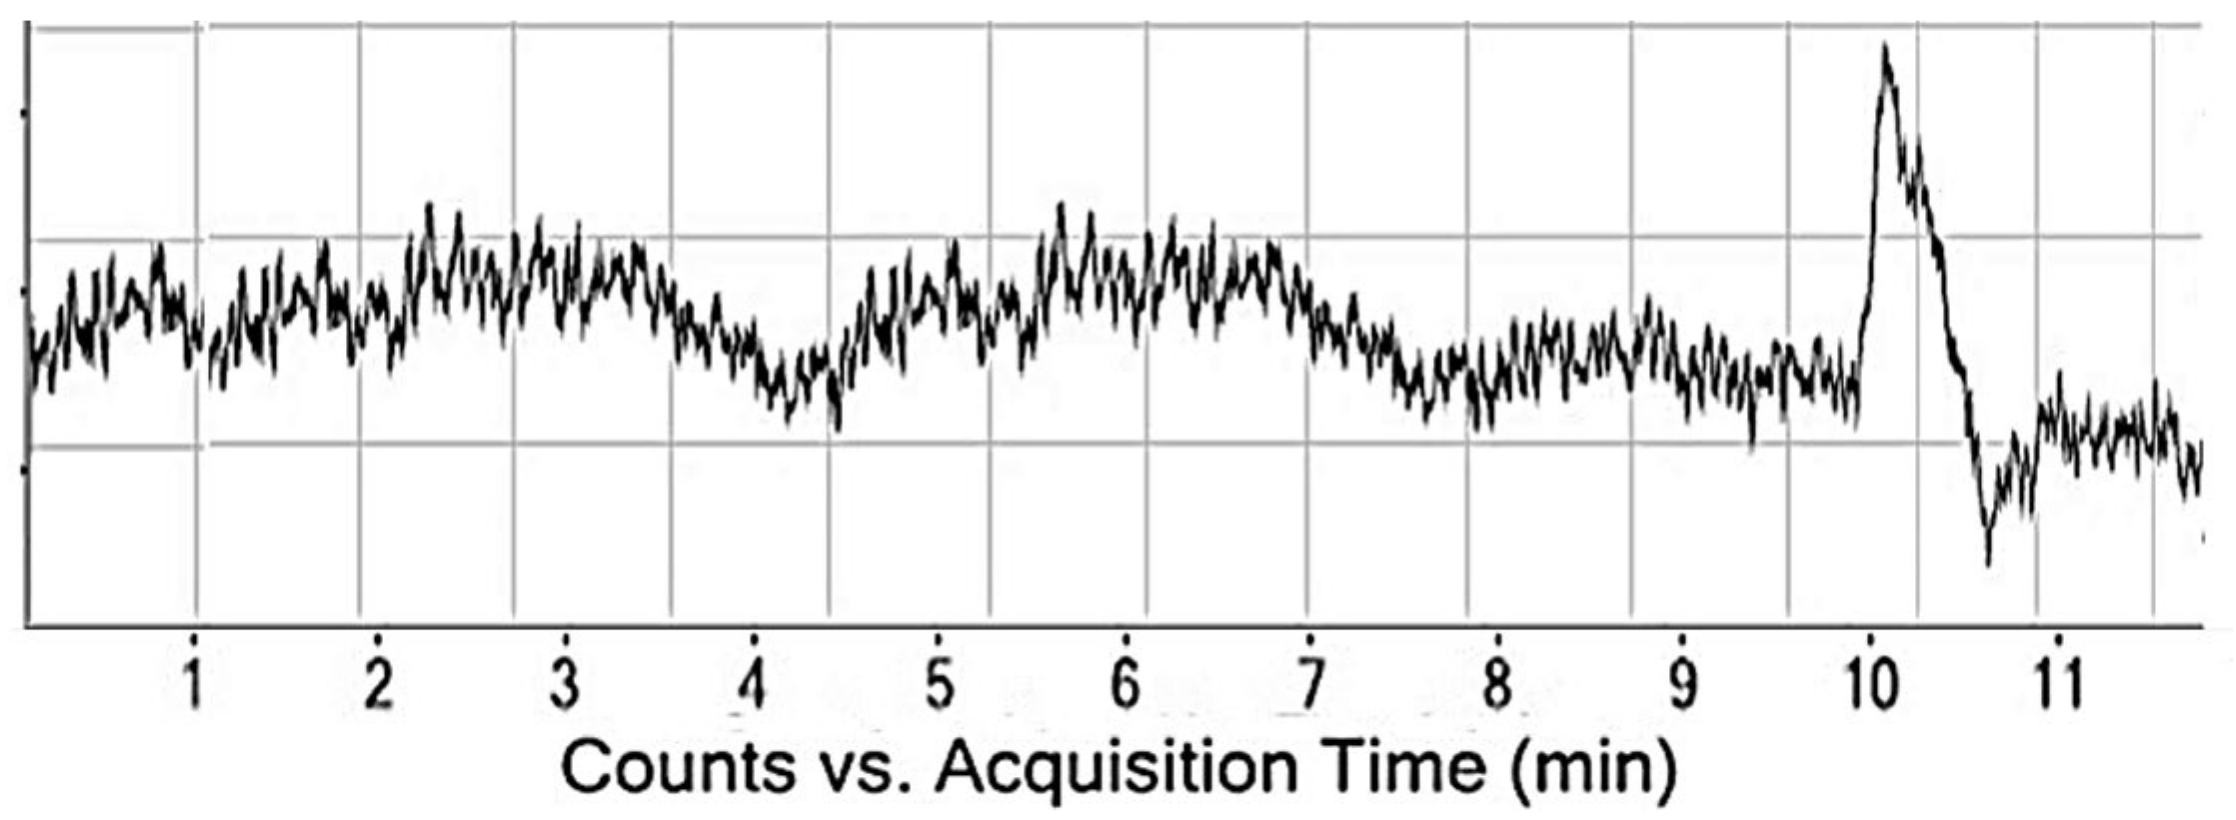
4.2. Method Validation for Liquid Chromatography

The validation process is a fundamental part of any newly developed method or for any change that is made in the reported one. In the current case, a new method was proposed; thus, to make the results authentic and reliable and appropriate to the real sample analysis, the method must be validated. There are a few parameters which should be studied, they include: (1) system suitability (2) linearity and range (3) precision and accuracy (4) limit of detection and quantitation (5) recovery (6) stability.

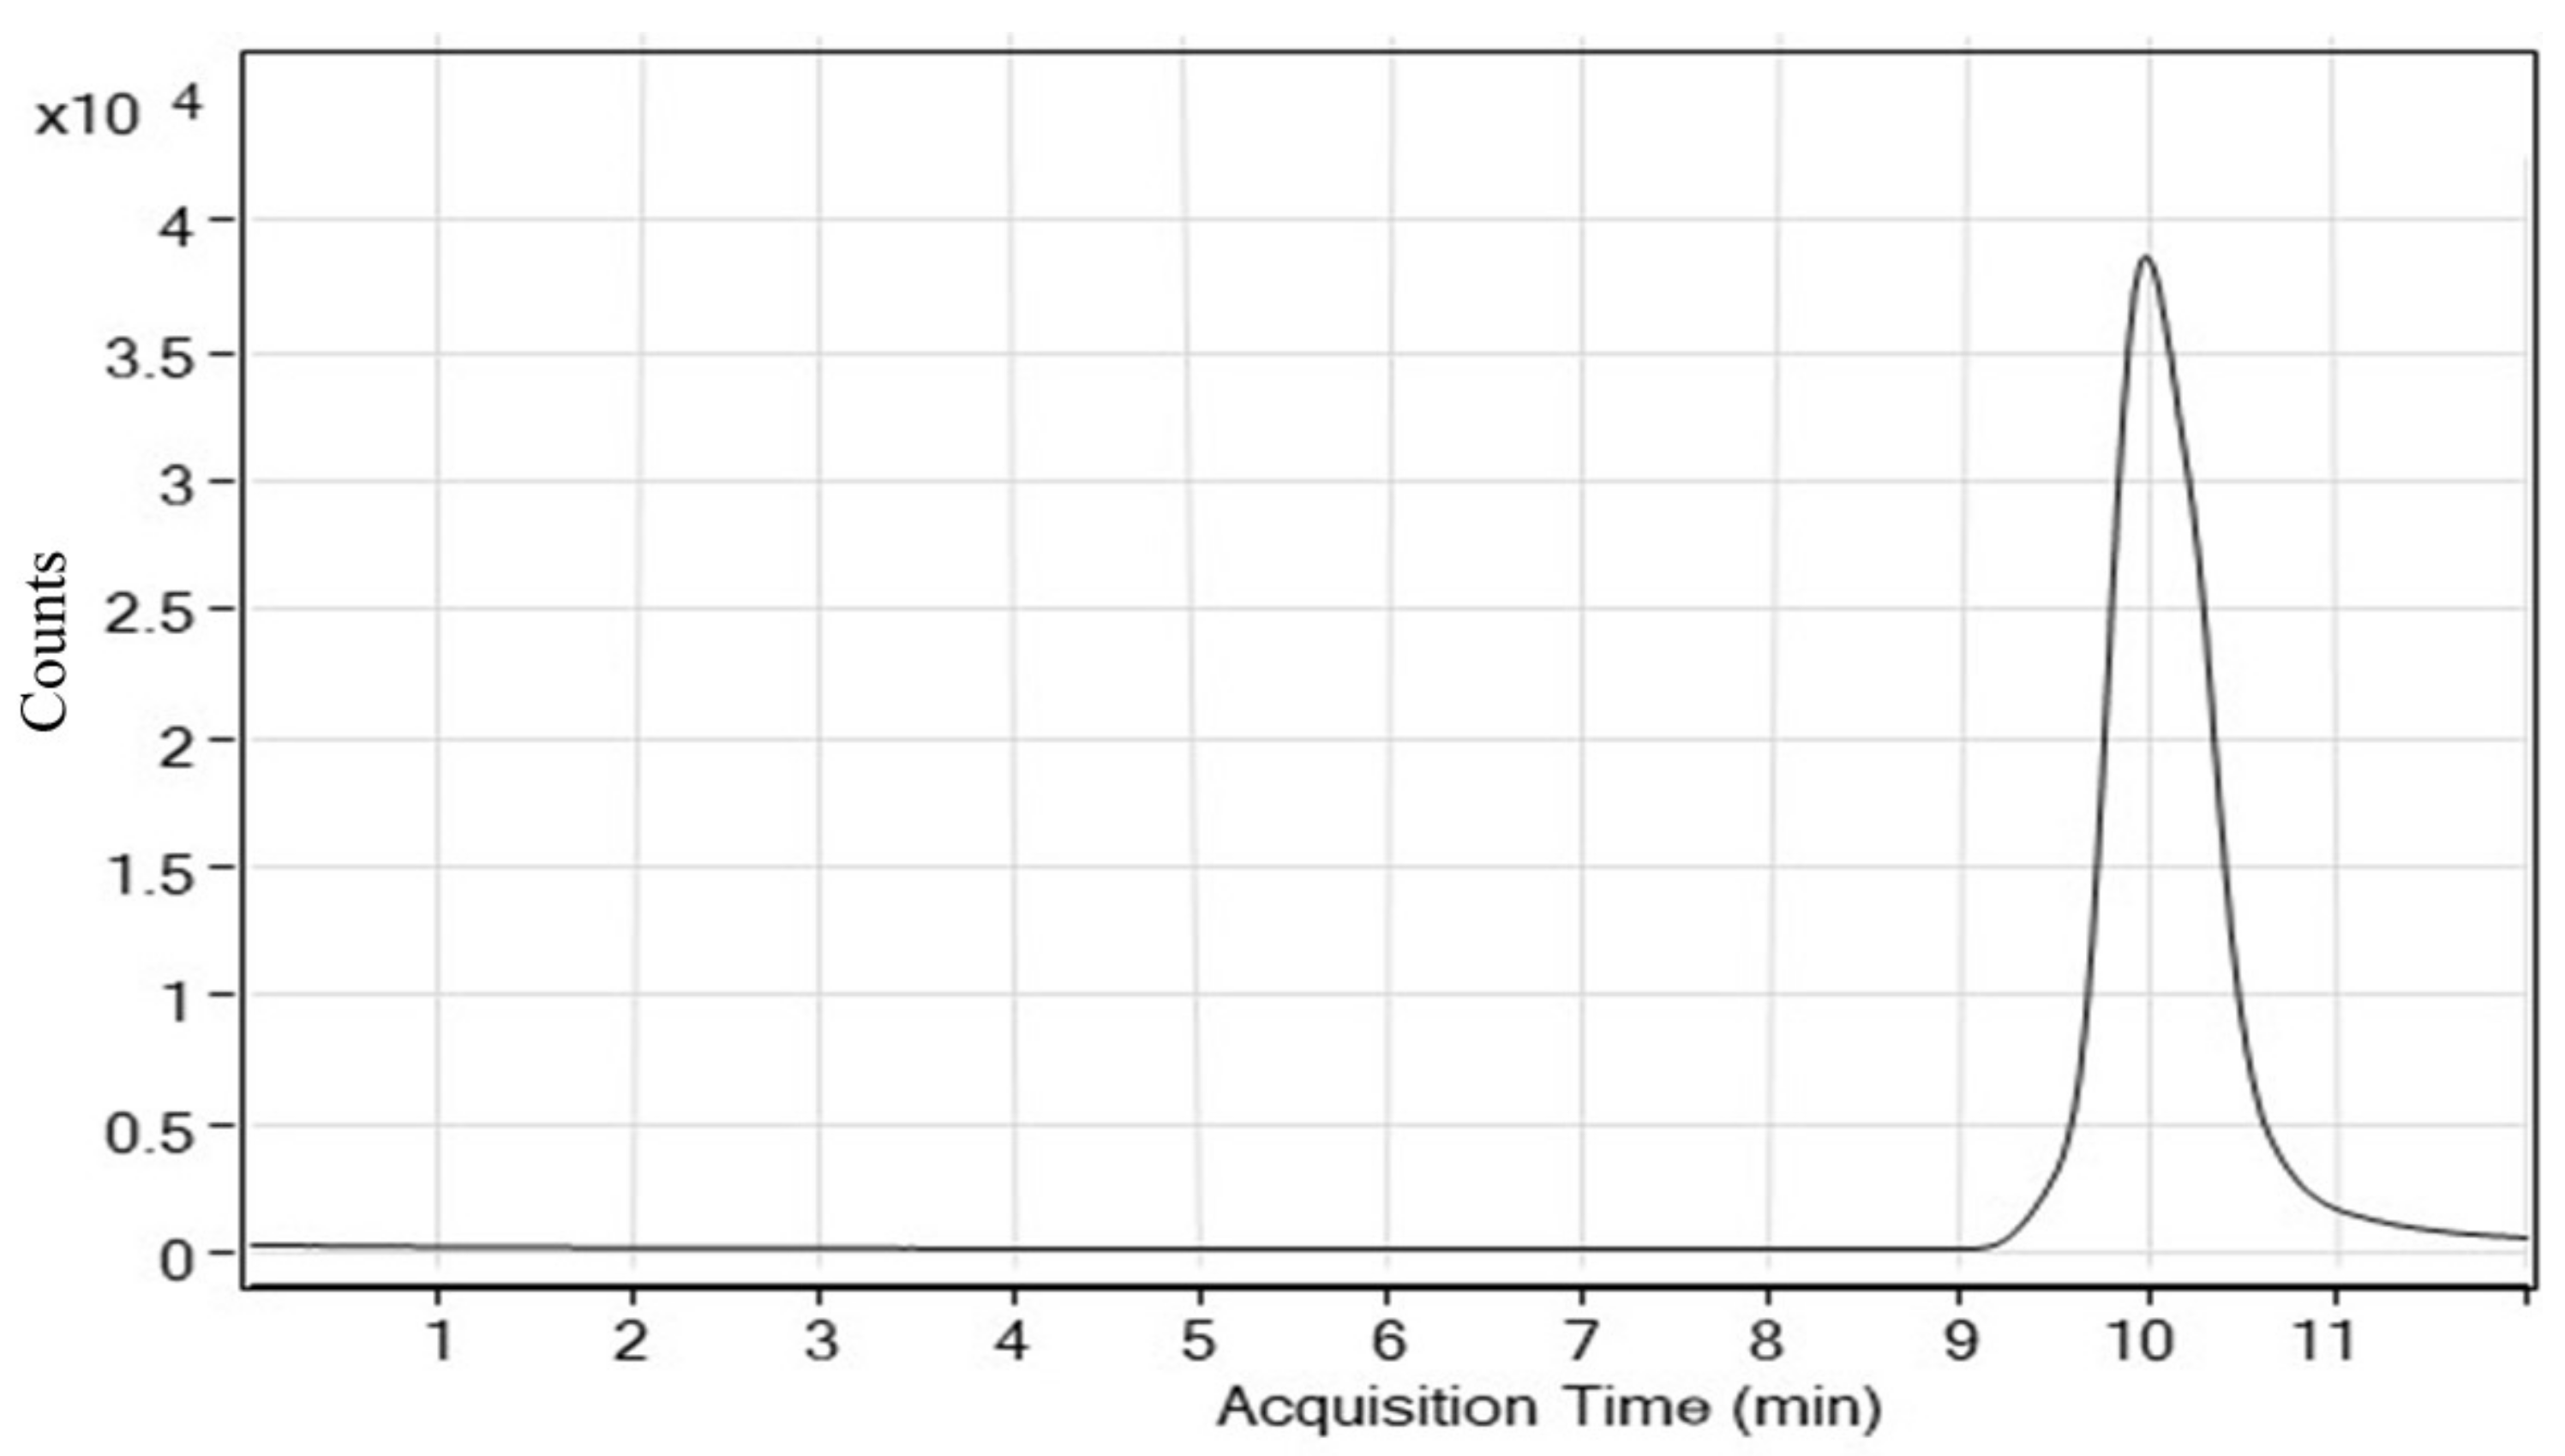
4.2.1. System Suitability

System suitability is a vital factor for assessment of the reproducibility of the peak prior to the start of the determination experiments. Considering this parameter, the assessment of the overall system, software, analytical operations and lastly the samples can be achieved and their suitability for further quantitative investigation can be judged. Here, six MG samples with concentrations of 10 mg/L were run using the zeroed experimental conditions. Table 2 summarizes the results of the system suitability studies. The outcome of the chromatographic investigation shows that percent relative standard deviation (% RSD) of the retention time (six replicates) was 0.05, similarly the % RSD of concentration based on the individual peak areas of similar number of replicates was 0.500. It can be seen from the results that during these six runs that there was neither any significant variation in the retention time nor extreme change in the peak areas. The percent RSD of both retention time and the concentration was within the permissible limit.

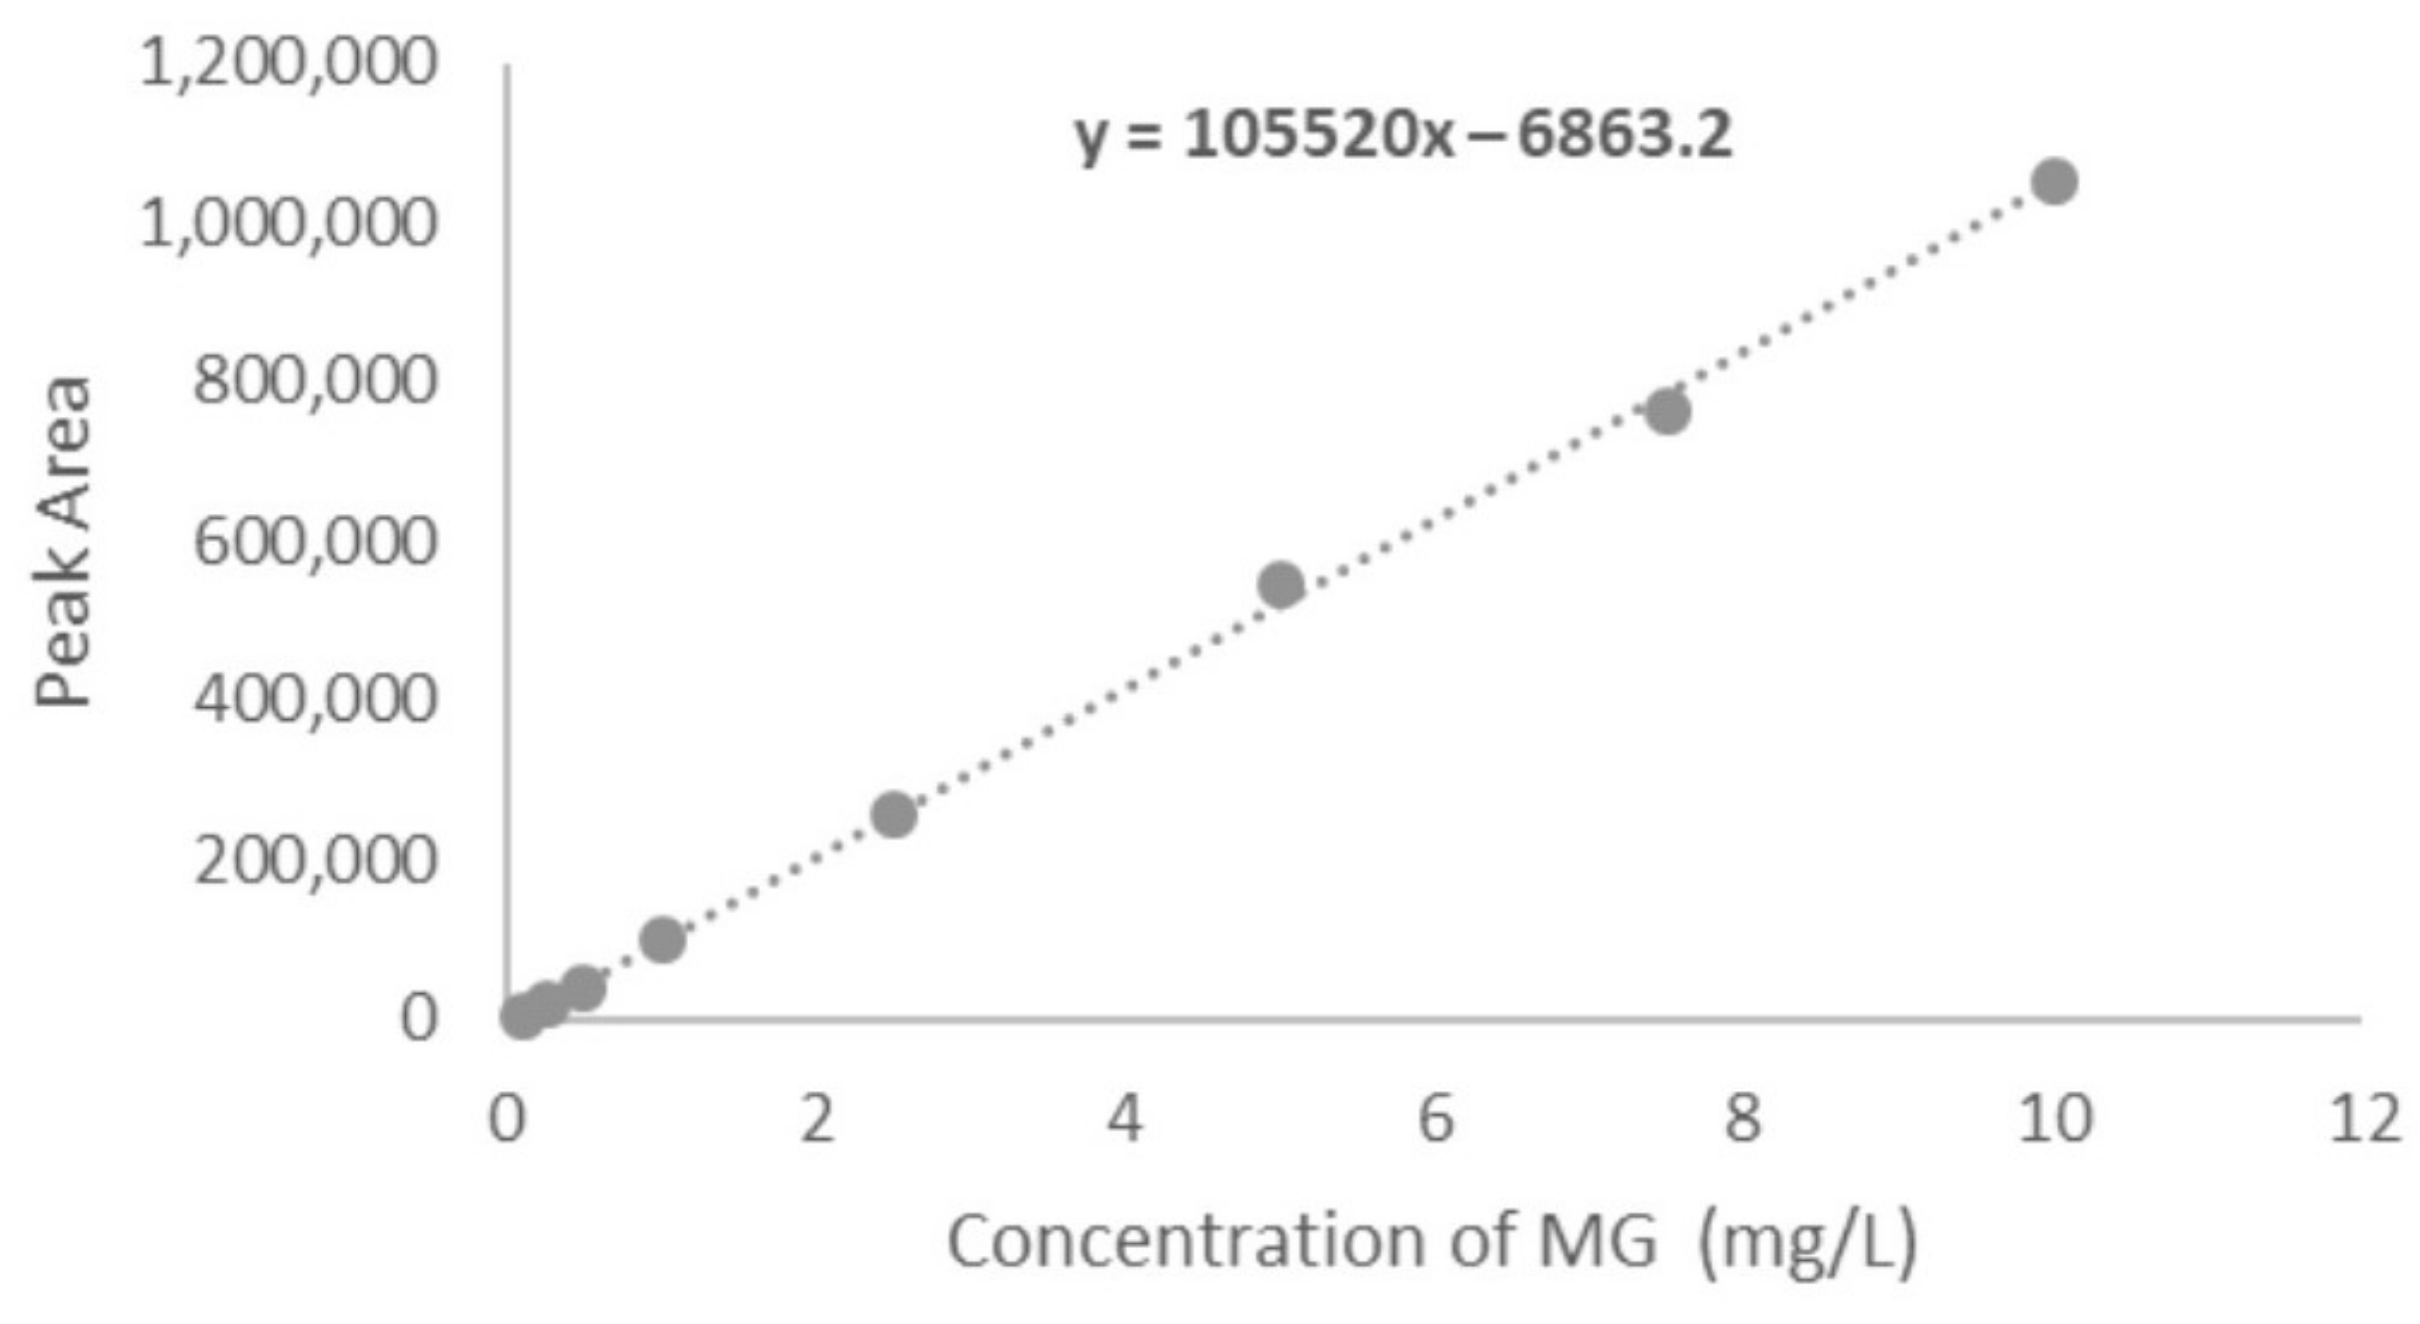
4.2.2. Linearity and Range

This is one of the obligatory parameters that requires examination during the validation of any developed method. In the linearity study, different concentrations were subjected to chromatographic analysis and the areas at each concentration were recorded. Finally, the mean of peak areas at each concentration was plotted against their respective concentration. From the obtained results, it is evaluated that within the studied concentration range the area obtained from the chromatogram are proportional. In this study the linearity study was performed at eight concentration points viz. 0.1, 0.25, 0.5, 1.0, 2.5, 5.0, 7.5, and 10 mg/L. The results recommend that the graph is linear between these concentrations points with an excellent correlation coefficient of 0.9995. The resulting linear regression equation was found to be A = −6863.2 + 105,520 C; where A is the area of the peak and C is the concentration of MG. The corresponding calibration curve is mentioned in Figure 4.

4.2.3. Precision and Accuracy

Precision can be anticipated as the agreement between the results of the replicated analyses. In the current context, the analytical system can be stated to be precise when the results acquired from sequences of the experiments are in agreement with each other under the optimal experimental conditions. To judge the precision of this method, four concentration points were selected, and the precision experiments were conducted within a single day and for the consecutive three days, the former is recognized as intraday and later one is stated as inter day precision. These experiments were conducted at 0.1, 0.25, 0.5 and 10 mg/L. The purpose of conducting the study at this mentioned concentration is to include lower-middle and higher concentrations in the precision study. The accuracy expresses the closeness of agreement between the found value and the reference value. In our study, the parameter “accuracy” was assessed using the results acquired from the recovery studies, and the results were compared with the found concentration is term of the % recovery. Table 3 presents the results of both the intraday precision and inter day study. From the Table 3, it can be seen that in intraday precision study, the % RSD at all four concentrations lies between 0.709–1.748. Similarly, the standard analytical error (SAE) at the same concentration points varies between 0.0016–0.2127. Percent recovery which specifies the accuracy was found in between 99.10–101.93. The results for inter day precision shows that the % RSD, SAE and recovery were, 1.115–1.893%, 0.002–0.259 and 98.86–100.06%, respectively.

4.2.4. Limit of Detection (LOD) and Limit of Quantitation (LOQ)

During the validation experiment, LOD and LOQ studies must be conducted to get the evidence about the least concentration, which can be analyzed with full accuracy. This parameter was evaluated from the experiment to get information about the minimum concentration of MG that can produces a signal which can easily be segregated from the noise that is without the MG response. To check the limit of detection and quantitation of the current method, different samples having lesser concentrations than the lowest concentration in the linearity study were selected and injected and investigated for the signal to noise ratio response. The injected concentration with a signal to noise ratio of 3 was chosen as the LOD, while those having response ten times higher than the noise were selected as the LOQ. From the series of experiments, it was established that the LOD and LOQ of the developed procedure were found to be 0.025 mg/L and 0.08 mg/L. The LOD chromatogram is mentioned in Figure 5.

4.2.5. Recovery Parameter for Determination of MG

This investigation was conducted by spiking known amount of MG solution in water sample. Prior to the spiking of the MG, the water sample was examined for its malachite green content and the analyte free water was taken up for spiking the MG. Further, the recovery of the sample post extraction was checked on the basis of the area found for the individually spiked samples. Four samples of 0.5, 1.0, 7.5 and 10 mg/L were prepared by malachite green spiking. The obtained results suggest an excellent recovery of 97.28% to 98.75%. The corresponding % RSD and the analytical error were established in the range of 1.62–3.83% and 0.03–0.41, respectively. The results of the recovery study are summarized in Table 4.

4.2.6. Stability Studies

The stability of the MG sample, using the developed method was checked for one week. The amount of the MG was checked on day 1 and on day 7, from this experiment the stability of the MG was evaluated. At all testing conditions, the % degradation came out to be between 0.2% to 0.39%.

4.2.7. Application of Sorbent for Uptake of Dyes

There are several studies reported in the literature where the solid phase extraction was used for the extraction of dyes. Methylene blue was extracted by SPE using pistachio shell biomass as the sorbent material, the recovery was found to be 95% to 99% [29]. Modified pistachio shell adsorbent was also used for the extraction of cationic dyes where the recovery ranged from 98.11–99.55% [30]. Moringa oleifera pods modified with CuFe2O4 were used as yet another material for SPE sorbent for the removal of MG, with the recovery of the dye varying in the range of 99–103% [27]. In addition to the laboratory prepared SPE cartridges, SPE commercial cartridges were also employed for water purification. Bisphenol was eluted using a Bond-Elut-C18 SPE cartridge, with the recovery being 96.88–99.77% [31], while nine dispersed dyes were eluted using Strata X cartridges where the recovery obtained throughout the experiment was found to be in the range of 70–120% [32].
Experiments for the MG uptake by wood apple hydrochar was separately conducted in the batch mode. For this 50 mg/L of MG was taken and optimized dose of adsorbent (0.01 g) was taken. The adsorption capacity of wood apple adsorbent was found to be 213.72 mg/g. The pH study suggests that at a lower pH the adsorption capacity was found to be 142 mg/g, which increased when the pH went up to 7.1, where a slight change in adsorption capacity was recorded between 6.62 and 7.51 (206.87–213.72 mg/g). Contact time studies were conducted at five concentration points (10, 20, 30, 40, 50 mg L−1), which showed that the maximum adsorption was achieved at 60 min and remained as such up to 6 h. The adsorption isotherms study suggests that the Langmuir isotherm appears to be less fitted than the Freundlich model at the studied temperature range (293, 303, 313, and 323 K).

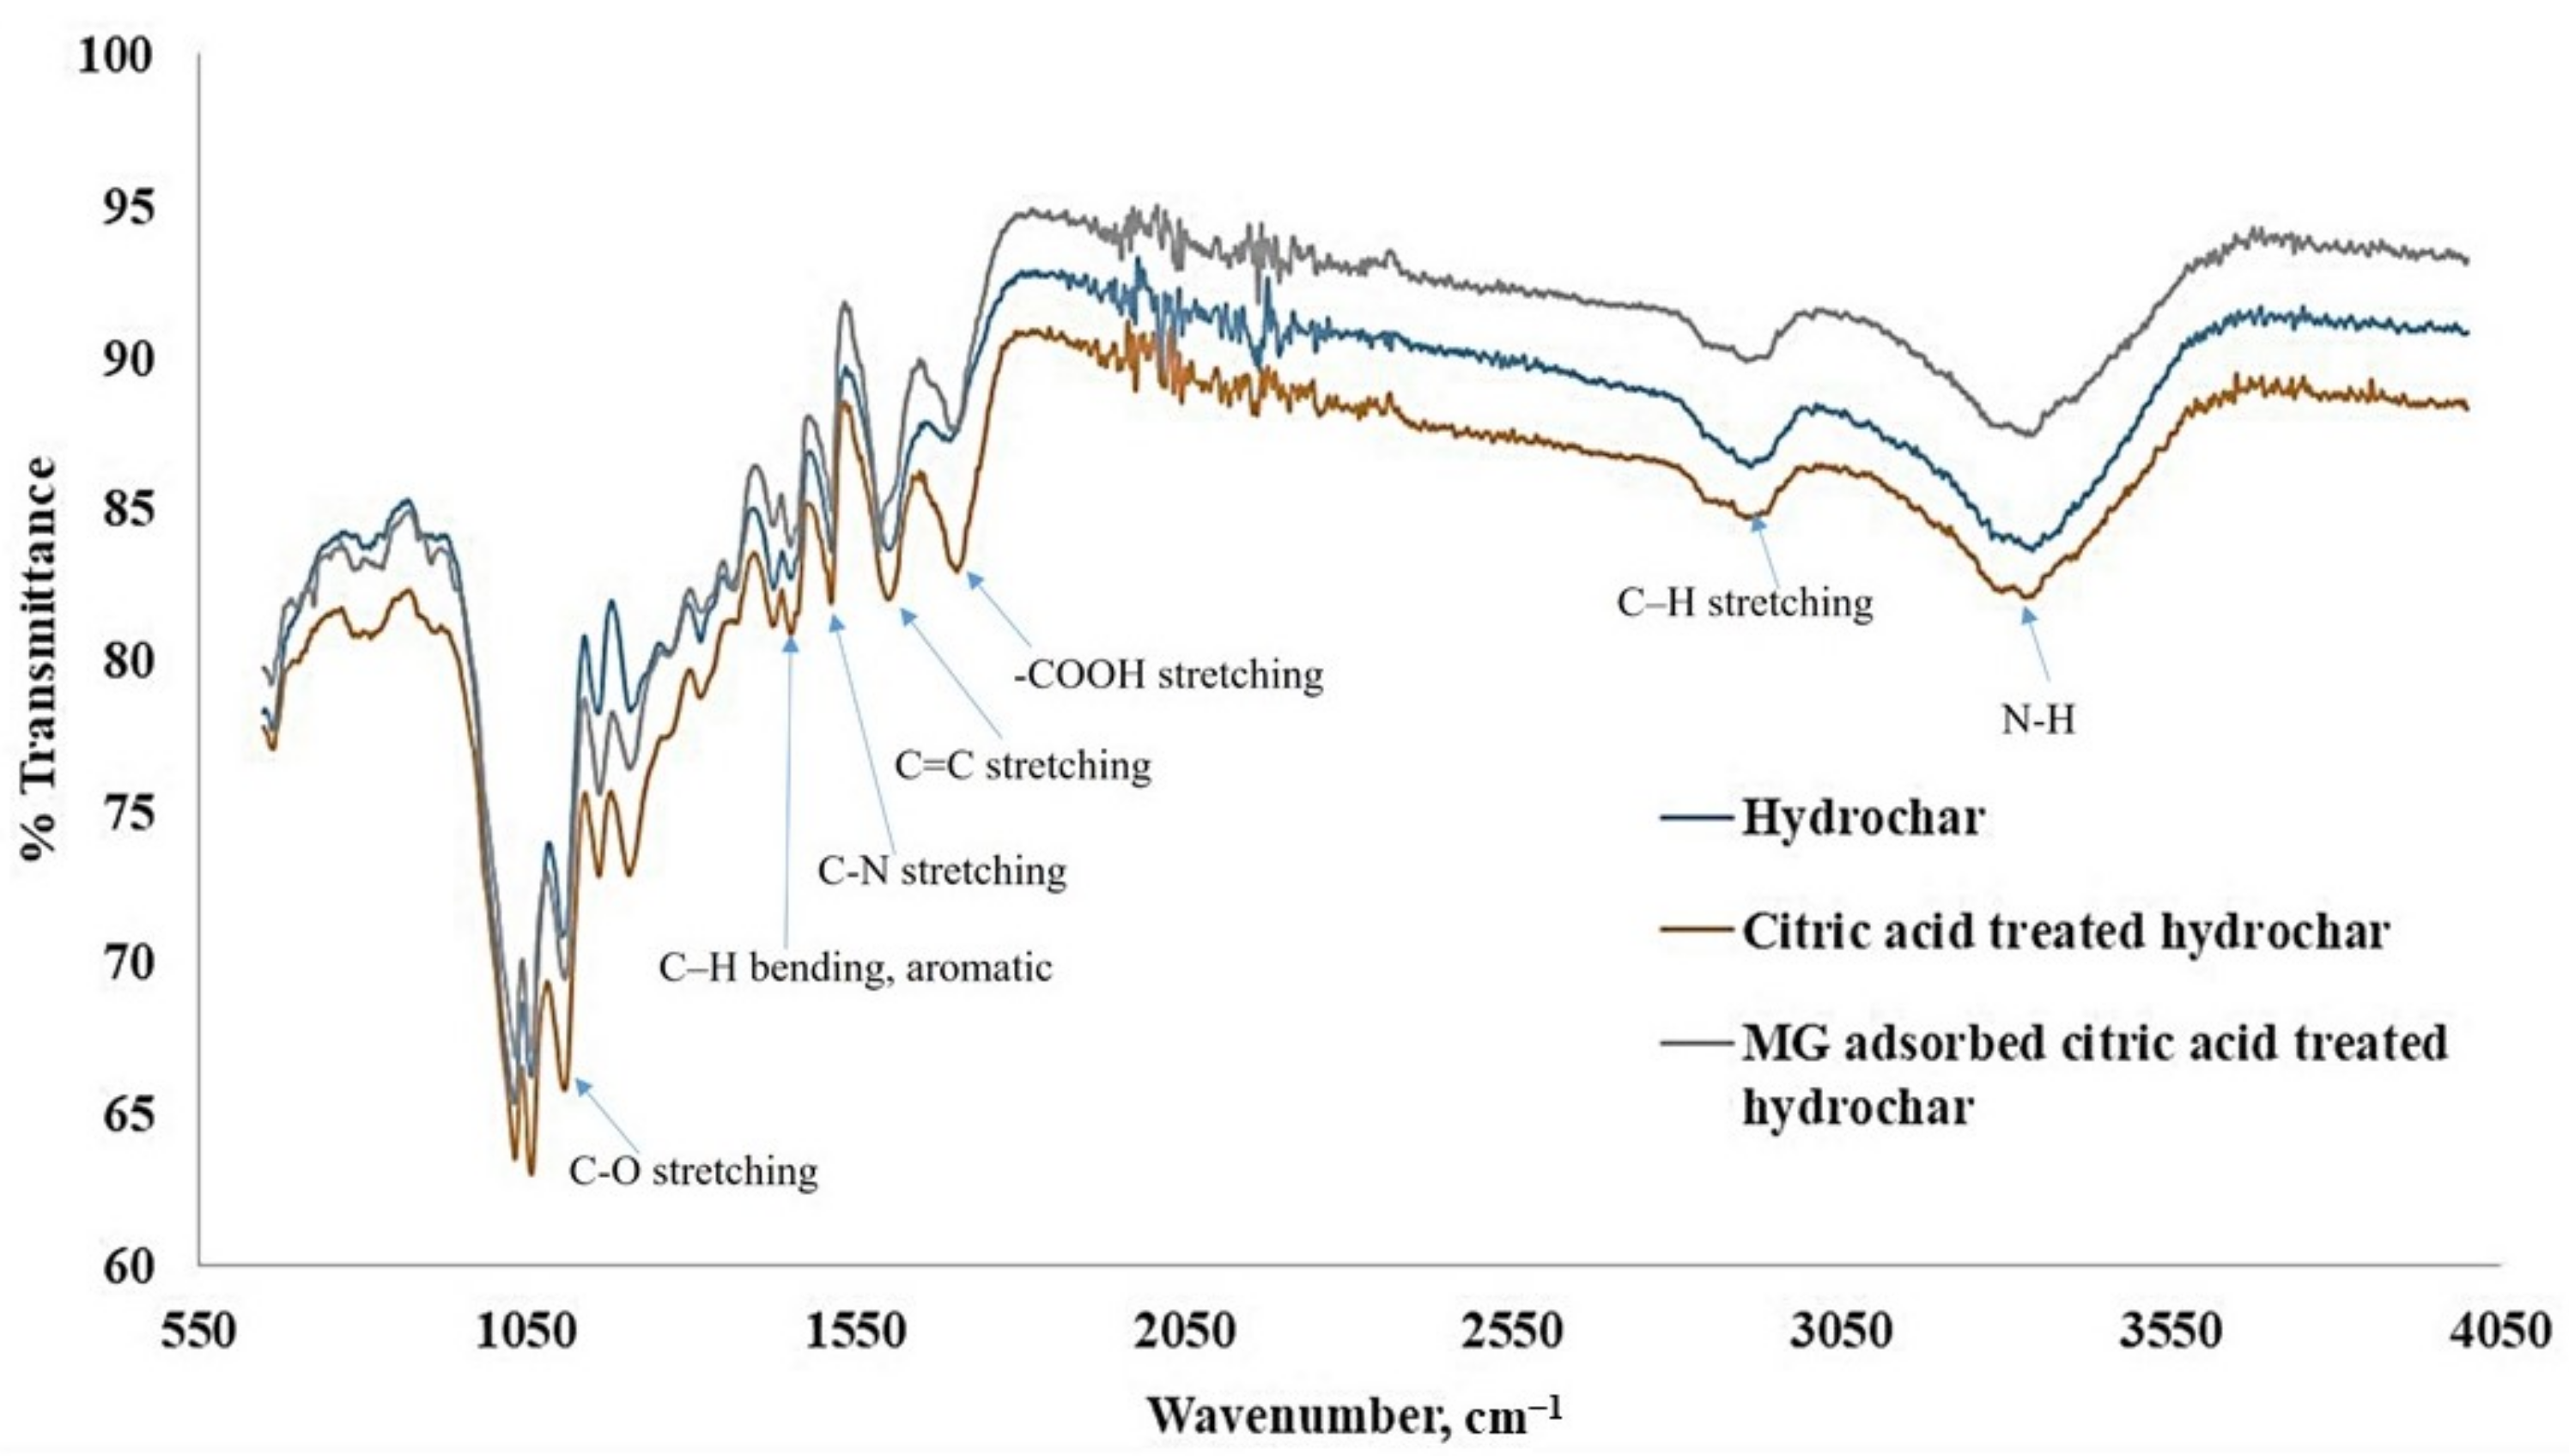
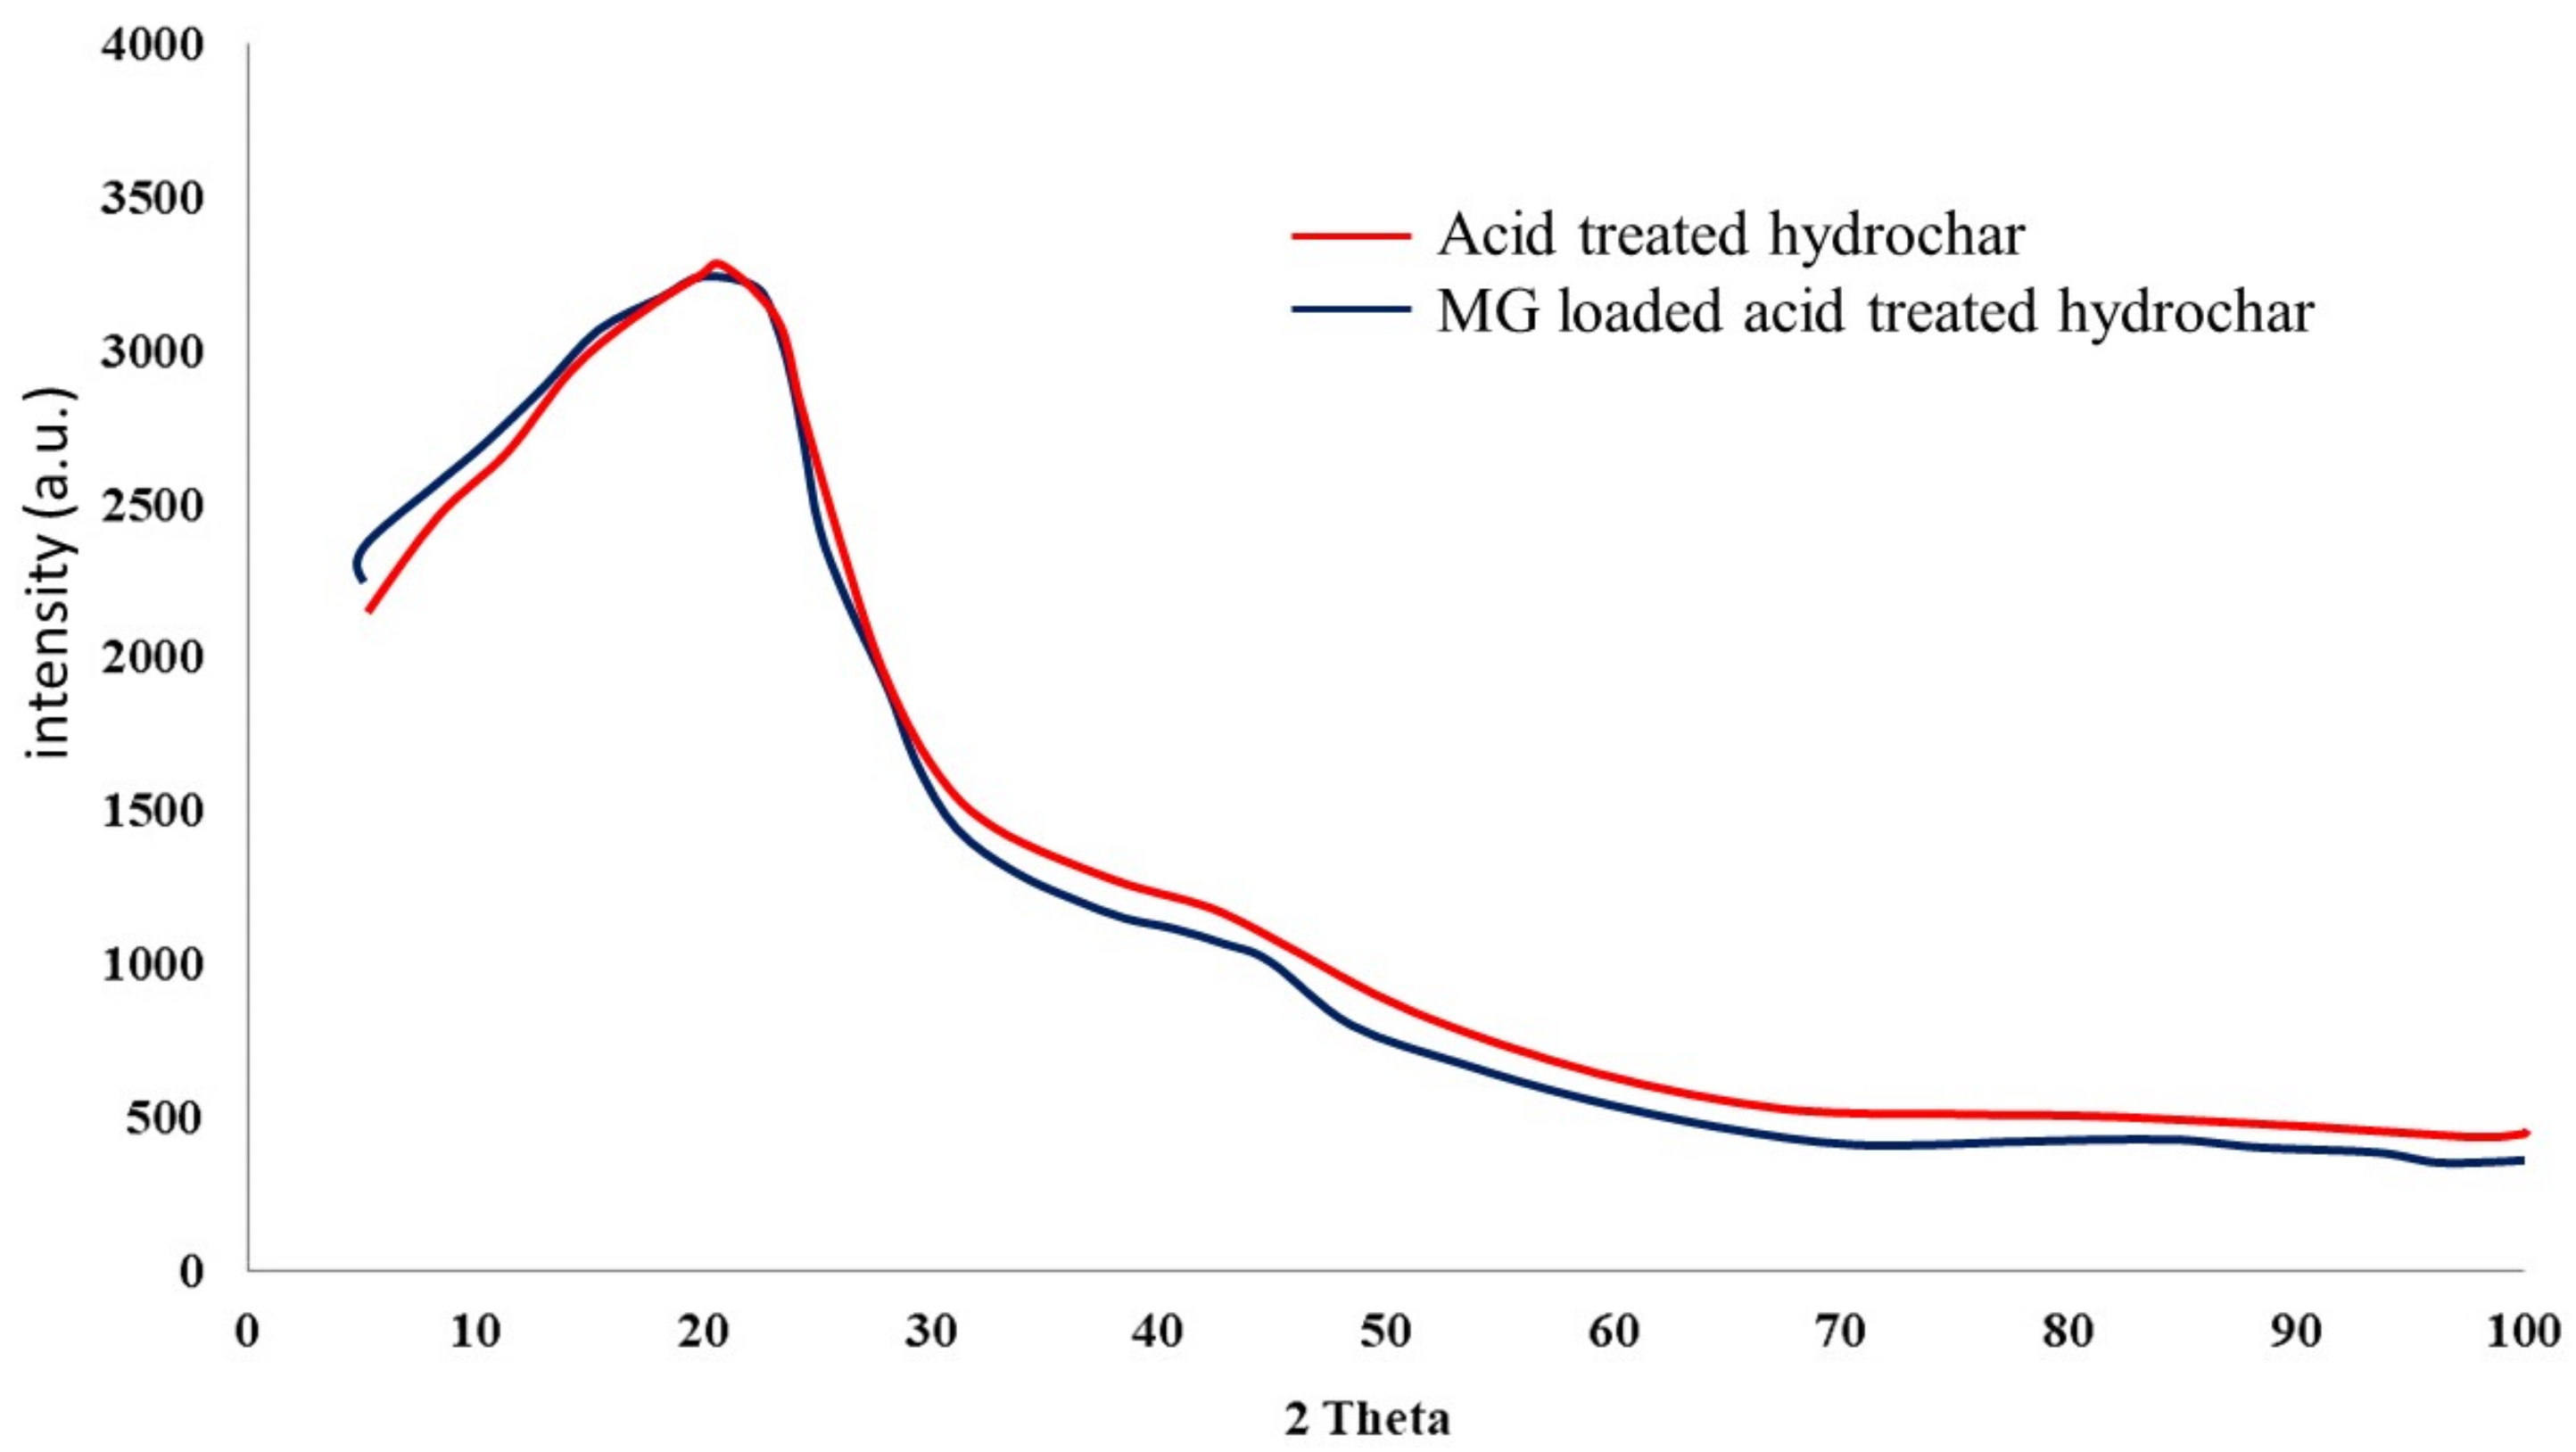
4.3. Sorbent Material Characterization

The wood apple hydrochar, the sorbent material was characterized pre and post SPE using characterization techniques namely, Fourier transform infrared spectroscopy (FTIR) for the chemical functionality, X-ray powder diffraction (XRD), for crystallinity studies.
FTIR spectroscopy was employed to analyze the chemical functionality existing in the adsorbent and their possible interaction with the hydrochar and analyte. The FTIR spectra of the hydrochar prior to adsorption of MG (control samples) and the MG loaded hydrochar are stated in Figure 6. Equating the two IR spectra, i.e., the spectrum of the hydrochar and that of the MG loaded hydrochar, it could be seen that there was a strong characteristic stretching vibration absorption band of the carboxyl group at 1703 cm−1 in IR spectrum of hydrochar reflecting the outcome of acid esterification during the hydrochar preparation processes. As it can be seen in the spectra of both materials, a broad region centered at about 3330 cm−1, which can be ascribed to the stretching vibration of the bonded hydroxyl groups and N–H stretching vibration in the amino compounds. The –OH absorption peaks at 3329 cm−1 of hydrochar is most possibly due to hydration of the hydrochar during the adsorption process [33]. After the MG adsorption, the spectra display changed in intensity and also shifted in position. The peaks at 2903 cm−1 corresponds to asymmetric and symmetric C–H stretching vibrations in aliphatic compounds. In the current study, the temperature of hydrochar preparation was 250 °C, so the C–H stretching vibrations were still present in the samples. No obvious shift of this peak was detected with adsorption of MG onto the hydrochar. The peak around 1600 cm−1 in both MG unloaded and loaded hydrochar corresponds to the C=C stretching vibration in aromatic compounds [34]. The peak indicates that the presence of aromatic compounds in the hydrochar samples. After the MG-adsorption onto the hydrochar, the peak shifted to 1590 cm−1, indicating the association of C=C of hydrochar during the adsorption of MG. The peaks at 1512 and 1513 cm−1 corresponds to C–N stretching. The aromatic C–H groups with in-plane bending vibration can be observed at about 1451 cm−1. The positions of these peaks remain the same in both adsorbents, suggesting the availability of this functional group for MG adsorption [35]. No obvious shifts with the adsorption of MG, confirming the nonintervention of aromatic C–H groups. A sharp and intense peak at about 1104 cm−1 in MG unloaded hydrochar most likely to be corresponding to C–O stretching. The peak was shifted at about 1107 cm−1, possibly due to the esterification of the hydrochar. This peak was found to be less intense after MG adsorption, indicates the involvement of C–O group in binding MG. The peaks at 1590 cm−1 in the MG loaded hydrochar were found to be intense, indicating the C=C stretching of the benzene ring of MG, which is an indication of the presence of MG in the MG loaded hydrochar.
The powder XRD patterns of hydrochar before and after adsorption of MG are shown in Figure 7. A broad peak in the powder XRD pattern confirming the formation of atypical amorphous carbon due to hydrothermal carbonization of the apple wood [36]. A similar XRD pattern was observed in the MG loaded adsorbent indicating that the materials hold its original amorphous nature after adsorption of MG.

4.4. Application of Developed Method

In accordance with the aim of the experiment an analytical procedure (LC-MS/MS) in combination with the solid phase extraction involving wood apple hydrochar as solid phase was used for examining the content of the MG in environmental samples. Environmental samples taken up during the investigation were laundry waste, lake water, fish storage water, leather industry waste, university tap water, bottled drinking water and irrigation supply water. During the determination procedure no interference was observed and nor was the matrix effect. The results of the quantitative assessment of MG are presented in Table 5. From the table it is apparent that the highest MG level was found in the sample obtained from leather industry and minimum amount of MG was detected in the laundry sample. A few samples, such as university tap water, bottled drinking water and the university irrigation supply, did not contain even traces of the MG.

5. Conclusions

The analytical procedure, involving ethanol, a green solvent and formic acid, a food preservative as mobile phase was developed for MG determination, keeping in view the environmental concerns. The extraction of the environmental samples was accomplished by means of solid phase extraction, where the wood apple hydrochar was used as the solid phase. The SPE and the LC-MS/MS combined technique forms an excellent technique for the estimation of the dye level in various environment samples. The SPE involves low cost sorbent materials, and the LC-MS/MS involves environmentally friendly mobile phase. The developed method did not encounter any issues related to interference or matrix effects. The procedure was validated by means of different parameters, which were established to be in agreement with the regulatory guidelines. Based on the results, it can be said that the offered method is precise and simultaneously accurate, and that an excellent recovery was observed. The usability of the procedure can be evident from the results obtained from the real sample analysis. The SPE procedure has dual importance: first, for the utilization of the waste wood apple shell, and second, as sorbent materials for MG removal. Further studies may commercialize the wood apple hydrochar as material for removal of MG at a larger scale.

Author Contributions

Conceptualization, M.R.S. and Z.A.A.; methodology, A.A.H.H. and M.R.S.; formal analysis, A.A.H.H. and M.A.I.; investigation, A.A.H.H., M.R.S. and M.A.K.; writing—original draft preparation, A.A.H.H. and M.R.S.; writing—review and editing, M.R., M.R.S., M.A.A., M.A.I. and Z.A.A.; supervision, M.R.S. and Z.A.A.; funding acquisition, M.R. and M.R.S. All authors have read and agreed to the published version of the manuscript.

Funding

Authors are grateful to the Researchers Supporting Project Number (RSP-2021/326), King Saud University, Riyadh, Saudi Arabia.

Institutional Review Board Statement

Not applicable.

Informed Consent Statement

Not applicable.

Data Availability Statement

The data presented in this study are available on request from the corresponding author.

Acknowledgments

Authors are grateful to the Researchers Supporting Project Number (RSP-2021/326), King Saud University, Riyadh, Saudi Arabia.

Conflicts of Interest

The authors declare no conflict of interest.

References

  1. Hashimoto, J.C.; Paschoal, J.A.R.; de Queiroz, J.F.; Reyes, F.G.R. Considerations on the Use of Malachite Green in Aquaculture and Analytical Aspects of Determining the Residues in Fish: A Review. J. Aquat. Food Prod. Technol. 2014, 20, 273–294. [Google Scholar] [CrossRef]
  2. Raval, N.P.; Shah, P.U.; Shah, N.K. Nanoparticles Loaded Biopolymer as Effective Adsorbent for Adsorptive Removal of Malachite Green from Aqueous Solution. Water Conserv. Sci. Eng. 2016, 1, 69–81. [Google Scholar] [CrossRef] [Green Version]
  3. Raval, N.P.; Shah, P.U.; Shah, N.K. Malachite green “acataionic dye and its removal from aqueous by adsorption”. Appl. Water Sci. 2017, 7, 3407–3445. [Google Scholar] [CrossRef] [Green Version]
  4. Farhadi, K.; Maleki, R.; Nezhad, N.M.; Samadi, N. Spectrophotometric Determination of Malachite Green Residue in Water Samples After Preconcentration on Surfactant-Coated Alumina. Spectrosc. Lett. 2010, 43, 101–107. [Google Scholar] [CrossRef]
  5. An, L.; Deng, J.; Zhou, L.; Li, H.; Chen, F.; Wang, H.; Liu, Y. Simultaneous spectrophotometric determination of trace amount of malachite green and crystal violet in water after cloud point extraction using partial least squares regression. J. Hazard. Mater. 2010, 175, 883–888. [Google Scholar] [CrossRef]
  6. Afkhami, A.; Moosavi, R.; Madrakian, T. Preconcentration and spectrophotometric determination of low concentrations of malachite green and leuco-malachite green in water samples by high performance solid phase extraction using maghemite nanoparticles. Talanta 2010, 82, 785–789. [Google Scholar] [CrossRef]
  7. Pourreza, N.; Elhami, S. Spectrophtometric determination of malachite green in fish farming water samples after cloud point extraction using nonionic surfactant Triton X-100. Anal. Chim. Acta 2017, 596, 62–65. [Google Scholar] [CrossRef]
  8. Zhu, D.; Li, Q.; Honeychurch, K.C.; Piano, M.; Chen, G. Determination of Malachite Green in Aquaculture Water by Adsorptive Stripping Voltammetry. Anal. Lett. 2016, 49, 1436–1451. [Google Scholar] [CrossRef]
  9. Huang, W.; Yang, C.; Qu, W.; Zhang, S. Voltammetric determination of malachite green in fish samples based on the enhancement effect of anionic surfactant. Russ. J. Electrochem. 2008, 44, 946–951. [Google Scholar] [CrossRef]
  10. Yi, H.; Qu, W.; Huang, W. Electrochemical determination of malachite green using a multi-wall carbon nanotube modified glassy carbon electrode. Microchim. Acta 2008, 160, 291–296. [Google Scholar] [CrossRef]
  11. NurulHidayah, A.P.; Faridah, S.; Azura, M.S.N.; Gayah, A.R.; Othman, M.; Fatimah, A.B. Malachite Green and Leuco-Malachite Green Detection in Fish Using Modified Enzyme Biosensor. Procedia Chem. 2016, 20, 85–89. [Google Scholar]
  12. Mitrowska, K.; Zmudzki, A.P.J. Determination of malachite green and leucomalachite green in carpmuscle by liquid chromatography with visible and fluorescence detection. J. Chromatogr. A 2005, 1089, 187–192. [Google Scholar] [CrossRef]
  13. Bajc, Z.; Doganoc, D.Z.; Gačnik, K.S. Determination of malachite green and leucomalachite green in trout and carp muscle by liquid chromatography with visible and fluorescence detection. Slov. Vet. Res. 2007, 44, 81–90. [Google Scholar]
  14. Chen, G.; Miao, S. HPLC Determination and MS Confirmation of Malachite Green, Gentian Violet, and Their Leuco Metabolite Residues in Channel Catfish Muscle. J. Agric. Food Chem. 2010, 58, 7109–7114. [Google Scholar] [CrossRef]
  15. Xie, J.; Peng, T.; Chen, D.-D.; Zhang, Q.-J.; Wang, G.-M.; Wang, X.; Guo, Q.; Jiang, F.; Chen, D.; Deng, J. Determination of malachite green, crystal violet and their leuco-metabolites in fish by HPLC–VIS detection after immunoaffinity column clean-up. J. Chromatogr. B 2013, 913–914, 123–128. [Google Scholar] [CrossRef]
  16. Zeng, S.; Ye, J.; Lin, L.; Chen, W.; Yang, C. Application of UPLC-MS/MS for Simultaneous Determination of Malachite Green and Metabolites Residues in Tilapia. IOP Conf. Ser. Mat. Sci. Eng. 2019, 563, 052062. [Google Scholar] [CrossRef]
  17. Ascari, J.; Dracz, S.; Santos, F.A.; Lima, J.A.; Diniz, M.H.G.; Vargas, E.A. Validation of an LC-MS/MS method for malachite green (MG), leucomalachite green (LMG), crystal violet (CV) and leucocrystal violet (LCV) residues in fish and shrimp. Food Addit. Contam. A 2012, 29, 602–608. [Google Scholar] [CrossRef] [PubMed]
  18. Hakami, A.A.H.; Wabaidur, S.M.; Khan, M.A.; AlOthman, Z.A.; Siddiqui, M.R. Extraction Procedures and Analytical Methods for the Determination of Methylene Blue, Rhodamine B and Crystal Violet—An Overview. Curr. Anal. Chem. 2021, 17, 708–728. [Google Scholar] [CrossRef]
  19. Bilal, M.; Ihsanullah, I.; Younas, M.; Shah, M.U.H. Recent advances in applications of low-cost adsorbents for the removal of heavy metals from water: A critical review. Sep. Purif. Technol. 2022, 278, 119510. [Google Scholar] [CrossRef]
  20. Ferrentino, B.; Ceccato, R.; Marchetti, V.; Andreottola, G.; Fiori, L. Sewage Sludge Hydrochar: An Option for Removal of Methylene Blue from Wastewater. Appl. Sci. 2020, 10, 3445. [Google Scholar] [CrossRef]
  21. Hamouda, R.A.; El-Naggar, N.E.; Doleib, N.M.; Saddiq, A.A. Bioprocessing strategies for cost-effective simultaneous removal of chromium and malachite green by marine alga Enteromorpha intestinalis. Sci. Rep. 2020, 10, 13479. [Google Scholar] [CrossRef]
  22. Iqbal, M. UHPLC-MS/MS assay using environment friendly organic solvents: A green approach for fast determination of quetiapine in rat plasma. Arab. J. Chem. 2019, 12, 1774–1782. [Google Scholar] [CrossRef] [Green Version]
  23. Khan, M.R.; Wabaidur, S.M.; Busquets, R.; Khan, M.A.; Siddiqui, M.R.; Azam, M. Identification of malachite green in industrial wastewater using lignocellulose biomass composite bio-sorbent and UPLC-MS/MS: A green environmental approach. Process Saf. Environ. 2019, 126, 106–166. [Google Scholar] [CrossRef] [Green Version]
  24. Guo, Z.; Gai, P.; Hao, T.; Duan, J.; Wang, S. Determination of Malachite Green Residues in Fish Using a Highly Sensitive Electrochemiluminescence Method Combined with Molecularly Imprinted Solid Phase Extraction. J. Agric. Food Chem. 2011, 59, 5257–5262. [Google Scholar] [CrossRef]
  25. Javad, S.; Rahim, M.; Rezaei, M.; Razmi, H. Magnetic solid-phase extraction of malachite green using soluble eggshell membrane protein doped with magnetic graphene oxide nanocomposite. Int. J. Environ. Anal. Chem. 2018, 98, 1242–1252. [Google Scholar]
  26. Hammud, H.H.; Shmait, A.; Hourani, N. Removal of Malachite Green from water using hydrothermally carbonized pine needles. RSC Adv. 2015, 5, 7909–7920. [Google Scholar] [CrossRef]
  27. Ribeiro, R.L.V.; Bottoli, C.B.G.; Collins, K.E.; Collins, C.H. Reevaluation of Ethanol as Organic Modifier for Use in HPLC-RP Mobile Phases. J. Braz. Chem. Soc. 2004, 15, 300–306. [Google Scholar] [CrossRef] [Green Version]
  28. Surekha, M.; Reddy, S.M. PRESERVATIVES|Classification and Properties. In Encyclopedia of Food Microbiology, 2nd ed.; Academic Press: Cambridge, MA, USA, 2014; pp. 69–75. [Google Scholar]
  29. Shukla, A.K.; Sampath, S.; Rajan, A.S. Graphite-Grafted Alkaline Iron Electrode. Indian Patent 2016/110862 A1, 14 July 2016. [Google Scholar]
  30. Cerny, J.; Jindra, J.; Micka, K. Comparative study of porous iron electrodes. J. Power Sources 1993, 45, 267–279. [Google Scholar] [CrossRef]
  31. Inagaki, M.; Okada, Y.; Miura, H.; Konno, H. Preparation of carbon-coated transition metal particles from mixtures of metal oxide and polyvinylchloride. Carbon 1999, 37, 329–334. [Google Scholar] [CrossRef]
  32. Rajan, A.S.; Sampath, S.; Shukla, A.K. An in situ carbon-grafted alkaline iron electrode for iron-based accumulators. Energy Environ. Sci. 2014, 7, 1110–1116. [Google Scholar] [CrossRef]
  33. Khan, M.R.; Khan, M.A.; AlOthman, Z.A.; AlSohaimi, I.H.; Naushad, M.; Shalaan, N.H. Quantitative determination of methylene blue in environmental samples by solid-phase extraction and ultra-performance liquid chromatographytandem mass spectrometry: A green approach. RSC Adv. 2014, 4, 34037–34044. [Google Scholar] [CrossRef]
  34. Hakami, A.A.H.; Wabaidur, S.M.; Khan, M.A.; AlOthman, Z.A.; Rafatullah, M.; Siddiqui, M.R. Development of Ultra-Performance Liquid Chromatography–Mass Spectrometry Method for Simultaneous Determination of Three Cationic Dyes in Environmental Samples. Molecules 2020, 25, 4564. [Google Scholar] [CrossRef] [PubMed]
  35. AlAmmari, A.M.; Khan, M.R.; Aqel, A. Trace identification of endocrine-disrupting bisphenol A in drinking water by solid-phase extraction and ultra-performance liquid chromatography-tandem mass spectrometry. J. King Saud Univ. Sci. 2020, 32, 1634–1640. [Google Scholar] [CrossRef]
  36. Zocolo, G.J.; dos Sontos, G.P.; Vendemiatti, J.; Vacchi, F.I.; de Aragão Umbuzeiro, G.; Zanoni, M.V.B. Using SPE-LC-ESI-MS/MS Analysis to Assess Disperse Dyes in Environmental Water Samples. J. Chromatogr. Sci. 2015, 53, 1257–1264. [Google Scholar] [CrossRef] [PubMed]
Figure 1. Full ion spectra of malachite green in positive ionization mode.
Water 13 02864 g001
Figure 2. Daughter ion spectra of MG along with the possible fragmentation pattern.
Water 13 02864 g002
Figure 3. Sample chromatogram obtained after proper optimization at the mobile phase composition of ethanol: 0.1% formic acid (60:40).
Water 13 02864 g003
Figure 4. Calibration plot of MG in the concentration range of 0.1 to 10 mg L−1.
Water 13 02864 g004
Figure 5. LOD chromatogram for the malachite green determination.
Water 13 02864 g005
Figure 6. FT spectra of untreated wood apple hydrochar, citric acid treated wood apple hydrochar and MG adsorbed citric acid treated hydrochar.
Water 13 02864 g006
Figure 7. X-ray diffraction pattern of citric acid treated hydrochar and MG loaded citric acid treated hydrochar.
Water 13 02864 g007
Table 1. MS parameter for the detection of precursor and the daughter ion.
ParametersValues
Gas Temperature350 °C
Gas Flow11 L/min
Nebulizer35 psi
Capillary4000 V
Collision Energy40 eV
Fragmentor voltage150 V
Table 2. System suitability data for the MG.
S. NoRetention TimeConcentration of MG (mg L−1) from Corresponding Peak Area
19.9889.99
29.9989.82
39.9999.91
49.9989.97
59.9989.91
69.9999.87
Mean9.9989.92
% RSD0.050.500
Table 3. Accuracy and precision study for the determination of MG.
Intra-Day PrecisionInter-Day Precision
TakenFoundRSD (%)SAERecovery (%)FoundRSD (%)SAE *Recovery (%)
0.10.09910.7090.001699.100.09891.1550.00298.86
0.250.24881.7480.009799.530.2471.8930.01098.92
5.05.0690.8440.0957101.395.0031.4060.157100.06
10.09.9970.9520.212799.979.9951.1610.25999.95
* SAE—standard analytical error.
Table 4. Recovery studies for the determination of MG.
Spiked (mg/L)Found (mg/L)RSD (%)SAE *Recovery (%)
0.10.0981. 710.00197.98
0.50.4863.830.0497.28
1.00.9831.620.0398.30
7.57.412.010.3398.75
109.861.870.4198.62
* SAE—Standard Analytical Error.
Table 5. Determination of MG in different environmental samples.
SampleType of SampleConcentration of MG
Found, mg/L
01Laundry Waste0.39
02Lake Water0.43
03Fish Storage water2.02
04Leather Industry waste2.56
05University Tap waterND *
06Bottled drinking waterND *
07Irrigation supply waterND *
* ND Not detected.
Publisher’s Note: MDPI stays neutral with regard to jurisdictional claims in published maps and institutional affiliations.

