Article

Bacterioplankton Community as a Biological Element for Reservoirs Water Quality Assessment

1
Departamento de Biologia da Faculdade de Ciências da Universidade do Porto (FCUP), Rua do Campo Alegre s/n, 4169-007 Porto, Portugal
2
Centro Interdisciplinar de Investigação Marinha e Ambiental (CIIMAR/CIMAR), Terminal de Cruzeiros do Porto de Leixões, Avenida General Norton de Matos s/n, 4450-208 Matosinhos, Portugal
*
Author to whom correspondence should be addressed.
Water 2021, 13(20), 2836; https://doi.org/10.3390/w13202836
Submission received: 13 September 2021 / Revised: 6 October 2021 / Accepted: 7 October 2021 / Published: 12 October 2021

Abstract

:
The Water Framework Directive (WFD) is used to evaluate the water quality of aquatic ecosystems. Phytoplankton is the only biological element considered in the reservoirs water quality assessment. In this study, we aimed to assess the use of the bacterioplankton community as an indicator of water quality, using a culture-independent assay (denaturing gradient gel electrophoresis, DGGE). Four Portuguese reservoirs (Miranda, Pocinho, Aguieira and Alqueva) were analysed in four periods (autumn 2018, spring and autumn 2019, and spring 2020). Bacterial total abundance had similar values for Miranda, Pocinho and Aguieira, and generally lower values for Alqueva. Diversity and richness values did not show a clear trend. Negative correlations were observed between some nutrients and the bacterial community. Overall, members of Actinobacteria, Bacteroidetes, Cyanobacteria, Nitrospirae and Proteobacteria were identified in all sampling sites. In Alqueva, no spatial, temporal or water body quality relationships with bacterial community were observed, which may be due to its higher size, low water velocity rate and higher residence times. However, in Miranda, Pocinho and Aguieira, a strong spatial and temporal bacterial community dynamic was observed. Furthermore, the presence of some species (e.g., Acinetobacter sp.) may reflect the poor water quality that was not detected by the WFD approach.

1. Introduction

Superficial freshwaters, especially reservoirs, are subjected to eutrophication, mainly due to the excessive charge of nutrients, in particular, in the area upstream of the reservoir [1,2]. The occurrence of this phenomenon leads to excessive growth of primary producers, which can disrupt the dynamics of the biological equilibrium in the aquatic ecosystem [3].
The Water Framework Directive 2000/60/EC (WFD), created in 2000 and applied by the European Union, aims to assess the ecological quality of water bodies [4] which, in the case of heavily modified water bodies (reservoirs), is denominated as “ecological potential”. This classification allows determining which parameters are in good conditions (similar to reference values) and which parameters are changed and therefore responsible for water degradation. As far as reservoirs are concerned, this directive is based on general physical and chemical parameters, on a specific list of specific pollutants and priority substances and on hydromorphological parameters. However, as biological elements only, the phytoplankton community is considered for this water typology.
Lentic freshwater environments have been heavily studied to understand their dynamics, focusing namely on physical and chemical characteristics. Relative to the community composition, phytoplankton and ichthyofauna are the most studied [5]. Of the freshwater ecosystems, reservoirs are the less studied and the most similar to natural lakes, with small differences, such as shorter retention times and water level fluctuations, which makes the dynamics slightly different [5,6]. Recently published works have drawn attention to the importance of microbial diversity in the functioning of aquatic ecosystems [6,7]. Several authors report that bacteria are the most abundant and most important group in the microbial community (e.g., [5,7]), being especially responsible for organic matter mineralization and nutrient recycling processes [5,8]. However, few studies relate the community composition of bacterioplankton to chemical, physical and other biological parameters [9,10]. Moreover, it is believed that abiotic (e.g., temperature, oxygen, pH, conductivity, water transparency, organic matter concentration and nutrients) as well as biotic (e.g., chlorophyll content and interactions with phytoplankton and zooplankton) factors may be temporally and spatially regulating the microbial communities [5,11]. It is already known that the phytoplankton and zooplankton communities have a spatial gradient along the reservoir according to nutrient concentration [9]. In experimental studies, the bacterioplankton community has also been shown to vary according to the availability of nutrients in marine and freshwater environments [9,12]. Other studies go further and mention the existence of a seasonality regarding the bacterioplankton composition [13,14], in contrast to others that refer to the existence of a gradual change with no connection to season [7,9]. However, none of these studies shows results for more than one year of sampling, and the inability to cultivate certain bacterial phylotypes in the laboratory has been mentioned by several authors as possibly responsible for errors in determining the composition of these communities [5,15]. Molecular methods have been used to characterize the bacterial community, as this is complex and many species are non-cultivable [5]. Denaturing gradient gel electrophoresis (DGGE) is one of the most used molecular methods to rapidly and more economically characterize the composition of a microbial community and compare communities [7]. This method permits the separation of DNA PCR products with the same length but different sequences (up to one base-pair difference) from highly conserved genetic regions, such as 16S rRNA gene [7,16]. DGGE is a screening method of rapid execution [16] and allows the comparison of various samples and ecosystems [7], being therefore a methodology helpful to allow a better understanding of the functioning of an aquatic ecosystem.
The present study aimed to complement the approach made by the conventional WFD through the analysis of the bacterial community. For that, the correlation between the composition of the bacterial communities of four Portuguese reservoirs (Miranda, Pocinho, Aguieira and Alqueva) and physical, chemical and the phytoplankton communities were used to assess if the bacterial community presents discriminatory characteristics regarding the reservoir’s water quality.

2. Materials and Methods

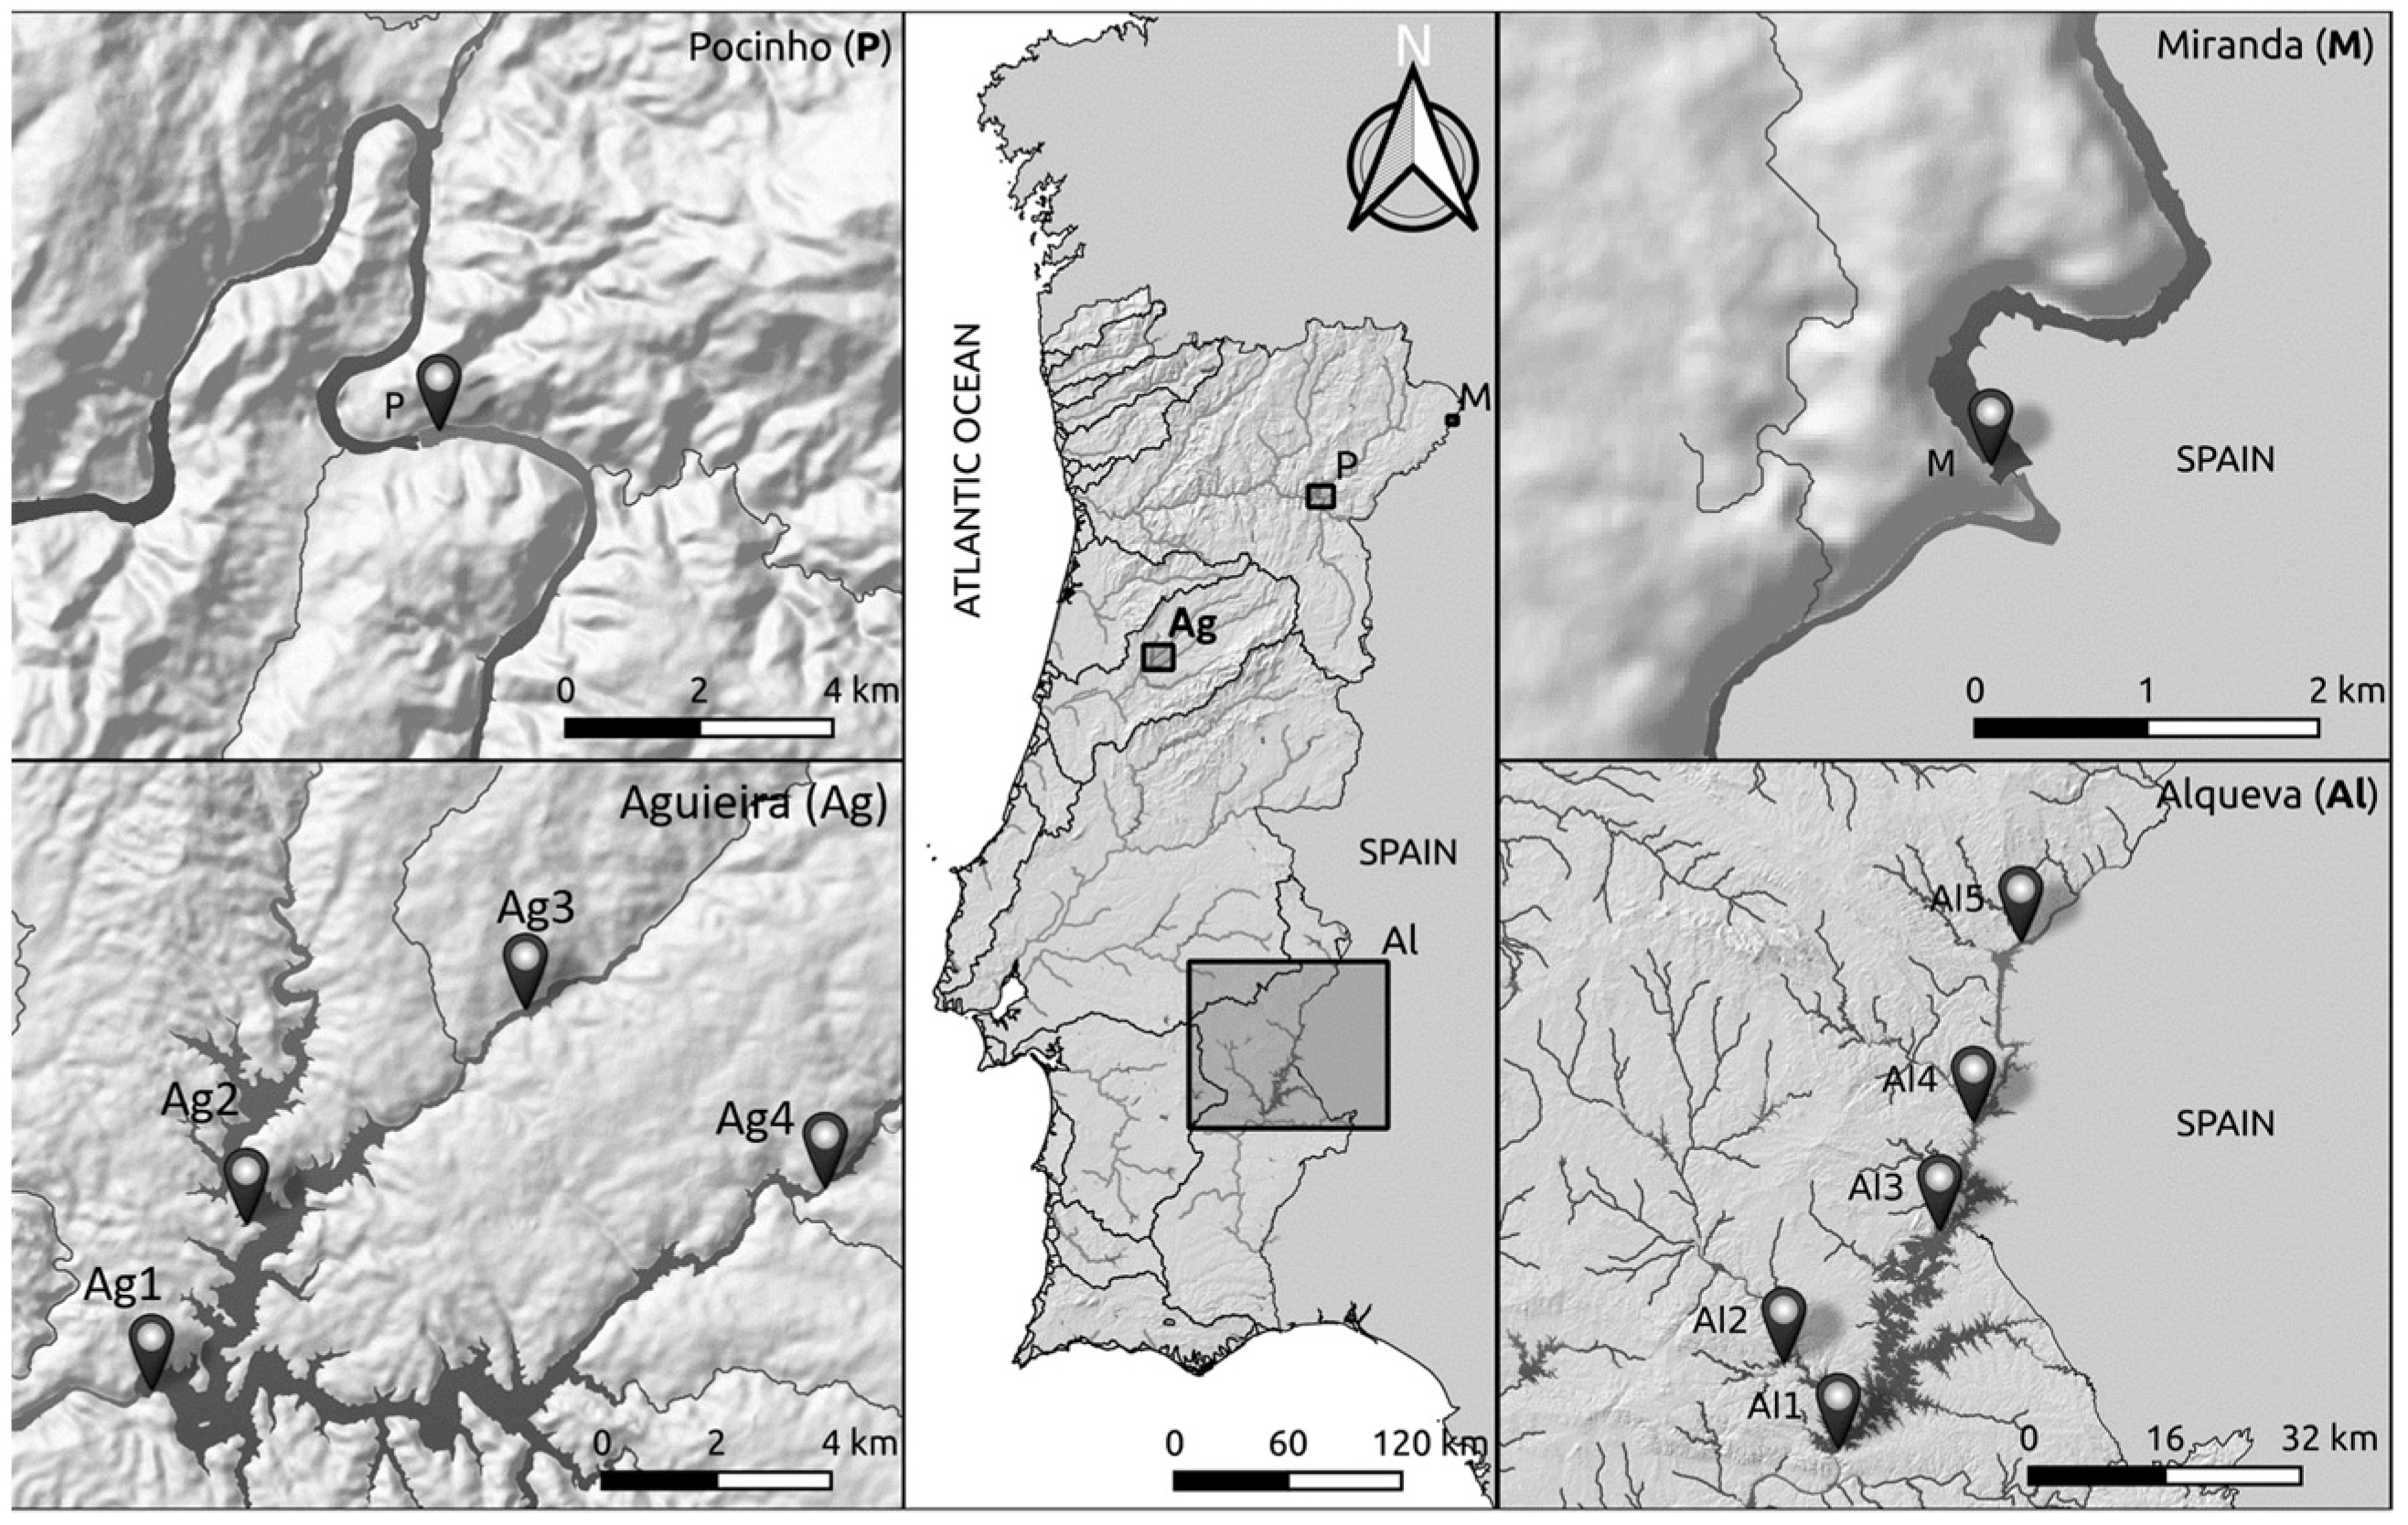
2.1. Study Areas and Sampling Procedure

Four Portuguese reservoirs, Miranda (M), Pocinho (P), Aguieira (Ag) and Alqueva (Al), were selected to conduct this study (Figure 1).
Miranda and Pocinho reservoirs are located in the north of Portugal, in the international and national sections of Douro River, respectively. Miranda reservoir has been in operation since 1960 to produce energy, and it is the smallest reservoir of this study, with an area of 1 km2 [17]. Pocinho reservoir started operating in 1982, is used for navigation as well as hydroelectric exploration and occupies an area of 8 km2 [18]. The selection of these reservoirs is related to the fact that Miranda and Pocinho are two ancient reservoirs, with small dimensions and located in a main course river in the northern region. Aguieira reservoir is located in the centre of Portugal, in the Mondego River, and started operating in 1981 for irrigation and hydroelectric exploration [19]. This reservoir occupies an area of 20 km2 and was included in the WFD inter-calibration exercise [20]. Aguieira was selected because it is one of the reference reservoirs for the WFD calibration and is located in the centre of Portugal on a main course river. Alqueva reservoir is situated in the Alentejo, in the Guadiana River, being the largest artificial water reservoir in Western Europe, with an area of 250 km2 [21]. Since 2004, it has been operating with the objective of irrigation, water supply, navigation and electricity production [22,23]. The Alqueva was selected for being a recent reservoir, having high dimensions and being located in the south of Portugal on one of the main course rivers.
Due to the small area of Miranda and Pocinho reservoirs and the fact that the entire reservoir has the same characteristics and pressures, only one sampling site in each of these reservoirs was selected, (M and P respectively; Figure 1). In the Aguieira reservoir, four sampling sites (Ag1 to Ag4; Figure 1), and in Alqueva reservoir, five sampling sites (Al1 to Al5; Figure 1) were selected. Each reservoir was sampled in 4 periods, autumn 2018 (Aut18), spring 2019 (Spr19), autumn 2019 (Aut19) and spring 2020 (Spr20). In situ in each sampling site, several abiotic parameters were measured sub-superficially (<0.50 m depth): pH, conductivity (Cond, μS/cm), temperature (Temp, °C) and dissolved oxygen (O2, mg/L and %), with a multiparameter probe (Multi 3630 IDS SET F). To examine the bacterial community, a water sample of 500 mL was collected in each site. Additionally, for the quantification of other chemical and biological parameters, 5 L of water sample were collected in plastic bottles. All samples were transported to the laboratory at 4 °C and under dark conditions for further analyses.

2.2. Laboratory Procedures

The concentration of the following compounds was determined using specific chromatographic methods. Nitrate concentration (NO3, mg/L) was quantified by liquid chromatography of ions [24]. Turbidity (Turb, m−1) was determined in a spectrophotometer method using the protocol of Brower et al. [25]. Total suspended solids (TSS, mg/L) were performed according to APHA [26]. Total nitrogen concentration (Ntotal, mg/L) was determined using the Kjeldahl nitrogen method [27]. Total phosphorus concentration (Ptotal, mg/L) was determined by the application of inductively coupled plasma mass spectrometry [28]. Ammonium concentration (NH4+, mg/L) was determined by spectrophotometric and turbidimetric analyses [29]. The determination of the content in the chlorophyll a (Chl a, µg/L) was followed according to the protocol of the Agência Portuguesa do Ambiente [30] and Instituto da Água [31], and three replicates were performed for each site.

2.3. Bacterioplankton Analysis

2.3.1. DNA Extraction and PCR Amplification

In the laboratory, the water samples collected in a Schott glass flask was fully filtered with a 0.22 μm polycarbonate sterile filter. Half of the filter was used for the extraction of the metagenomic microbial DNA. DNA extraction was performed using the commercial kit DNeasy® PowerSoil® Kit (QIAGEN Group, Hilden, Germany) according to the manufacturer’s instructions. The extracted DNA was used for PCR amplification of the 16S rRNA gene, using the universal primers GC-358F (5′-CCT ACG GGA GGC AGC AG-3′; with a GC-clamp at the 5′ end) and 907r (5′-CCG TCA ATT CMT TTG AGT TT-3′) in 50 μL of PCR mixture (25 μL of NZYTaq 2× Green Master Mix; 0.5 μM of each primer and 10 μL of DNA as template). The PCR reaction was performed in a MyCycler™ Thermo Cycler (Bio-Rad, Hercules, CA, USA), with an initial denaturation step for 5 min at 94 °C; followed by 10 cycles of 1 min at 94 °C, 1 min at decreasing temperature (each cycle starting at 65 °C and ending at 55 °C) and 3 min at 72 °C; subsequent 20 cycles of 1 min at 94 °C, 1 min at 55 °C and 3 min at 72 °C; and a final extension of 10 min at 72 °C.

2.3.2. DGGE

The products of PCR amplification were loaded on an 8% polyacrylamide DGGE gel, using a denaturing gradient of 30–70% 7 M urea/40% formamide. DGGE electrophoresis was performed in a DCode™ universal mutation detection system (Bio-Rad Laboratories Lda, Amadora, Portugal) at 60 °C for 16 h in 1× TAE buffer with a constant voltage of 65 volts. The gels were stained for 1 h in 1× TAE buffer with SYBR® Gold Nucleic Acid Gel Stain (Thermo Fisher Scientific, Waltham, MA, USA) and subsequently visualized in a Gel Doc EZ system (Bio-Rad Laboratories Lda, Amadora, Portugal) with Image Lab Software v4.0.1 (Bio-Rad, Hercules, CA, USA) using UV light. DGGE gels were scanned and analysed with the QuantityOne software v4.6.9 (Bio-Rad, Hercules, CA, USA) for further statistical analysis.

DNA Sequencing of Excised DGGE Bands

Thirty bands of different sizes and positions were excised from the DGGE gel according to the following criteria: (i) common to all or almost all sites; (ii) unique to a specific site; (iii) common to a specific reservoir or reservoirs; and (iv) seasonal presence. Each band was eluted in 20 mL ultrapure water prior to DNA re-amplification using the same oligonucleotide primers as above, but without the GC clamp. Amplicons were purified using the Illustra GFX PCR DNA and Gel Band Purification Kit (GE Healthcare, Chicago, IL, USA) and directly sequenced by GATC Biotech, to identify microbiota OTUs (Operational Taxonomic Units). The sequences were assembled and corrected using GENEIOUS PRIME (version 2020.0.5). Alignment of all consensus sequences was performed using MEGA 7 (Molecular Evolutionary Genetics Analysis) software, which permits to infer over time the molecular evolution between genes, genomes and species [31].

2.4. Statistical Analysis

Bacterioplankton DGGE banding patterns were transformed into presence/absence matrices and band intensities were measured using QuantityOne 1-D Analysis Software v4.6.9 (Bio-Rad Laboratories Lda., Amadora, Portugal). Relative similarities between samples and replicates were calculated using the Primer v7.0.11 (PRIMER-E, Ivybridge, UK). Besides the total number of OTUs (operational taxonomic units), the Shannon-Wiener index was used to estimate microbial diversity, while the Margalef index was used to estimate the microbial richness of each sample. To test the existence of relations between the environmental water parameters and communities variations, a Pearson correlation coefficient was calculated. The level of significance considered was α = 0.05.
For each hydrographic basin, clustering patterns were achieved by the construction of complete linkage dendrograms, based on the Bray-Curtis coefficient, using Primer software v7.0.11. The construction of the phylogenetic tree from the DGGE bands DNA sequences was performed using the calculation method maximum likelihood—ML in MEGA 7, applying general time reversible model and gamma distributed with invariant sites (G + I). The sequences were compared to the GenBank database using the Basic Local Alignment Search Tool (BLAST).

3. Results

3.1. Environmental Variables and Nutrient Concentrations

Table 1 presents the results of physical, chemical and biological (Chl a as a proxy of phytoplankton biomass) parameters measured for each site over the sampling period. According to the physical and chemical parameters used in the WFD, for heavily modified and artificial water bodies, only the pH, O2, NO3 and Ptotal have environmental quality standard (EQS) values established for a good ecological potential (EP) (Table 1). In general, the pH presented higher values in the spring samples for all reservoirs. Similarly, the O2 showed also higher values in the spring samples in all reservoirs. According to the WFD, the O2 concentration was below the minimum EQS limit in M, Ag1 and Ag2 in Aut19. The values of NO3 did not show any pattern in Miranda, Pocinho and Alqueva reservoirs, and in Aguieira, the highest values were generally recorded in autumn samplings. In all reservoirs, the NO3 concentrations were always below the maximum established value. Ptotal presented the highest concentrations, namely in the upstream sites of Aguieira and Alqueva reservoirs (Ag3, Ag4 and Al5). High concentrations of Ptotal were also observed in Miranda and Pocinho in Aut18 and Spr20. This parameter was found several times above the EQS, namely in Miranda and Pocinho in Aut18 and Spr20; in Aguieira during all sampling periods at site Ag3; and in Alqueva at Al4_Aut18 and in site Al5 in Aut18, Spr19 and Spr20.
Regarding the remaining physical and chemical parameters that have no reference value (Table 1), the Cond presented the highest values in Alqueva reservoir (>500 μS/cm), followed by Miranda and Pocinho reservoirs (>250 μS/cm) and Aguieira reservoir presented the lowest values observed (almost always <100 μS/cm). Turb and TSS appear to be related, as sites with higher turbidity also have higher TSS content (e.g., Ag3_Aut18 and Al5 in all seasons). The water temperature fluctuated considerably throughout the sampling periods (9 to 33 °C), revealing seasonality in all reservoirs. Ntotal and NH4+ showed several values below the detection level during the sampling periods; however, when they were quantifiable, they presented higher concentrations in the most upstream sites of the reservoirs (Ag3, Ag4 and Al5).
Concerning the analysed biological parameter, Chl a, was mostly above the permitted limit (Table 1). For Miranda, Pocinho and Alqueva reservoirs, values were found above the limit for good EP (EQS ≤ 9.50 µg/L) in all spring samples of Miranda and Pocinho and in Al5 in all sampling periods. Regarding the Aguieira reservoir, all sites in spring samples, Ag2 and Ag3 of Aut18 and in Ag3 of Aut19 presented values above the limit (EQS ≤ 7.90 µg/L). According to the previously analysed parameters, the water quality of reservoirs tends to show low water quality, namely in Miranda and Pocinho, almost all sites of Aguieira and in the Al5 site of Alqueva.

3.2. Bacterioplankton Community

3.2.1. Bacterial Community of Water

Total abundance, diversity (Shannon-Wiener) and richness (Margalef) of bacterioplankton communities from Miranda, Pocinho, Aguieira and Alqueva reservoirs samples are presented in the Table 2. In the Miranda reservoir, all the parameters have the highest values in the autumns samples, while in Pocinho, the highest values were recorded in Aut18 and Spr20. For these reservoirs, the total abundance varied between 14 and 20 OTUs, the Shannon-Wiener index between 2.57 to 2.97 and the Margalef index between 0.80 to 1.16. Aguieira and Alqueva reservoirs did not show a clear pattern for these parameters along the sampling period or sites. However, in Aguieira, the total abundance varied between 11 and 27 OTUs, the Shannon-Wiener index between 2.36 to 3.26 and the Margalef index between 0.63 to 1.56. Alqueva reservoir recorded the lowest values of the mentioned parameters, where the total abundances varied between 4 to 17 OTUs, the Shannon-Wiener index between 1.31 to 2.74 and the Margalef index between 0.21 to 1.03.

3.2.2. Relations between Bacterial Communities and Environmental Parameters

Correlations between environmental parameters and the bacterioplankton communities are presented in Table 3. Miranda and Pocinho reservoirs did not show correlations between the analysed data. Regarding Aguieira reservoir, the bacterial community showed correlations with the same environmental parameters for all bacterial parameters analysed (Table 3). In the case of the total bacterial abundance, positive correlation with Temp (p = 0.0058) and a negative correlation with Turb (p = 0.0462) and NO3 (p = 0.0392) were observed. The results of Shannon diversity index showed a positive correlation with Temp (p = 0.0053) and a negative correlation with Turb (p = 0.0173) and NO3 (p = 0.0309). Margalef index presented a positive correlation with Temp (p = 0.0060) and a negative correlation with Turb (p = 0.0477) and NO3 (p = 0.0382). The results of Alqueva reservoir also show correlations between the same bacterial community data and the same environmental parameters, except for Ptotal. The bacterial abundance presented a negative correlation with pH (p = 0.0299), Cond (p = 0.0334), O2 (p = 0.0495), Turb (p = 0.0251), Ntotal (p = 0.0097) and Chl a (p = 0.0129). The results of Shannon index showed also a negative correlation with pH (p = 0.0229), Cond (p = 0.0242), O2 (p = 0.0215), Turb (p = 0.0144) Ntotal (p = 0.0029), Ptotal (p = 0.0435) and Chl a (p = 0.0016). Margalef index presented a negative correlation with pH (p = 0.0313), Cond (p = 0.0308), O2 (p = 0.0476), Turb (p = 0.0223), Ntotal (p= 0.0097) and Chl a (p = 0.0109).

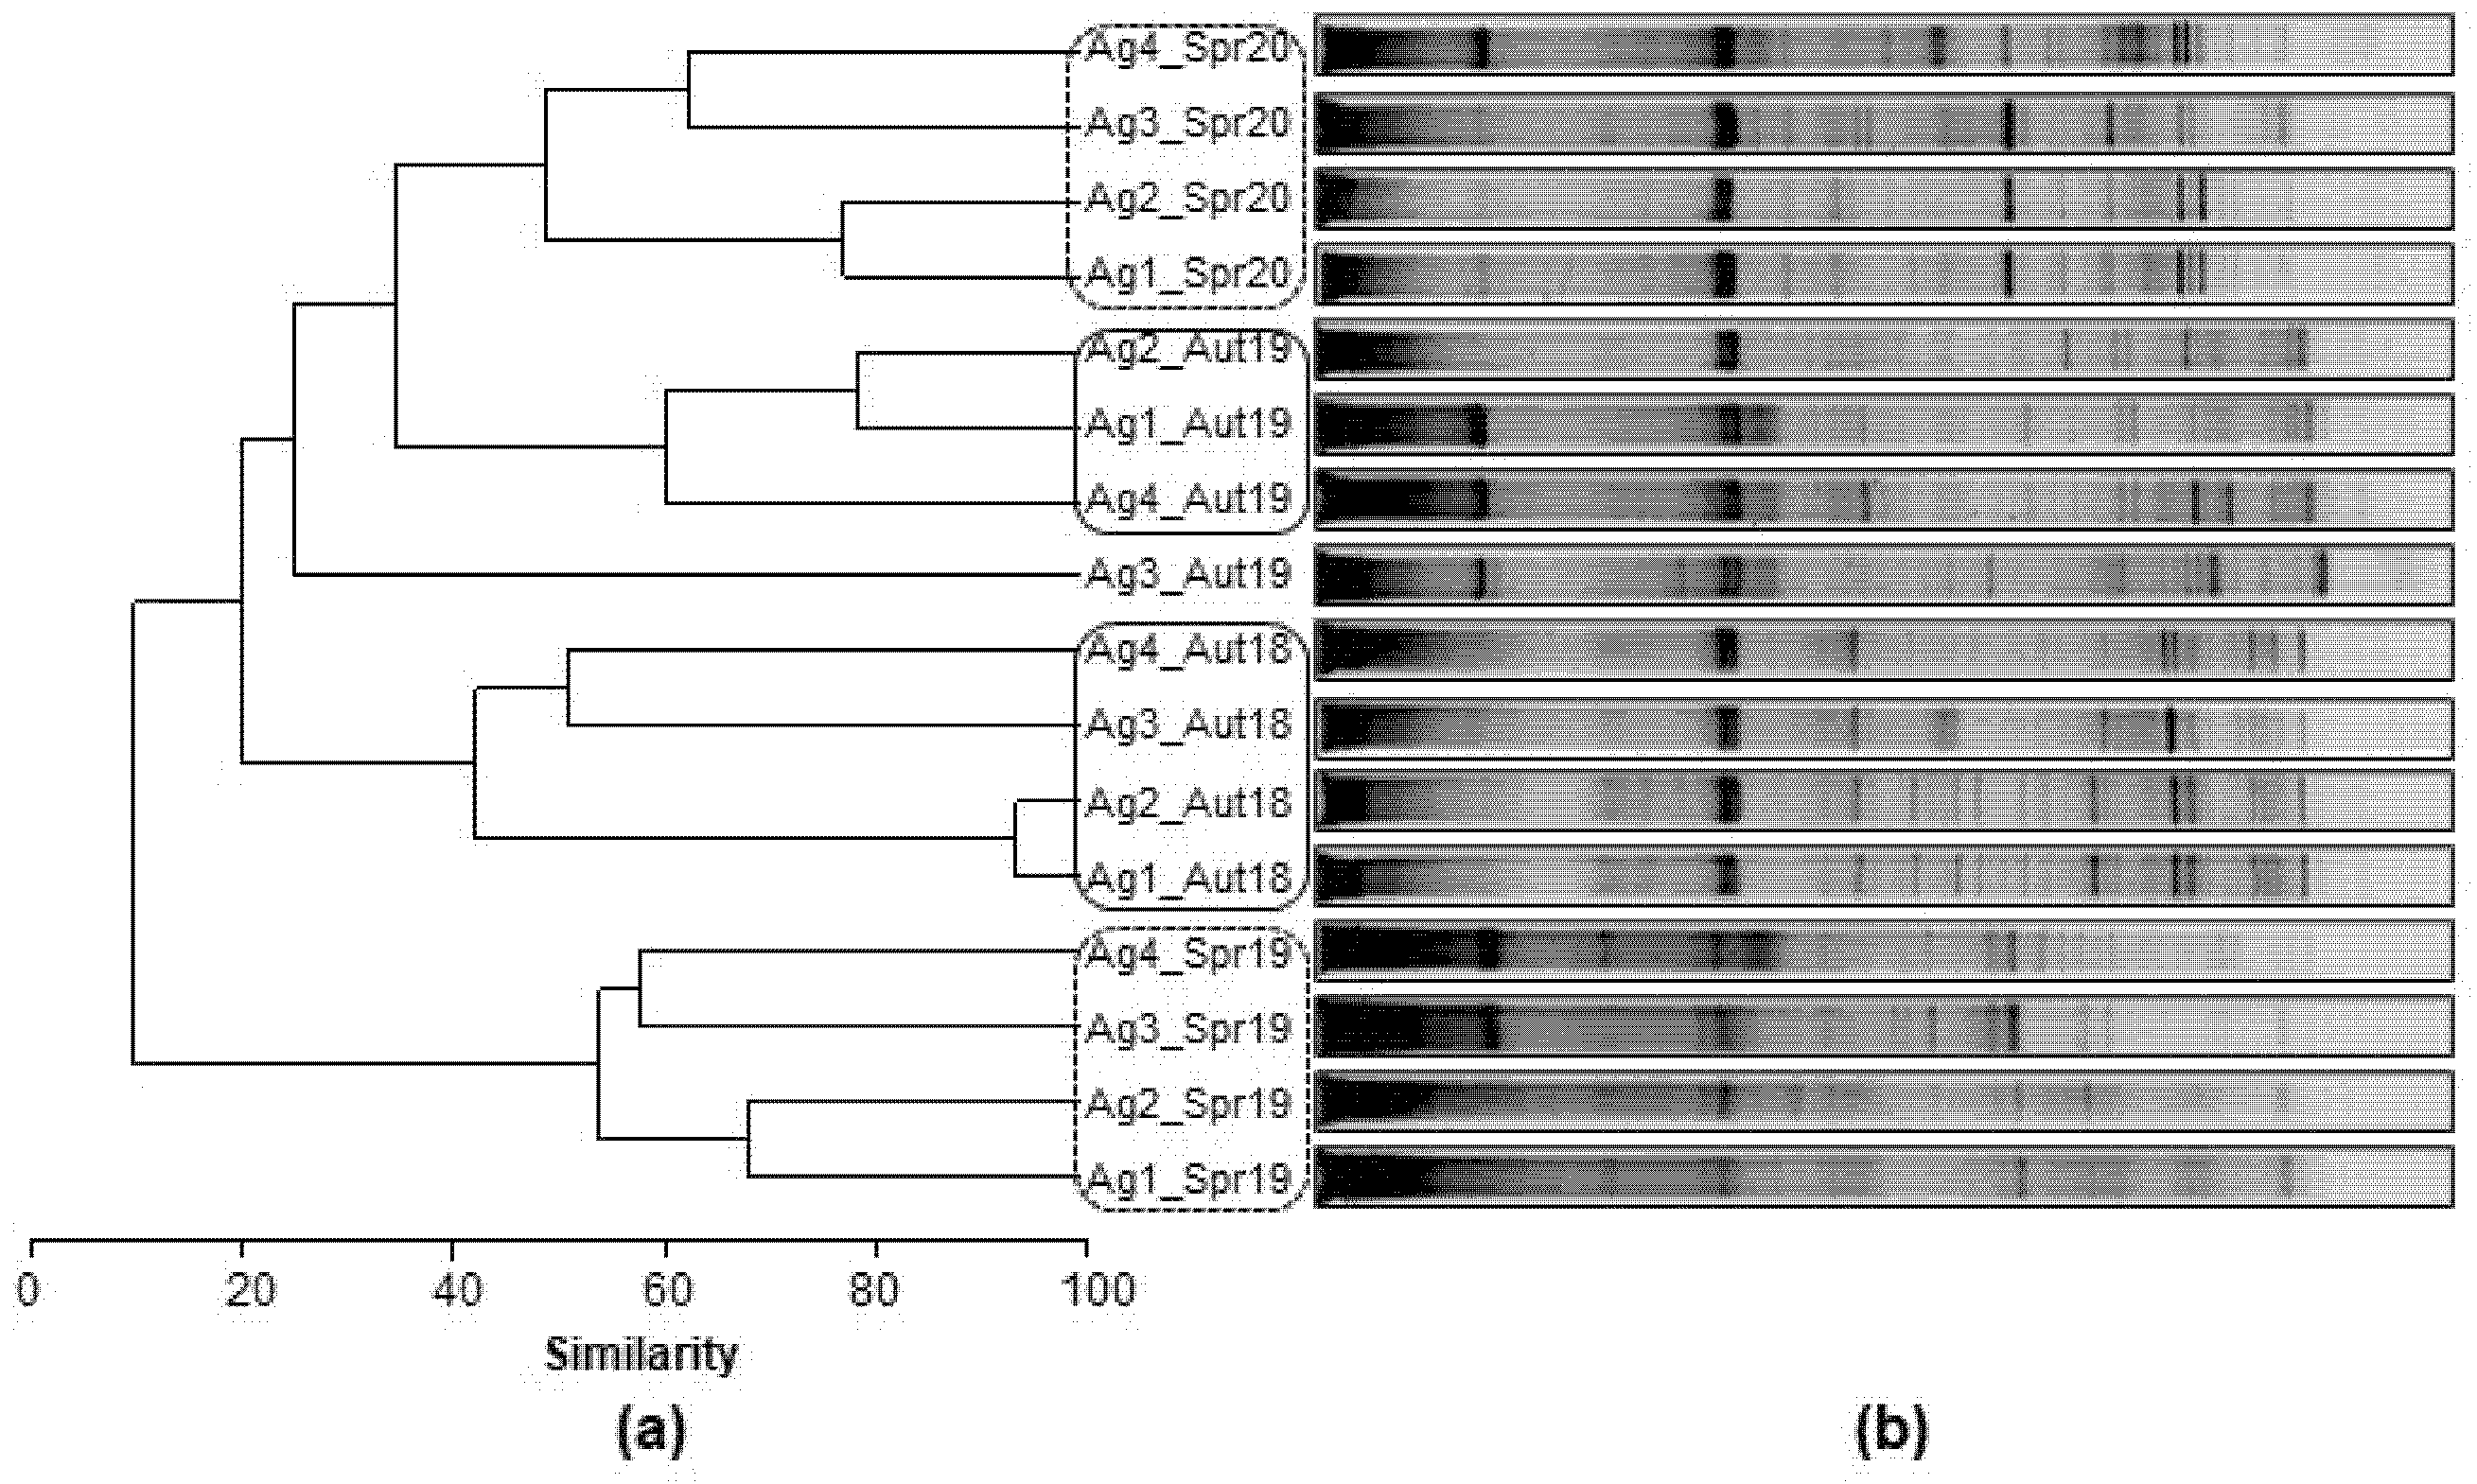
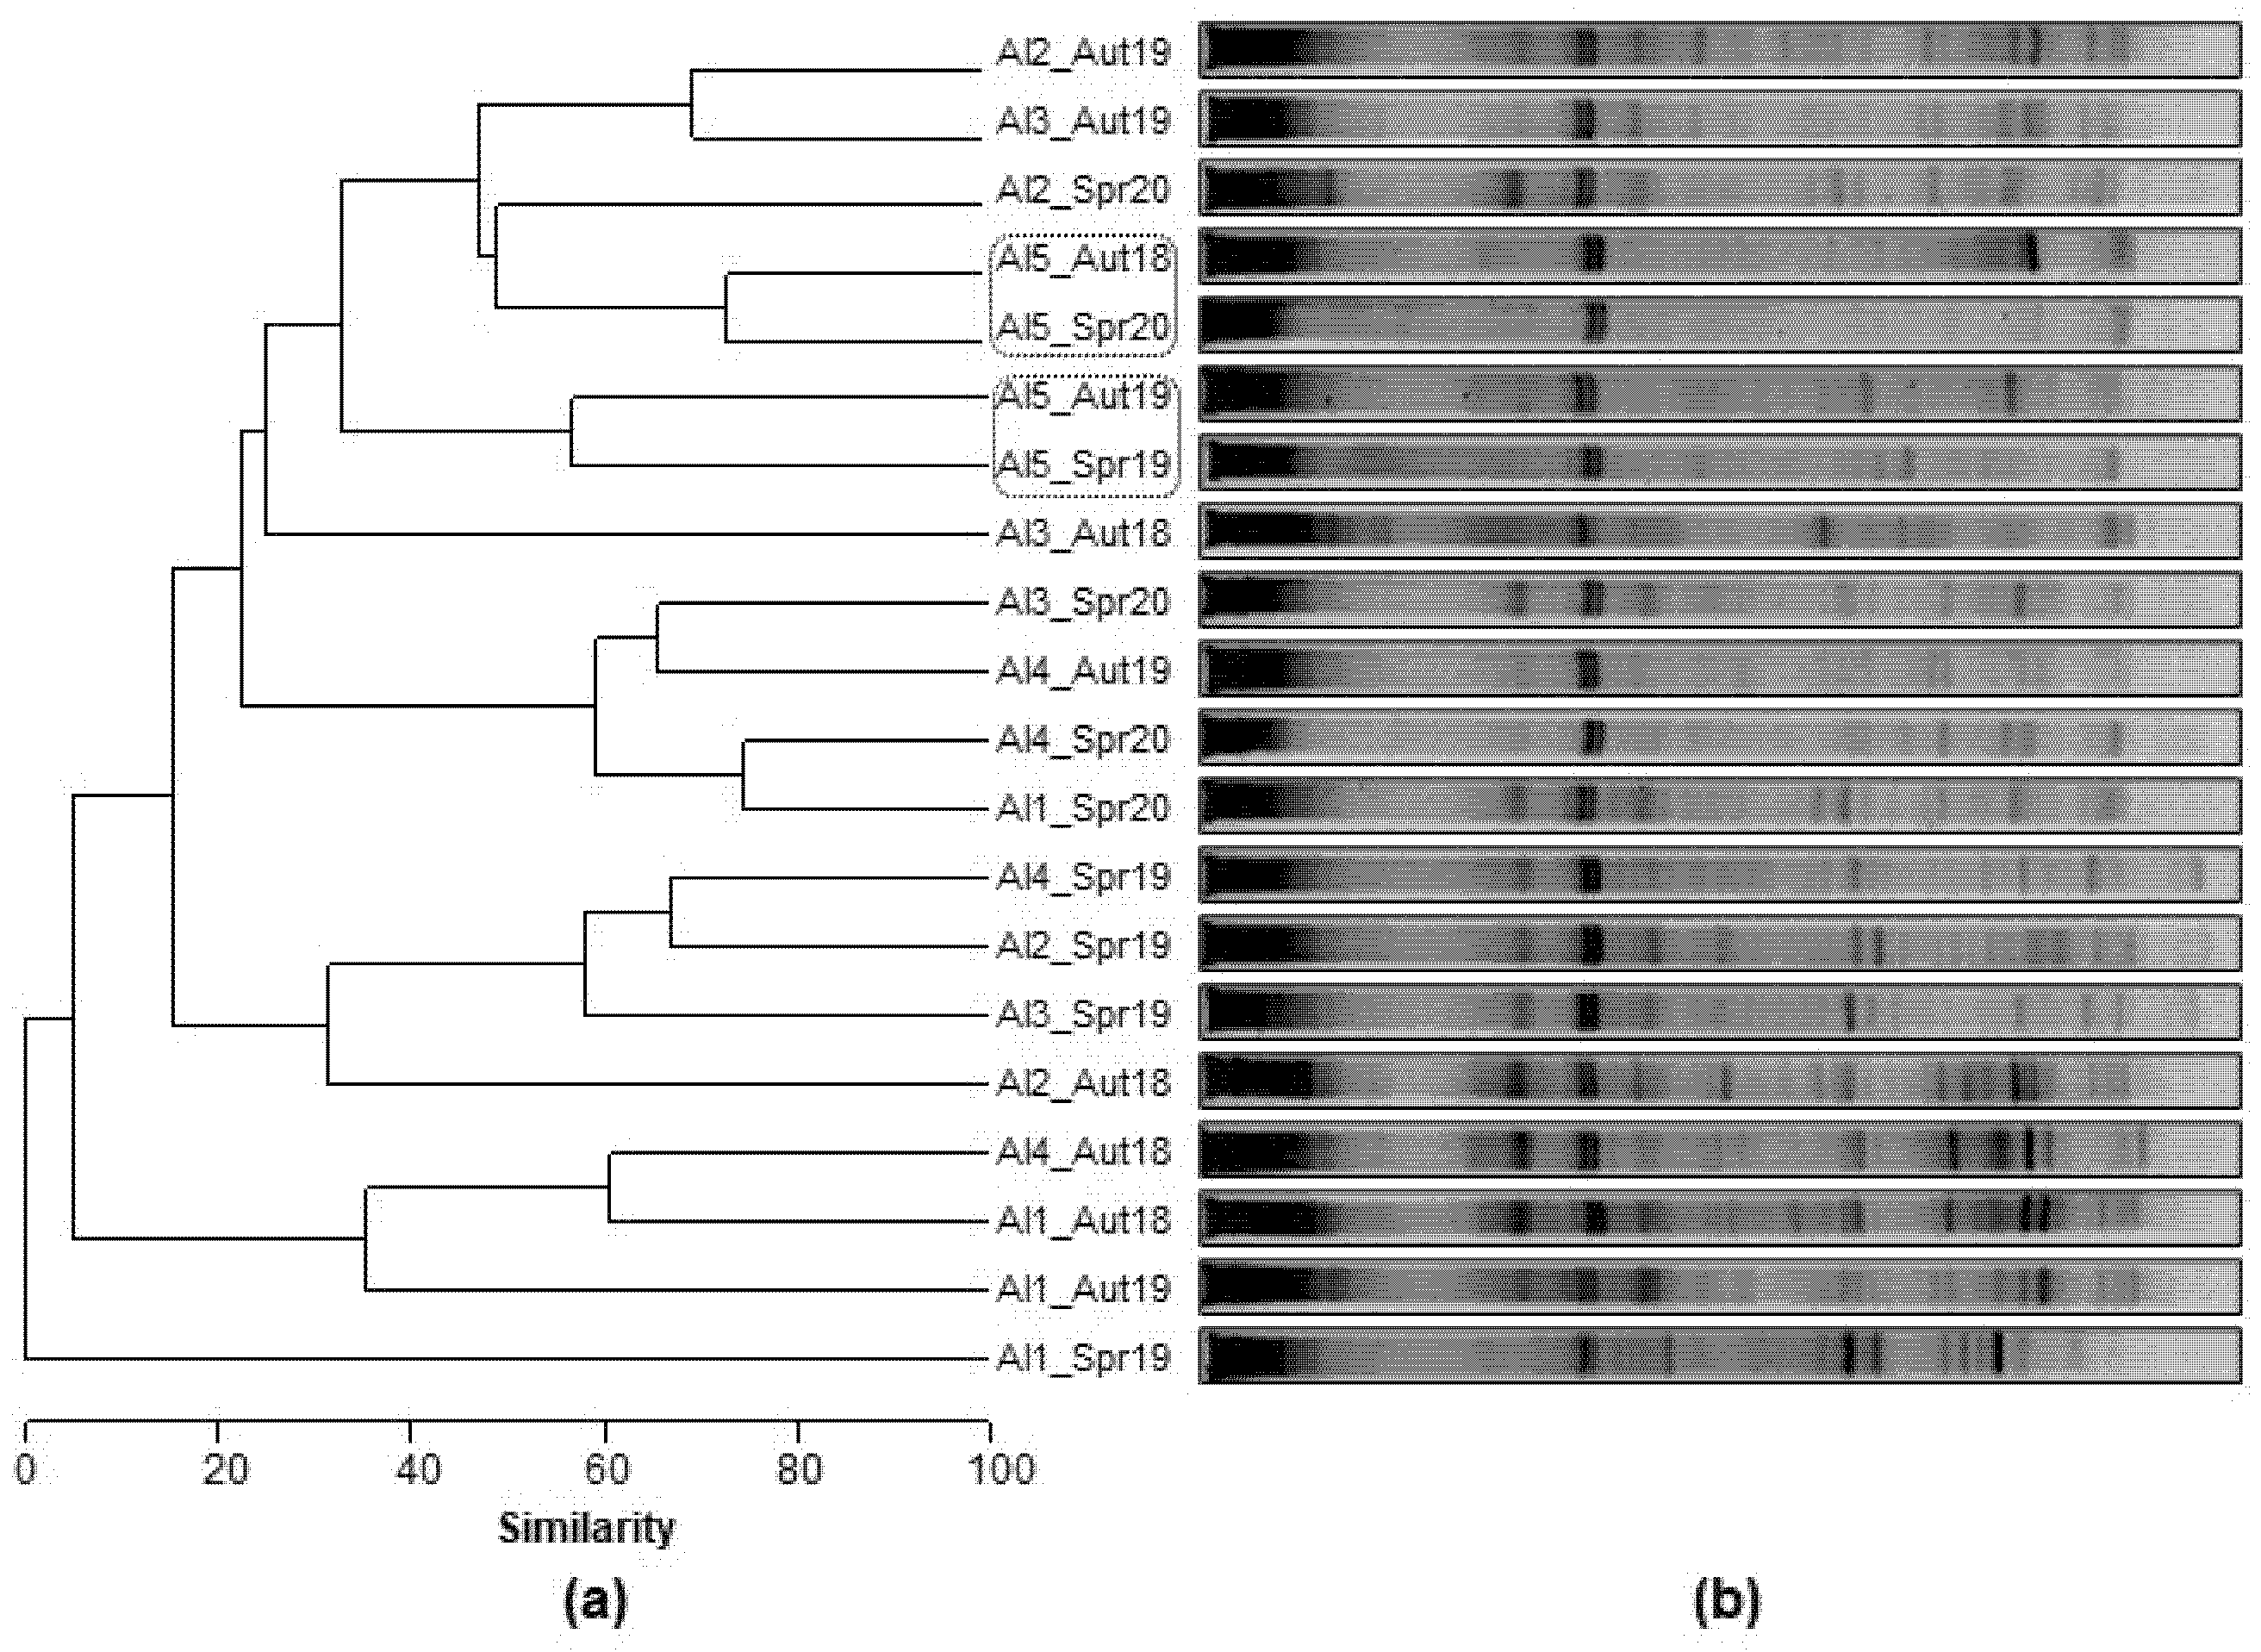
3.2.3. Spatial and Temporal Bacterial Dynamic

Figure 2 represents (a) the Bray-Curtis dendrogram and (b) the profile of the DGGE bands for each sampling site of Miranda and Pocinho reservoirs (belong to the same hydrographic basin). The analysis of bacterioplankton of these reservoirs revealed a clear seasonal separation (Aut/Spr), also observed previously in the physical and chemical results (Table 1). Within the autumn samples, it was also possible to verify the separation of samples by reservoir (M/P); however, in the spring samples, this separation did not occur.
Figure 3 represents (a) the Bray-Curtis dendrogram and (b) the profile of the DGGE bands for each sampling site of Aguieira reservoir. The analysis of bacterioplankton for this reservoir revealed different groups separated by the season (Aut/Spr) with the exception of Ag3_Aut19, which was separated from all groups. In addition, it was possible to observe the greater similarity between sites that are geographically close to the dam (Ag1 and Ag2) as well as for sites that are geographically furthest from the dam (Ag3 and Ag4).
Figure 4 represents (a) the Bray-Curtis dendrogram and (b) the profile of the DGGE bands for each sampling site of Alqueva reservoir. Contrary to what was observed in the previous reservoirs, the dendrogram of Alqueva reservoir did not show any clear tendency of sites or seasons grouping. However, the samples from Al5 site, the most upstream location, are close to each other, despite not being grouped seasonally.

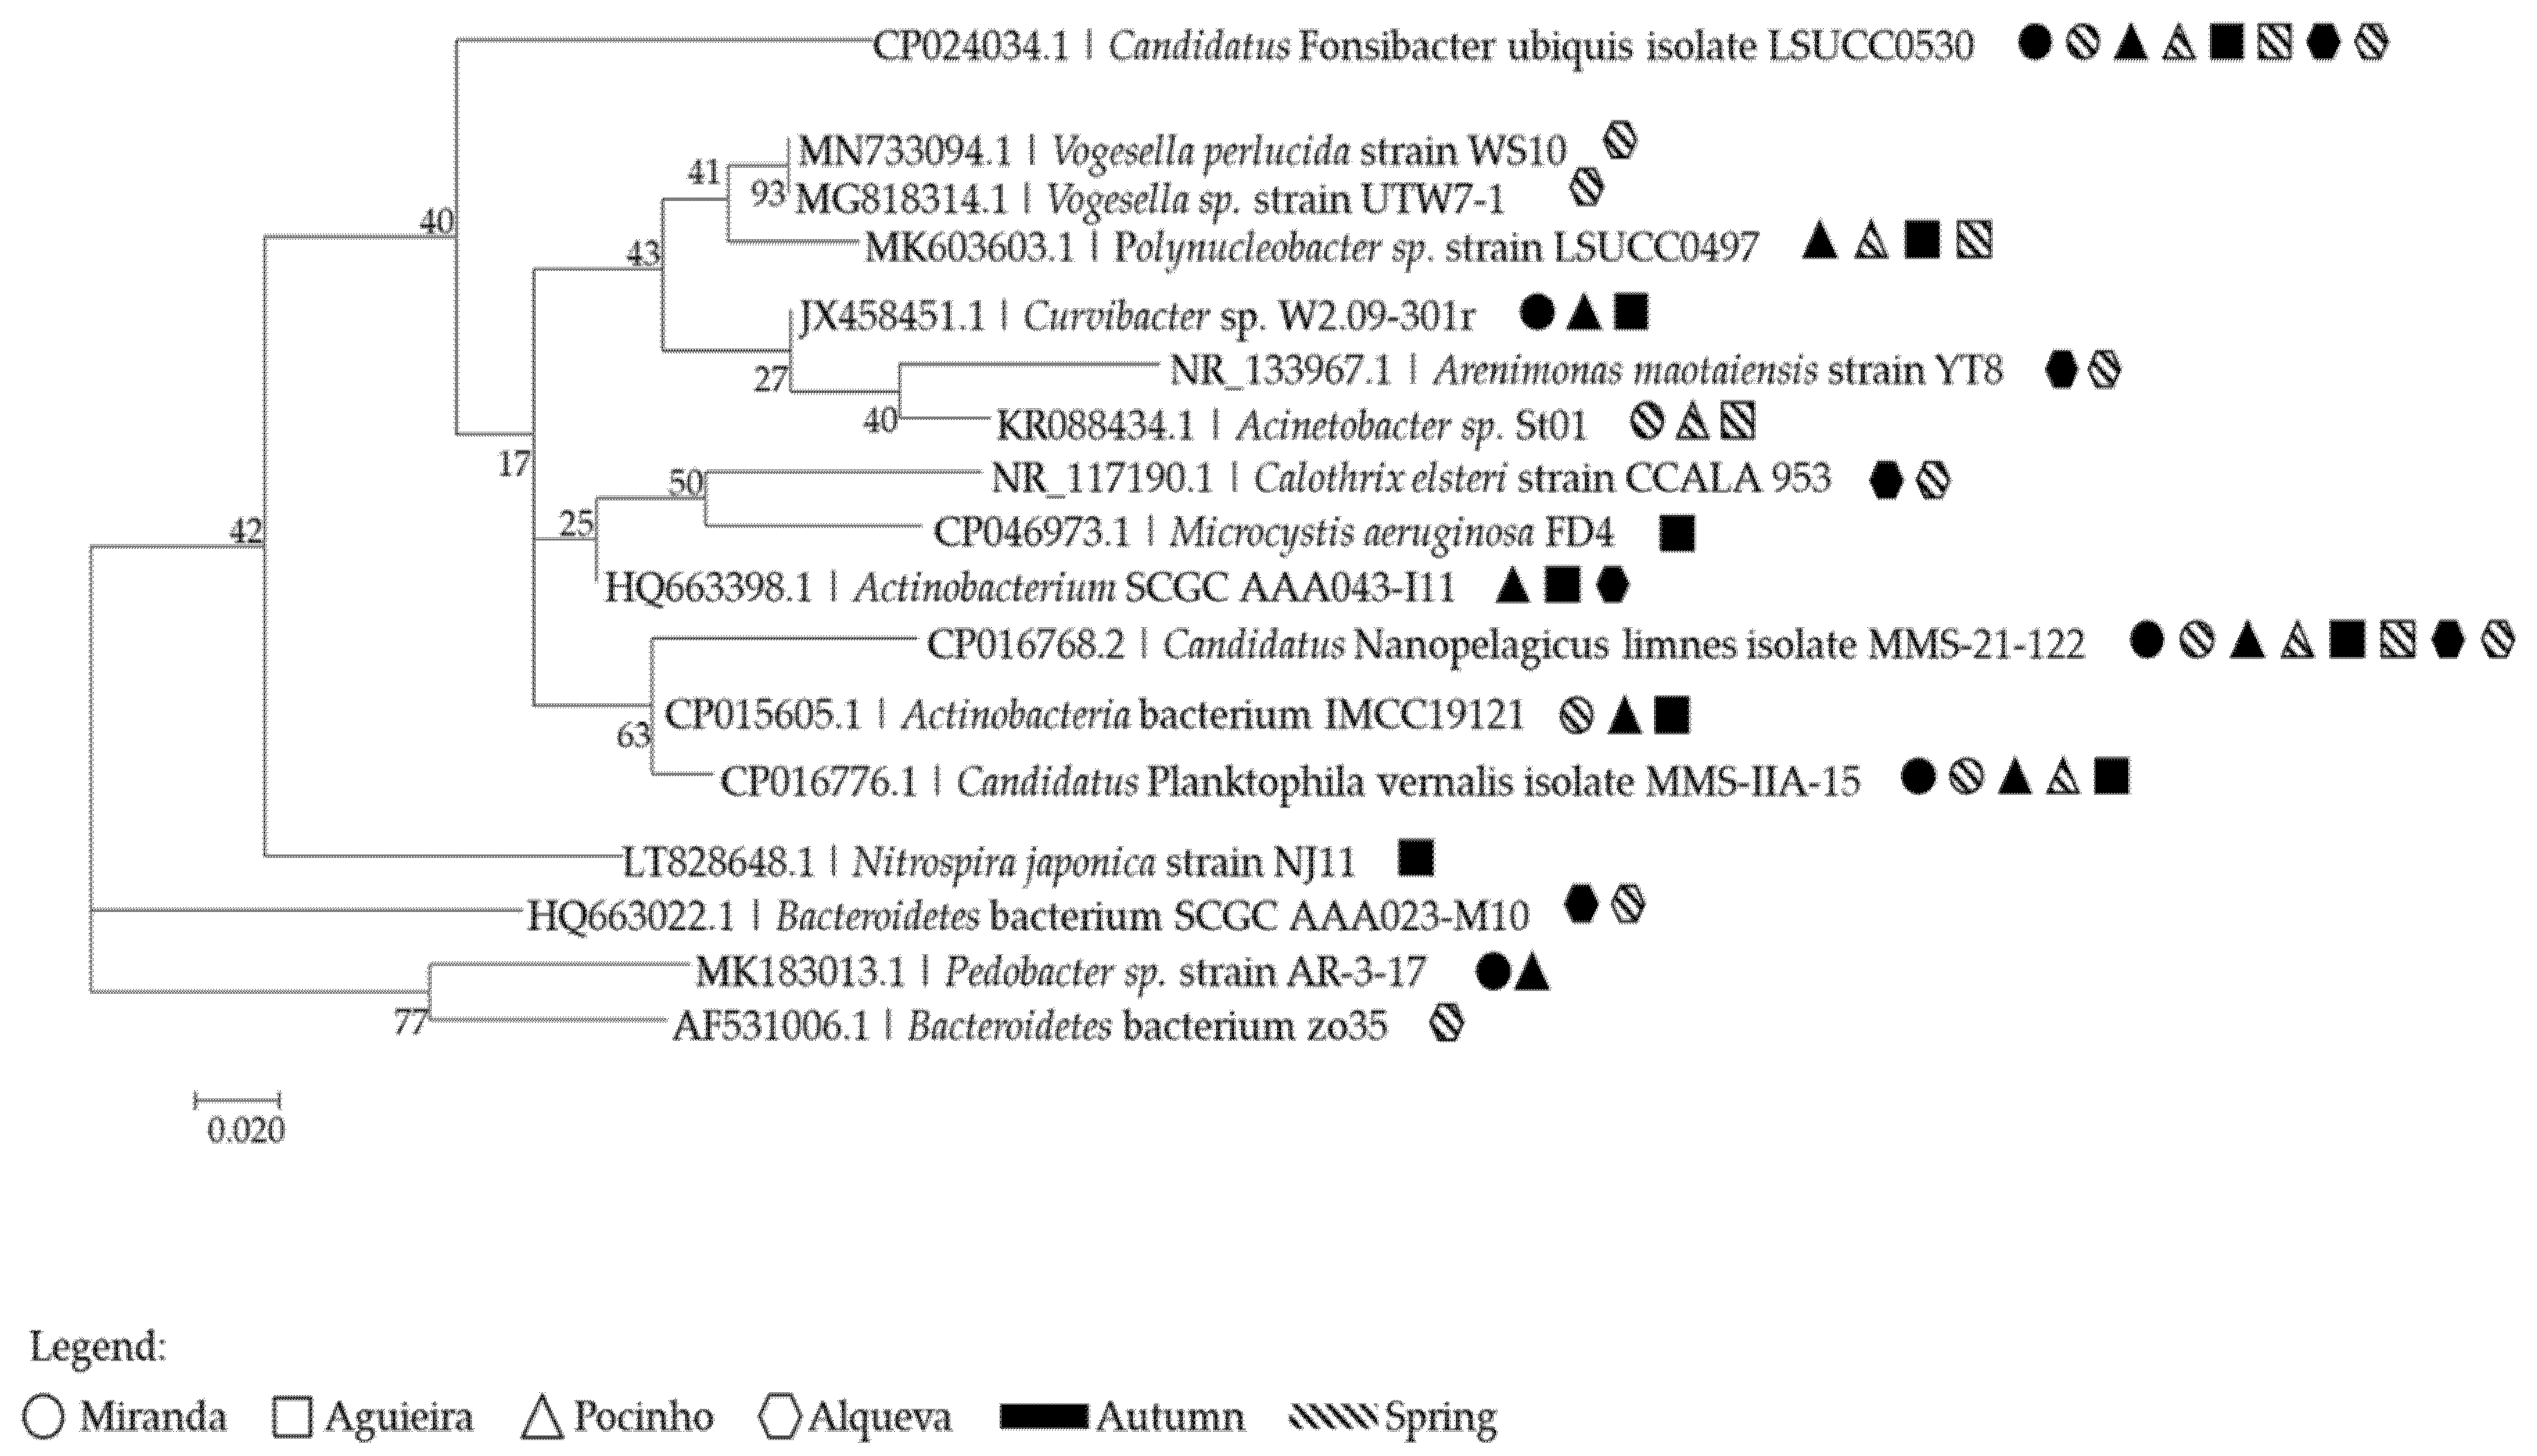
3.2.4. Microbial Community Phylogeny

Of the 30 DGGE excised bands, 24 bands were phylogenetically identified based on the analysis of the 16S rRNA gene. These belonged to five different bacterial phyla: Actinobacteria, Bacteroidetes, Cyanobacteria, Nitrospirae and Proteobacteria (Table S1 and Figure 5). Although the PCR was performed with bacterial specific primers, eukaryotic DNA was also detected, which belong to the Cyclopidae family (Macrocyclops albidus) (Table S1). The 24 different excised bands identified seventeen different strains. In four of the bands, it was not possible to make an identification beyond the phylum.
From Actinobacteria phylum, Actinobacteria bacterium IMCC19121 was identified in Miranda reservoir only in Spr19, in Pocinho reservoir in both autumns and in all sites of Aguieira only in Aut18. Actinobacterium SCGC AAA043-I11 was identified in all autumn samples from Pocinho and Aguieira reservoirs and in almost all sites of autumn samples from Alqueva reservoir. Candidatus Nanopelagicus limnes MMS-21-122 was found in all the reservoirs and in all seasons. Candidatus Planktophila vernalis MMS-IIA-15 was identified in Miranda and Pocinho except in the Spr19 and in the Aguieira in both spring samplings. The Alphaproteobacteria, Candidatus Fonsibacter ubiquis LSUCC0530 was identified in all reservoirs and seasons except in Aguieira in Spr19. The Bacteroidetes, Bacteroidetes bacterium SCGC AAA023-M10 and Bacteroidetes bacterium zo35 were only retrieved in Alqueva reservoir, except in Spr19 for the first species and in both autumns for the second species. The Pedobacter sp. strain AR-3-17 was found in Miranda and Pocinho reservoir, only in the Aut18. In the Betaproteobacteria, Curvibacter sp. W2.09-301r was only identified in some sites of autumn samples (Miranda and Pocinho of Aut18 as well as in Ag1_Aut18 and Ag3_Aut19). Polynucleobacter sp. strain LSUCC0497 was identified in Ag1 and Ag2 of Aut19 and Spr20 and in Pocinho of Aut18 and Spr19. Vogesella perlucida strain WS10 and Vogesella sp. strain UTW7-1 was only observed in Al1_Spr19. The Cyanobacteria, Calothrix elsteri strain CCALA 953 was observed in almost all sites of Alqueva reservoir. The other cyanobacteria identified in this study, Microcystis aeruginosa FD4, was only identified in Ag3_Aut18. The Gammaprotobacteria, Acinetobacter sp. St01 was only observed in spring samples from Pocinho and Aguieira. Arenimonas maotaiensis strain YT8 was only identified in Al5 of autumn samples and in Al4_Spr19. The Nitropirae, Nitrospira japonica strain NJ11 was only found in Ag1 and Ag2 of Aut18.

4. Discussion

The water quality of the reservoirs observed in the present study are mainly due to the high concentrations of Ptotal and Chl a. Over the last years, all the studied reservoirs were characterized as eutrophic, with high Ptotal [17,32,33,34] and Chl a concentrations [33,35]. Recently, Pinto et al. [36] also described high Chl a concentration in Aguieira reservoir. In the present study, the authors observed a bloom of Cyanobacteria in Ag3 in the autumn of 2018. The study area presents constant exposure to fertilizers from agricultural runoff and from urban and livestock effluent discharges, promoting the accumulation of nutrients such as P [21,37]. Regarding O2 levels for all reservoirs, Bordalo et al. [17] and SNIRH: Sistema Nacional de Informação de Recursos Hídricos [38] reported occasionally low O2 levels, with 2 mg/L being the lowest concentration observed in the Miranda reservoir and 3 mg/L in Pocinho, Aguieira and Alqueva reservoirs, values in accordance with the results obtained in the present study.
The bacterioplankton showed sensitivity to the characteristics and changes that occurred in the studied reservoirs. Luo et al. [39] described that the bacterial community of reservoirs has a strong spatial and temporal dynamics but referred that this community is scarcely studied in these ecosystems. In addition, Tamaki et al. [40], in a study of bacterial diversity in freshwater sediment of a shallow eutrophic lake, also referred to the existence of spatial and temporal dynamics and a close relation of the bacterioplankton to the water quality and possible presence of pathogens species. In our study, some of this evidence could also be observed, such as bacterial temporal dynamics in Miranda, Pocinho and Aguieira, bacterial spatial dynamics in Aguieira, and the presence of Acinetobacter sp. St01, a species related to membrane bioreactors of wastewater treatment.
With the exception of Nitrospirae, the bacterial phyla identified in the studied reservoirs correspond to the most common phyla recovered from lake communities: Actinobacteria, Proteobacteria, Bacteroidetes and Cyanobacteria. Accordingly, the taxonomic taxa found have been previously described in freshwater environments [41]. The most abundant taxa were Proteobacteria (7 distinct taxa) followed by Actinobacteria (four distinct taxa), three different Bacteroidetes, two Cyanobacteria and one Nitrospirae.
The phylum Actinobacteria is known to constitute 10% to 60% of the bacterial community in freshwater habitats [42,43,44,45], with acI clade being the most abundant microbes in freshwater systems [41,46]. These bacteria are ubiquitous in these environments and are able to live in different ranges of pH, oxygen and salinity [47]. In accordance with the literature, we retrieved genetic material of acI clade (Candidatus Nanopelagicus limnes isolate MMS-21-122, Actinobacteria bacterium IMCC19121, Candidatus Planktophila vernalis isolate MMS-IIA-15) from all the reservoirs and seasons, reinforcing the expressive presence of this clade in different ecosystems. acI clade has been described as to suffer small changes with seasons, being the most constant freshwater bacteria [41]. This ubiquity can be explained by alternative energy metabolisms through rhodopsins, small cell size, cell wall composition and/or UV stress resistance. Genetic material of actinobacterial strains was found in all reservoirs. However, Actinobacteria bacterium IMCC19121 and Actinobacterium SCGC AAA043-I11 were observed only in autumn samplings, with the exception of M_Spr20. Previous studies already described that pH and carbon sources could explain fluctuations in Actinobacteria freshwater populations [41]. As physical and chemical parameters of the studied reservoirs suffer slight changes through the seasons and locations, Actinobacteria communities are probably not affected by those.
Regarding classes within the Proteobacteria observed in these reservoirs, Betaproteobacteria prevailed, followed by Alphaproteobacteria and Gamaproteobacteria, as already described in other studies [44,48,49]. Betaproteobacteria is the most studied bacterial class in freshwater lakes, and it is thought to be selected by depth, pH, carbon availability and seasons [41]. In this study, it was not possible to establish any correlation between physical and chemical factors and the identified betaproteobacteria. Contrary to Actinobacteria or Proteobacteria, Bacteroidetes were present only in some samples (e.g., M_Aut18, Ag1 in almost all samples and Al1_Spr19), but no seasonal or biographic pattern could be established.
The Alphaproteobacteria Candidatus Fonsibacter ubiquis strain LSUCC0530 was present in all reservoirs in almost all samples. This bacterium belongs to the LD12 subclade within the order Pelagibacterales (SAR11), which has evolved as a unique freshwater lineage and is the most dominant freshwater bacterioplankton [50].
The bacterioplankton community of Miranda and Pocinho reservoirs showed temporal and spatial dynamics, but no significant correlation with the physical and chemical parameters analysed could be established. Furthermore, in the spring samples, where no spatial pattern existed, the sites grouped according to water ecological quality (Miranda and Pocinho in Spr20 as moderate and in Spr19 as good quality), which indicates the possibility of characterizing these waterbodies. In spring samples, we observed the presence of Acinetobacter sp. St01, a species related to membrane bioreactors of wastewater treatment [51], which may be the result of non-treated discharges by wastewater treatment plants (WWTP), already described for Miranda reservoir and confirmed by the large amounts of faecal coliforms (10,000 CFU/100 mL) and total coliforms (30,000 CFU/100 mL) verified in 2014 [38]. Furthermore, according to the SNIRH: Sistema Nacional de Informação de Recursos Hídricos [38], the amount of Escherichia coli showed high values such as 500 MPN/100 mL in 2019 and 1000 MPN/100 mL in 2020, possibly indicating that this water body is polluted, with low quality. This water degradation can be problematic since this water body is also used for human consumption [52]. In the case of the Pocinho reservoir, according to the SNIRH: Sistema Nacional de Informação de Recursos Hídricos monitoring stations in this area [38], the quantification of faecal and total coliforms was always found in low quantities (<400 CFU/100 mL and <1000 CFU/100 mL, respectively, in 2014) in the last 20 years; thus apparently, the presence of Acinetobacter sp. St01 is not due to the same disturbances as observed in Miranda. However, the existence of pollution sources from wastewater is recognized [53]. Furthermore, Acinetobacter sp., is known for its function as degrader of polycyclic aromatic hydrocarbons (PAHs) [54], and following the WFD guidelines regarding these type of compounds, the PAHs analysed were not detected in the present work [18,36]. Curvibacter sp. W2.09-301r was observed in Miranda and Pocinho reservoirs in Aut18 and has the function of trichloroethylene degradation [55], a compound not included in the WFD analysis. However, it is impossible to chemically analyse all compounds that may be present in the surface waters. Conversely, Huang et al. [54] observed that this species, when in the presence of petroleum-hydrocarbon, tends to disappear or not be detected in DGGE. This decrease of its abundance in the spring samples and autumn of 2019 may reflect the existence of disturbances, which may indicate stress conditions; yet, these disturbances have not been mentioned for both reservoirs. Additionally, both reservoirs are part of several cruise routes, where in each one, there is a boat dock [56].
Regarding the Aguieira reservoir, the temporal dynamic may be due to the positive correlation observed with Temp, since warmer periods are associated with greater abundance, diversity and evenness of bacterial species [57]. Gurung et al. [57] in Lake Biwa, in Japan, attributed the positive correlation with temperature to the fact that high nutrients concentrations are not a limiting factor. This observation is consistent with our results since Aguieira reservoir presented high nutrients concentration. Conversely, researchers suggest that an increase in bacterial abundance is associated with an increase in the trophic status of the waters, namely with Chl a [58]. However, in the present work, no correlation was observed with this element, although it tends to present higher values in spring, when temperatures also tend to be higher. Similar to Miranda and Pocinho, Acinetobacter sp. St01 was also observed at all spring samples. According to the SNIRH: Sistema Nacional de Informação de Recursos Hídricos [38], there is only information on faecal and total coliforms for Ag1 and Ag4. In Ag1 the values observed are always low, whereas in Ag4, these values reach 400 CFU/100 mL for faecal coliforms and 600 CFU/100 mL for total coliforms in 2013, reflecting the low quality of this water body and the possible contamination by wastewater. According to Agência Portuguesa do Ambiente [59], this reservoir presents significant pressures, namely agricultural, livestock, urban and industrial, that can justify the presence of Curvibacter sp. W2.09-301r. Nitrospira japonica is not usually described as one of the major phyla in freshwater ecosystems; however, it is known to play an important role in nitrification and can colonize a wide range of habitats and to sustain shifts in environmental conditions such as changing in oxygen concentrations [60]. However, we do not observe any relation with NO3 (Table 3). Nevertheless, the Nitrospira japonica strain NJ11 [61] was first described in activated sludges of a wastewater treatment plant, and this reservoir presents urban pressure which can justify the presence of this organism. Cyanobacteria is also one of the most described bacterial phyla in freshwater ecosystems. These bacteria are well known for their ability to perform oxygenic photosynthesis, relying only on Chl a [62]. We were able to identify Microcystis aeruginosa, but only in Ag3_Aut18, although this organism has already been reported for the entire reservoir [34]. Ag3 is one of the sampling sites with a higher value of Chl a (Table 1), indicating a possible Cyanobacteria bloom. Pinto et al. [36] had already reported, for this site, the existence of a bloom of cyanobacteria, namely of Microcystis sp. The presence of this organism and the existence of blooms reflect the poor quality of the water body, namely the enrichment of nutrients [63]. Furthermore, this microorganism is known for the production of toxic toxins that negatively affect the entire dynamics of the ecosystem [64]. Therefore, the fact that this reservoir is used to capture water for consumption and for recreational activities [59] is worrying as there are species that are dangerous to humans health.
Gannon et al. [65] observed that the high-size, low-rate of velocity as well as the high residence times of a body water promote bacterial die-off as well as bacterial sedimentation. These characteristics can be framed in the Alqueva reservoir, where we can observe the same results regarding the bacterioplankton community. He et al. [66] reported that high levels of conductivity promote high salt concentrations, which can inhibit bacterial growth or damage microorganisms, which is also consistent with our results. The bacterial community in Alqueva tends to be different from the other reservoirs. Bacteroidetes bacterium SCGC AAA023-M10, Bacteroidetes bacterium zo35, Vogesella perlucida strain WS10, Vogesella sp. strain UTW7-1 and Arenimonas maotaiensis strain YT8 were observed only and occasionally in this reservoir, and little is known about their functions in the ecosystem.

5. Conclusions

In conclusion, from a general point of view, the bacterioplankton community analysed in the present study showed local sensitivity. The presence or absence as well as the existence of seasonality of some organisms may indicate different degrees of water quality as well as punctual and local disturbances. However, this study represents only an initial and general approach to the biological parameter analysed. Using the DGGE in the approach to assess reservoir water bodies allows us to make an initial screening of the reservoir status and find sites with potential disturbance. Furthermore, it is a standardized methodology, of quick and easy performance, and is economical, which would allow the execution of this approach in a larger number of water samples and their comparison. An important aspect missing from this study would be information about the total structure of the bacterial community in each site. Future work with different approaches (e.g., number of sites, number of samples, different laboratorial methodologies) as well as high-throughput analyses are important to determine how this microbial community is present and active in these ecosystems. Furthermore, this work showed us the existence of many organisms that are not yet properly characterized, which makes it difficult to correlate with the reservoirs environmental characteristics and water quality.

Supplementary Materials

The following are available online at https://www.mdpi.com/article/10.3390/w13202836/s1, Table S1: Presence or absence for all phylogenetically identified species for all sampling sites and periods.

Author Contributions

Conceptualization, methodology and formal analysis, I.P., R.C., C.R.S., O.M.L. and S.C.A.; writing—original draft preparation, I.P. and R.C.; writing—review and editing, I.P., R.C., C.R.S., O.M.L. and S.C.A.; resources: O.M.L. and S.C.A.; project administration: S.C.A. All authors have read and agreed to the published version of the manuscript.

Funding

This research was funded by National Funds (through the FCT—Foundation for Science and Technology) and by the European Regional Development Fund (through COMPETE2020 and PT2020) through the research project ReDEFine (POCI-01-0145-FEDER-029368) and the strategic program UIDB/04423/2020 and UIDP/04423/2020. Sara Antunes was hired through the Regulamento do Emprego Científico e Tecnológico—RJEC from the Portuguese Foundation for Science and Technology (FCT) program (CEECIND/01756/2017).

Institutional Review Board Statement

Not applicable.

Informed Consent Statement

Not applicable.

Data Availability Statement

Not applicable.

Conflicts of Interest

The authors declare no conflict of interest.

References

  1. Vasconcelos, V. Freshwater cyanobacteria and their toxins in Portugal. In Cyanotoxins–Occurrence, Causes, Consequences; Chorus, I., Ed.; Springer: Berlin/Heidelberg, Germany, 2001; pp. 62–67. [Google Scholar]
  2. Liu, M.; Liu, L.; Chen, H.; Yu, Z.; Yang, J.R.; Xue, Y.; Huang, B.; Yang, J. Community Dynamics of Free-Living and Particle-Attached Bacteria following a Reservoir Microcystis Bloom. Sci. Total Environ. 2019, 660, 501–511. [Google Scholar] [CrossRef] [PubMed]
  3. Farley, M. Encyclopedia of Lakes and Reservoirs; Bengtsson, L., Herschy, R.W., Fairbridge, R.W., Eds.; Encyclopedia of Earth Sciences Series; Springer: Dordrecht, The Netherlands, 2012; pp. 258–270. ISBN 978-1-4020-5616-1. [Google Scholar]
  4. European Community Commission (ECC). Commission Directive 2000/60/EC of the European Parliament and the Council establishing the framework for community action in the field of water policy. Off. J. Eur. Union 2000, 327, 1–73. [Google Scholar]
  5. Llirós, M.; Inceoğlu, Ö.; García-Armisen, T.; Anzil, A.; Leporcq, B.; Pigneur, L.-M.; Viroux, L.; Darchambeau, F.; Descy, J.-P.; Servais, P. Bacterial Community Composition in Three Freshwater Reservoirs of Different Alkalinity and Trophic Status. PLoS ONE 2014, 9, e116145. [Google Scholar] [CrossRef] [PubMed]
  6. Šimek, K.; Horňák, K.; Jezbera, J.; Nedoma, J.; Znachor, P.; Hejzlar, J.; Sed’a, J. Spatio-Temporal Patterns of Bacterioplankton Production and Community Composition Related to Phytoplankton Composition and Protistan Bacterivory in a Dam Reservoir. Aquat. Microb. Ecol. 2008, 51, 249–262. [Google Scholar] [CrossRef] [Green Version]
  7. Berdjeb, L.; Ghiglione, J.F.; Domaizon, I.; Jacquet, S. A 2-Year Assessment of the Main Environmental Factors Driving the Free-Living Bacterial Community Structure in Lake Bourget (France). Microb. Ecol. 2011, 61, 941–954. [Google Scholar] [CrossRef]
  8. Cole, J.J.; Findlay, S.; Pace, M.L. Bacterial Production in Fresh and Saltwater Ecosystems: A Cross-System Overview. Mar. Ecol. Prog. Ser. 1988, 43, 1–10. [Google Scholar] [CrossRef]
  9. Lindström, E.S. Bacterioplankton Community Composition in Five Lakes Differing in Trophic Status and Humic Content. Microb. Ecol. 2000, 40, 104–113. [Google Scholar] [CrossRef]
  10. Höfle, M.G.; Haas, H.; Dominik, K. Seasonal Dynamics of Bacterioplankton Community Structure in a Eutrophic Lake as Determined by 5S RRNA Analysis. Appl. Environ. Microbiol. 1999, 65, 3164–3174. [Google Scholar] [CrossRef] [Green Version]
  11. Lindström, E.S.; Kamst-Van Agterveld, M.P.; Zwart, G. Distribution of Typical Freshwater Bacterial Groups Is Associated with PH, Temperature, and Lake Water Retention Time. Appl. Environ. Microbiol. 2005, 71, 8201–8206. [Google Scholar] [CrossRef] [Green Version]
  12. Donner, G.; Schwarz, K.; Hoppe, H.G.; Muyzer, G. Profiling the Succession of Bacterial Populations in Pelagic Chemoclines. Arch. Hydrobiol. Spec. Issues Advanc. Limnol. 1996, 48, 7–14. [Google Scholar]
  13. Van der Gucht, K.; Sabbe, K.; De Meester, L.; Vloemans, N.; Zwart, G.; Gillis, M.; Vyverman, W. Contrasting Bacterioplankton Community Composition and Seasonal Dynamics in Two Neighbouring Hypertrophic Freshwater Lakes. Environ. Microbiol. 2001, 3, 680–690. [Google Scholar] [CrossRef]
  14. Yannarell, A.C.; Kent, A.D.; Lauster, G.H.; Kratz, T.K.; Triplett, E.W. Temporal Patterns in Bacterial Communities in Three Temperate Lakes of Different Trophic Status. Microb. Ecol. 2003, 46, 391–405. [Google Scholar] [CrossRef]
  15. Šimek, K.; Pernthaler, J.; Weinbauer, M.G.; Hornák, K.; Dolan, J.R.; Nedoma, J.; Mašín, M.; Amann, R. Changes in Bacterial Community Composition and Dynamics and Viral Mortality Rates Associated with Enhanced Flagellate Grazing in a Mesoeutrophic Reservoir. Appl. Environ. Microbiol. 2001, 67, 2723–2733. [Google Scholar] [CrossRef] [Green Version]
  16. de Figueiredo, D.R.; Pereira, M.J.; Moura, A.; Silva, L.; Bárrios, S.; Fonseca, F.; Henriques, I.; Correia, A. Bacterial Community Composition over a Dry Winter in Meso- and Eutrophic Portuguese Water Bodies. FEMS Microb. Ecol. 2007, 59, 638–650. [Google Scholar] [CrossRef] [PubMed] [Green Version]
  17. Bordalo, A.A.; Teixeira, R.; Wiebe, W.J. A Water Quality Index Applied to an International Shared River Basin: The Case of the Douro River. Environ. Manag. 2006, 38, 910–920. [Google Scholar] [CrossRef]
  18. Rodrigues, S.; Pinto, I.; Martins, F.; Formigo, N.; Antunes, S.C. Can Biochemical Endpoints Improve the Sensitivity of the Biomonitoring Strategy Using Bioassays with Standard Species, for Water Quality Evaluation? Ecotoxicol. Environ. Saf. 2021, 215, 112151. [Google Scholar] [CrossRef]
  19. Resolução do Conselho de Ministros n.o 186. Plano de Ordenamento da Albufeira da Aguieira; 1.a Série-N.o 246; Diário Da República: Lisbon, Portugal, 2007. [Google Scholar]
  20. Pádua, J.; Bernardo, J.M.; Alves, M.H. Exercício de Intercalibração Em Massas de Água Fortemente Modificadas–Albufeiras, No Âmbito Da Directiva Quadro Da Água. In Proceedings of the 9th Congresso da Água, Cascais, Portugal, 2–4 April 2005; pp. 1–14. [Google Scholar]
  21. Pérez, J.R.; Loureiro, S.; Menezes, S.; Palma, P.; Fernandes, R.M.; Barbosa, I.R.; Soares, A.M.V.M. Assessment of Water Quality in the Alqueva Reservoir (Portugal) Using Bioassays. Environ. Sci. Pollut. Res. 2010, 17, 688–702. [Google Scholar] [CrossRef] [PubMed]
  22. Empresa de Desenvolvimento e Infra-estruturas do Alqueva (EDIA) Massas de Água de Alqueva. 2017. Available online: https://www.edia.pt/wp-content/uploads/2019/05/PublicacaoMassasAgua_07032018.pdf (accessed on 15 May 2020).
  23. Presidência do Conselho de Ministros. Resolução Do Conselho de Ministros n.o 94/2006: Regulamento Do Plano de Ordenamento Das Albufeiras Do Alqueva e Pedrógão; Presidência do Conselho de Ministros: Lisboa, Portugal, 2006. [Google Scholar]
  24. NF EN ISO 10304-1. Water Quality—Determination of Dissolved Anions by Liquid Chromatography of Ions—Part 1: Determination of Bromide, Chloride, Fluoride, Nitrate, Nitrite, Phosphate and Sulfate; ISO: Geneva, Switzerland, 2007. [Google Scholar]
  25. Brower, J.E.; Zar, J.H.; von Ende, C.N. Field and Laboratory Methods for General Ecology, 4th ed.; WCB McGraw-Hill: Boston, MA, USA, 1997. [Google Scholar]
  26. APHA. Standard Methods for the Examination of Water and Wastewater, 17th ed.; APHA: Washington, DC, USA, 1989; ISBN 978-0875532356. [Google Scholar]
  27. NF EN ISO 25663. Water Quality—Determination of Kjeldahl Nitrogen—Method after Mineralization with Selenium; ISO: Geneva, Switzerland, 1984. [Google Scholar]
  28. NF EN ISO 17294-2. Water Quality—Application of Inductively Coupled Plasma Mass Spectrometry (ICP-MS)—Part 2: Determination of Selected Elements Including Uranium Isotopes; ISO: Geneva, Switzerland, 2016; p. 31. [Google Scholar]
  29. NF EN ISO 15923-1. Water Quality—Determination of Selected Parameters by Discrete Analysis Systems—Part 1: Ammonium, Nitrate, Nitrite, Chloride, Orthophosphate, Sulfate and Silicate with Photometric Detection; ISO: Geneva, Switzerland, 2013; p. 25. [Google Scholar]
  30. Agência Portuguesa do Ambiente. Plano de Gestão de Região Hidrográfica—Parte 2—Caracterização e Diagnóstico—Anexos—Região Hidrográfica Do Vouga, Mondego E Lis (Rh4); Agência Portuguesa do Ambiente: Lisboa, Portugal, 2016. [Google Scholar]
  31. Kumar, S.; Stecher, G.; Tamura, K. MEGA7: Molecular Evolutionary Genetics Analysis Version 7.0 for Bigger Datasets. Mol. Biol. Evol. 2016, 33, 1870–1874. [Google Scholar] [CrossRef] [PubMed] [Green Version]
  32. Cabecinha, E.; Cortes, R.; Alexandre Cabral, J.; Ferreira, T.; Lourenço, M.; Pardal, M. Multi-Scale Approach Using Phytoplankton as a First Step towards the Definition of the Ecological Status of Reservoirs. Ecol. Indic. 2009, 9, 240–255. [Google Scholar] [CrossRef]
  33. Instituto da Água. Modelação Matemática Da Qualidade Da Água Em Albufeiras Com Planos de Ordenamento-Lll-Albufeira Da Aguieira; Ministério da Agricultura, Mar, Ambiente e Ordenamento do Território; Instituto da Água, I.P.: Lisboa, Portugal, 2011. [Google Scholar]
  34. Vasconcelos, V.; Morais, J.; Vale, M. Microcystins and Cyanobacteria Trends in a 14 Year Monitoring of a Temperate Eutrophic Reservoir (Aguieira, Portugal). J. Environ. Monit. 2011, 13, 668–672. [Google Scholar] [CrossRef]
  35. Silva, H.; Morais, M.; Rosado, J.; Serafim, A.; Pedro, A.; Sarmento, P.; Fialho, A. South Portugal Reservoirs–Status and Major Concerns. In Proceedings of the 12th International Specialized Conference on Watershed and River Basin Management, Recife, Brazil, 14–16 September 2011. [Google Scholar]
  36. Pinto, I.; Rodrigues, S.; Lage, O.M.; Antunes, S.C. Assessment of Water Quality in Aguieira Reservoir: Ecotoxicological Tools in Addition to the Water Framework Directive. Ecotoxicol Environ. Saf. 2021, 208, 111583. [Google Scholar] [CrossRef]
  37. Agência Portuguesa do Ambiente. Plano de Ordenamento Da Albufeira Da Aguieira; Agência Portuguesa do Ambiente: Lisboa, Portugal, 2005. [Google Scholar]
  38. SNIRH. Sistema Nacional de Informação de Recursos Hídricos SNIRH: Sistema Nacional de Informação de Recursos Hídricos. Available online: https://snirh.apambiente.pt/index.php?idMain= (accessed on 24 September 2019).
  39. Luo, X.; Xiang, X.; Huang, G.; Song, X.; Wang, P.; Fu, K. Bacterial Abundance and Physicochemical Characteristics of Water and Sediment Associated with Hydroelectric Dam on the Lancang River China. Int. J. Environ. Res. Public Health 2019, 16, 2031. [Google Scholar] [CrossRef] [Green Version]
  40. Tamaki, H.; Sekiguchi, Y.; Hanada, S.; Nakamura, K.; Nomura, N.; Matsumura, M.; Kamagata, Y. Comparative Analysis of Bacterial Diversity in Freshwater Sediment of a Shallow Eutrophic Lake by Molecular and Improved Cultivation-Based Techniques. Appl. Environ. Microbiol. 2005, 71, 2162–2169. [Google Scholar] [CrossRef] [PubMed] [Green Version]
  41. Newton, R.J.; Jones, S.E.; Eiler, A.; McMahon, K.D.; Bertilsson, S. A Guide to the Natural History of Freshwater Lake Bacteria. Microbiol. Mol. Biol. Rev. 2011, 75, 14–49. [Google Scholar] [CrossRef] [PubMed] [Green Version]
  42. Eiler, A.; Bertilsson, S. Composition of Freshwater Bacterial Communities Associated with Cyanobacterial Blooms in Four Swedish Lakes. Environ. Microbiol. 2004, 6, 1228–1243. [Google Scholar] [CrossRef] [PubMed]
  43. Wu, Q.L.; Hahn, M.W. High Predictability of the Seasonal Dynamics of a Species-like Polynucleobacter Population in a Freshwater Lake. Environ. Microbiol. 2006, 8, 1660–1666. [Google Scholar] [CrossRef] [PubMed]
  44. Lymperopoulou, D.S.; Kormas, K.A.; Karagouni, A.D. Variability of Prokaryotic Community Structure in a Drinking Water Reservoir (Marathonas, Greece). Microbes Environ. 2011, 27, 1–8. [Google Scholar] [CrossRef] [Green Version]
  45. Kang, I.; Kim, S.; Islam, M.R.; Cho, J.C. The First Complete Genome Sequences of the AcI Lineage, the Most Abundant Freshwater Actinobacteria, Obtained by Whole-Genome-Amplification of Dilution-to-Extinction Cultures. Sci. Rep. 2017, 7, 42252. [Google Scholar] [CrossRef] [Green Version]
  46. Neuenschwander, S.M.; Ghai, R.; Pernthaler, J.; Salcher, M.M. Microdiversification in Genome-Streamlined Ubiquitous Freshwater Actinobacteria. ISME J. 2018, 12, 185–198. [Google Scholar] [CrossRef] [Green Version]
  47. Newton, R.J.; Jones, S.E.; Helmus, M.R.; McMahon, K.D. Phylogenetic Ecology of the Freshwater Actinobacteria AcI Lineage. Appl. Environ. Microbiol. 2007, 73, 7169–7176. [Google Scholar] [CrossRef] [Green Version]
  48. Burkert, U.; Warnecke, F.; Babenzien, D.; Zwirnmann, E.; Pernthaler, J. Members of a Readily Enriched β-Proteobacterial Clade Are Common in Surface Waters of a Humic Lake. Appl. Environ. Microbiol. 2003, 69, 6550–6559. [Google Scholar] [CrossRef] [PubMed] [Green Version]
  49. van der Gucht, K.; Vandekerckhove, T.; Vloemans, N.; Cousin, S.; Muylaert, K.; Sabbe, K.; Gillis, M.; Declerk, S.; de Meester, L.; Vyverman, W. Characterization of Bacterial Communities in Four Freshwater Lakes Differing in Nutrient Load and Food Web Structure. FEMS Microbiol. Ecol. 2005, 53, 205–220. [Google Scholar] [CrossRef] [PubMed]
  50. Henson, M.W.; Lanclos, V.C.; Brant, F.C.; Thrash, J. Cameron Cultivation and Genomics of the First Freshwater SAR11 (LD12) Isolate. ISME J. 2018, 12, 1846–1860. [Google Scholar] [CrossRef] [PubMed] [Green Version]
  51. Tabraiz, S.; Shamurad, B.; Petropoulos, E.; Quintela-Baluja, M.; Charlton, A.; Dolfing, J.; Sallis, P.J. Mitigation of Membrane Biofouling in Membrane Bioreactor Treating Sewage by Novel Quorum Quenching Strain of Acinetobacter Originating from a Full-Scale Membrane Bioreactor. Bioresour. Technol. 2021, 334, 125242. [Google Scholar] [CrossRef] [PubMed]
  52. Agência Portuguesa do Ambiente. Plano de Gestão de Região Hidrográfica, Parte 5-Objetivos, Anexo II.1, Região Hidrográfica Do Douro (RH3); Agência Portuguesa do Ambiente: Lisboa, Portugal, 2016. [Google Scholar]
  53. Agência Portuguesa do Ambiente. Plano de Gestão de Região Hidrográfica, Parte 5-Objetivos, Anexo II.2, Região Hidrográfica Do Douro (RH3); Agência Portuguesa do Ambiente: Lisboa, Portugal, 2016. [Google Scholar]
  54. Huang, W.H.; Asce, S.M.; Kao, C.M.; Asce, F. Bioremediation of Petroleum-Hydrocarbon Contaminated Groundwater under Sulfate-Reducing Conditions: Effectiveness and Mechanism Study. J. Environ. Eng. 2015. [Google Scholar] [CrossRef]
  55. Kuo, Y.C.; Liang, S.H.; Asce, M.; Wang, S.Y.; Chen, S.H.; Kao, C.M.; Asce, F. Application of Emulsified Substrate Biobarrier to Remediate TCE-Contaminated Groundwater: Pilot-Scale Study. J. Hazard. Toxic Radioact. Waste 2014, 18. [Google Scholar] [CrossRef]
  56. Ministério do Equipamento, do Planeamento e da Administração do Território. Decreto-Lei No 344-A/98—Regulamento Da via Navegável Do Douro; Diário da República: Lisboa, Portugal, 1998; pp. 5964-(2)–5964-(32). [Google Scholar]
  57. Gurung, T.B.; Urabe, J. Temporal and Vertical Difference in Factors Limiting Growth Rate of Heterotrophic Bacteria in Lake Biwa. Microb. Ecol. 1999. [Google Scholar] [CrossRef]
  58. Bird, D.F.; Kalff, J. Empirical Relationships between Bacterial Abundance and Chlorophyll Concentration in Fresh and Marine Waters. Can. J. Fish. Aquat. Sci. 1984, 41, 1015–1023. [Google Scholar] [CrossRef]
  59. Agência Portuguesa do Ambiente. Plano de Gestão de Região Hidrográfica, Parte 5-Objetivos, Anexo II.1, Região Hidrográfica Do Vouga, Mongedo e Lis (RH4); Agência Portuguesa do Ambiente: Lisboa, Portugal, 2016. [Google Scholar]
  60. Daims, H.; Wagner, M. Nitrospira. Trends Microbiol. 2018, 26, 462–463. [Google Scholar] [CrossRef]
  61. Ushiki, N.; Fujitani, H.; Shimada, Y.; Morohoshi, T.; Sekiguchi, Y.; Tsuneda, S. Genomic Analysis of Two Phylogenetically Distinct Nitrospira Species Reveals Their Genomic Plasticity and Functional Diversity. Front. Microbiol. 2018, 8, 2637. [Google Scholar] [CrossRef] [Green Version]
  62. Madigan, M.T.; Martinko, J.M.; Dunlap, P.V.; Clark, D.P. Brock Biology of Microorganisms, 12th ed.; Benjamin Cummings: San Francisco, CA, USA, 2008; ISBN 978-0132324601. [Google Scholar]
  63. Graça, M.A.; Pardal, M.Â.; Marques, J.C.; Vasconcelos, V. Toxic cyanobacteria in the Mondego basin reservoirs: An overiew. In Aquatic ecology of the Mondego River Basin Global Importance of Local Experience; Imprensa da Universidade de Coimbra: Coimbra, Portugal, 2002; pp. 105–114. [Google Scholar]
  64. Sotero-Santos, R.B.; Silva, C.R.D.S.E.; Verani, N.F.; Nonaka, K.O.; Rocha, O. Toxicity of a Cyanobacteria Bloom in Barra Bonita Reservoir (Middle Tietê River, São Paulo, Brazil). Ecotoxicol. Environ. Saf. 2006, 64, 163–170. [Google Scholar] [CrossRef] [PubMed]
  65. Gannon, V.P.J.; Duke, G.D.; Thomas, J.E.; VanLeeuwen, J.; Byrne, J.; Johnson, D.; Kienzle, S.W.; Little, J.; Graham, T.; Selinger, B. Use of In-Stream Reservoirs to Reduce Bacterial Contamination of Rural Watersheds. Sci. Total Environ. 2005, 348, 19–31. [Google Scholar] [CrossRef] [PubMed]
  66. He, L.M.; Lu, J.; Shi, W. Variability of Fecal Indicator Bacteria in Flowing and Ponded Waters in Southern California: Implications for Bacterial TMDL Development and Implementation. Water Res. 2007, 41, 3132–3140. [Google Scholar] [CrossRef] [PubMed]
Figure 1. Location of the sampling sites in Miranda (M—41°29′24.802″ N, 6°15′55.925′′ W), Pocinho (P—41°08′10.884″ N, 7°06′39.074″ W), Aguieira (Ag1—40°20′27.942″ N, 8°11′38.616″ W, Ag2—40°22′01.884″ N, 8°10′28.283″ W, Ag3—40°24′03.488″ N, 8°07′01.150″ W and Ag4—40°22′22.256″ N, 8°03′19.055″ W) and Alqueva (Al1—38°12′07.957″ N, 7°29′19.717″ W, Al2—38°17′35.785″ N, 7°33′41.484″ W, Al3—38°25′58.085″ N, 7°21′03.721″ W Al4—38°32′49.092″ N, 7°18′13.988″ W and Al5—38°44′15.763″ N, 7°14′15.144″ W).
Water 13 02836 g001
Figure 2. (a) Complete linkage dendrogram and (b) PCR-DGGE fingerprints of the bacterioplankton found at each sampling site (Miranda—M; Pocinho—P) and sampling period (Aut18; Spr19; Aut19; Spr20).
Water 13 02836 g002
Figure 3. (a) Complete linkage dendrogram and (b) PCR-DGGE fingerprints of Aguieira (Ag) bacterioplankton found at each sampling site (Ag1, Ag2, Ag3, Ag4) and sampling period (Aut18; Spr19; Aut19; Spr20).
Water 13 02836 g003
Figure 4. (a) Complete linkage dendrogram and (b) PCR-DGGE fingerprints of Alqueva (Al) bacterioplankton found at each sampling site (Al1, Al2, Al3, Al4, Al5) and sampling period (Aut18; Spr19; Aut19; Spr20).
Water 13 02836 g004
Figure 5. Phylogenetic 16S rRNA gene tree generated by maximum-likelihood analysis based in general time reversible model and gamma distributed with invariant sites (G + I), indicating the relationship of the strains collected in the present study. Bar—0.02 substitutions per 100 nucleotides. Symbols annotated the reservoir and season where the strain was identified.
Water 13 02836 g005
Table 1. Results of physical, chemical and biological parameters: pH, conductivity (Cond), temperature (Temp), dissolved oxygen (O2), turbidity (Turb), total suspended solids (TSS), nitrates (NO3), total Kjeldahl nitrogen (Ntotal), total phosphorus (Ptotal), ammonium (NH4+) and chlorophyll a (Chl a). Sampling sites: Miranda—M, Pocinho—P, Aguieira—Ag1 to Ag4 and Alqueva—Al1 to Al5; sampling periods: autumn of 2018 (Aut18), spring of 2019 (Spr19), autumn of 2019 (Aut19) and spring of 2020 (Spr20). The bold values represent the values outside the environmental quality standards. * stands for physical and chemical EQS of north type. ** stands for physical and chemical EQS of south type; (1) [30].
pHCond
(μS/cm)
Temp (°C)O2 (mg/L)O2
(%)
Turb
(m−1)
TSS
(mg/L)
NO3 (mg/L)Ntotal (mg/L)Ptotal
(mg/L)
NH4+
(mg/L)
Chl a
(µg/L)
Environmental Quality Standards (EQS) (1)6–9 ≥560–120
(north *)
60–140
(south **)
≤25 ≤0.05
(north *)
≤0.07
(south **)
≤7.90
(north)
≤9.50
(south and main course)
Miranda *
(main course)
Aut18M8.14039.49.889.40.0258.086.9<0.60.10<0.054.65
Spr19M8.844715.614.1149.70.06912.756.4<0.50.03<0.0543.45
Aut19M7.934118.34.450.00.0168.822.3<0.50.010.062.34
Spr20M8.643819.011.0124.10.03815.657.4<0.50.13<0.0529.63
Pocinho *
(main course)
Aut18P7.933012.29.184.40.0148.423.9<0.60.08<0.050.45
Spr19P8.831616.514.0144.00.0168.75<0.5<0.50.03<0.0518.29
Aut19P8.030619.28.290.30.0007.382.3<0.50.04<0.056.74
Spr20P9.226822.815.9185.00.05410.123.50.70.090.0538.73
Aguieira
(north)
Aut18Ag18.48624.58.8106.30.0188.241.3<0.5<0.01<0.055.43
Ag27.69723.28.094.40.03610.09<0.5<0.50.03<0.0510.10
Ag38.114321.09.9112.00.115312.50<0.56.30.22<0.051082.23
Ag47.48724.57.489.00.03810.752.4<0.50.03<0.053.44
Spr19Ag19.28314.411.9119.40.07213.452.8<0.50.010.0726.32
Ag29.08915.012.4124.90.06919.053.3<0.50.01<0.0530.62
Ag38.311215.211.3112.10.08711.084.0<0.50.090.0610.17
Ag49.27815.512.2125.20.07417.501.20.70.020.0927.90
Aut19Ag16.89117.74.547.10.0237.821.5<0.5<0.01<0.051.61
Ag26.79217.95.355.90.03510.751.2<0.5<0.01<0.052.59
Ag36.710116.39.091.80.04612.582.32.20.09<0.0510.96
Ag46.88817.36.972.30.0165.551.00.6<0.01<0.055.30
Spr20Ag19.67421.912.9150.20.00815.192.7<0.50.020.0726.16
Ag29.78520.514.2160.10.00817.542.20.70.030.0742.08
Ag39.09020.712.4141.00.01516.623.3<0.50.080.1819.03
Ag49.47322.413.3156.50.00811.230.6<0.50.030.1031.75
Alqueva **
(main course)
Aut18Al17.950116.66.668.80.0024.284.5<1.00.06<0.050.98
Al28.049117.27.478.00.0003.830.5<1.00.03<0.053.60
Al38.151516.87.073.20.0234.72<0.5<1.10.070.171.81
Al48.054117.66.669.60.0143.610.8<1.00.080.202.18
Al58.469216.611.6120.90.04415.425.61.30.16<0.0531.26
Spr19Al18.551723.09.6114.40.0097.75<0.50.60.010.052.28
Al28.751523.79.4112.80.0127.42<0.50.6<0.01<0.050.94
Al38.853823.110.0118.20.0027.420.60.60.010.112.49
Al48.557023.812.7152.60.01612.750.70.70.010.087.83
Al59.171423.016.9199.50.07420.420.92.10.090.5856.65
Aut19Al18.252516.68.183.70.02310.02<0.5<0.50.07<0.053.53
Al28.352116.98.083.30.02124.72<0.50.50.05<0.058.28
Al38.354516.98.588.80.0187.88<0.50.70.040.192.75
Al48.357816.97.577.60.0218.780.51.00.050.282.81
Al58.476914.611.0108.60.09229.971.71.60.070.8140.10
Spr20Al18.854032.08.3114.00.0086.25<0.5<0.50.04<0.052.20
Al28.950633.38.5119.10.0037.08<0.5<0.50.05<0.052.28
Al39.055831.78.4115.20.0086.320.80.60.03<0.053.68
Al49.250932.010.0133.60.03810.02<0.50.80.06<0.0520.78
Al58.658832.07.097.00.08228.50<0.51.00.180.1645.42
Table 2. Results of total abundance (average number of operational taxonomic units—OTUs), diversity—Shannon-Wiener and richness—Margalef indexes of bacterioplankton communities in each water sample. Sampling sites: Miranda—M, Pocinho—P, Aguieira—Ag1 to Ag4 and Alqueva—Al1 to Al5; Sampling periods: autumn of 2018 (Aut18), spring of 2019 (Spr19), autumn of 2019 (Aut19) and spring of 2020 (Spr20).
Total Abundance (OTUs)Diversity Shannon-Wiener Index aRichness Margalef Index b
MirandaAut18M182.861.04
Spr19M152.670.87
Aut19M202.951.16
Spr20M172.810.99
PocinhoAut18P202.961.15
Spr19P142.570.80
Aut19P172.780.98
Spr20P202.971.16
AguieiraAut18Ag1273.261.56
Ag2273.261.56
Ag3142.590.81
Ag4162.740.92
Spr19Ag1132.550.75
Ag2142.610.81
Ag3112.360.63
Ag4172.750.99
Aut19Ag1172.810.99
Ag2162.760.93
Ag3162.760.92
Ag4172.800.98
Spr20Ag1162.720.92
Ag2172.790.99
Ag3192.901.09
Ag4192.901.09
AlquevaAut18Al1172.741.03
Al291.930.55
Al371.920.41
Al4112.360.66
Al551.370.28
Spr19Al191.930.55
Al2142.590.86
Al361.730.35
Al461.750.34
Al551.350.29
Aut19Al1112.260.67
Al2112.170.68
Al382.040.48
Al481.920.49
Al571.910.41
Spr20Al182.030.48
Al2112.150.68
Al351.570.29
Al451.550.28
Al541.310.21
a Shannon diversity index: H0 = _Σ(pi(lnpi)), where pi is the proportion of individuals belonging to the species present in the sample. b Margalef species richness: d = (S_1)/log(N), where S is the number of species, and N is the total number of individuals in the sample.
Table 3. Pearson’s correlation coefficient values among environmental parameters and bacterial communities in water from Aguieira and Alqueva reservoirs. Only statistically significant relations are presented (p value < 0.05).
AguieiraAlqueva
Total Abundance (OTUs)Diversity Shannon-Wiener IndexRichness Margalef IndexTotal Abundance (OTUs)Diversity Shannon-Wiener IndexRichness Margalef Index
pH---−0.49−0.51−0.48
Cond---−0.48−0.50−0.48
Temp0.660.660.65---
O2---−0.44−0.51−0.45
Turb−0.50−0.59−0.50−0.50−0.54−0.51
NO3−0.52−0.54−0.52---
Ntotal---−0.56−0.63−0.56
Ptotal----−0.46-
Chl a---−0.55−0.66−0.56
Publisher’s Note: MDPI stays neutral with regard to jurisdictional claims in published maps and institutional affiliations.

