
Impacts of Massive Sediment Input on the Channel Geometry Adjustment of Alluvial Rivers: Revisiting the North Fork Toutle River Case


Abstract
:1. Introduction
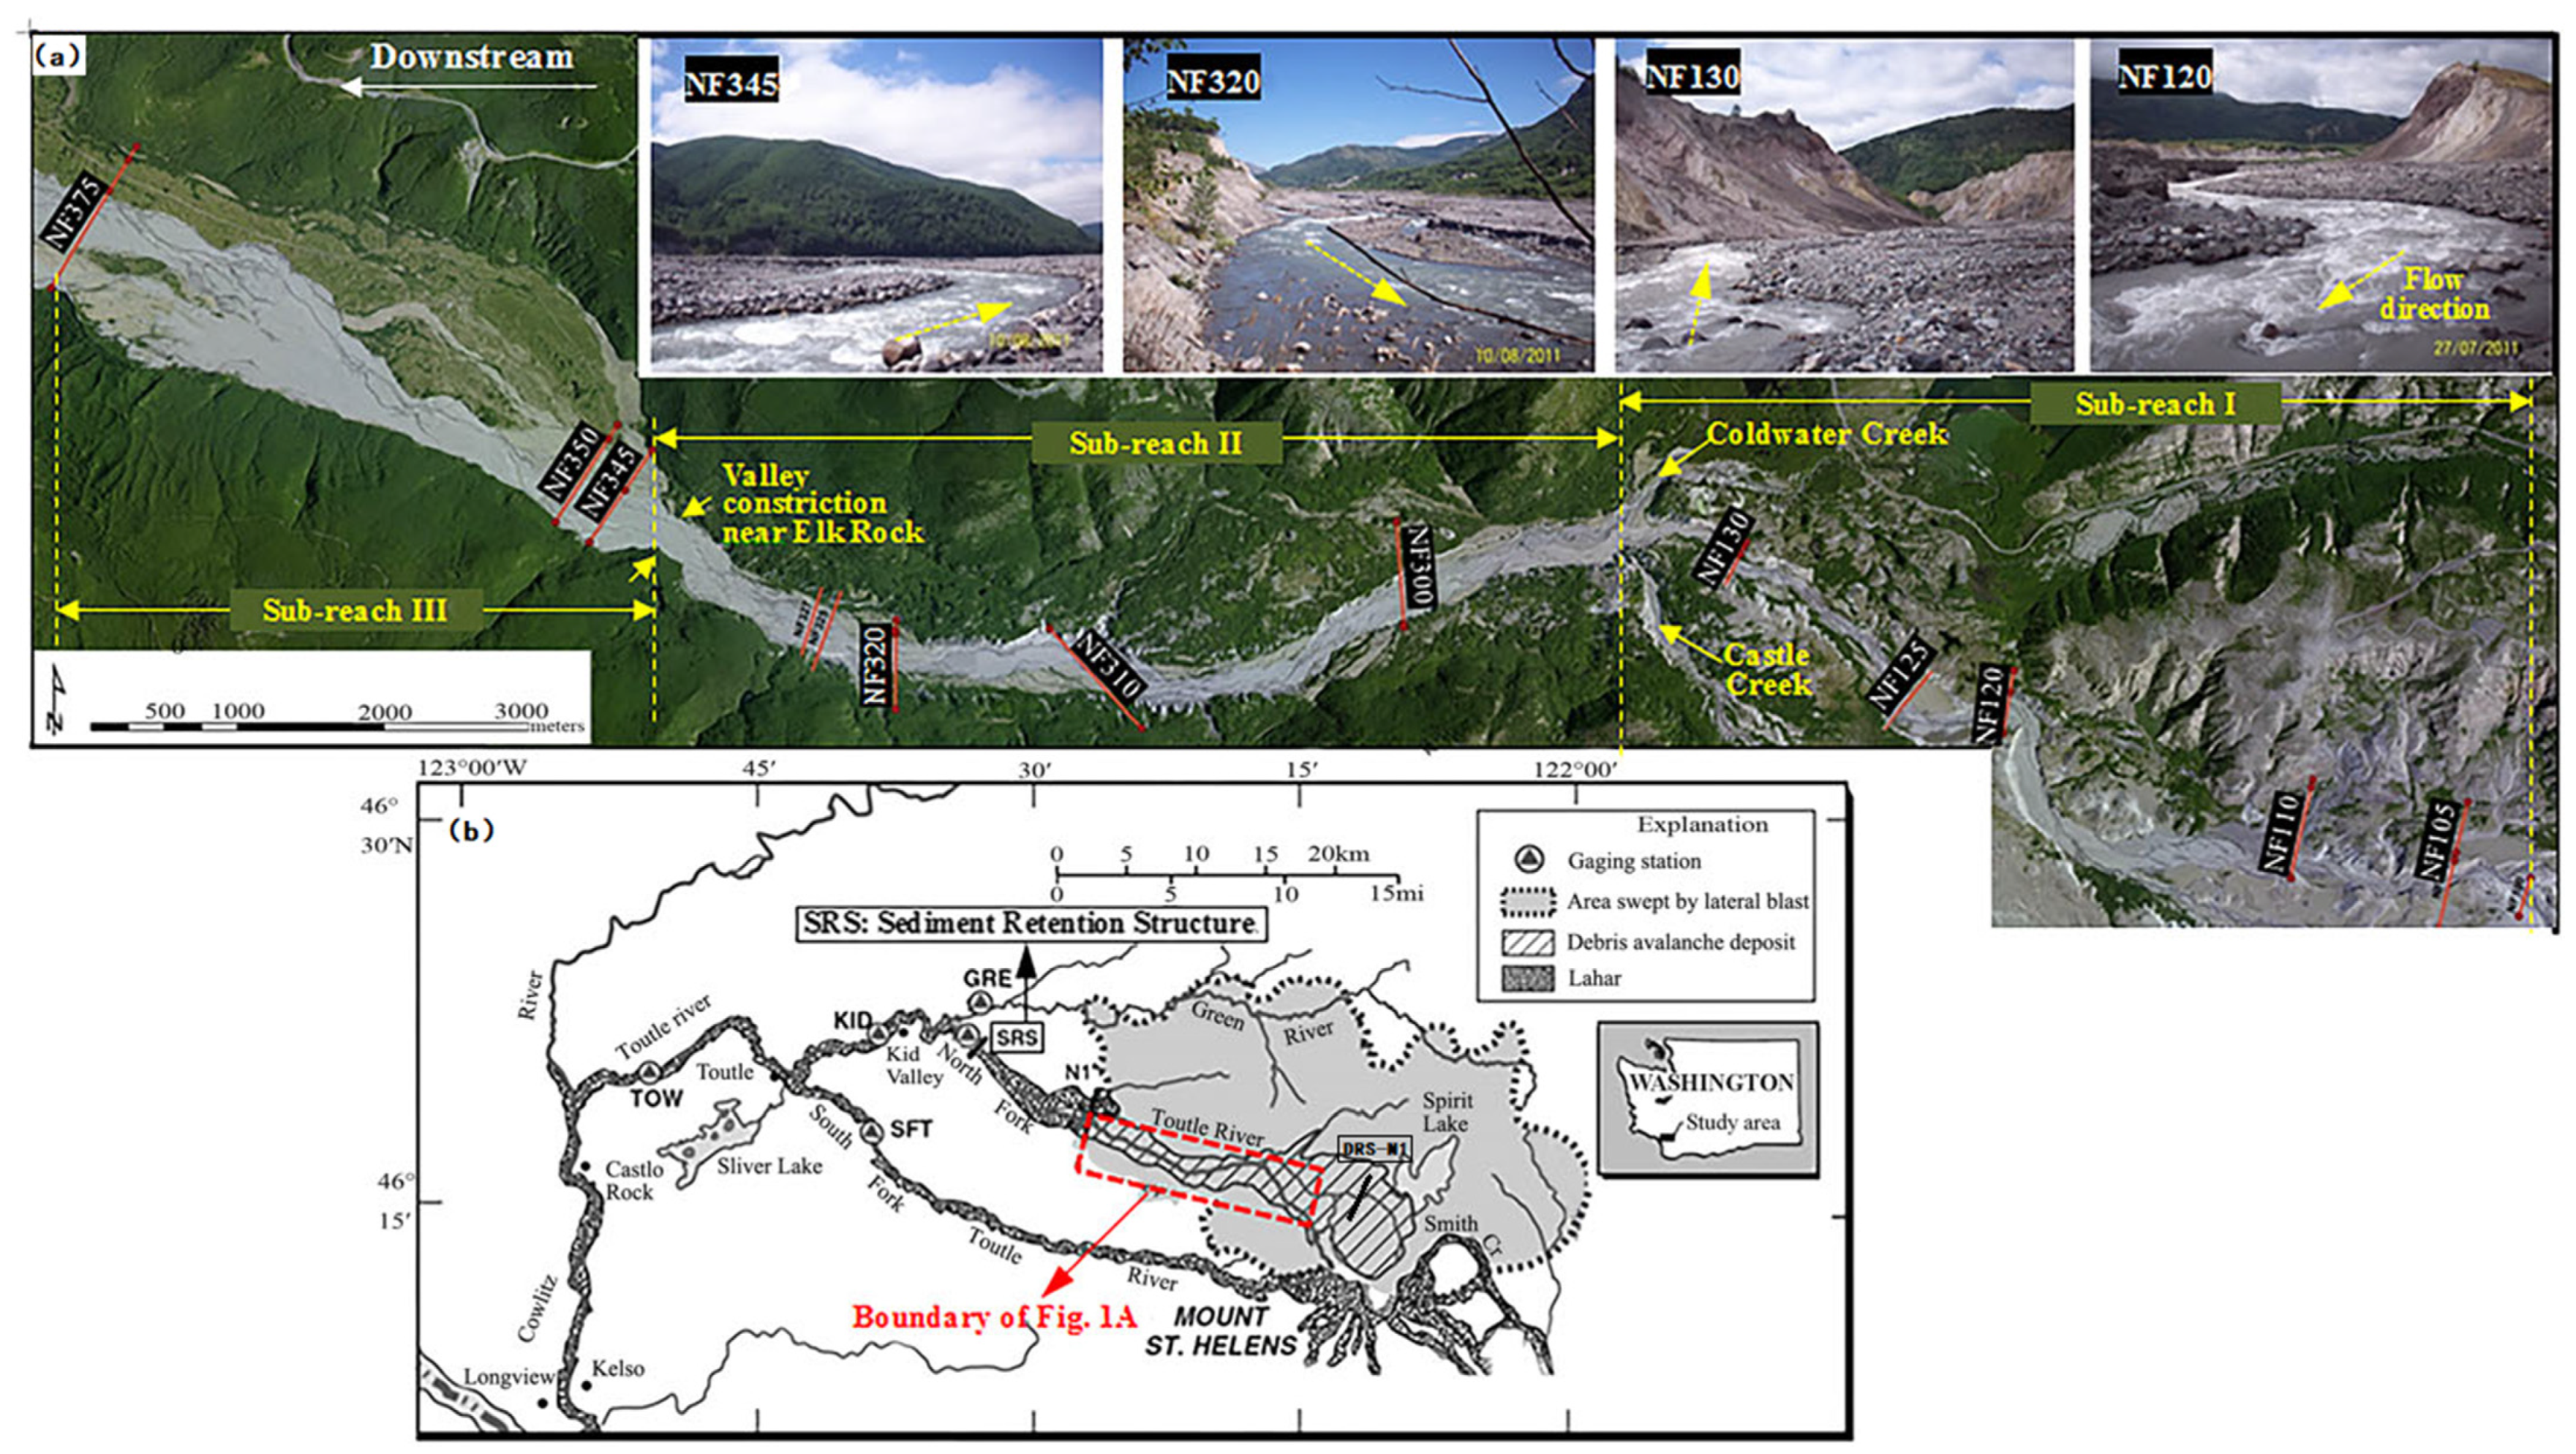
2. Study Area
3. Methodology
4. Results and Discussion
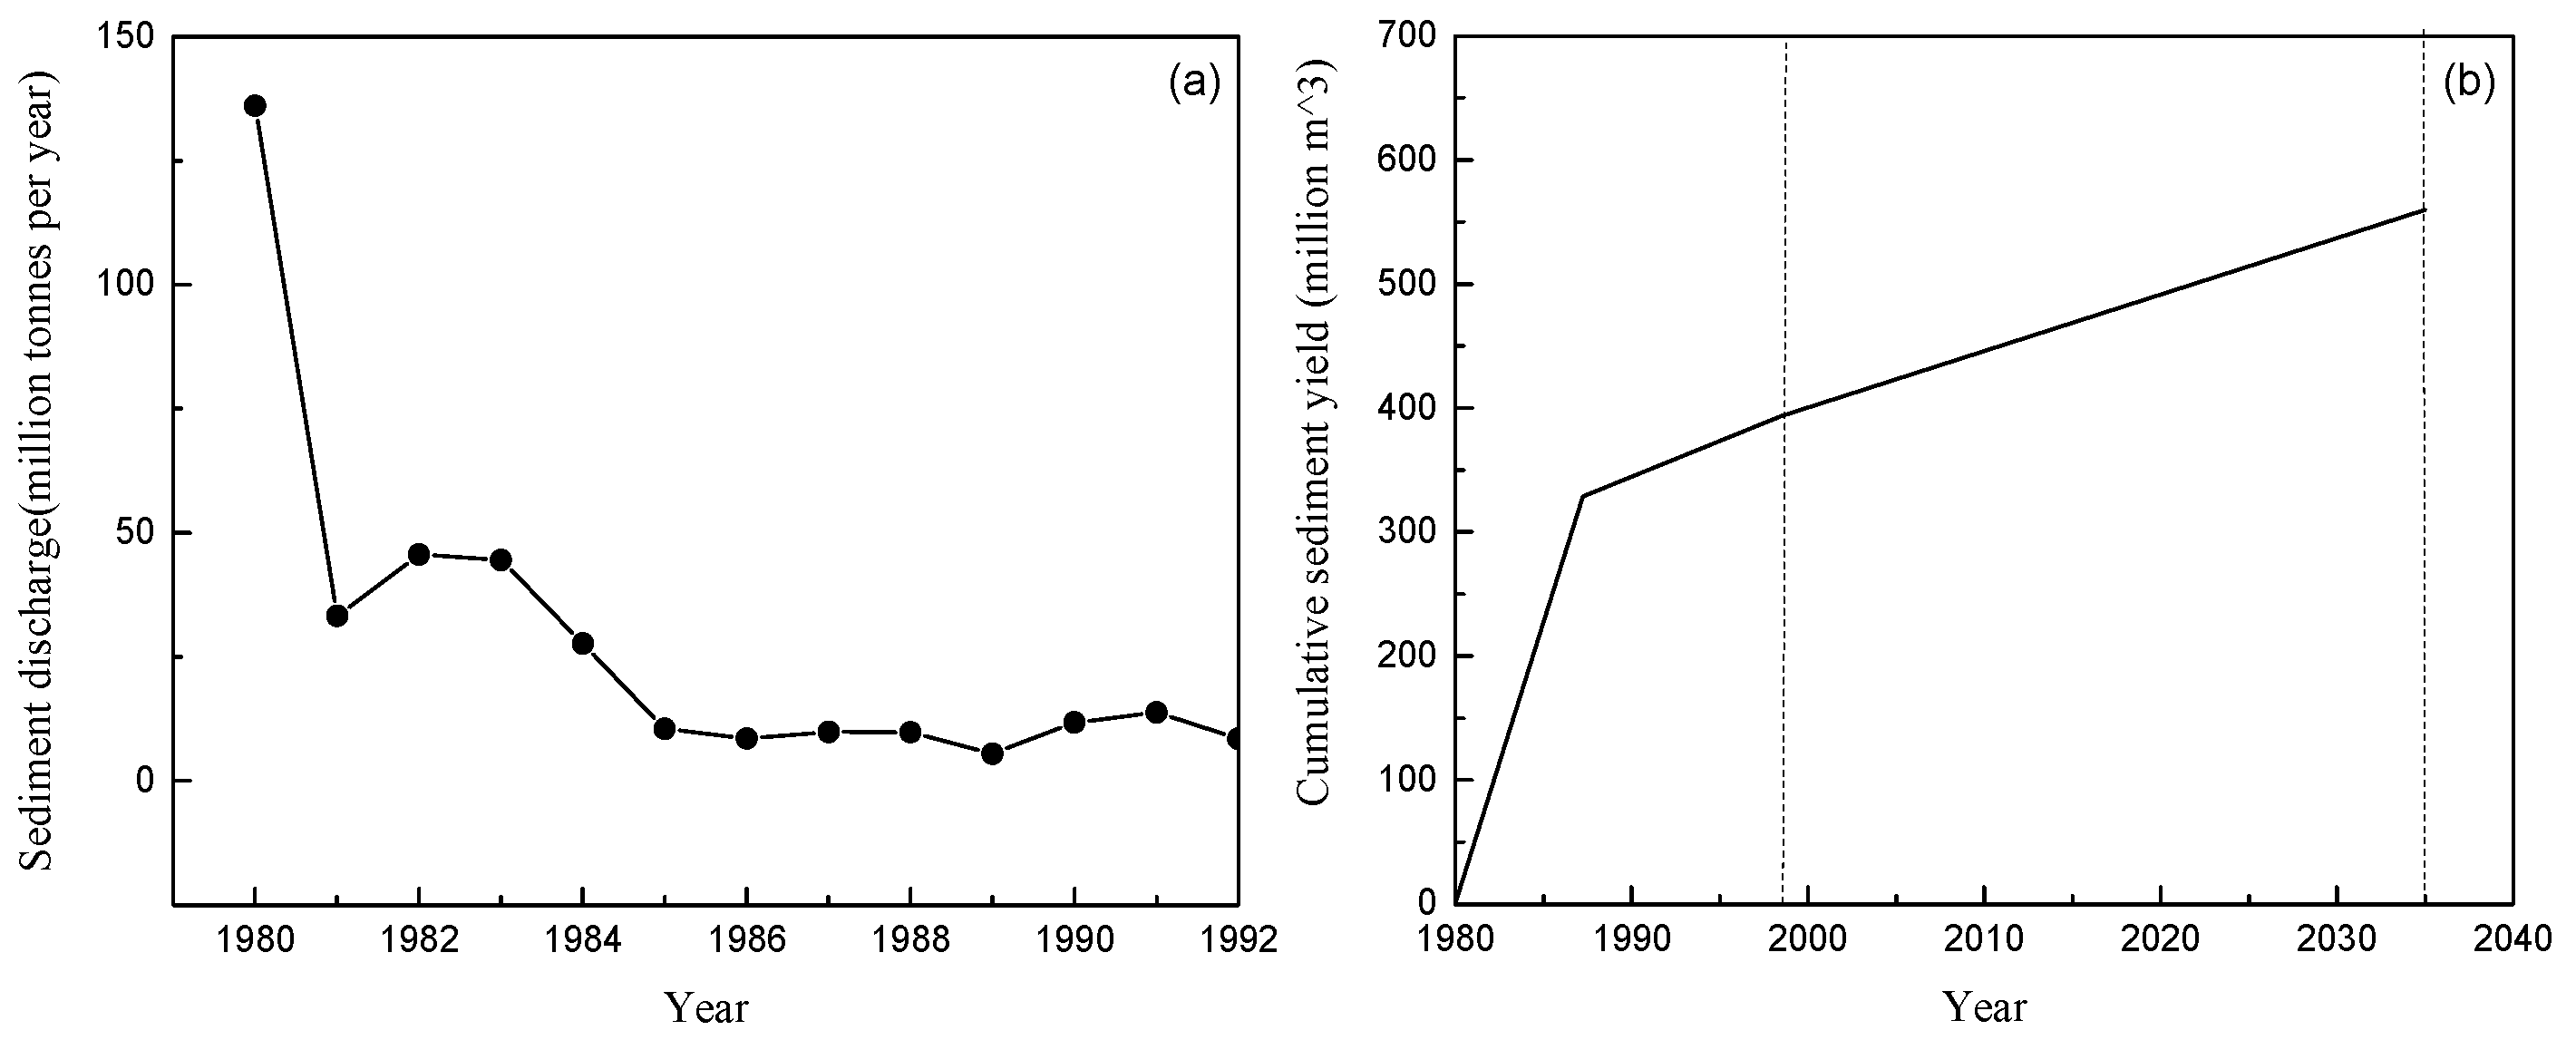
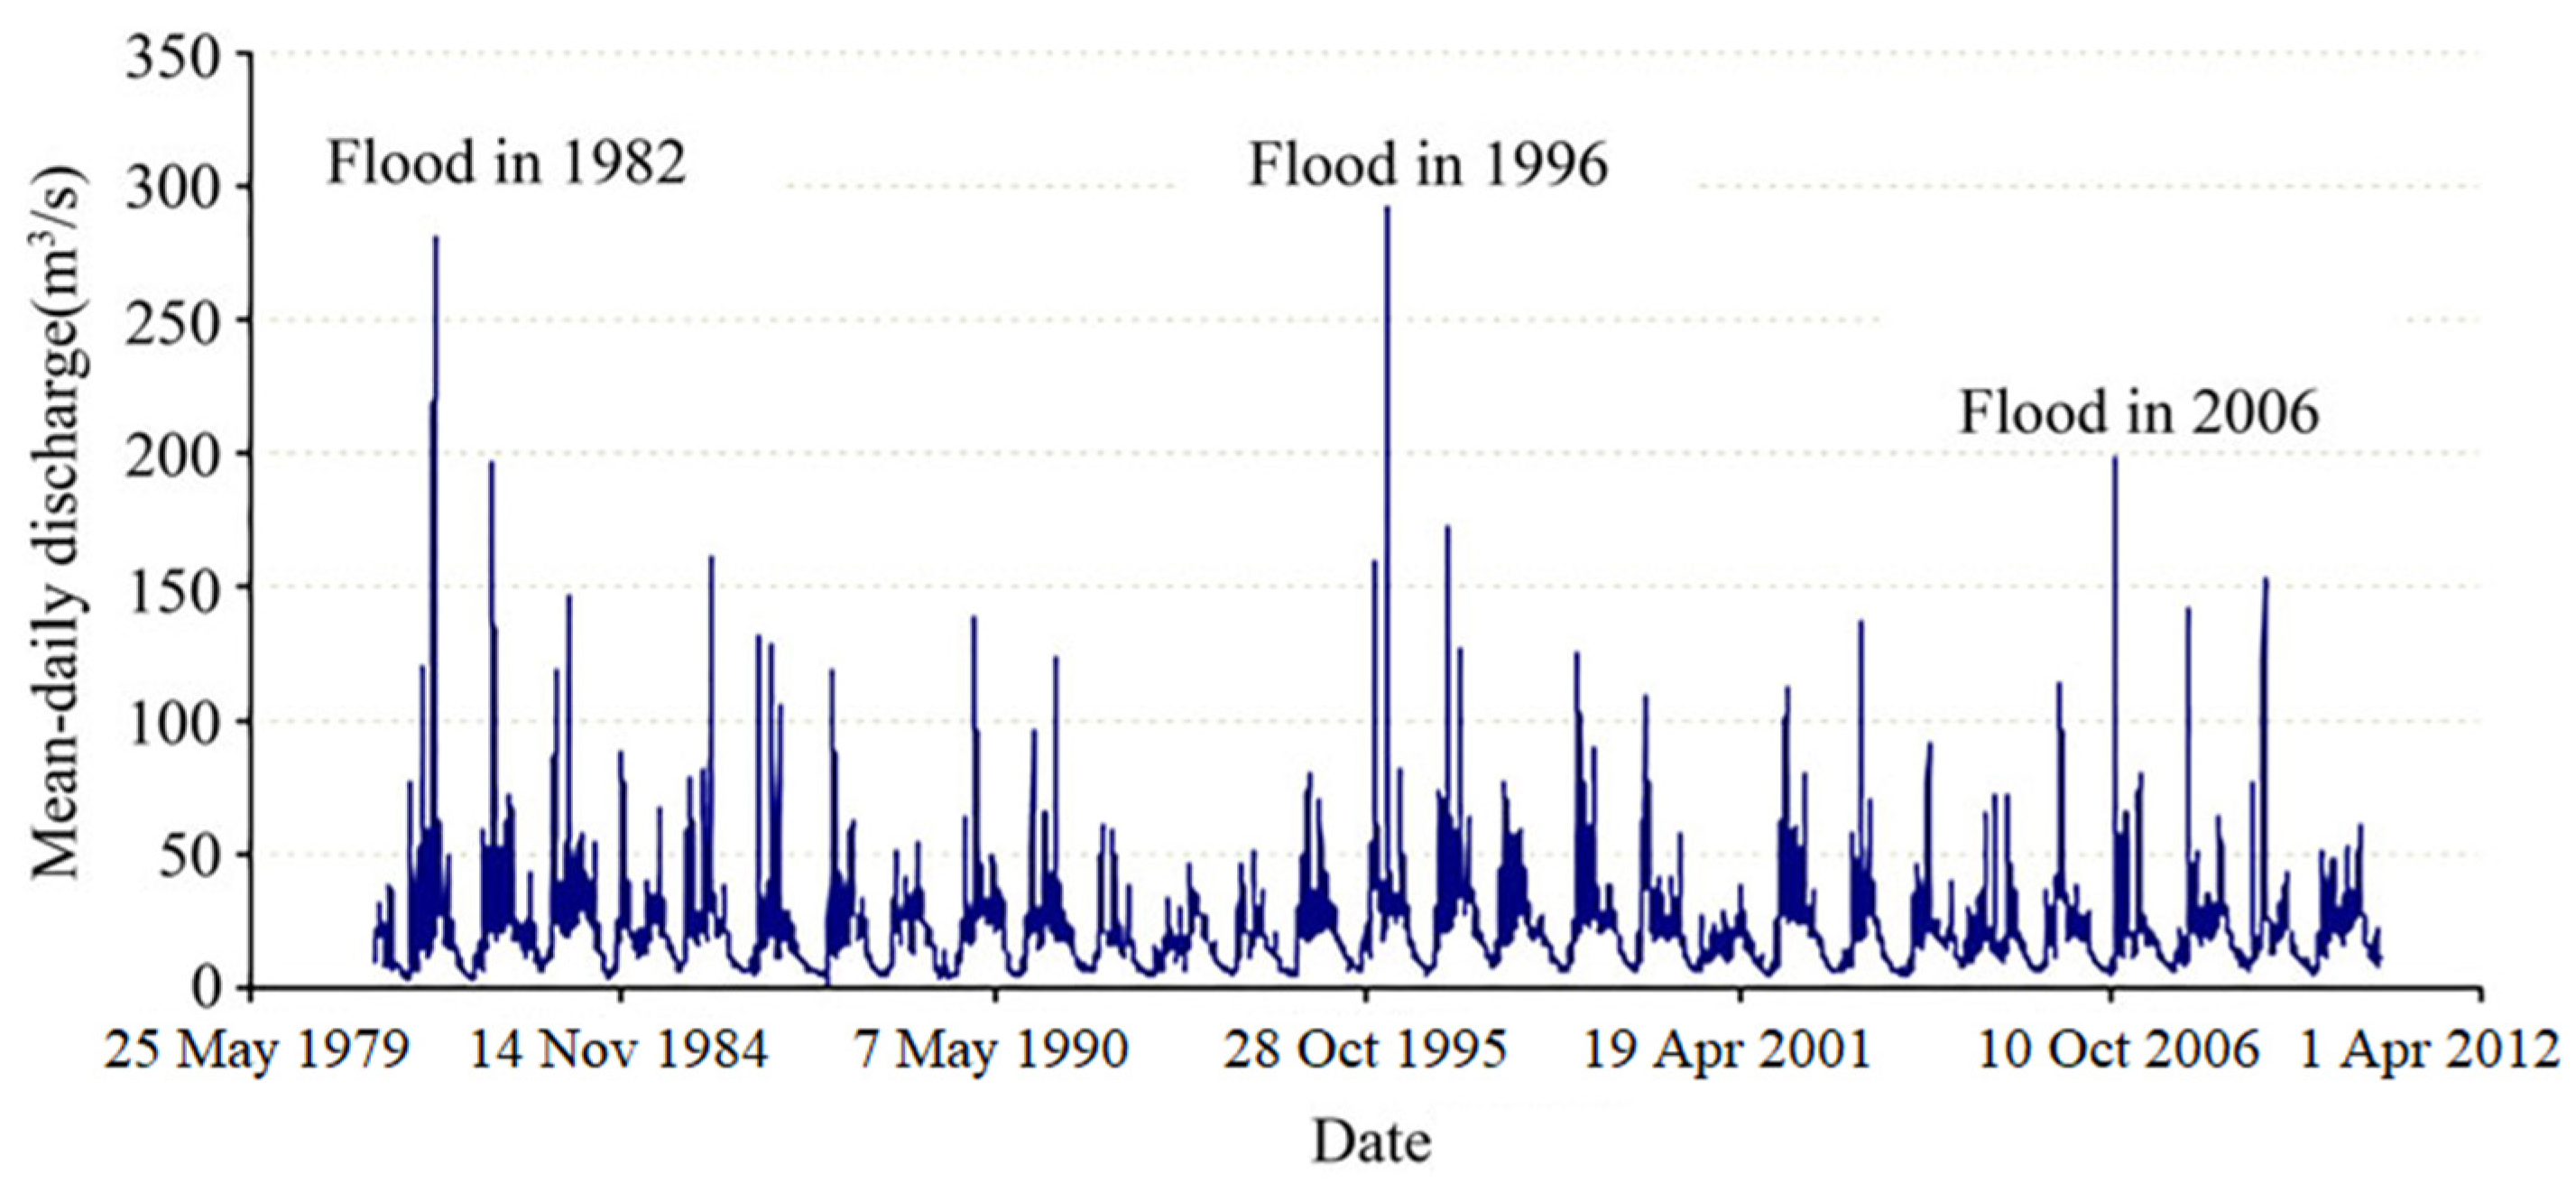
4.1. Runoff and Sediment Flux
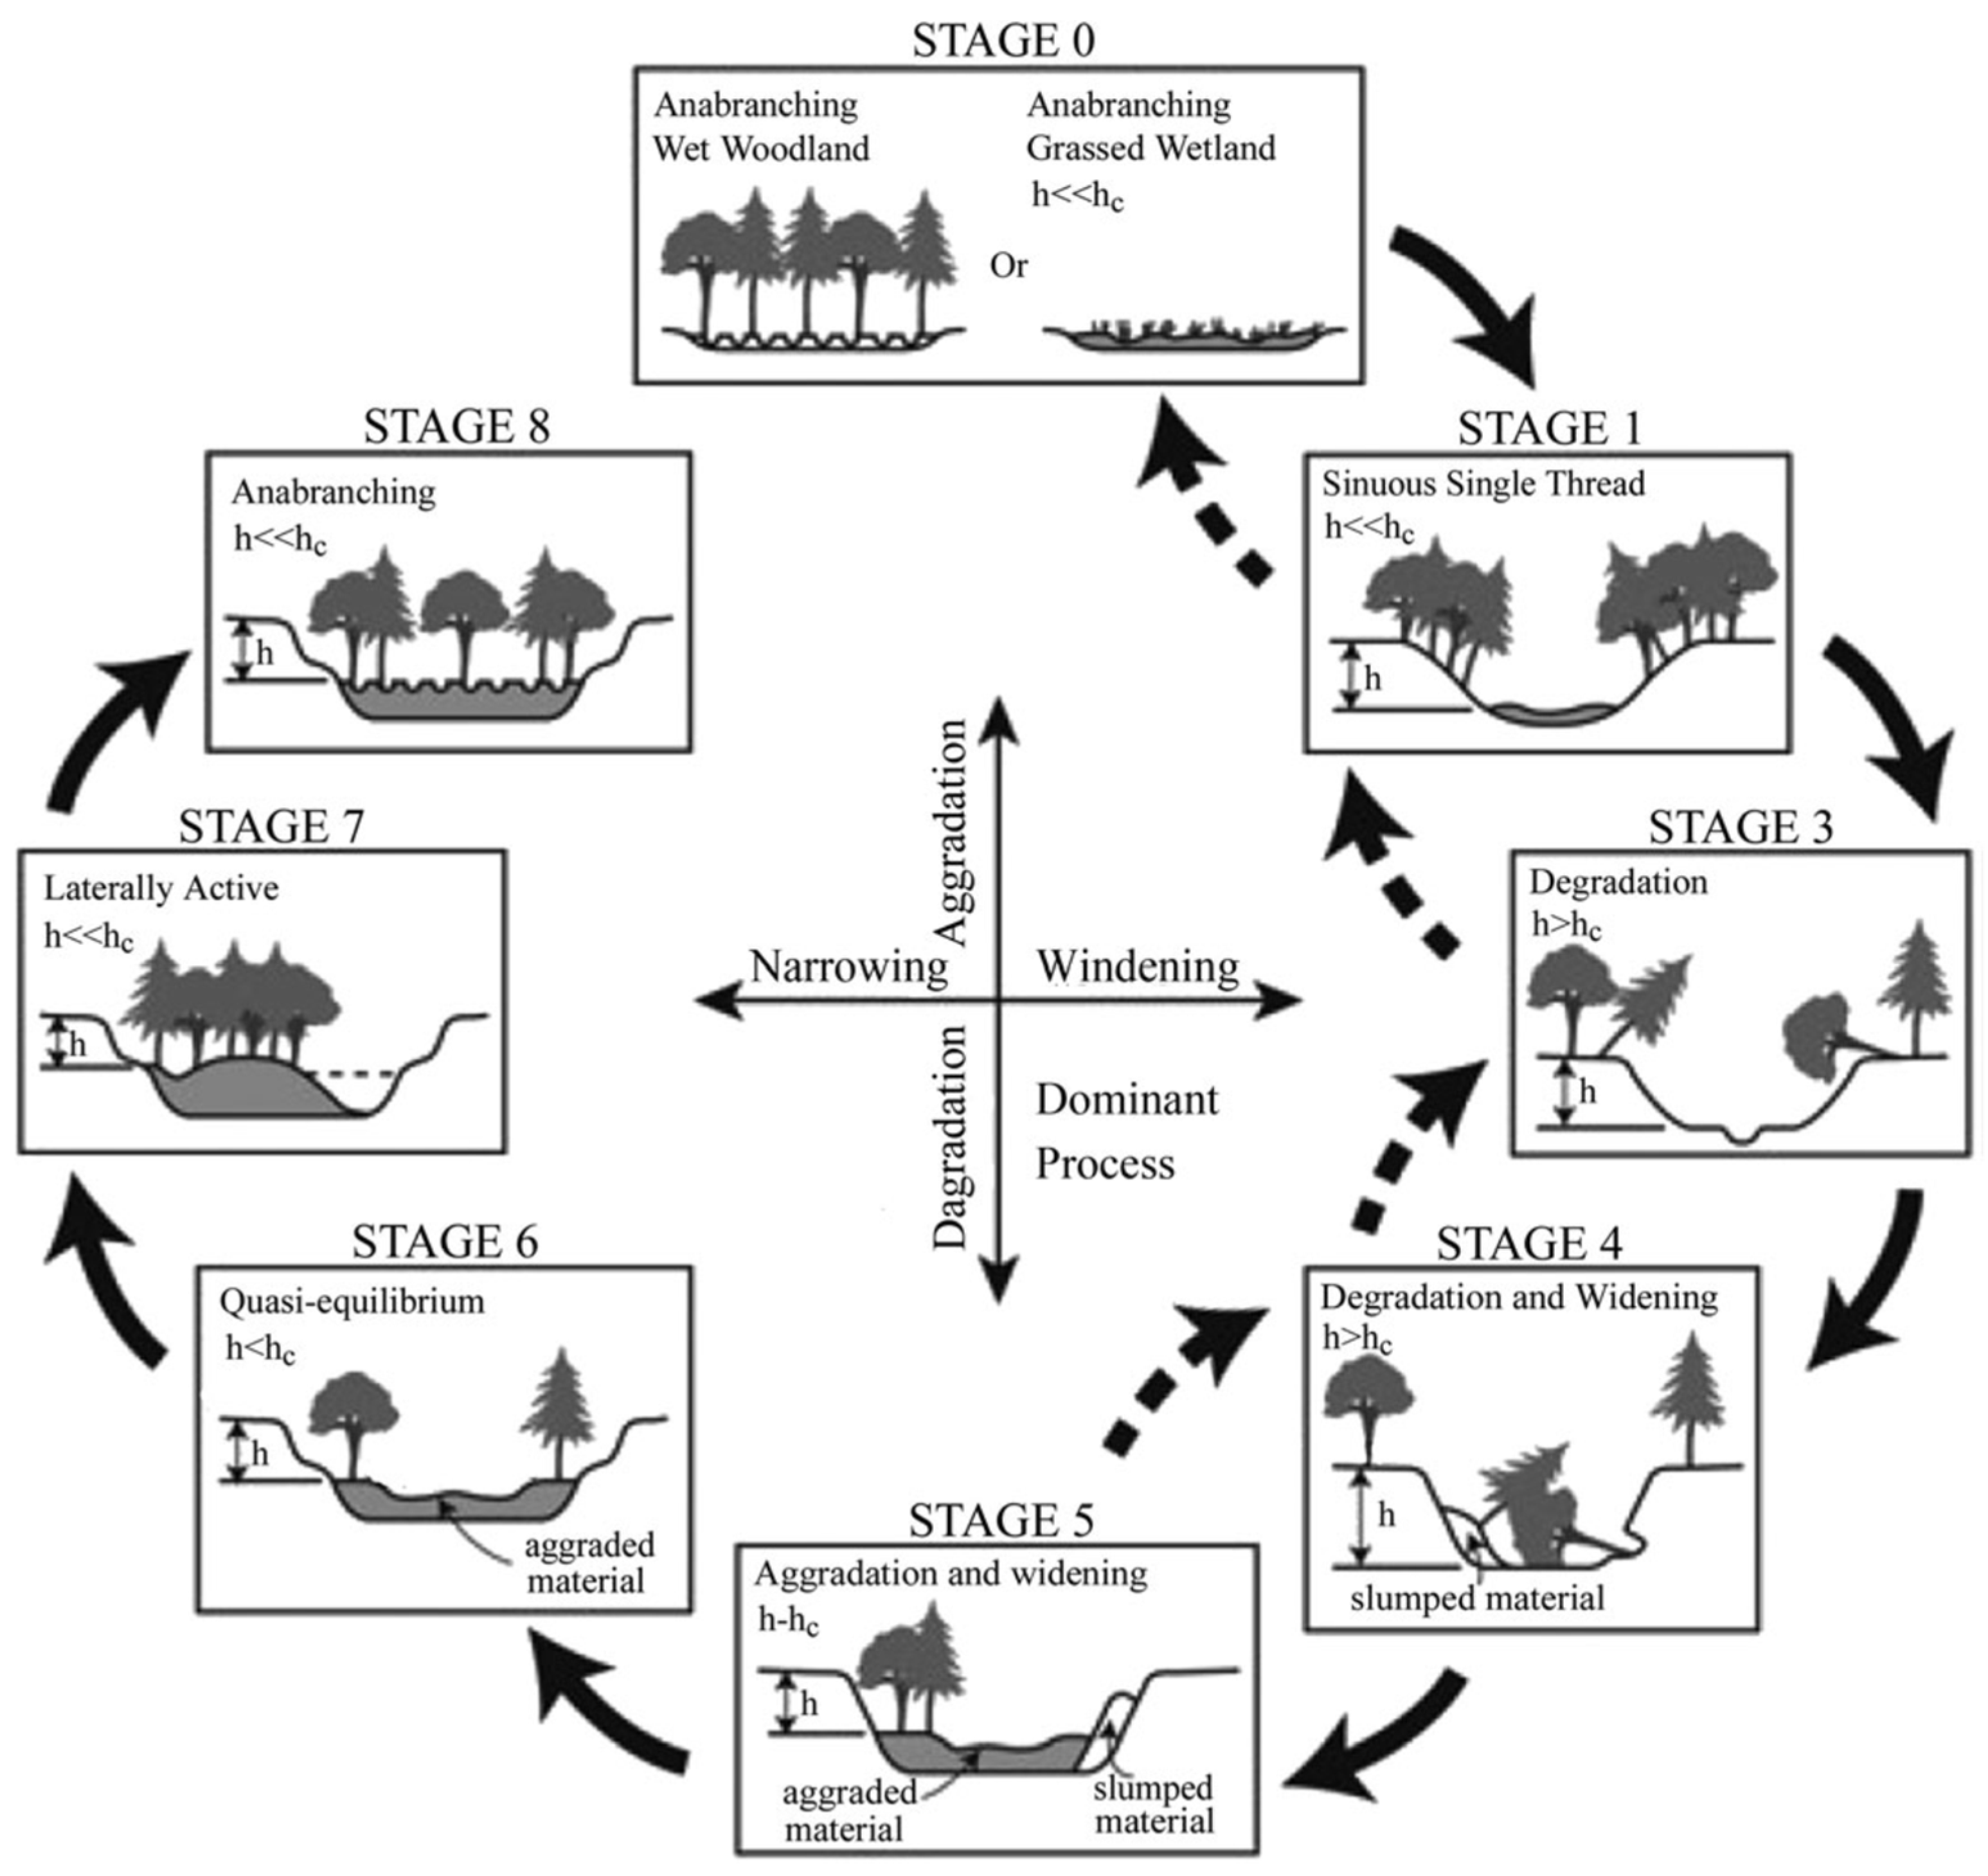
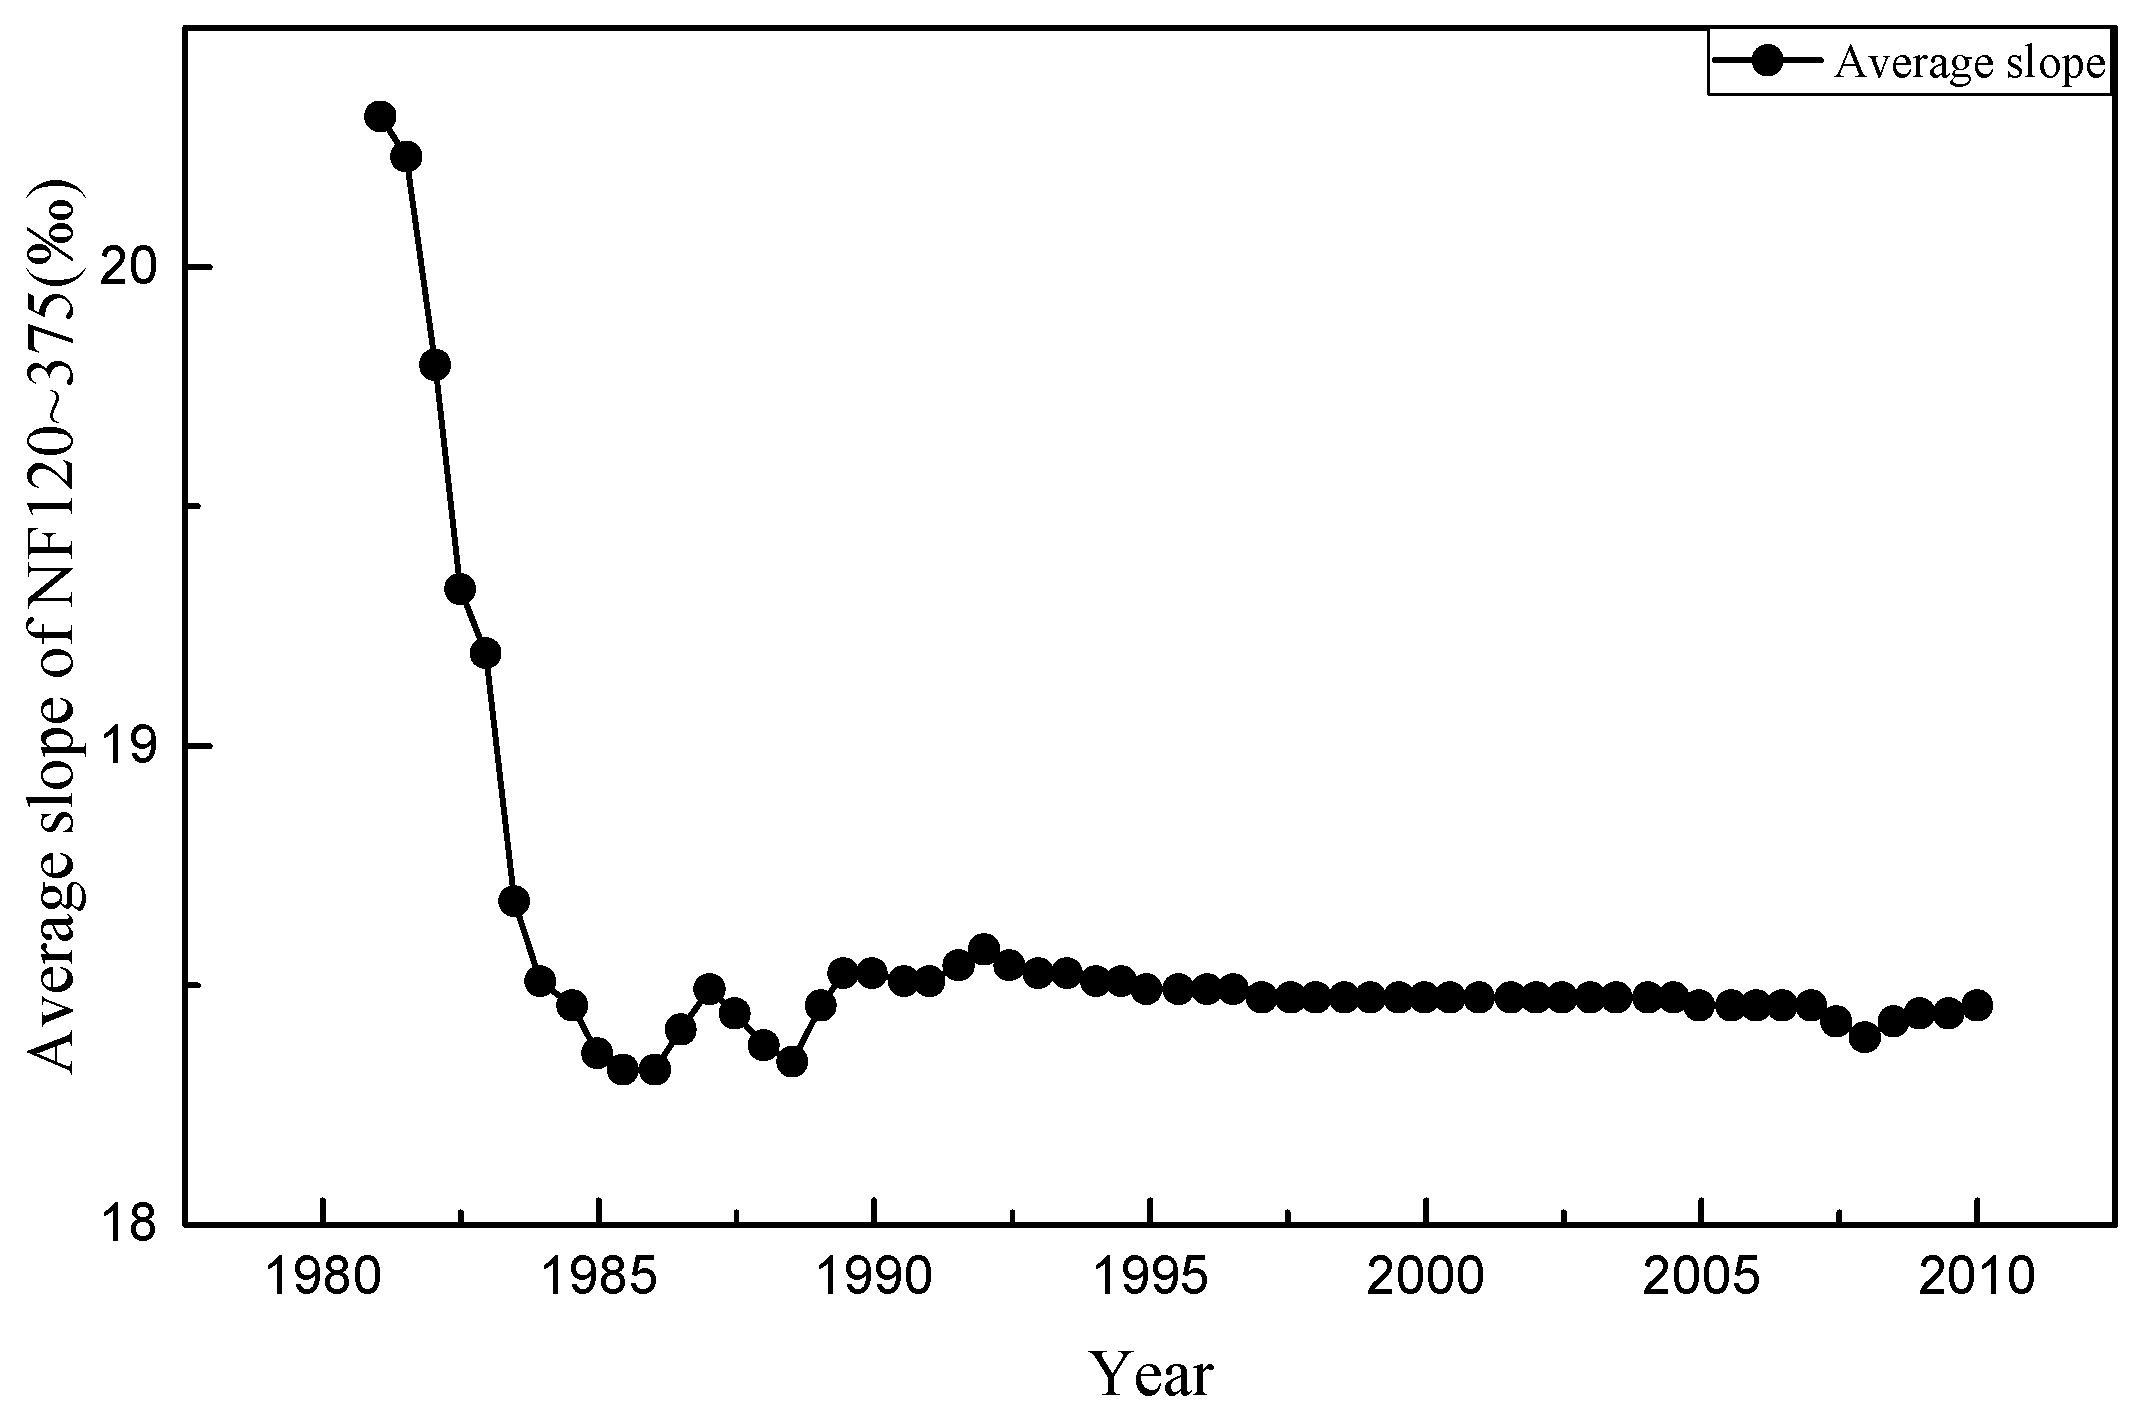
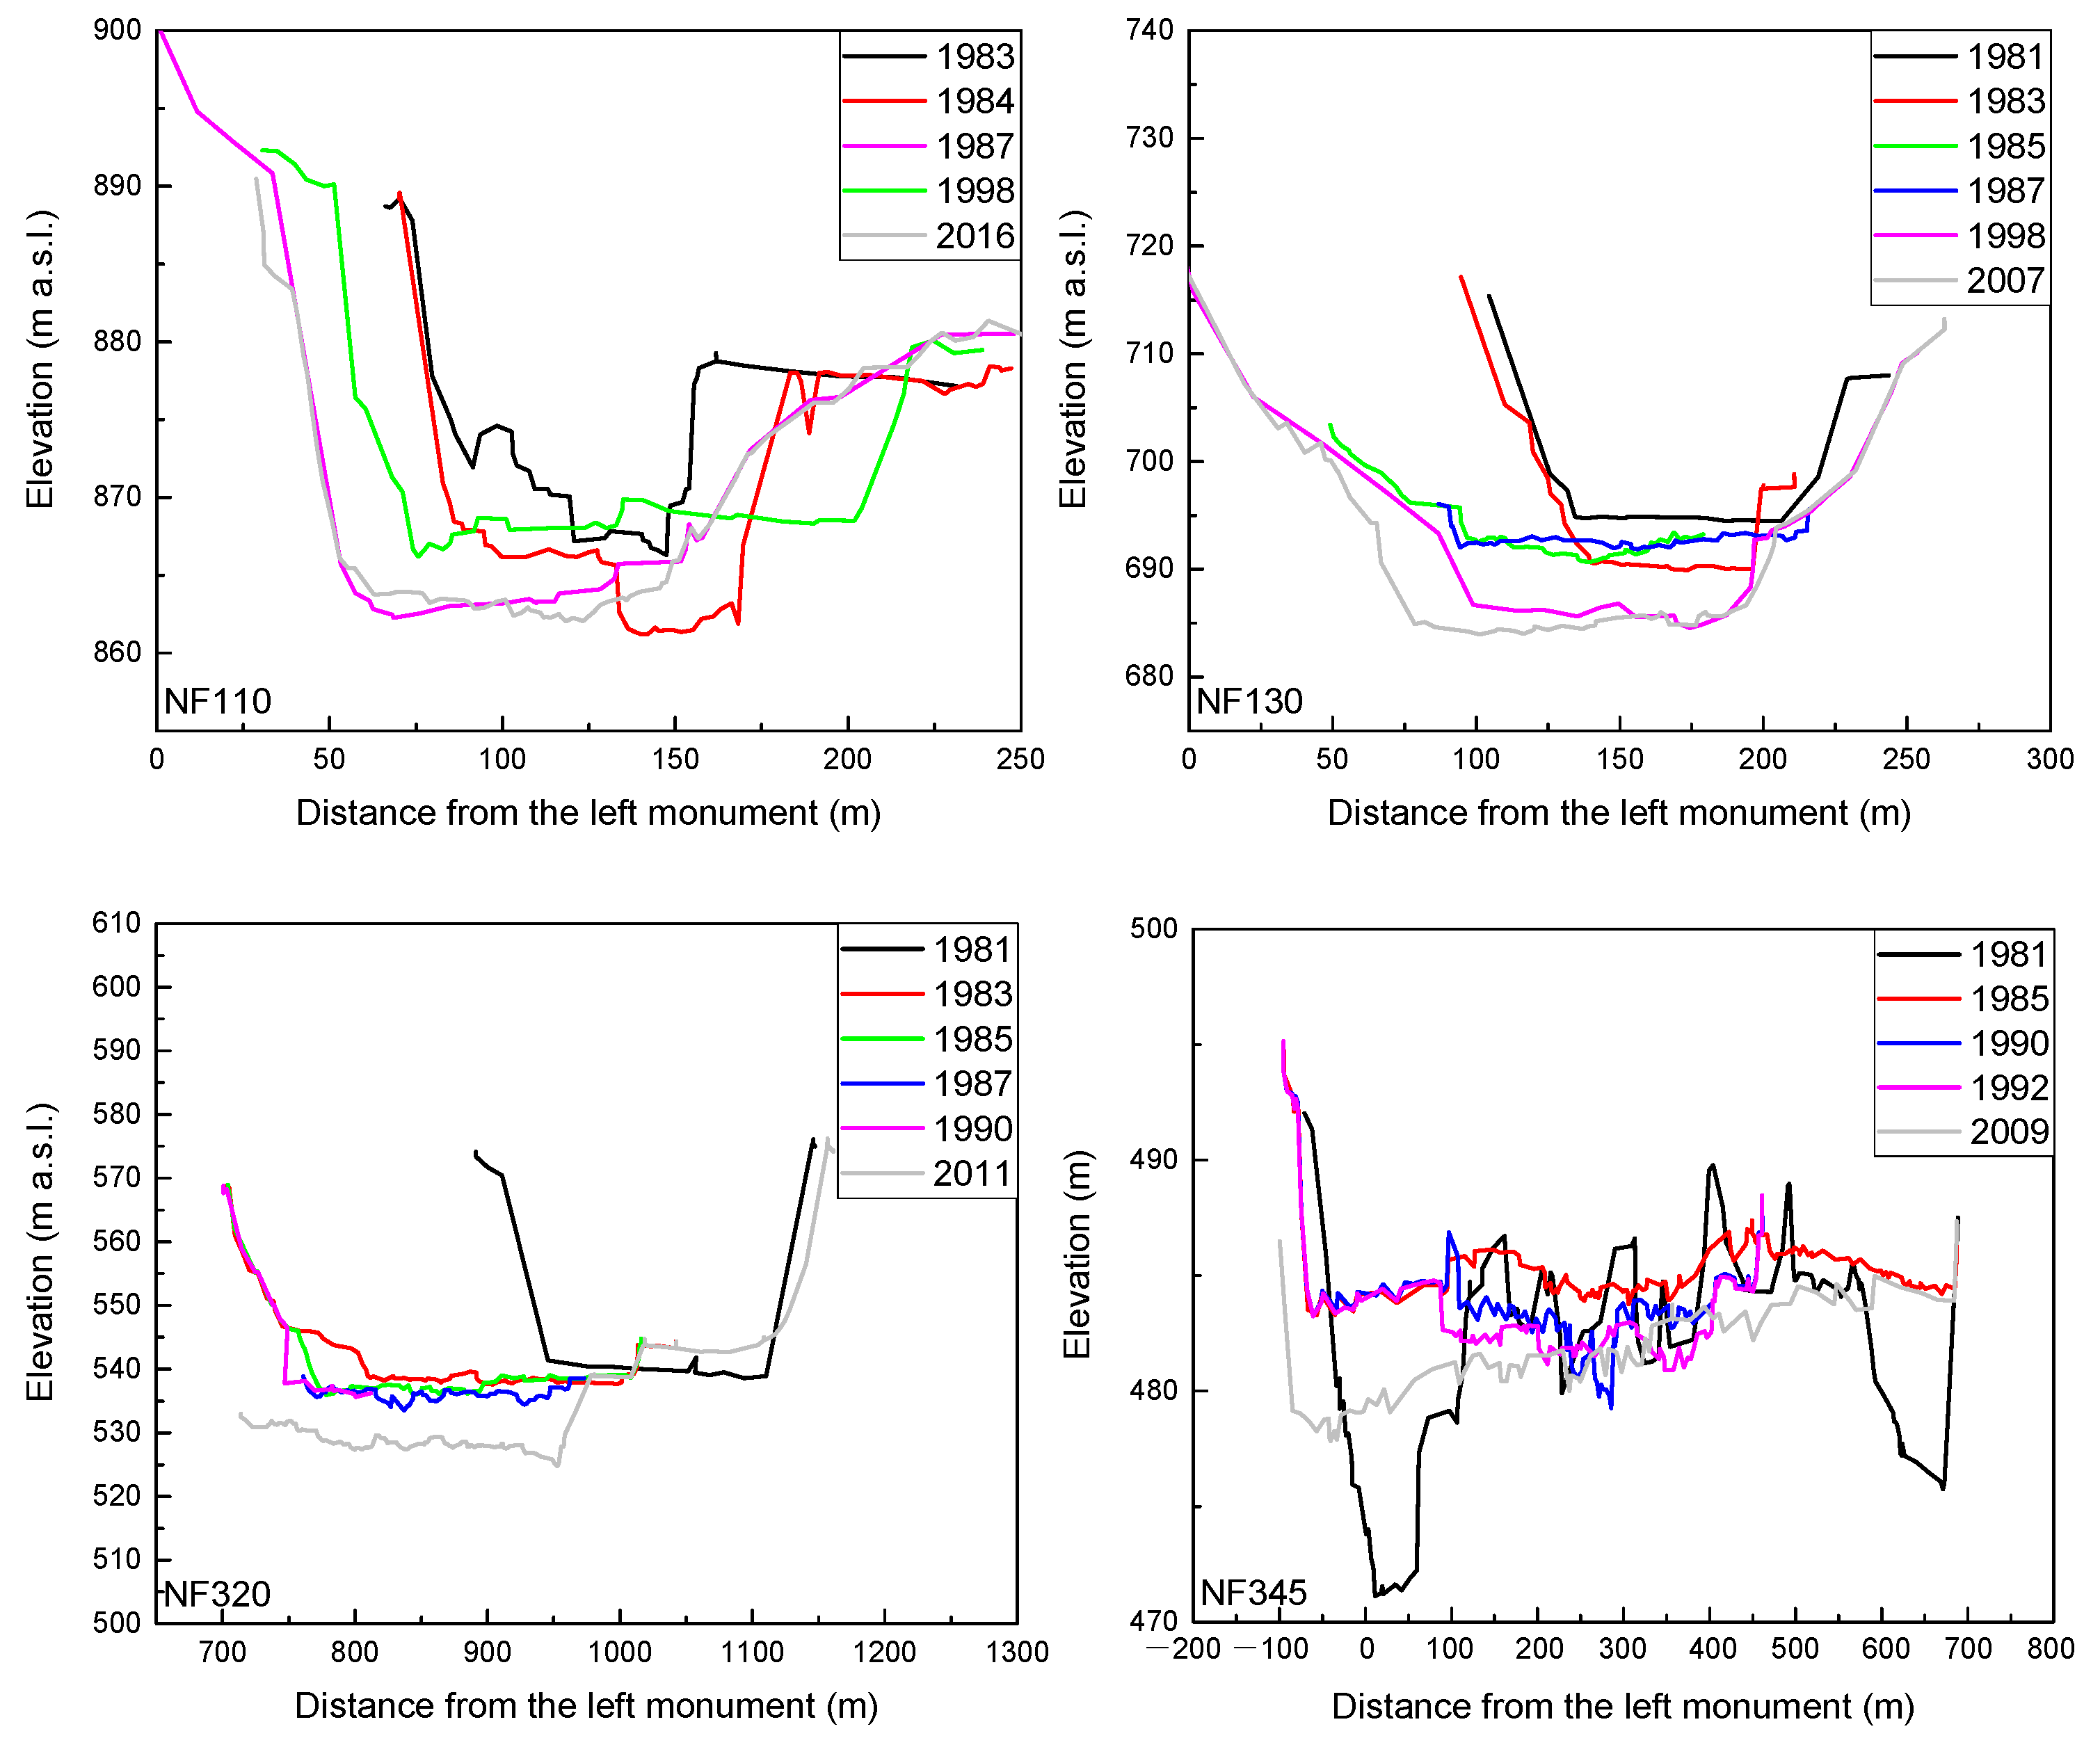
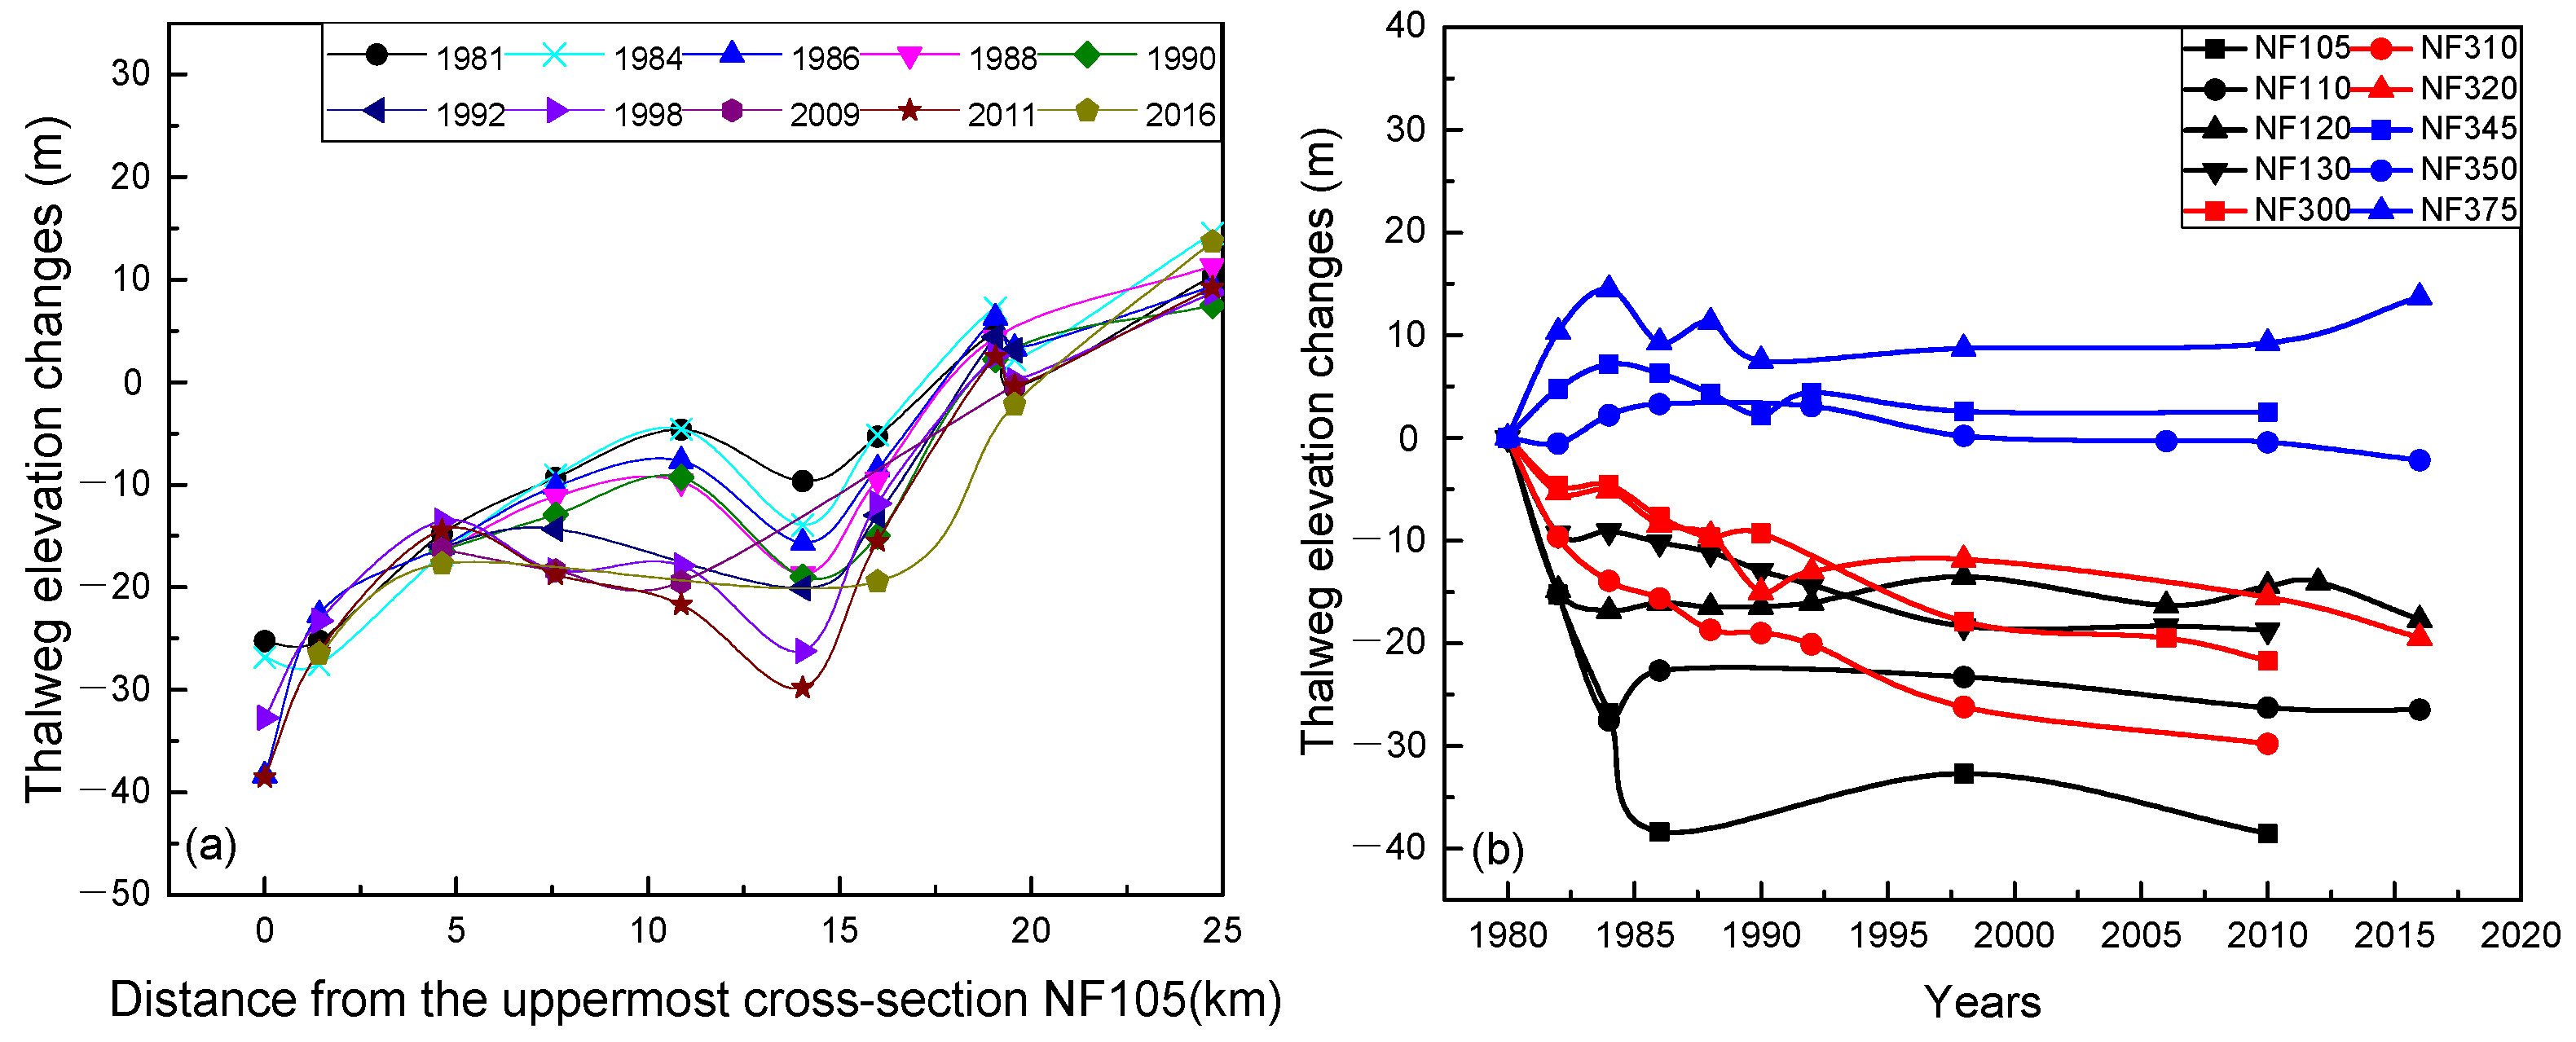
4.2. Vertical Morphological Adjustments
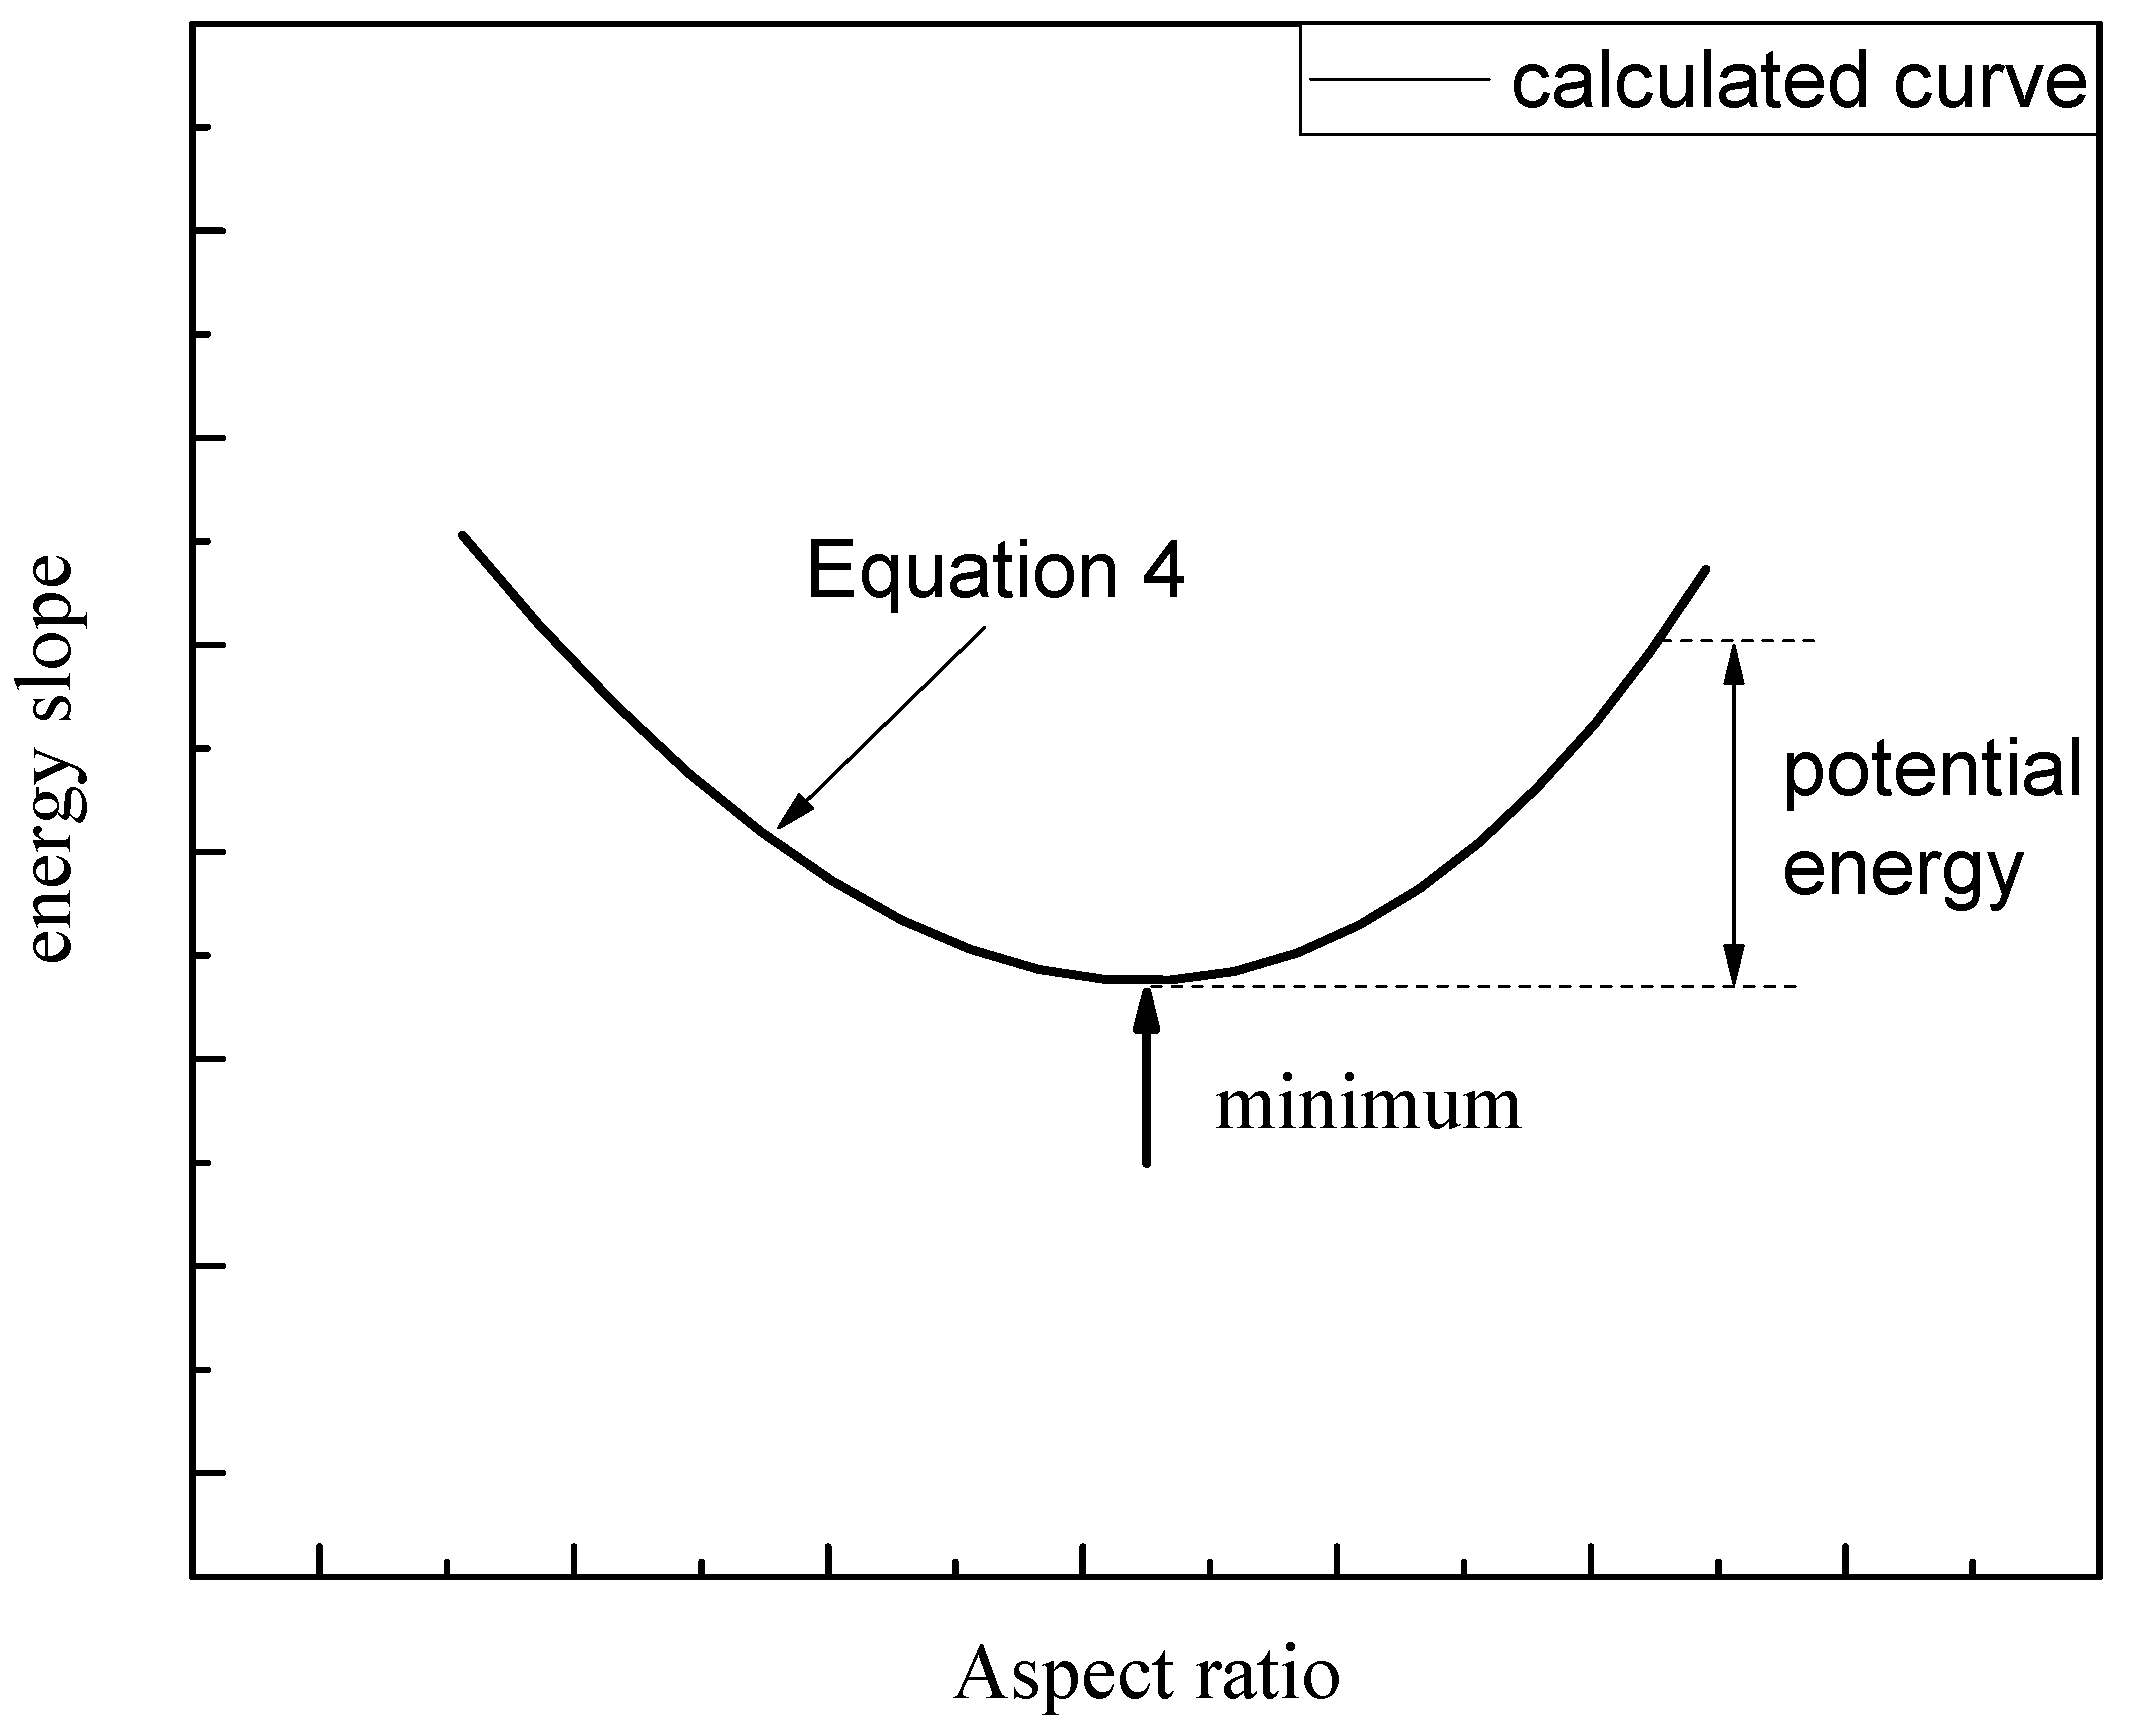
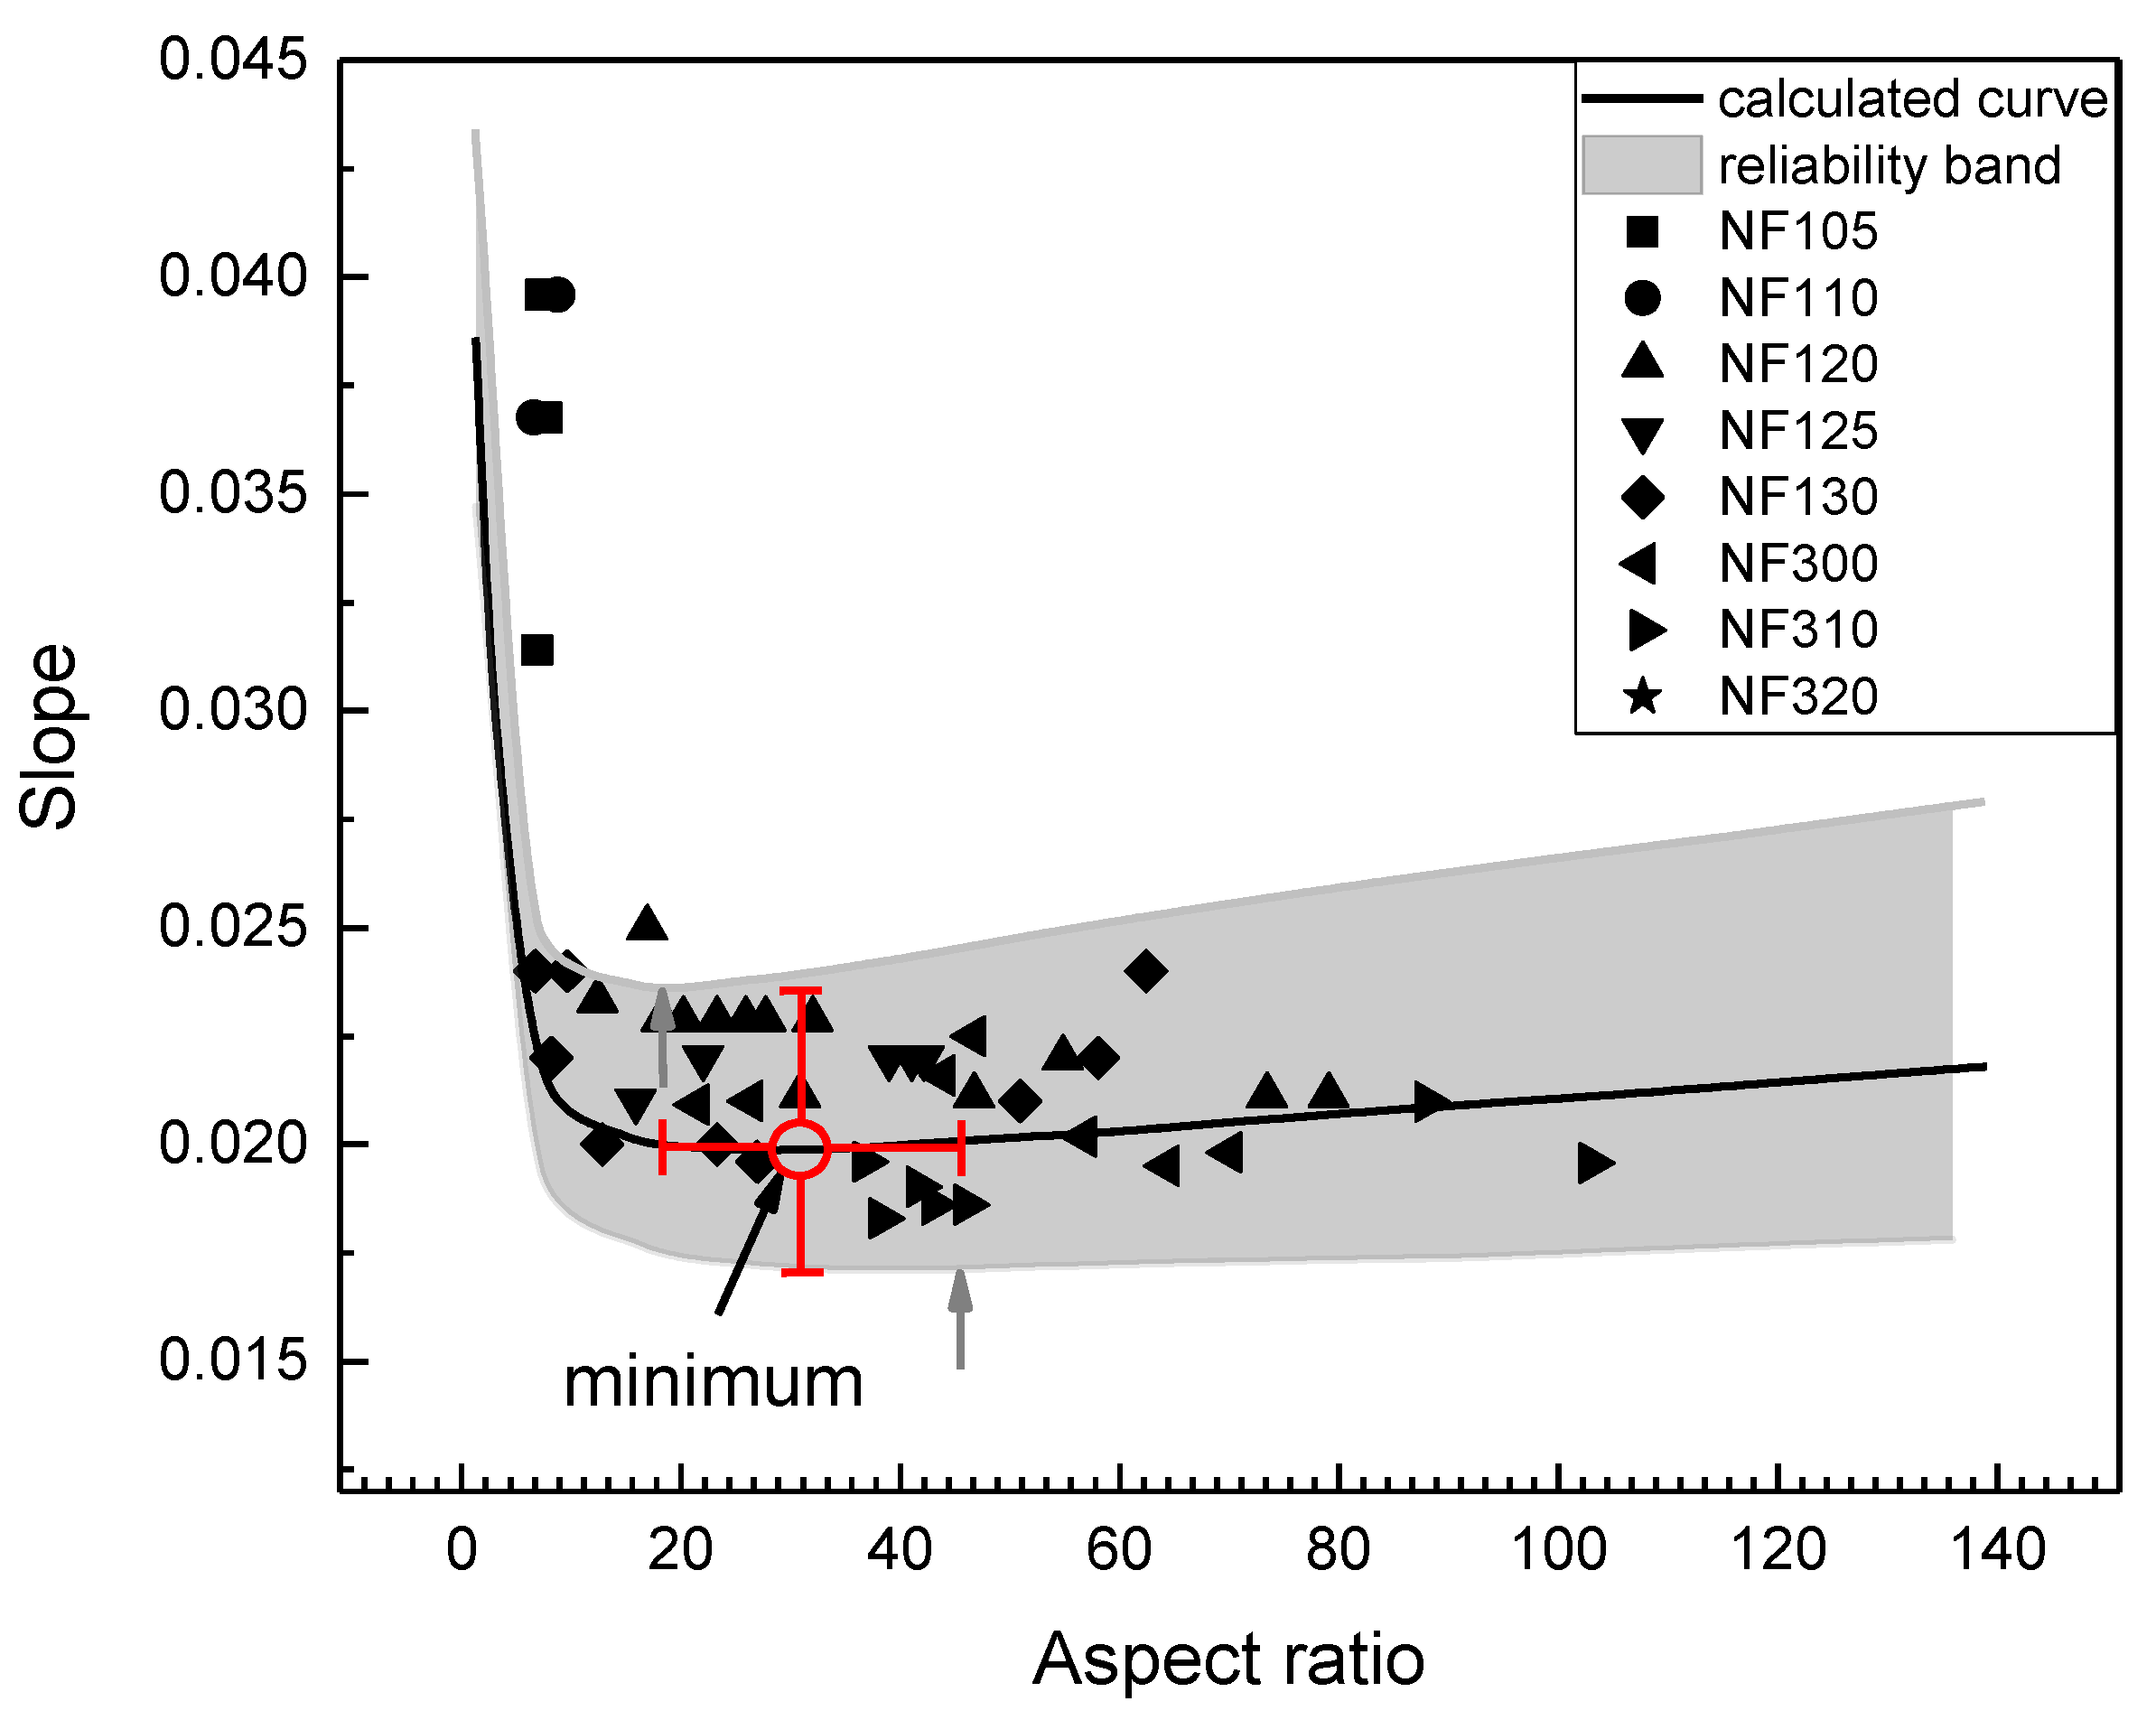
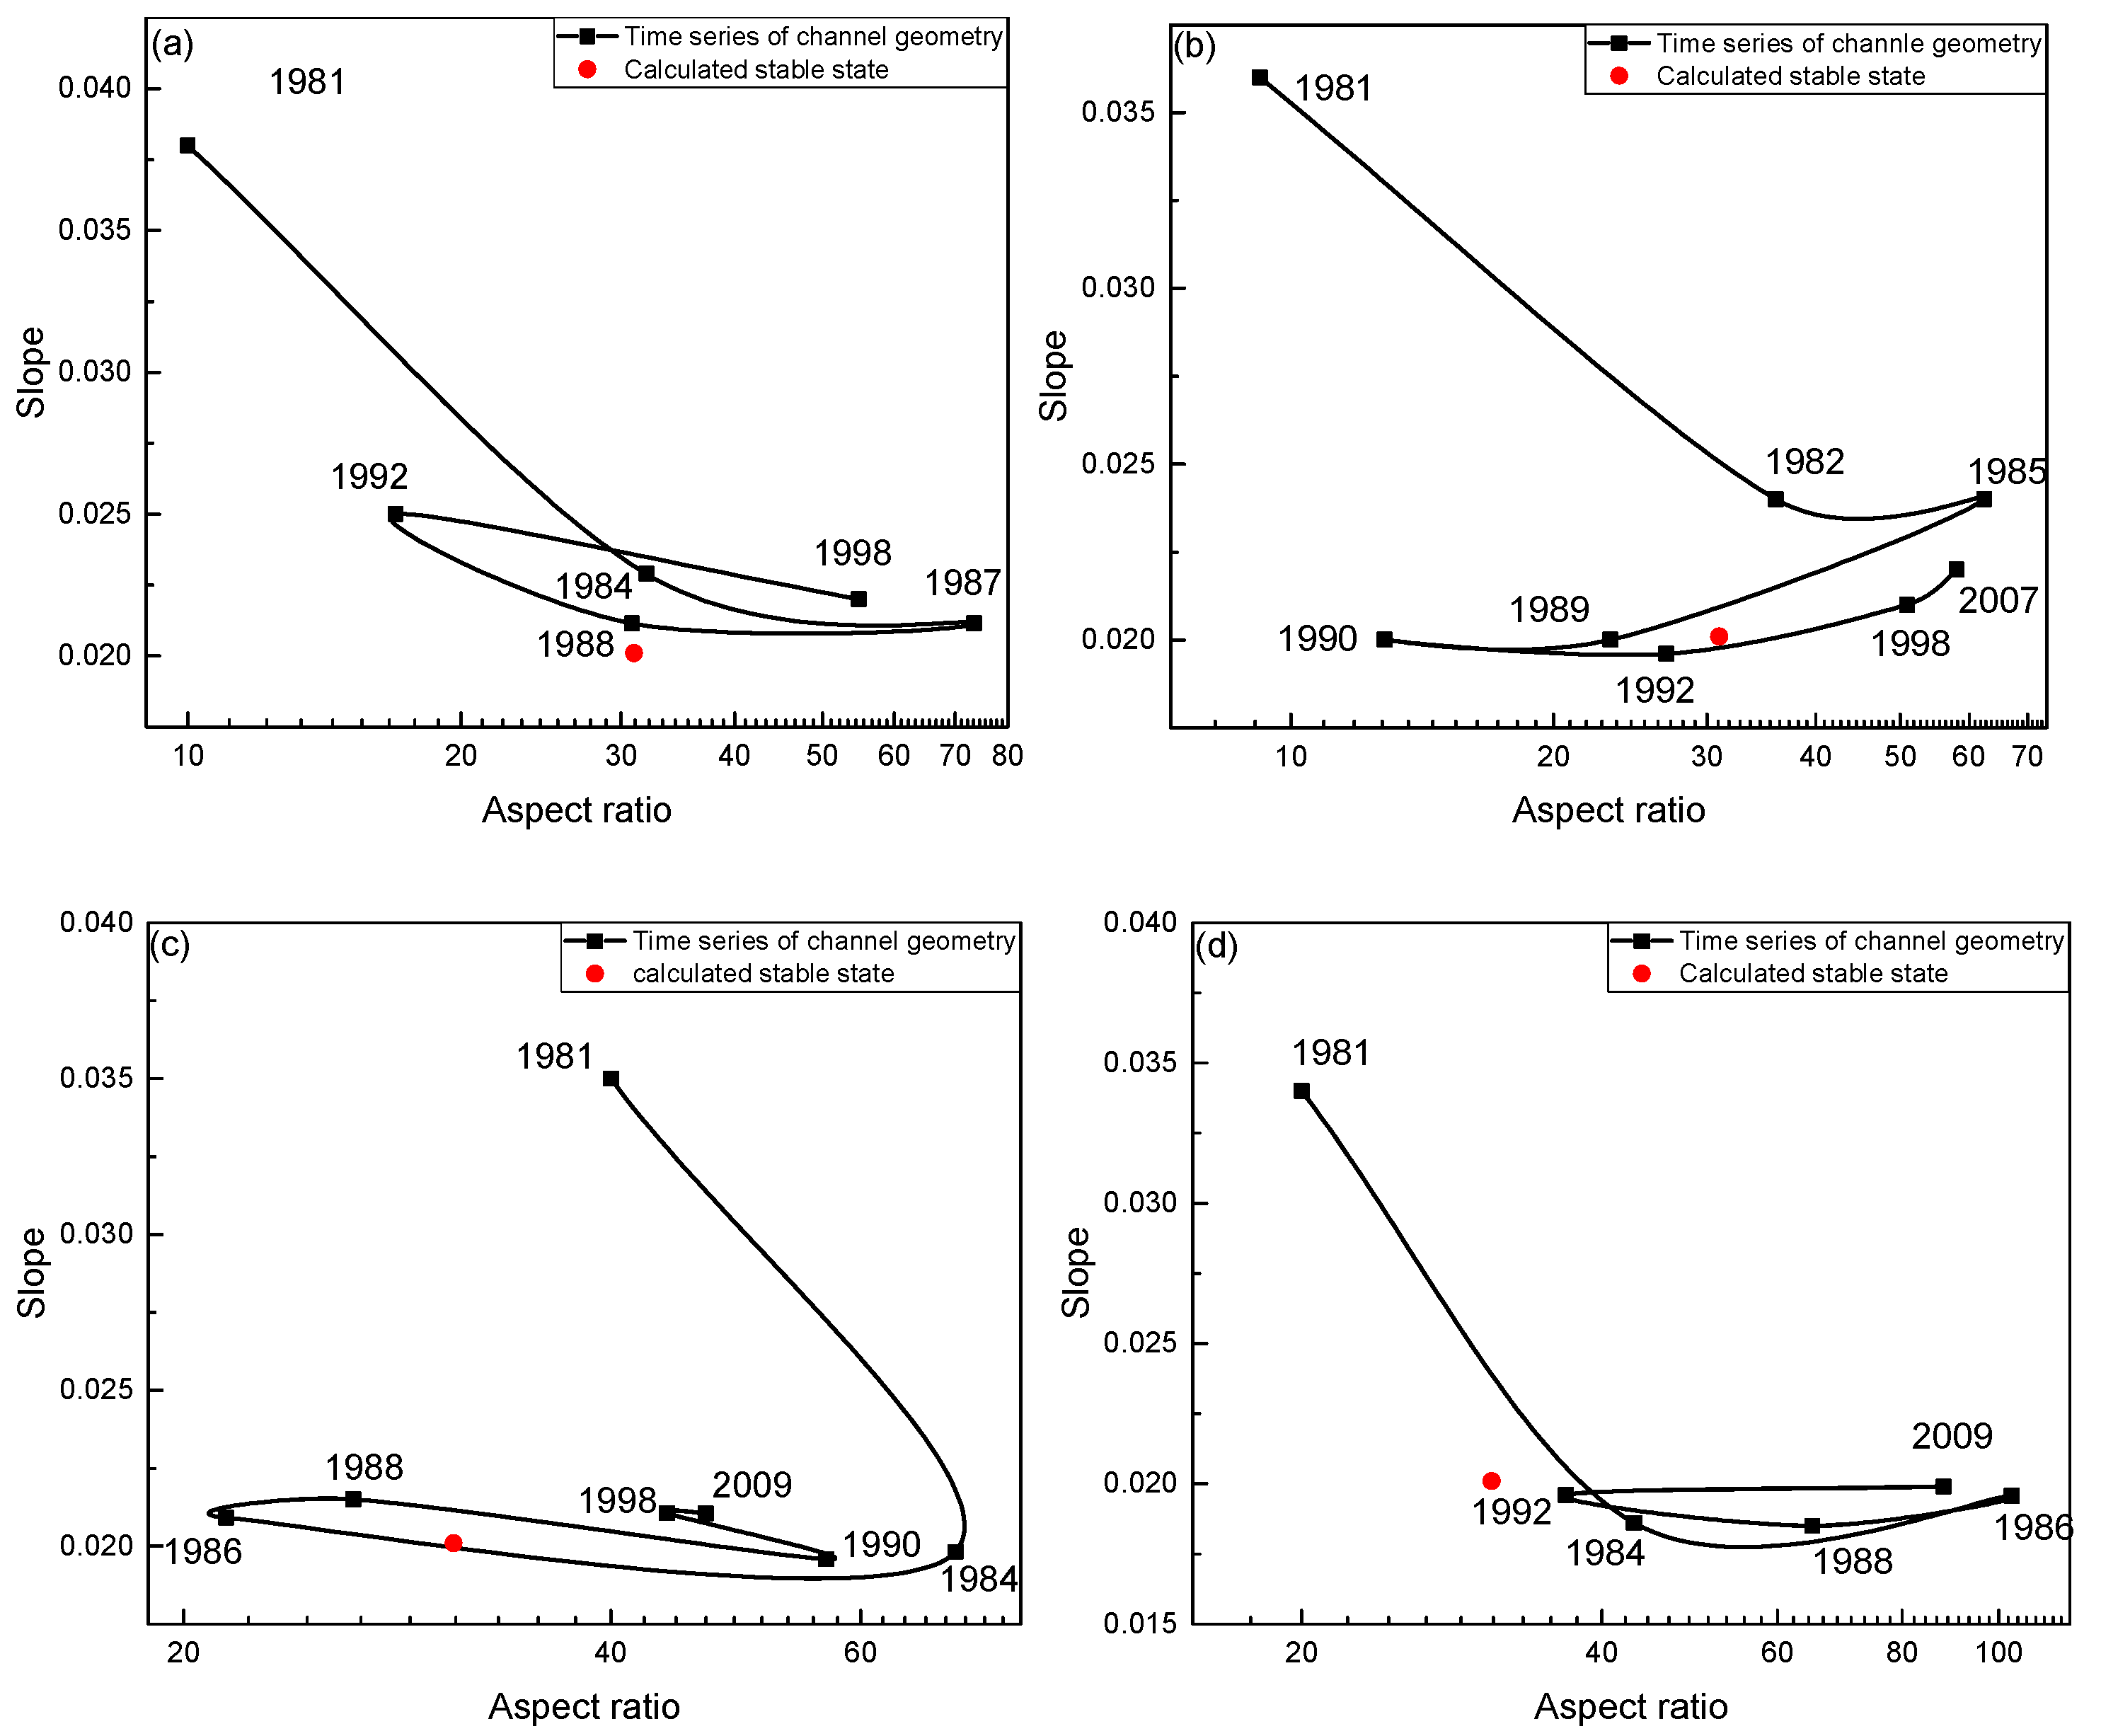
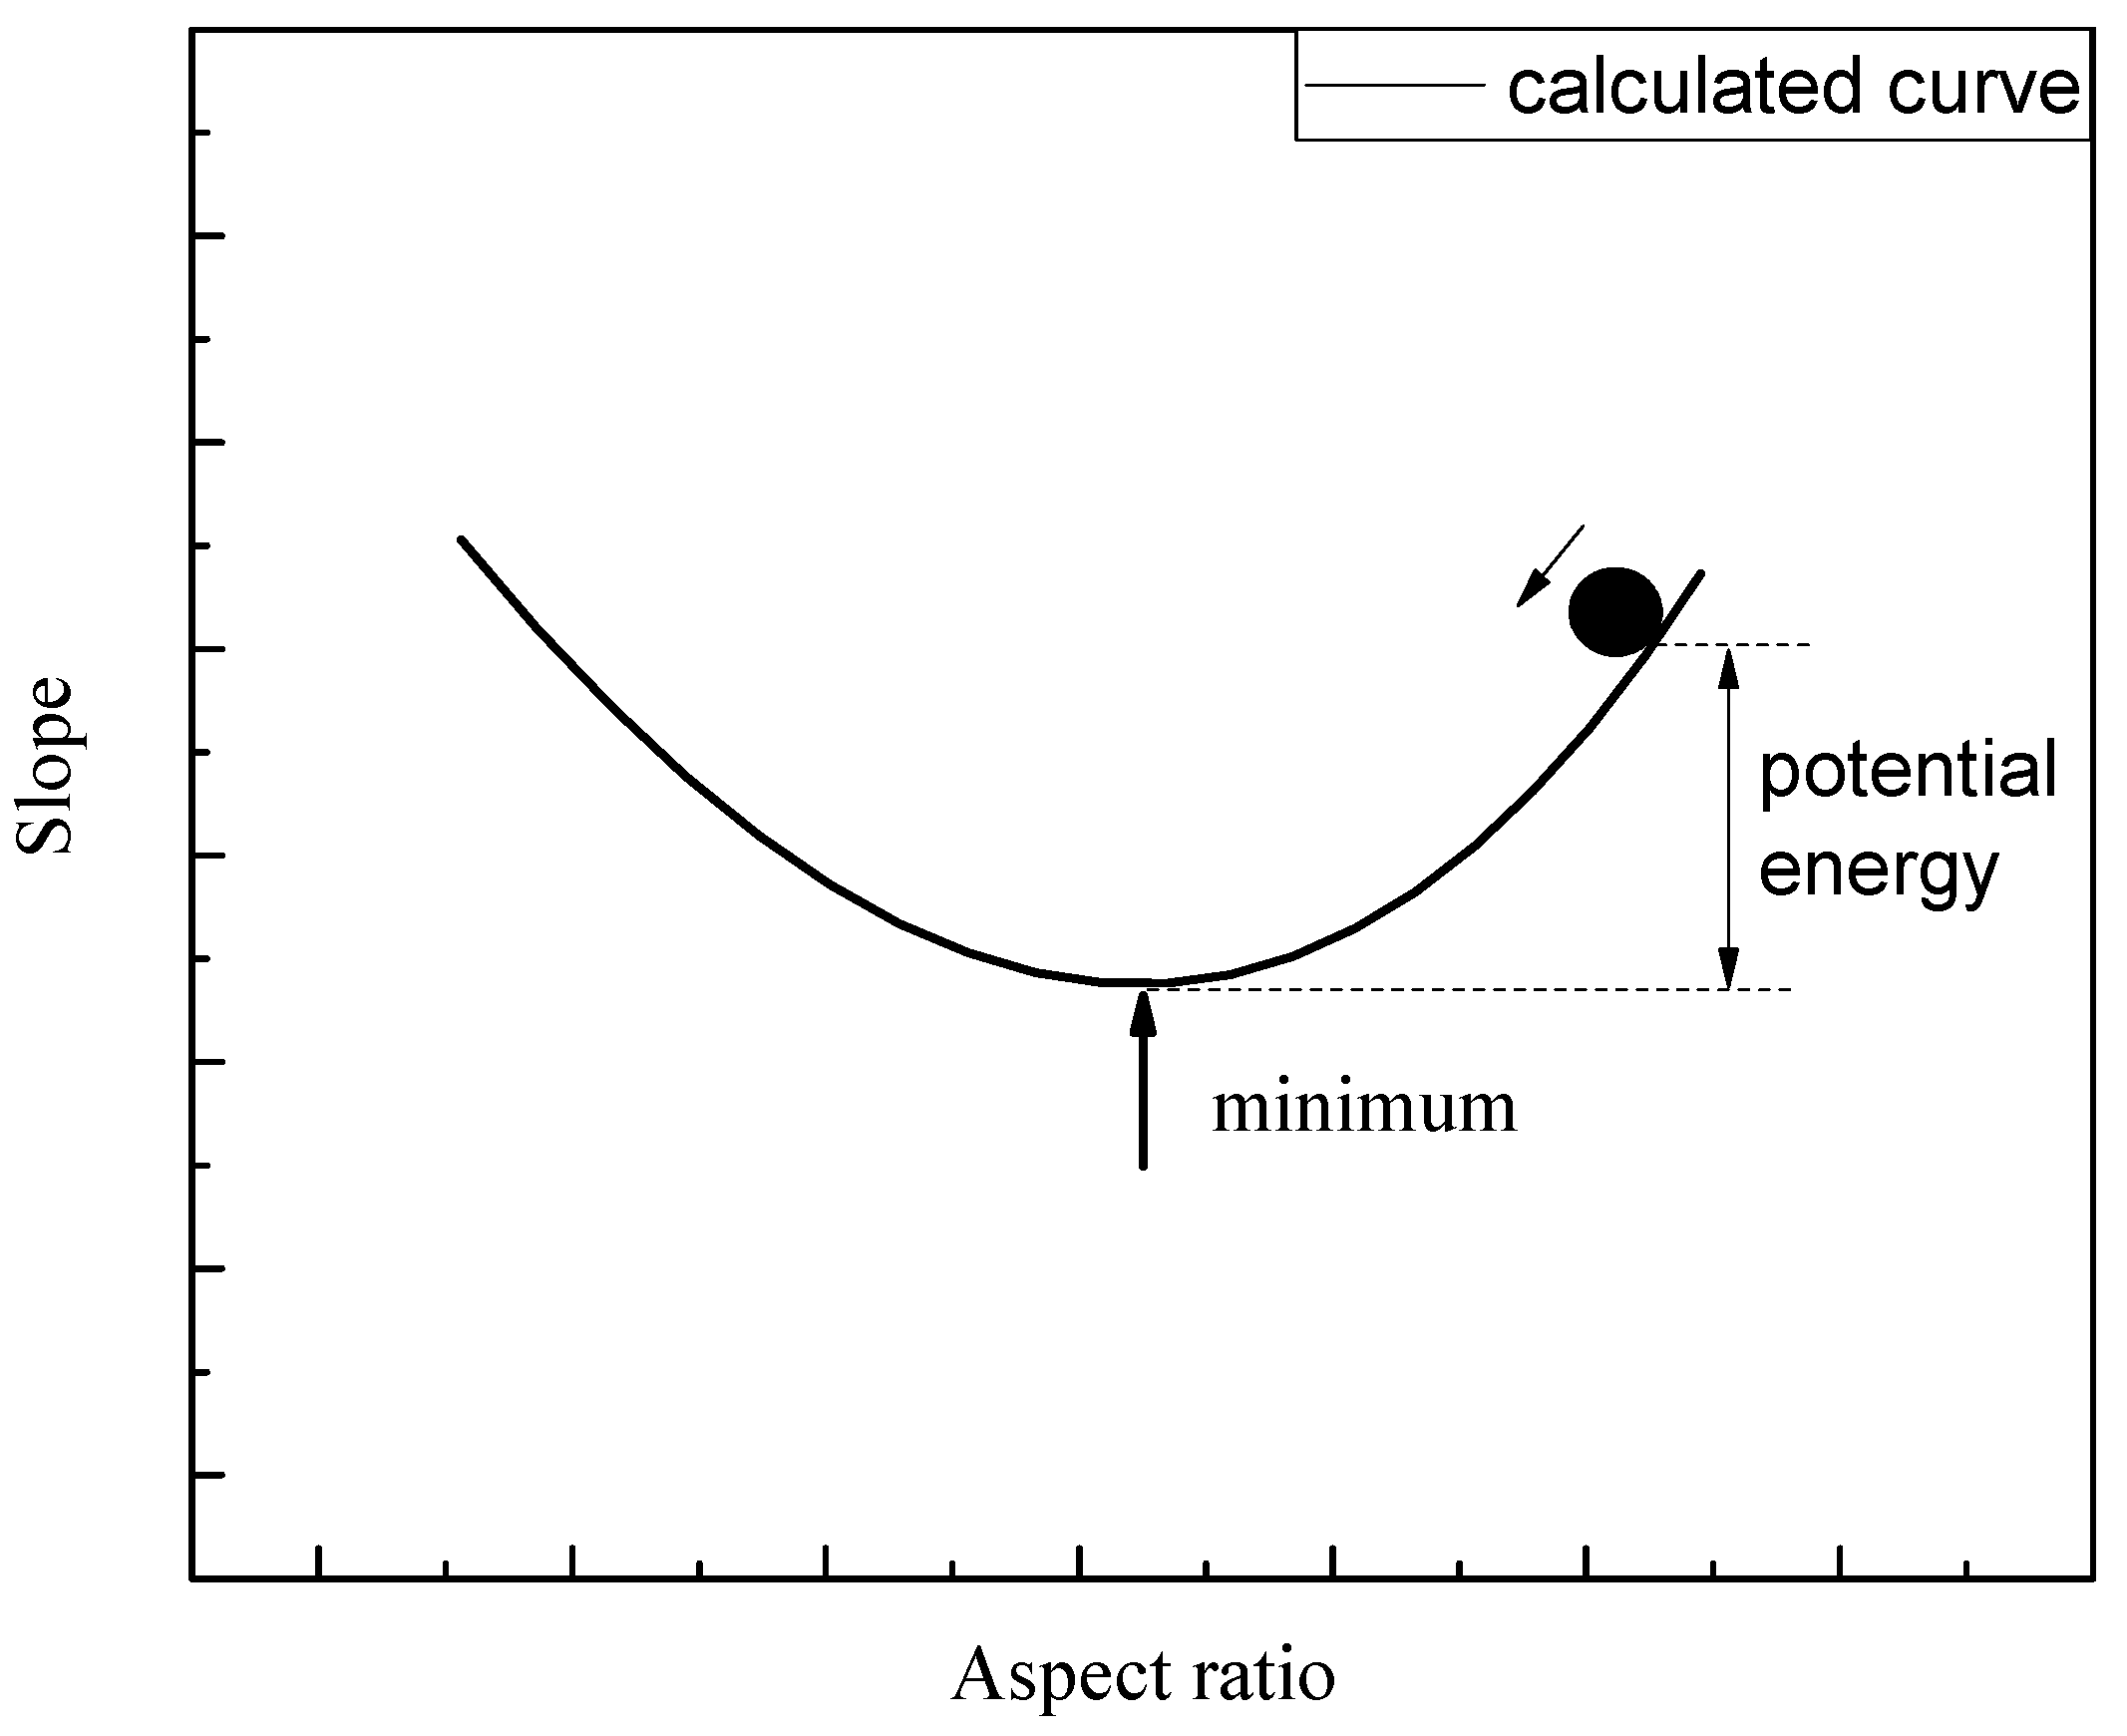
4.3. Application of the Downstream Hydraulic Geometry to Channel Adjustment Processes
5. Conclusions
Author Contributions
Funding
Acknowledgments
Conflicts of Interest
References
- Wang, W.; Godard, V.; Liu-Zeng, J.; Scherler, D.; Xu, C.; Zhang, J.; Xie, K.; Bellier, O.; Ansberque, C.; de Sigoyer, J.; et al. Perturbation of fluvial sediment fluxes following the 2008 Wenchuan earthquake. Earth Surf. Proc. Land. 2017, 42, 2611–2622. [Google Scholar] [CrossRef]
- Fan, N.N.; Nie, R.H.; Wang, Q.; Liu, X.N. Dramatic undercutting of piedmont rivers after the 2008 wenchuan ms 8.0 earthquake. Sci. Rep. 2016, 6, 37108. [Google Scholar] [CrossRef] [PubMed] [Green Version]
- Schumm, S.A.; Harvey, M.D.; Watson, C.C. Incised Channels: Morphology, Dynamics, and Control; Water Resources Publications: Littleton, CO, USA, 1984. [Google Scholar]
- Simon, A.; Hupp, C.R. Geomorphic and vegetative recovery processes along modified Tennessee streams: An interdisciplinary approach to disturbed fluvial systems. For. Hydrol. Watershed Manage. 1986, 167, 251–262. [Google Scholar]
- Cluer, B.; Thorne, C.R. A stream evolution model integrating habitat and ecosystem benefits. River Res. Appl. 2014, 30, 135–154. [Google Scholar] [CrossRef]
- Doyle, M.W.; Shields, F.D. Incorporation of bed texture into a channel evolution model. Geomorphology 2000, 34, 291–309. [Google Scholar] [CrossRef]
- Hawley, R.J.; Bledsoe, B.P.; Stein, E.D.; Haines, B.E. Channel evolution model of semiarid stream response to urban-induced hydromodifications. JAWRA J. Am. Water Resour. Assoc. 2012, 48, 722–744. [Google Scholar] [CrossRef]
- Zheng, S.; Thorne, C.R.; Wu, B.S.; Han, S.S. Application of the Stream Evolution Model to a Volcanically Disturbed River: The North Fork Toutle River, Washington State, USA. River Res. Appl. 2017, 33, 937–948. [Google Scholar] [CrossRef]
- Simon, A. Energy, time, and channel evolution in catastrophically disturbed fluvial systems. Geomorphology 1992, 5, 345–372. [Google Scholar] [CrossRef]
- Simon, A.; Thorne, C.R. Channel adjustment of an unstable coarse-grained stream: Opposing trends of boundary and critical shear stress, and the applicability of extremal hypotheses. Earth Surf. Proc. Land. 1996, 21, 155–180. [Google Scholar] [CrossRef]
- Kasai, M. Channel processes following land use changes in a degrading steep headwater stream in North Island, New Zealand. Geomorphology 2006, 81, 421–439. [Google Scholar] [CrossRef]
- Leon, C.; Julien, P.Y.; Baird, D.C. Case study: Equivalent widths of the middle Rio Grande, New Mexico. J. Hydraul. Eng. 2009, 135, 306–315. [Google Scholar] [CrossRef] [Green Version]
- Wu, B.S.; Zheng, S.; Thorne, C.R. A general framework for using the rate law to simulate morphological response to disturbance in the fluvial system. Prog. Phys. Geogr. 2012, 36, 575–597. [Google Scholar] [CrossRef]
- Zheng, S.; Wu, B.S.; Thorne, C.R.; Simon, A. Morphological evolution of the North Fork Toutle River following the eruption of Mount St. Helens, Washington. Geomorphology 2014, 208, 102–116. [Google Scholar] [CrossRef]
- Biedenharn, G. Toutle-Cowlitz River Sediment Budget; US Army Corps of Engineers Portland District: Portland, OR, USA, 2010. [Google Scholar]
- Janda, R.J.; Meyer, D.F.; Childers, D. Sedimentation and geomorphic changes during and following the 1980–1983 eruptions of Mount St. Helens, Washington (1). J. Jpn. Soc. Eros. Control. Eng. 1984, 37, 10–23. [Google Scholar]
- Meyer, D.F.; Martinson, H.A. Rates and Processes of Channel Development and Recovery Following the 1980 Eruption of Mount St. Helens, Washington. Hydrol. Sci. J. 1987, 34, 115–127. [Google Scholar] [CrossRef]
- Simon, A. Channel and Drainage-basin Response of the Toutle River System in the Aftermath of the 1980 Eruption of Mount St. Helens, Washington, USA Geological Survey Open-file Report; USA Geological Survey: Washington, DC, USA, 1999; p. 99-633. [Google Scholar]
- U.S. Army Corps of Engineers. Cowlitz River Basin Water Year 2002 Hydrologic Summary: Mount St. Helens, Washington, Toutle River and North FORK Toutle River; U.S. Army Corps of Engineers: Wilmington District, DE, USA, 2003.
- Major, J.J.; Mark, L.E. Peak flow responses to landscape disturbances caused by the cataclysmic 1980 eruption of Mount St. Helens, Washington. Geol. Soc. Am. Bull. 2006, 118, 938–958. [Google Scholar] [CrossRef]
- Wong, M.; Parker, G. Reanalysis and Correction of Bed-Load Relation of Meyer-Peter and Müller Using Their Own Database. J. Hydraul. Eng. 2006, 132, 1159–1168. [Google Scholar] [CrossRef] [Green Version]
- Huang, H.Q.; Nanson, G.C. Hydraulic geometry and maximum flow efficiency as products of the principle of least action. Earth Surf. Process. Landf. 2000, 25, 1–16. [Google Scholar] [CrossRef]
- Huang, H.Q.; Chang, H.H.; Nanson, G.C. Minimum energy as the general form of critical flow and maximum flow efficiency and for explaining variations in river channel pattern. Water Resour. Res. 2004, 40, 1–13. [Google Scholar] [CrossRef]
- Nanson, G.C.; Huang, H.Q. Least action principle, equilibrium states, iterative adjustment and the stability of alluvial channels. Earth Surf. Proc. Land. 2008, 33, 923–942. [Google Scholar] [CrossRef] [Green Version]
- Simon, A.; Klimetz, D. Analysis of Long-Term Sediment Loadings from the Upper North Fork Toutle River System, Mount St. Helens, Washington; National Sedimentation Laboratory Technical Report Number 77; U.S. Department of Agriculture: Washington, DC, USA, 2012. [Google Scholar]
- Słowik, M.; Dezso, J.; Marciniak, A.; Toth, G.; Kovacs, J. Evolution of river planforms downstream of dams: Effect of dam construction or earlier humaninduced changes? Earth Surf. Proc. Land. 2019, 43, 2045–2063. [Google Scholar] [CrossRef]
- Gierszewski, P.J.; Habel, M.; Szmanda, J.B.; Luc, M. Evaluating effects of dam operation on flow regimes and riverbed adaptation to those changes. Sci. Total Environ. 2020, 710, 136202. [Google Scholar] [CrossRef] [PubMed]
- Szmanda, J.B.; Gierszewski, P.J.; Habel, M.; Luc, M.; Witkowski, K.; Bortnyk, S.; Obodovskyi, O. Response of the Dnieper river fluvial system to the river erosion caused by the operation of the Kaniv hydro-electric power plant (Ukraine). Catena 2021, 202, 105265. [Google Scholar] [CrossRef]
- Knighton, D. Fluvial Forms and Processes: A New Perspective; Arnold Hodder Headline, PLC: London, UK, 1998. [Google Scholar]
- Darby, S.E.; Thorne, C.R. Discussion: Effect of bank stability on geometry of gravel rivers by Millar and Quick. J. Hydraul. Eng. 1995, 121, 382–384. [Google Scholar] [CrossRef]


| Site | Distance from NF105 (km) | 1980 D50 (mm) | 1991–1992 D50 (mm) | Initial Vertical Adjustment |
|---|---|---|---|---|
| NF105 | 0 | - | - | Degradation |
| NF110 | 1.42 | - | - | Degradation |
| NF120 | 4.63 | 0.9 | 15.6 | Degradation |
| NF125 | 5.53 | - | - | Degradation |
| NF130 | 7.59 | 0.9 | 25.9 | Degradation |
| NF300 | 10.87 | - | - | Degradation |
| NF310 | 14.04 | 0.53 | 16.0 | Degradation |
| NF320 | 15.99 | 0.53 | 50.2 | Degradation |
| NF345 | 19.07 | 0.53 | 28.1 | Aggradation |
| NF350 | 19.57 | 0.53 | 32.0 | Aggradation |
| NF375 | 24.73 | - | - | Aggradation |
Publisher’s Note: MDPI stays neutral with regard to jurisdictional claims in published maps and institutional affiliations. |
© 2021 by the authors. Licensee MDPI, Basel, Switzerland. This article is an open access article distributed under the terms and conditions of the Creative Commons Attribution (CC BY) license (https://creativecommons.org/licenses/by/4.0/).
Share and Cite
Wang, X.; Ma, X.; Liu, X. Impacts of Massive Sediment Input on the Channel Geometry Adjustment of Alluvial Rivers: Revisiting the North Fork Toutle River Case. Water 2021, 13, 2802. https://doi.org/10.3390/w13202802
Wang X, Ma X, Liu X. Impacts of Massive Sediment Input on the Channel Geometry Adjustment of Alluvial Rivers: Revisiting the North Fork Toutle River Case. Water. 2021; 13(20):2802. https://doi.org/10.3390/w13202802
Chicago/Turabian StyleWang, Xiaofan, Xudong Ma, and Xingnian Liu. 2021. "Impacts of Massive Sediment Input on the Channel Geometry Adjustment of Alluvial Rivers: Revisiting the North Fork Toutle River Case" Water 13, no. 20: 2802. https://doi.org/10.3390/w13202802
APA StyleWang, X., Ma, X., & Liu, X. (2021). Impacts of Massive Sediment Input on the Channel Geometry Adjustment of Alluvial Rivers: Revisiting the North Fork Toutle River Case. Water, 13(20), 2802. https://doi.org/10.3390/w13202802