Article

Multivariate Statistical Analysis of Water Quality and Trophic State in an Artificial Dam Reservoir

Department of Bioscience and Biotechnology, Chungnam National University, Daejeon 34134, Korea
*
Author to whom correspondence should be addressed.
Water 2021, 13(2), 186; https://doi.org/10.3390/w13020186
Submission received: 9 November 2020 / Revised: 21 December 2020 / Accepted: 10 January 2021 / Published: 14 January 2021
(This article belongs to the Special Issue Assessing Water Quality by Statistical Methods)

Abstract

:
Paldang Reservoir, located in the Han River basin in South Korea, is used for drinking water, fishing, irrigation, recreation, and hydroelectric power. Therefore, the water quality of the reservoir is of great importance. The main objectives of this study were to evaluate spatial and seasonal variations of surface water quality in the reservoir using multivariate statistical techniques (MSTs) along with the Trophic State Index (TSI) and Trophic State Index deviation (TSID). The empirical relationships among nutrients (total phosphorus, TP; total nitrogen, TN), chlorophyll-a (CHL-a), and annual variations of water quality parameters were also determined. To this end, 12 water quality parameters were monitored monthly at five sites along the reservoir from 1996 to 2019. Most of the parameters (all except pH, dissolved oxygen (DO), and total coliform bacteria (TCB)) showed significant spatial variations, indicating an influence of anthropogenic activities. Principal component analysis combined with factor analysis (PCA/FA) suggested that the parameters responsible for water quality variations were primarily correlated with nutrients and organic matter (anthropogenic), suspended solids (both natural and anthropogenic), and ionic concentrations (both natural and anthropogenic). Stepwise spatial discriminant analysis (DA) identified water temperature (WT), DO, electrical conductivity (EC), chemical oxygen demand (COD), the ratio of biological oxygen demand (BOD) to COD (BOD/COD), TN, TN:TP, and TCB as the parameters responsible for variations among sites, and seasonal stepwise DA identified WT, BOD, and total suspended solids (TSS) as the parameters responsible for variations among seasons. COD has increased (R2 = 0.63, p < 0.01) in the reservoir since 1996, suggesting that nonbiodegradable organic loading to the water body is rising. The empirical regression models of CHL-a-TP (R2 = 0.45) and CHL-a-TN (R2 = 0.27) indicated that TP better explained algal growth than TN. The mean TSI values for TP, CHL-a, and Secchi depth (SD) indicated a eutrophic state of the reservoir for all seasons and sites. Analysis of TSID suggested that blue-green algae dominated the algal community in the reservoir. The present results show that a significant increase in algal chlorophyll occurs during spring in the reservoir. Our findings may facilitate the management of Paldang Reservoir.

1. Introduction

Although water is indispensable to life, it is one of the most threatened resources worldwide [1]. Clean and safe freshwater is a basic need for human health and economic development, but anthropogenic activities like industrialization, urbanization, and intensive agricultural farming have negatively impacted freshwater sources, hindering their use for drinking, irrigation, fishing, recreational, domestic, and industrial purposes [2,3,4,5]. Therefore, serious attention should be paid to protect freshwater resources. Among these, reservoirs are the most vulnerable due to high loads of pollutants, nutrients, organic matter, and suspended solids from the watershed [6,7]. For effective water management, gathering reliable information on reservoir water quality, evaluating spatial and seasonal water quality changes, detecting pollution sources, determining water quality status, and controlling water pollution in reservoirs are essential [1,3,8,9,10,11].
To assess the water quality of surface water resources, MSTs, TSI, and TSID have been widely used, and therefore have played a significant role in water resource management [2,9,11,12]. Multivariate statistical methods, such as discriminant analysis (DA), principal component analysis (PCA), factor analysis (FA), correlation analysis, and analysis of variance (ANOVA) facilitate the interpretation of complex water quality datasets [1,13,14]. These methods are also used to identify factors that influence surface water quality, serving as a valuable tool for effective surface water quality management [2,11]. These approaches can be used to evaluate temporal and spatial changes in surface water quality caused by natural and anthropogenic factors [2].
However, MSTs have some limitations when used alone [2]. Therefore, applying MSTs, TSI, and TSID in combination can be advantageous for assessing the water quality of reservoirs. To date, a few studies have used MSTs, TSI, and TSID together for surface water quality assessment of reservoirs [2,15]. The TSI and TSID were used to quantify the degree of eutrophication of a water body. Carlson [12] proposed a quantitative index to calculate the degree of eutrophication in lakes and reservoirs based on total phosphorus (TP), chlorophyll-a (CHL-a), and Secchi depth (SD). According to Carlson and others, TP is the best forecaster of algal growth, while CHL-a is the most reliable algal biomass indicator, and SD is the best proxy for water clarity in water bodies [4,16,17,18]. Moreover, TSI and TSID are used to evaluate spatial and seasonal changes in the water quality of reservoirs, and thereby provide useful information for reservoir management [19,20].
Seasonal rainfall patterns, hydrology, and watershed morphology are the major factors known to regulate water quality within a watershed [21]. These factors are closely related to the ecosystem’s nutrient regime, water clarity, and algal growth. Rainfall is directly linked to inflow, outflow, depth, and water residence time (WRT), which control nutrient and suspended solids loads to the water body [22,23]. Empirical evidence suggests that phosphorus (P) is the key factor limiting CHL-a growth in freshwater systems [4,17,19]. Excessive concentrations of nutrients, especially P, may accelerate algal growth and cause eutrophication in reservoirs [24]. Total suspended solids are a potential source of P and play an essential role in the P cycle in reservoirs [2].
Paldang Reservoir is one of the largest reservoirs in South Korea, with a water volume of 255 × 106 m3 and a surface area of 28.9 km2 [25,26]. The maximum depth of water at full supply level is 21 m, and the mean depth is 8.3 m [25]. It is a manmade lake formed after the construction of a hydroelectric dam in 1973 and is located in the central Korean Peninsula [25]. Paldang Reservoir has been used for fishing, irrigation, recreation, hydroelectric power, and drinking water purposes. Additionally, it serves as an essential water resource for people living in the Seoul metropolitan area and surrounding cities [26]. More than 24 million people (48% of the Korean population) rely on the Paldang Reservoir for drinking water [27]. Therefore, the water quality of the reservoir is of great importance to Korea. However, human activities in the watershed have increased, resulting in significant pollution problems in the reservoir. Urbanization, domestic and industrial wastewater discharge, intensive agricultural activities, waste from animal farms, and inflowing rivers are all major sources of water pollution in the reservoir [27,28,29].
For these reasons, comprehensive water quality assessments of the reservoir are needed. The purposes of the present study are to (1) determine the spatial and seasonal variations of water quality parameters and identify the key factors affecting water quality in the reservoir using MSTs, (2) assess the trophic status of the reservoir using TSI and TSID, (3) determine how water quality parameters are correlated with hydrology, and (4) develop empirical models of the CHL-a-TP, CHL-a-TN, TSS-TP, and TSS-TN in the reservoir. Thus, this study will assess the current status of water quality and aid the development of effective management and conservation strategies to protect water quality in Paldang Reservoir.

2. Materials and Methods

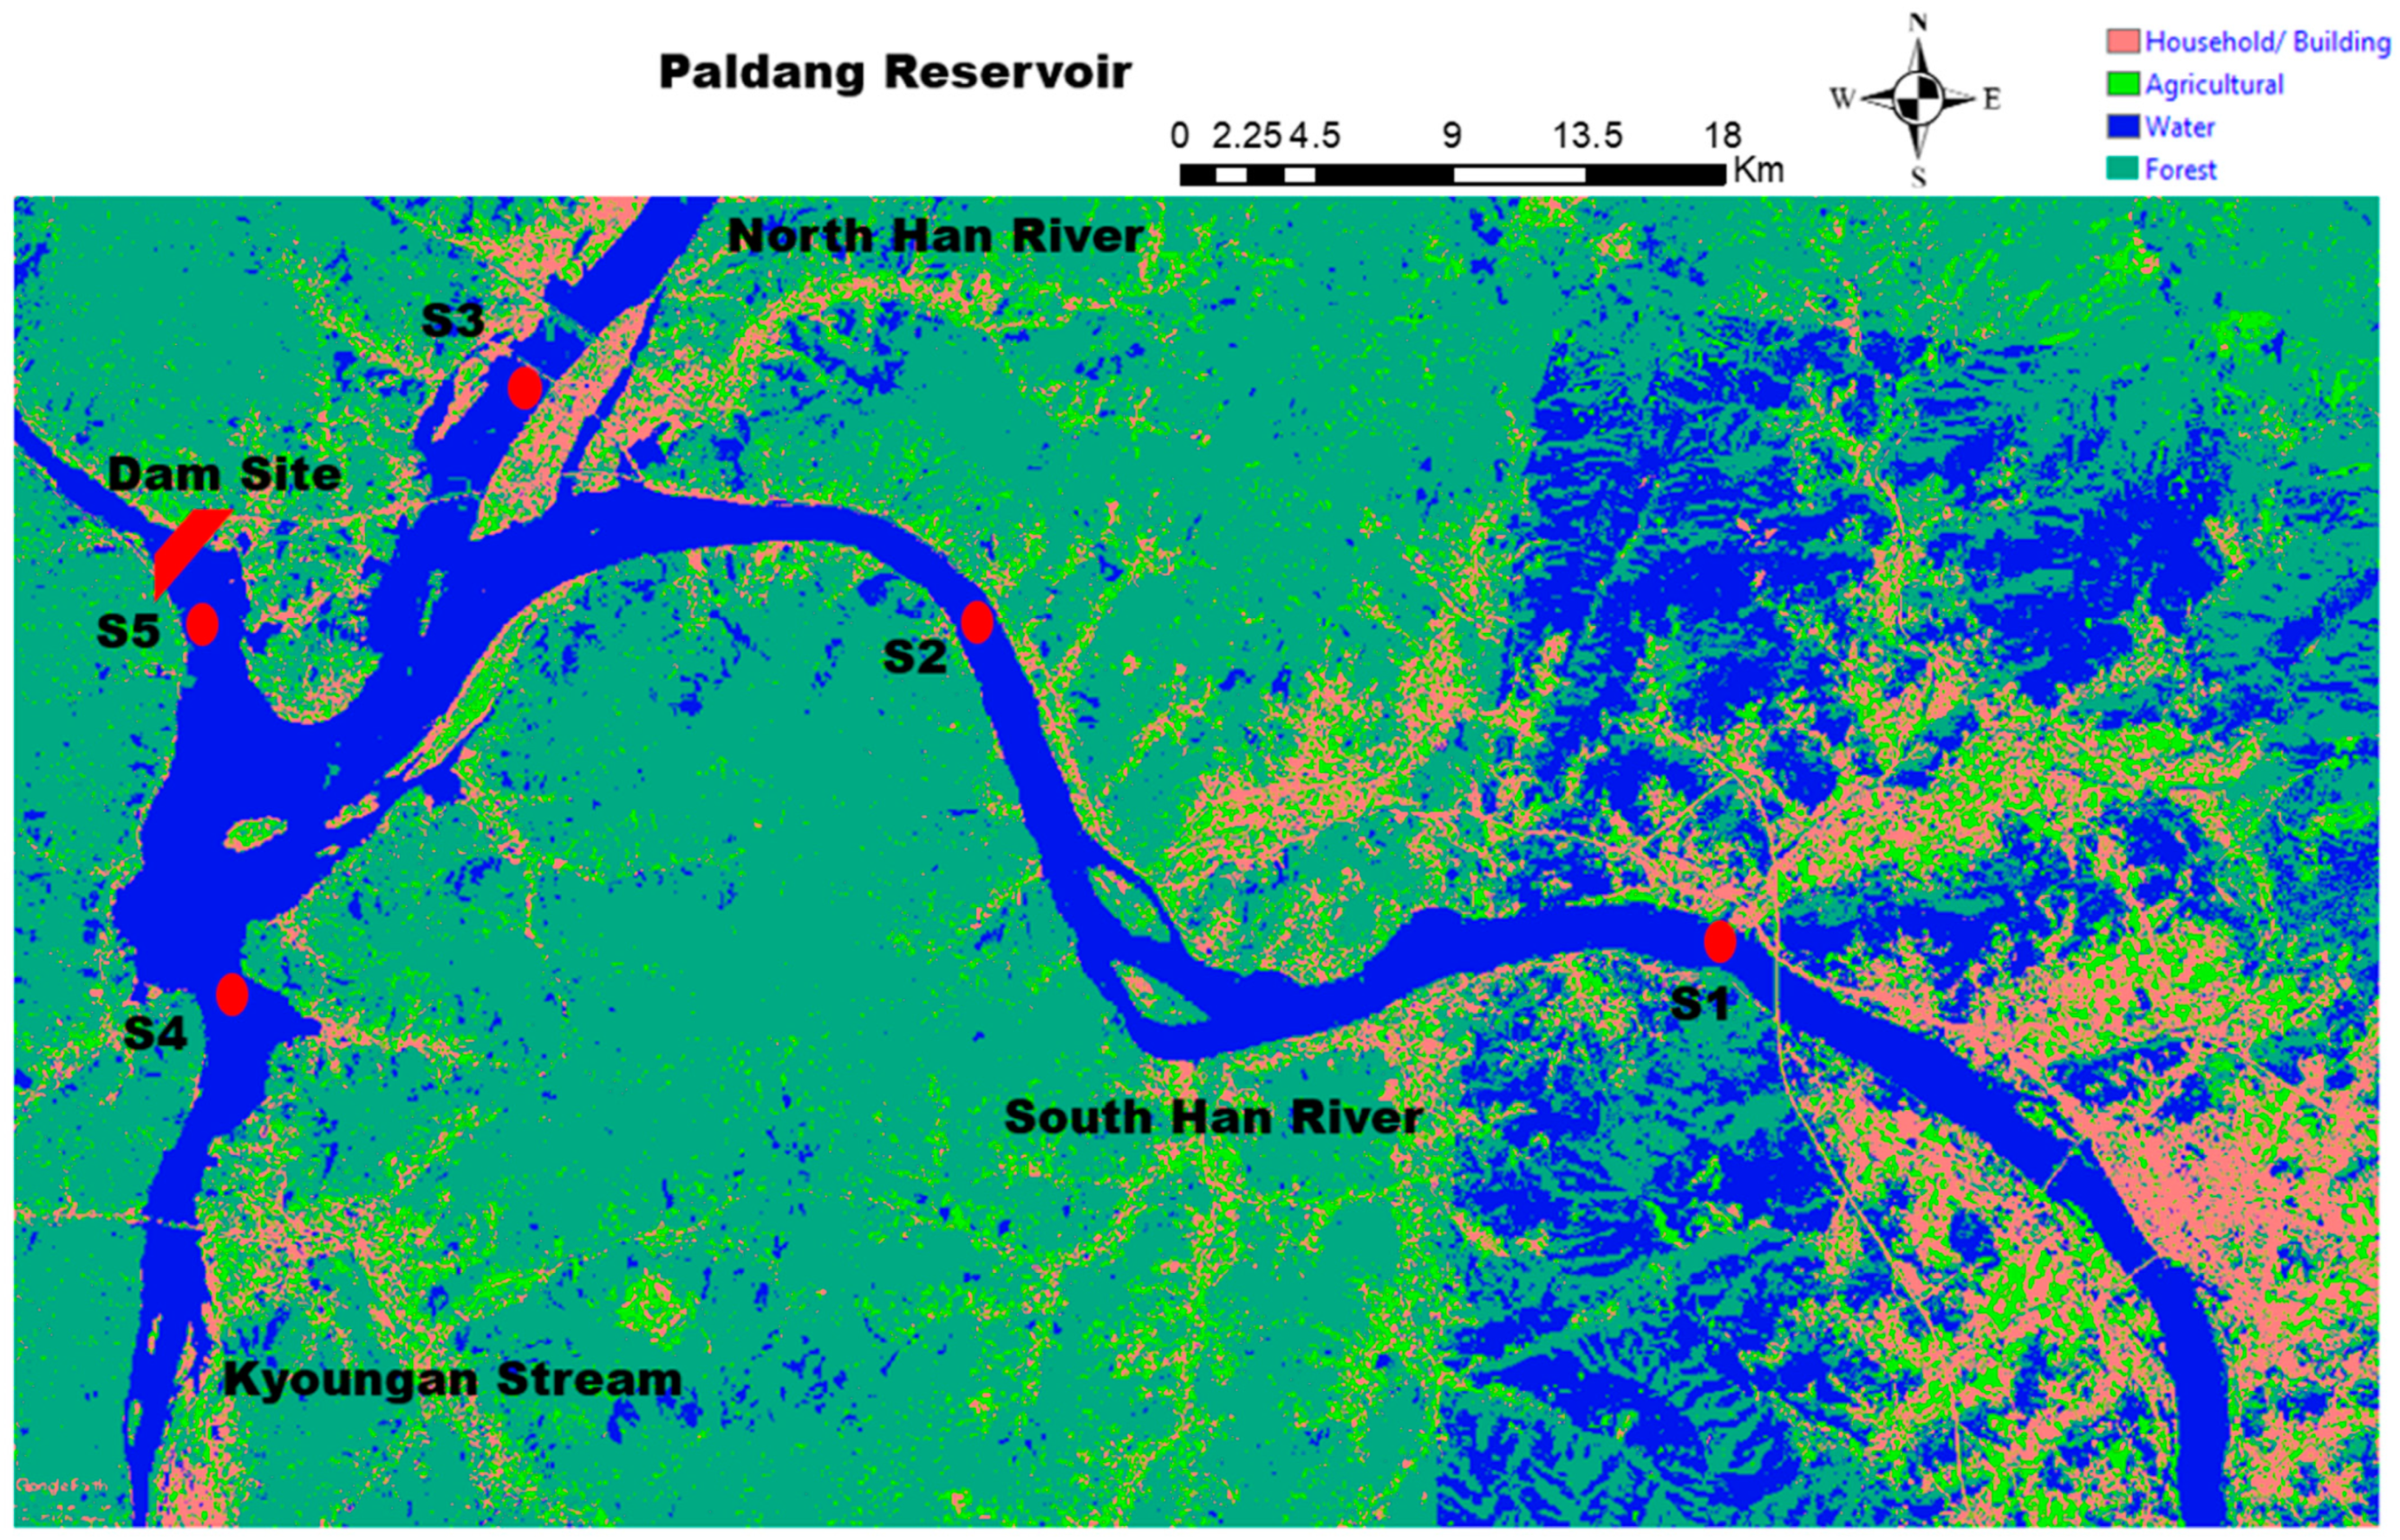
2.1. Study Sites and Water Quality Parameters

Paldang Reservoir is the most downstream reservoir in the Han River system, and is situated at the confluence of the North Han River, South Han River, and Kyoungan Stream (Figure 1; [30]). In this study, five reservoir sampling sites (S1–S5) were selected. Sites 1 and 2 were located in the South Han River part of the reservoir. In contrast, sites 3–5 were located at the North Han River, Kyoungan Stream, and dam, respectively. The water intake tower for Paldang Reservoir is located at S5 (Figure 1). Based on their hydrological characteristics, reservoirs can be divided into two types, namely, lake- and river-type reservoirs. Lake-type reservoirs are generally characterized by high depth and long water WRT, while river-type reservoirs have shallower depths and shorter WRTs [31]. Paldang Reservoir is considered a river-type reservoir due to its shallow depth (mean depth: 8.3 m) and short WRT (3–10 days) [25,32]. Paldang Reservoir does not fully stratify throughout the year [30]. The overall inflow and outflow rates of the reservoir are almost equal, resulting in very small annual water level fluctuations. The annual amount of rainfall and water inflow from the upstream watershed directly influence WRT in Paldang Reservoir [30].
Monthly surface water quality data for the Paldang Reservoir from 1996 to 2019 were obtained from the Ministry of Environment’s national water quality measurement network (http://water.nier.go.kr). Monthly rainfall and inflow and outflow data were collected from the Korean Meteorological Administration and the Korean Water Resource Corporation, respectively. WRT was defined as the reservoir water volume divided by the inflow rate [33]. The loading data for TP, TN, TSS, BOD, and COD were calculated using a conversion factor derived from the corresponding concentrations.

2.2. Trophic State Index and Trophic State Index Deviation

The trophic status of the Paldang Reservoir was determined using Carlson’s TSI. The range of average TSI values designated Oligotrophic is 30–40, Mesotrophic is 40–50, Eutrophic is 50–70, and Hypereutrophic is >70 [18]. The following equations were used to calculate TSI values for the Paldang Reservoir [12]:
TSI (CHL-a, µg L−1) = 10 × [6 − (2.04 − 0.68ln(CHL-a))/ln2]
TSI (TP, µg L−1) = 10 × [6 − ln(48/TP)/ln2]
TSI (SD, m) = 10 × [6 − ln(SD)/ln2]
Using two-dimensional approaches, the TSID was defined using the relationships TSI (CHL-a)-TSI (SD) and TSI (CHL-a)-TSI (TP). This method has also been used frequently to quantify the degree of eutrophication and identify the limiting nutrient in reservoirs [18].

2.3. Statistical Analysis

The Kolmogorov–Smirnov single-sample test was used to examine the distribution of water quality data prior to statistical analyses [1]. One-way ANOVA was performed to determine whether there were significant spatial and seasonal variations in the reservoir’s water quality parameter values. Pearson correlation analysis was used to analyze the relationships between various water quality variables. PCA/FA was conducted to determine the factors and pollution sources affecting the surface water quality [34]. Bartlett’s sphericity test and the Kaiser–Meyer–Olkin (KMO) test were conducted first to determine the suitability of the data for PCA/FA [2]. DA was performed to assess both spatial and temporal variations in water quality and to identify water quality variables that could best distinguish among sites and seasons [11,34]. Standard and stepwise DA was applied to raw data. PCA/FA was applied to experimental data, standardized through Z-scale transformation, to avoid misclassification [2]. SPSS software (version 22.0; SPSS Inc., Chicago, IL, USA) was used for all statistical analyses. Bar, box, and scatter plots were prepared using SigmaPlot 14.0 software (Systat Software, Inc., San Jose, CA, USA). Interpolation of TSI values was conducted using QGIS 3.14 (QGIS Development Team, Gossau, Switzerland). Conditional plotting analysis was carried out with R 3.5.2 (R Development Core Team, Vienna, Austria).

3. Results and Discussion

3.1. Spatial and Seasonal Variations

The mean values of 12 water quality parameters recorded at five sampling sites in Paldang Reservoir are presented in Table 1. In this study, all variables except pH, dissolved oxygen (DO), and total coliform bacteria (TCB) showed significant spatial differences among sites (p < 0.05, Table 1). The spatial variations of these parameters indicate impacts of anthropogenic activities in the reservoir [25,32]. For example, BOD, COD, TSS, TN, TP, and CHL-a concentrations were significantly higher at site S4 than any other site; this site receives inputs from industrial and domestic wastewater [30]. Site S4 in Paldang Reservoir is affected by Kyoungan Stream. The water quality of this tributary stream is worse than that of the South Han River (Sites S1 and S2) and North Han River (Site S3), and thus, it may significantly impact the reservoir’s water quality [25]. Water clarity (SD) was higher at Site S3 than other sites, indicating that the North Han River input is cleaner than the South Han River and Kyoungan Stream inflows [25]. The highest mean electrical conductivity (EC) was recorded at Site S1 due to agricultural activities and untreated household wastewater effluent.
The water quality parameters of the Paldang Reservoir showed significant heterogeneity (p < 0.05) among the four seasons (Table 1). Water temperature (WT), TSS, TP, and TCB exhibited significantly higher values in the summer, whereas pH, EC, BOD, COD, TN, and CHL-a were highest in the spring. TSS and TP concentrations were elevated during the summer due to intense precipitation (Supplementary Figure S1). The summer monsoon significantly influences the hydrology, nutrients, and suspended solids concentration in Korean reservoirs [35]. More intense rainfall contributes to increased TSS in Paldang Reservoir water. The daily loading data also showed that TP, TN, TSS, BOD, and COD were higher during the summer monsoon season than any other season (Supplementary Figure S2). This result supports the view that the summer monsoon is the main driver of high levels of nutrients, organic matter, and suspended solids in mid-latitude East Asian reservoirs, such as those in South Korea, Eastern China, and Japan [36]. The regression equation between TSS and TP indicates that TSS is associated with 45% of TP in Paldang Reservoir (Supplementary Figure S3). This result suggests that TSS may act as a nutrient carrier in the reservoir [37].
Organic matter (BOD and COD) in reservoirs can have either allochthonous or autochthonous origins. Allochthonous organic matter enters aquatic systems mainly via runoff derived from overland water flow during rainfall events, while autochthonous organic matter is produced through photosynthesis by phytoplankton and hydrophytes [32]. As Paldang Reservoir is a river-type reservoir, it experiences high flow rates during the summer season, and large amounts of allochthonous organic matter is introduced into the reservoir. Park et al. [32] showed that 69% of the total organic matter was allochthonous in Paldang Reservoir during the summer season. In contrast, a high autochthonous organic matter load was observed in the winter and spring due to low flow rates and increased WRT [32]. Park et al. [30] revealed that 73% of autochthonous organic matter loading occurs during the spring. The peak organic matter concentration coincides with the maximum production of algae (spring bloom). This finding suggests that autochthonous production by phytoplankton (CHL-a) during the spring period is critical to organic matter buildup in Paldang Reservoir; thus, the threat to the water quality of Paldang Reservoir is greatest in spring [30,32].
In the present study, the water quality status of each sampling site and season was assessed by comparing the mean values of water quality parameters with those listed in the Korean Lakes and Reservoirs Surface Water Quality Regulation, 2015 (Supplementary Table S1). As shown in Table S1, Site S4 had class III water quality (contaminated water), while all other sites had class II water quality (lightly contaminated water) in terms of COD. Based on TSS, all sites fell into the class III water quality category except site S3. Sites S1 and S4 were in the class IV water quality (somewhat poor; contaminated water) in terms of TP. Site S4 had class IV water quality in terms of CHL-a. During spring, algal growth increased in the reservoir, and water quality was somewhat poor (class IV; contaminated water). TP concentrations were higher during summer due to surface runoff, and the water body was in class IV. All sites and seasons had class Ia water quality in terms of pH and DO. Notably, Site S5 (near the water intake tower) was in class III (average; contaminated water) in terms of CHL-a, TSS, and TP.

3.2. Correlation Analysis

Pearson correlation analysis was used to evaluate the relationships among 12 water quality parameters (Supplementary Table S2). As anticipated, DO was negatively associated with WT, as oxygen is more soluble in cold water [1]. High BOD and COD levels indicate organic pollution in the reservoir [34,35]. Increasing nutrient concentrations (TP and TN) lead to elevated organic matter concentrations (BOD and COD) in the reservoir [1,15]. EC showed significant positive relationships with BOD (r = 0.40, p < 0.01), COD (r = 0.59, p < 0.01), and TN (r = 0.55, p < 0.01). TN, TP, and BOD showed strong positive relationships with each other, demonstrating that their sources were analogous. TSS showed a significant positive relationship with TP (r = 0.47, p < 0.01), indicating that suspended particles have a tendency to adsorb P [38]. During rainfall events and stream bank erosion in high-flow periods, agricultural and industrial runoff can contribute to high levels of TSS and TP in the reservoir [38]. CHL-a was positively correlated with TP (r = 0.70, p < 0.01) and TN (r = 0.53, p < 0.01), which are key factors affecting phytoplankton growth in this water body [39]. The reservoir’s water clarity decreased with increase in the TP, TN, CHL-a, TSS, and BOD concentrations.

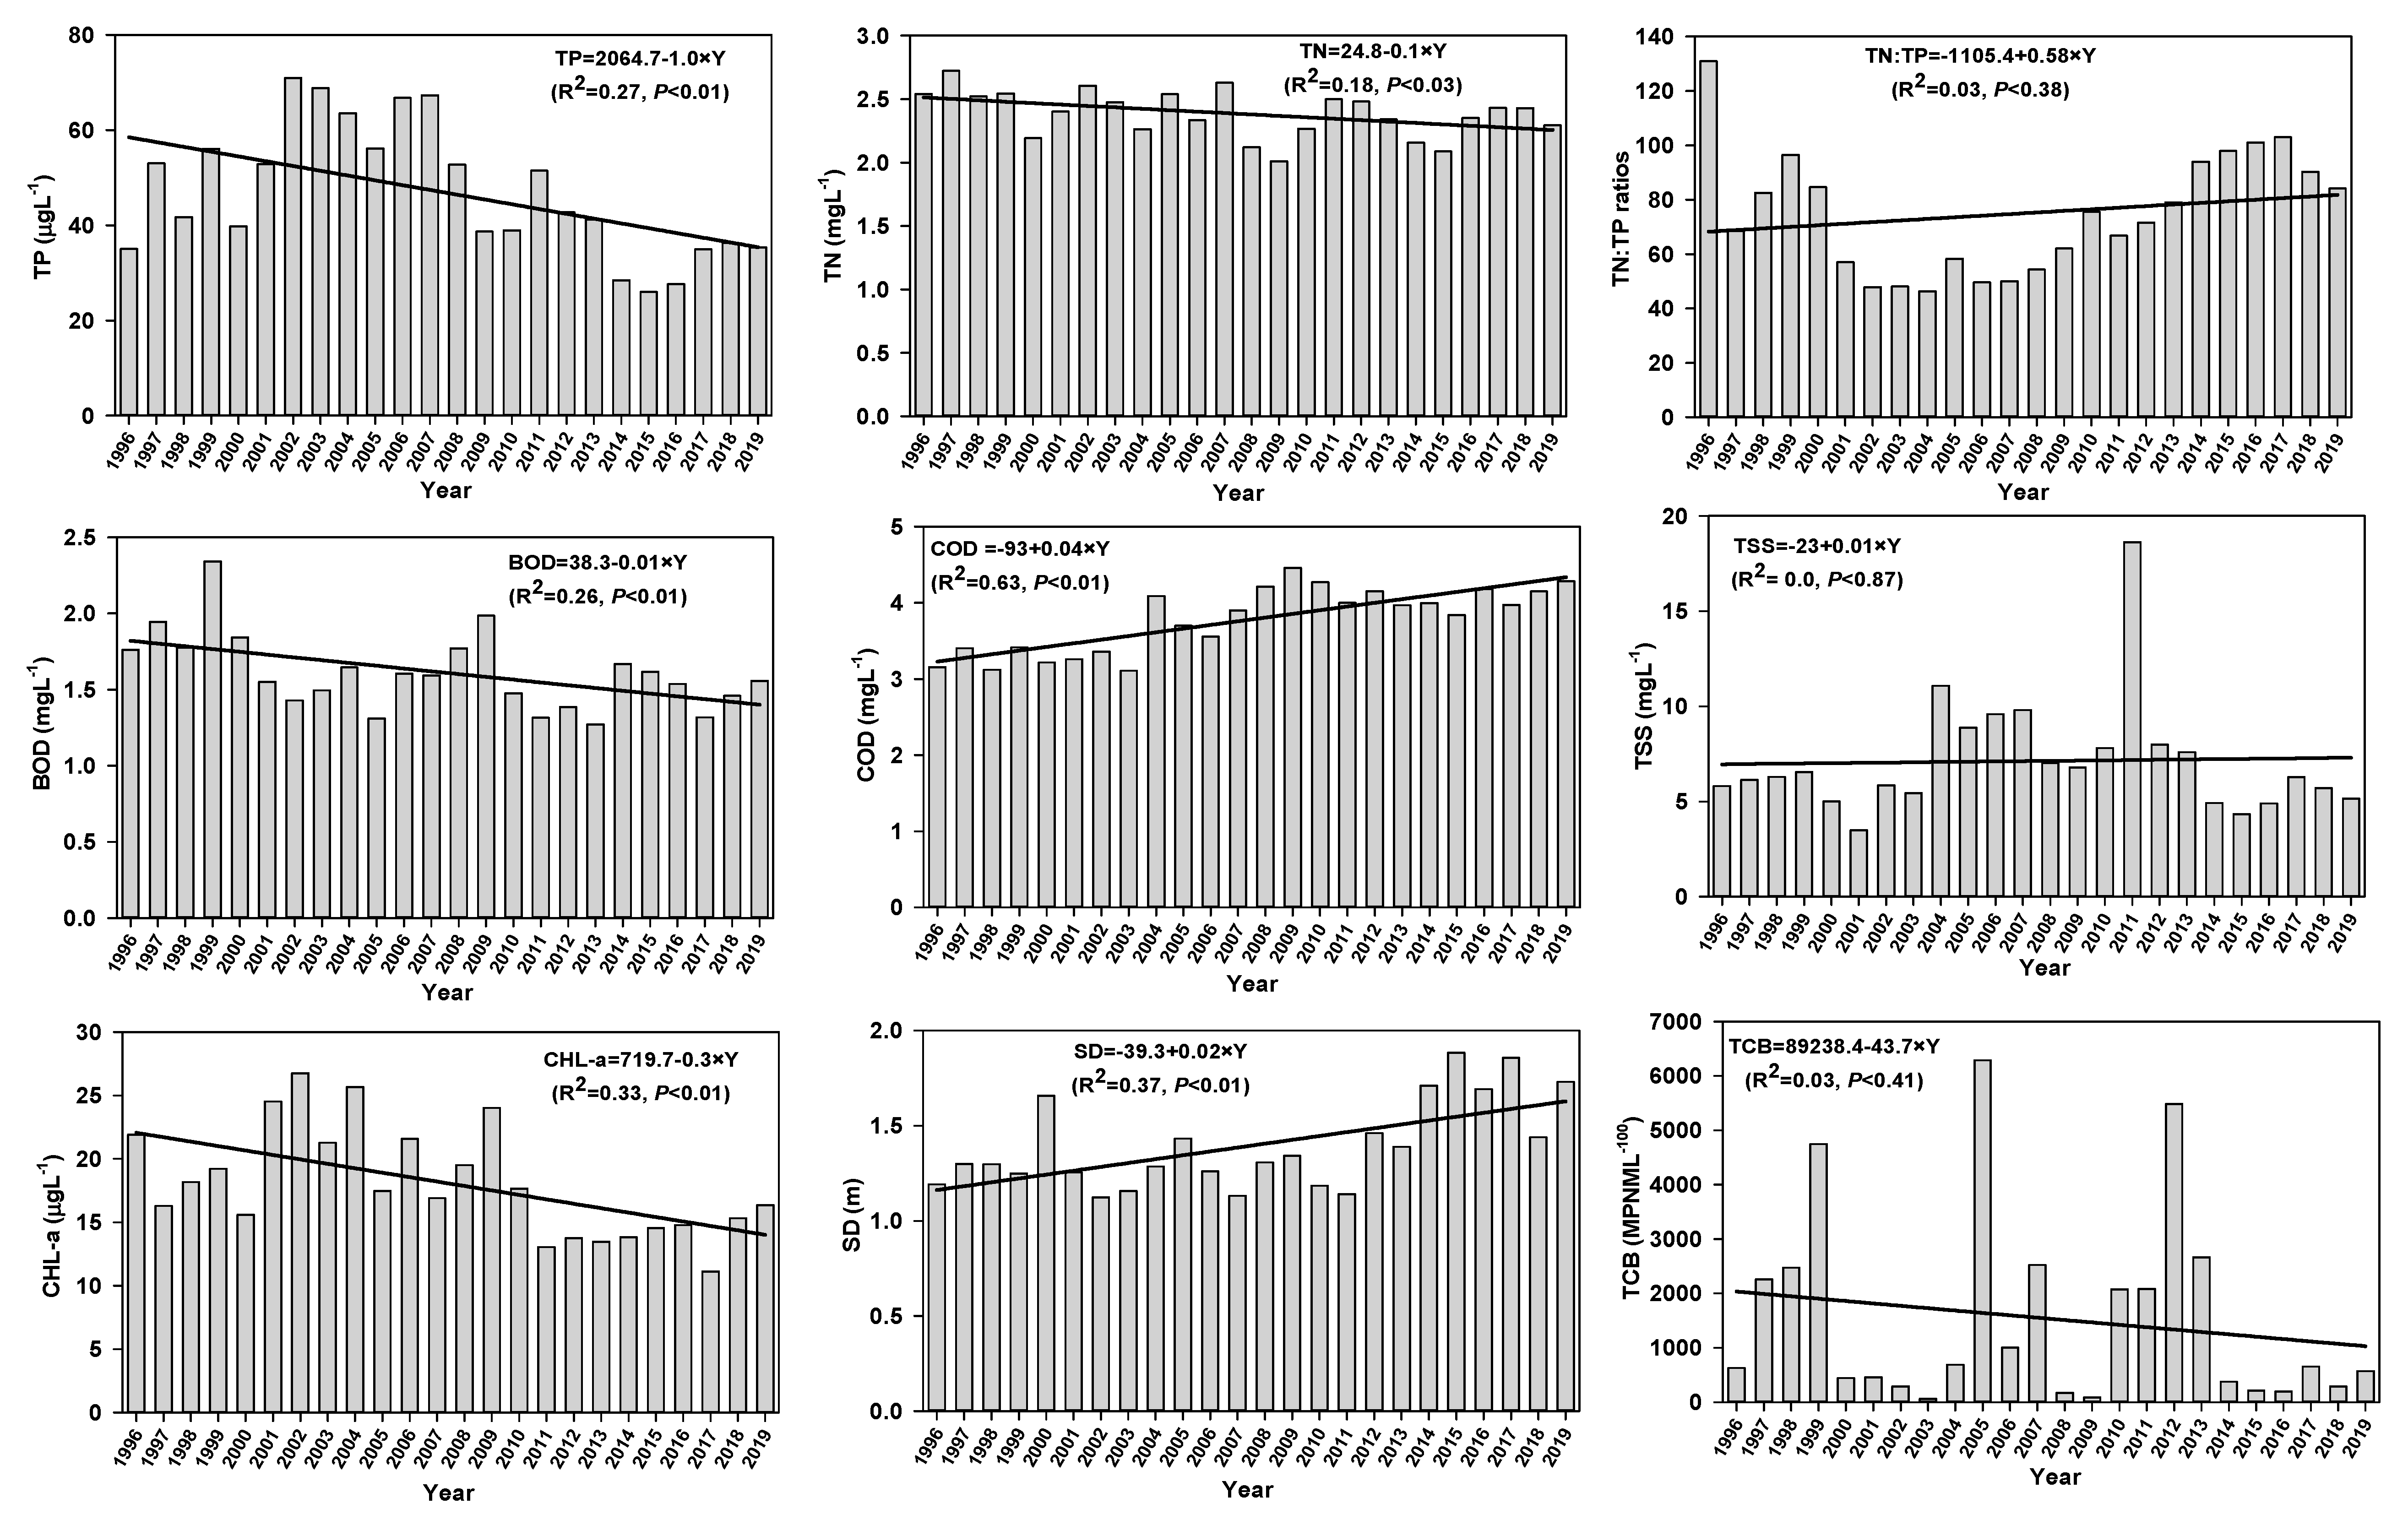
3.3. Annual Variations of Water Quality

Annual data can provide information about long-term water quality dynamics in Paldang Reservoir. The results showed that TP (R2 = 0.27, p < 0.01), BOD (R2 = 0.26, p < 0.01), and CHL-a (R2 = 0.33, p < 0.01) have decreased significantly since 1996 (Figure 2). The loading data for TP (R2 = 0.21, p < 0.02), TN (R2 = 0.19, p < 0.03), and BOD (R2 = 0.35, p < 0.00) also showed a decreasing pattern in Paldang Reservoir (Supplementary Figure S4). COD (R2 = 0.63, p < 0.01) and SD (R2 = 0.37, p < 0.01) have increased in Paldang Reservoir since 1996. Moreover, the loading pattern for COD has changed. BOD concentrations in most Korean lakes and reservoirs are continuously decreasing, while COD concentrations have been increasing in most cases, indicating that high concentrations of nonbiodegradable organic matter in the influent may be inefficiently degraded by the biological effluent treatment process [30,40]. COD represents both biodegradable and nonbiodegradable organic pollution in water systems. However, increases in the COD level suggest increased nonbiodegradable organic loading from wastewater treatment plants (WWTPs) and urban sewage systems to the water body [41]. A previous study conducted in the United States found an increase in the occurrence and persistence of inorganic solid loading from a WWTP to a water body [42]. Industries may not strictly comply with environmental regulations, and thus may contribute large amounts of nonbiodegradable compounds to aquatic systems [43]. Water quality management strategies in Korean reservoirs likely need to be re-evaluated with a focus on water pollutant management, especially for organic matter.

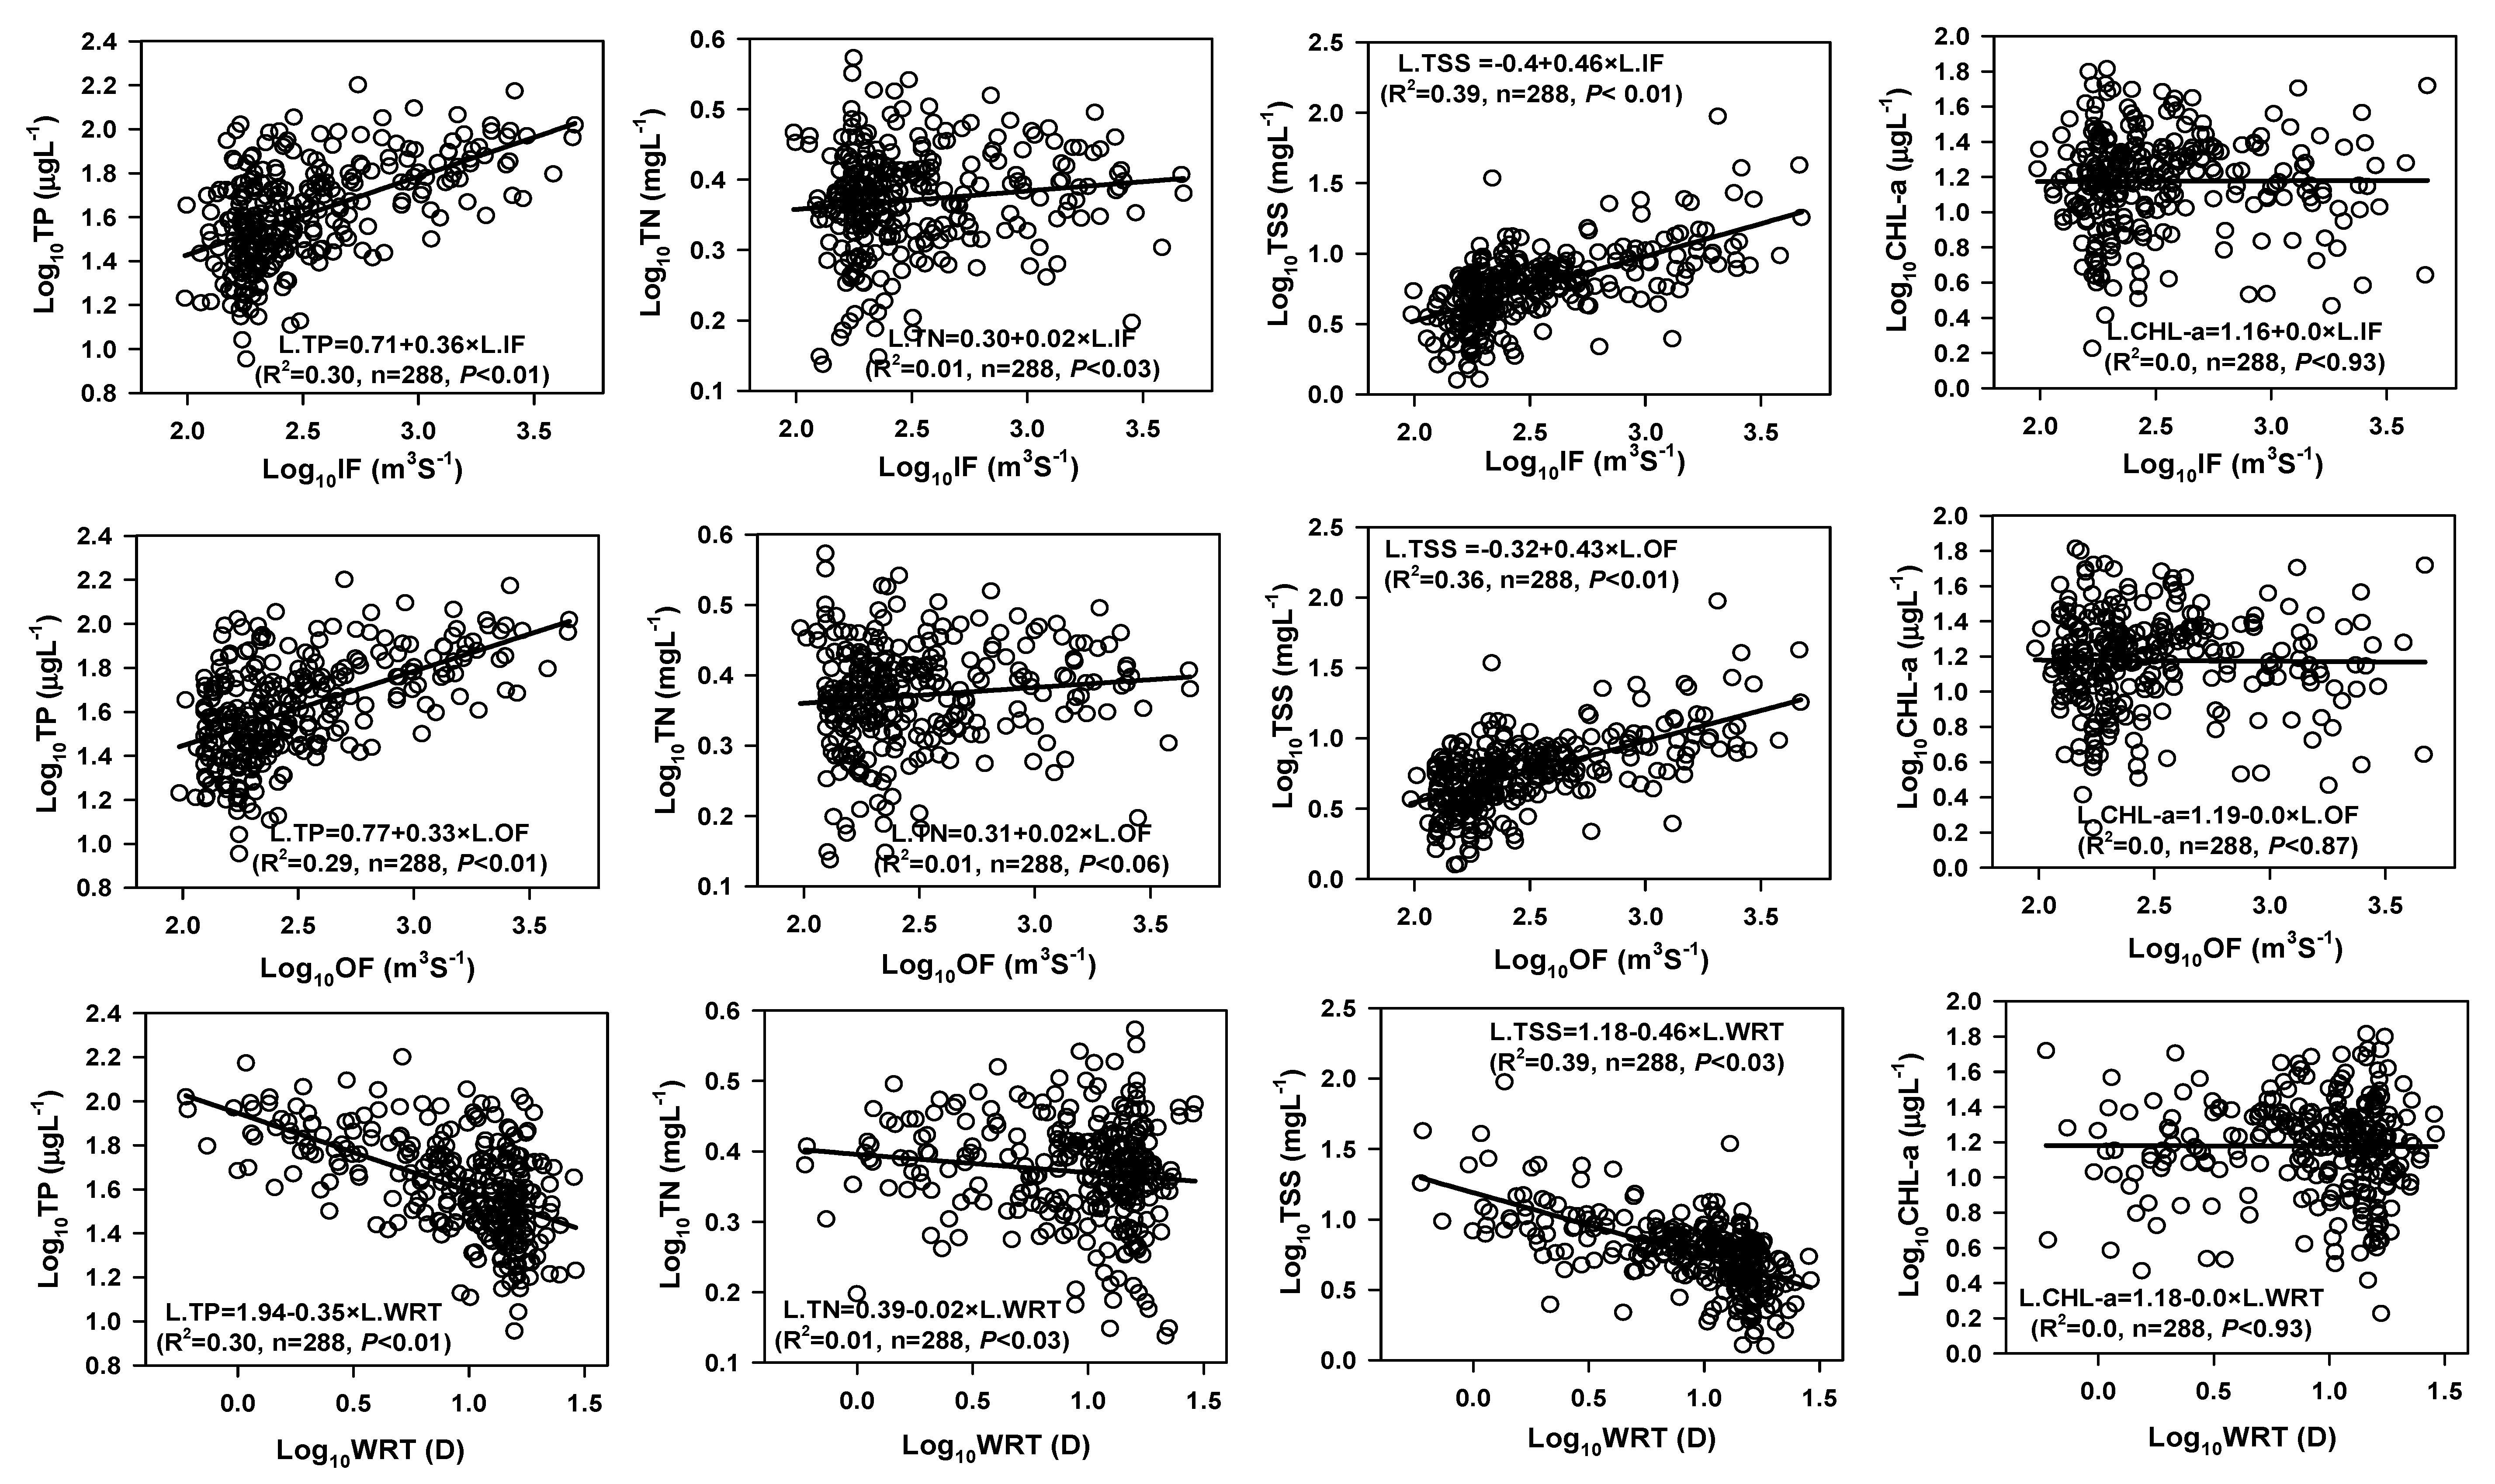
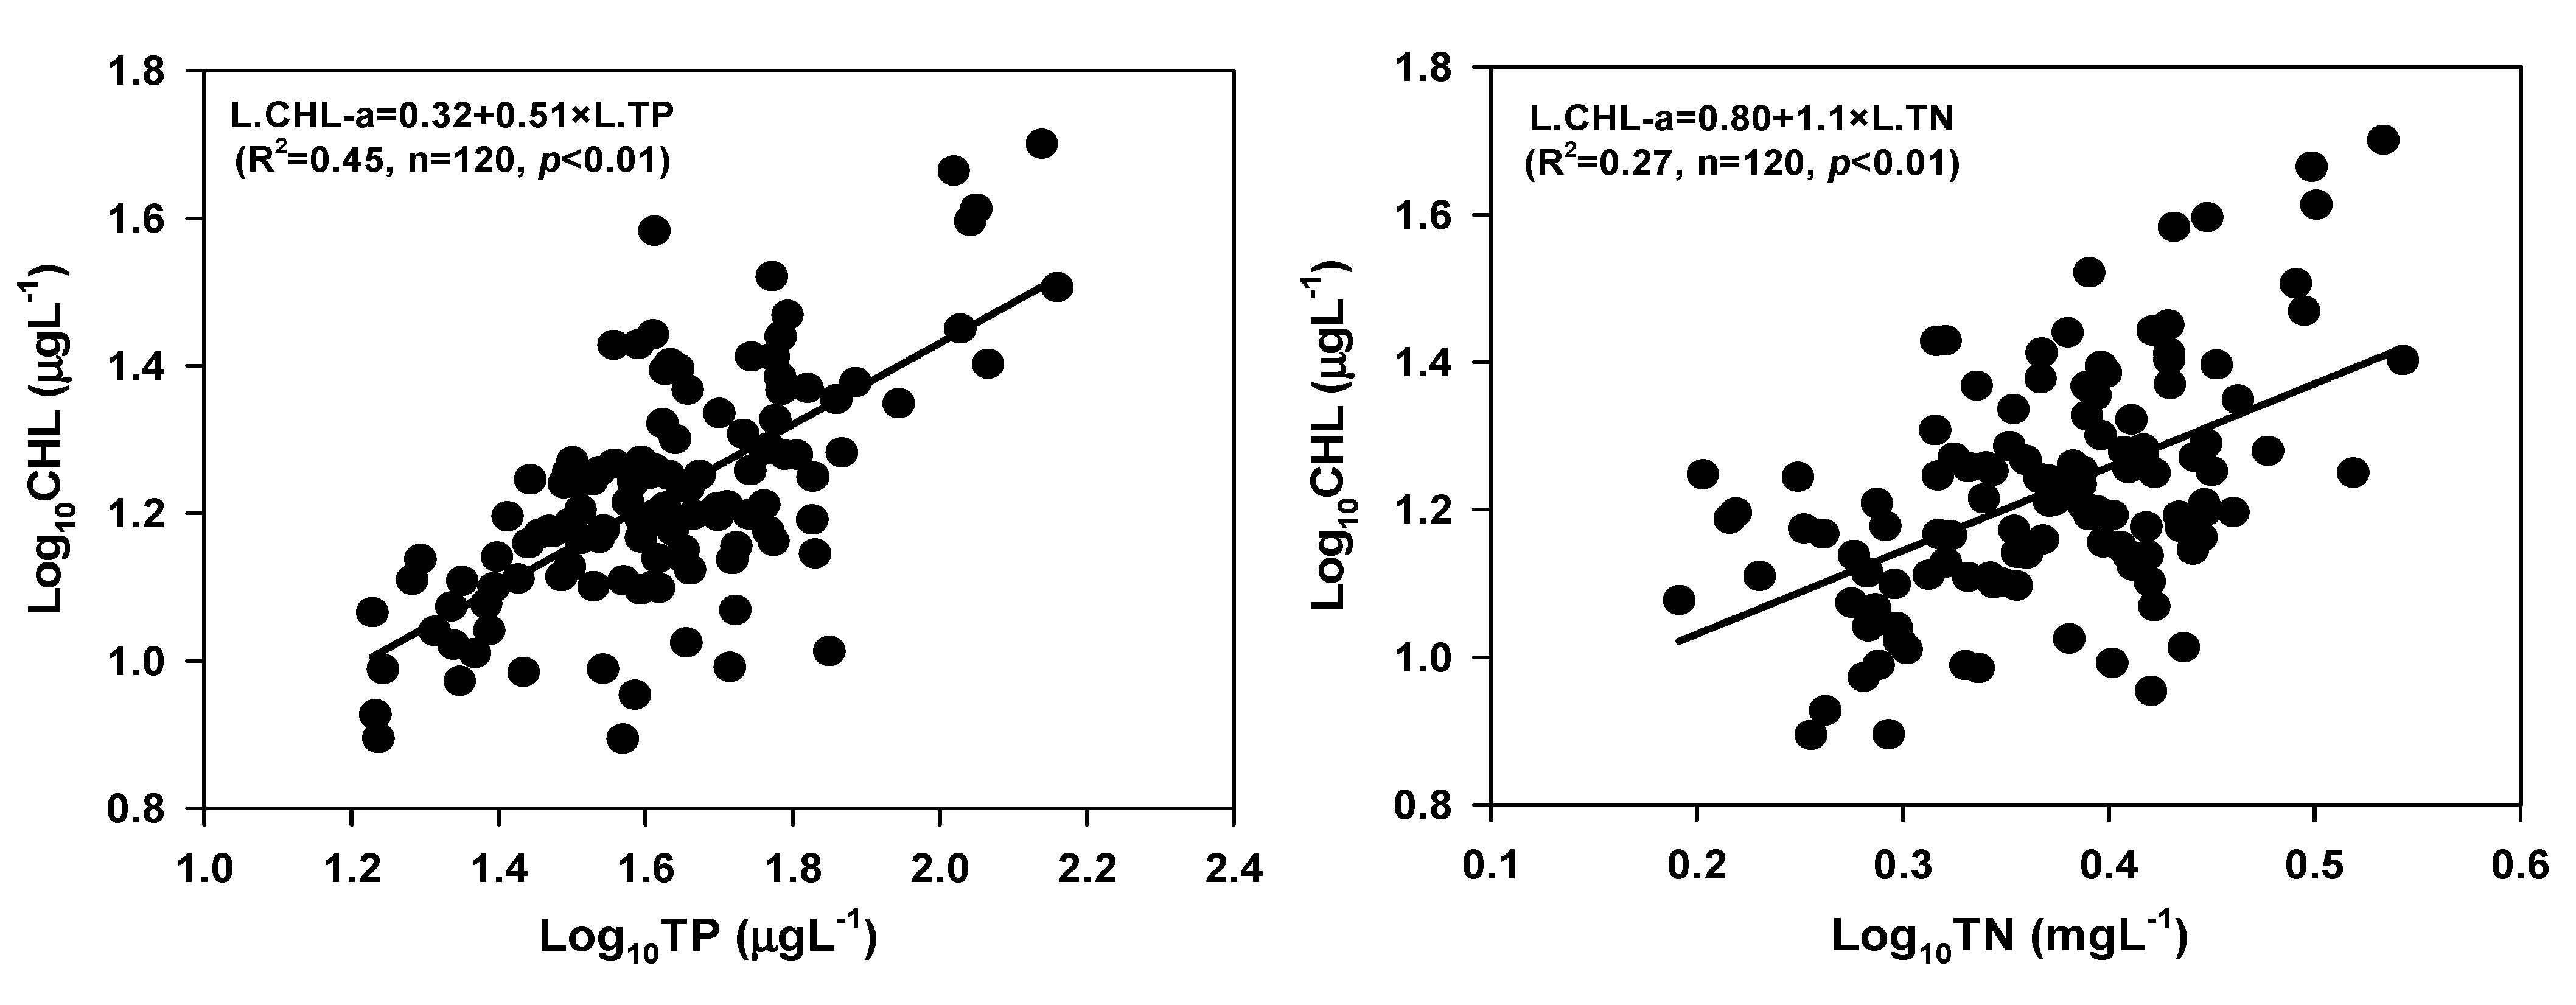
3.4. Hydrology, Nutrients, and Chlorophyll-a

Inflow, outflow, and WRT are major drivers of the distributions of nutrients, suspended solids, and CHL-a in aquatic environments. Compared to TN and CHL-a, inflow, outflow, and WRT were more significant determinants of the concentrations of TP (R2 = 0.30, 0.29, 0.30, p < 0.01) and TSS (R2 = 0.39, 0.36, 0.39, p < 0.01) (Figure 3). The present findings were similar to previous studies in Korean reservoirs. Previous research in various parts of the world has shown that external loadings of TP and TSS are highly correlated with inflow, outflow, and WRT in the watershed, and this conclusion was supported by the present study [23,44,45]. Many studies have reported effects of WRT on algal growth in aquatic systems [46,47]. However, the results of the present study did not concur with some previous studies. Thus, WRT may not always be linked to algal growth in the reservoir. This may indicate that release of autochthonous nutrients regulates algal growth in Paldang Reservoir. Lee et al. [36] suggested that algal chlorophyll growth was influenced by nutrients in Paldang Reservoir.
The empirical models based on log-transformed CHL-a-TP and CHL-a-TN relationships are shown in Figure 4. Nutrients more strongly influenced chlorophyll growth in the reservoir’s ambient water, and the concentration of TP (R2 = 0.45, p < 0.01) better explained algal growth than that of TN (R2 = 0.27, p < 0.01), indicating a P-limited system. When two predictors are strongly correlated (R2 > 0.70), collinearity problems may arise that impede determination of the nutrient limiting algal growth. The present results showed that TP and TN (R2 = 0.55) are moderately correlated in Paldang Reservoir. To avoid these problems, conditional plots have been used to identify limiting nutrients in aquatic systems [35,48]. Conditional plots showed that the association between CHL-a and TP was relatively steady in Paldang Reservoir, as indicated by the smooth lines on the four panels with similar slopes, which suggested that the effect of TP on CHL-a is consistent irrespective of the level of TN, in turn indicating a P-limited reservoir (Supplementary Figures S5 and S6). In addition, the conditional plot shows no interaction between TP and TN, further verifying that Paldang Reservoir is a P-limited system.

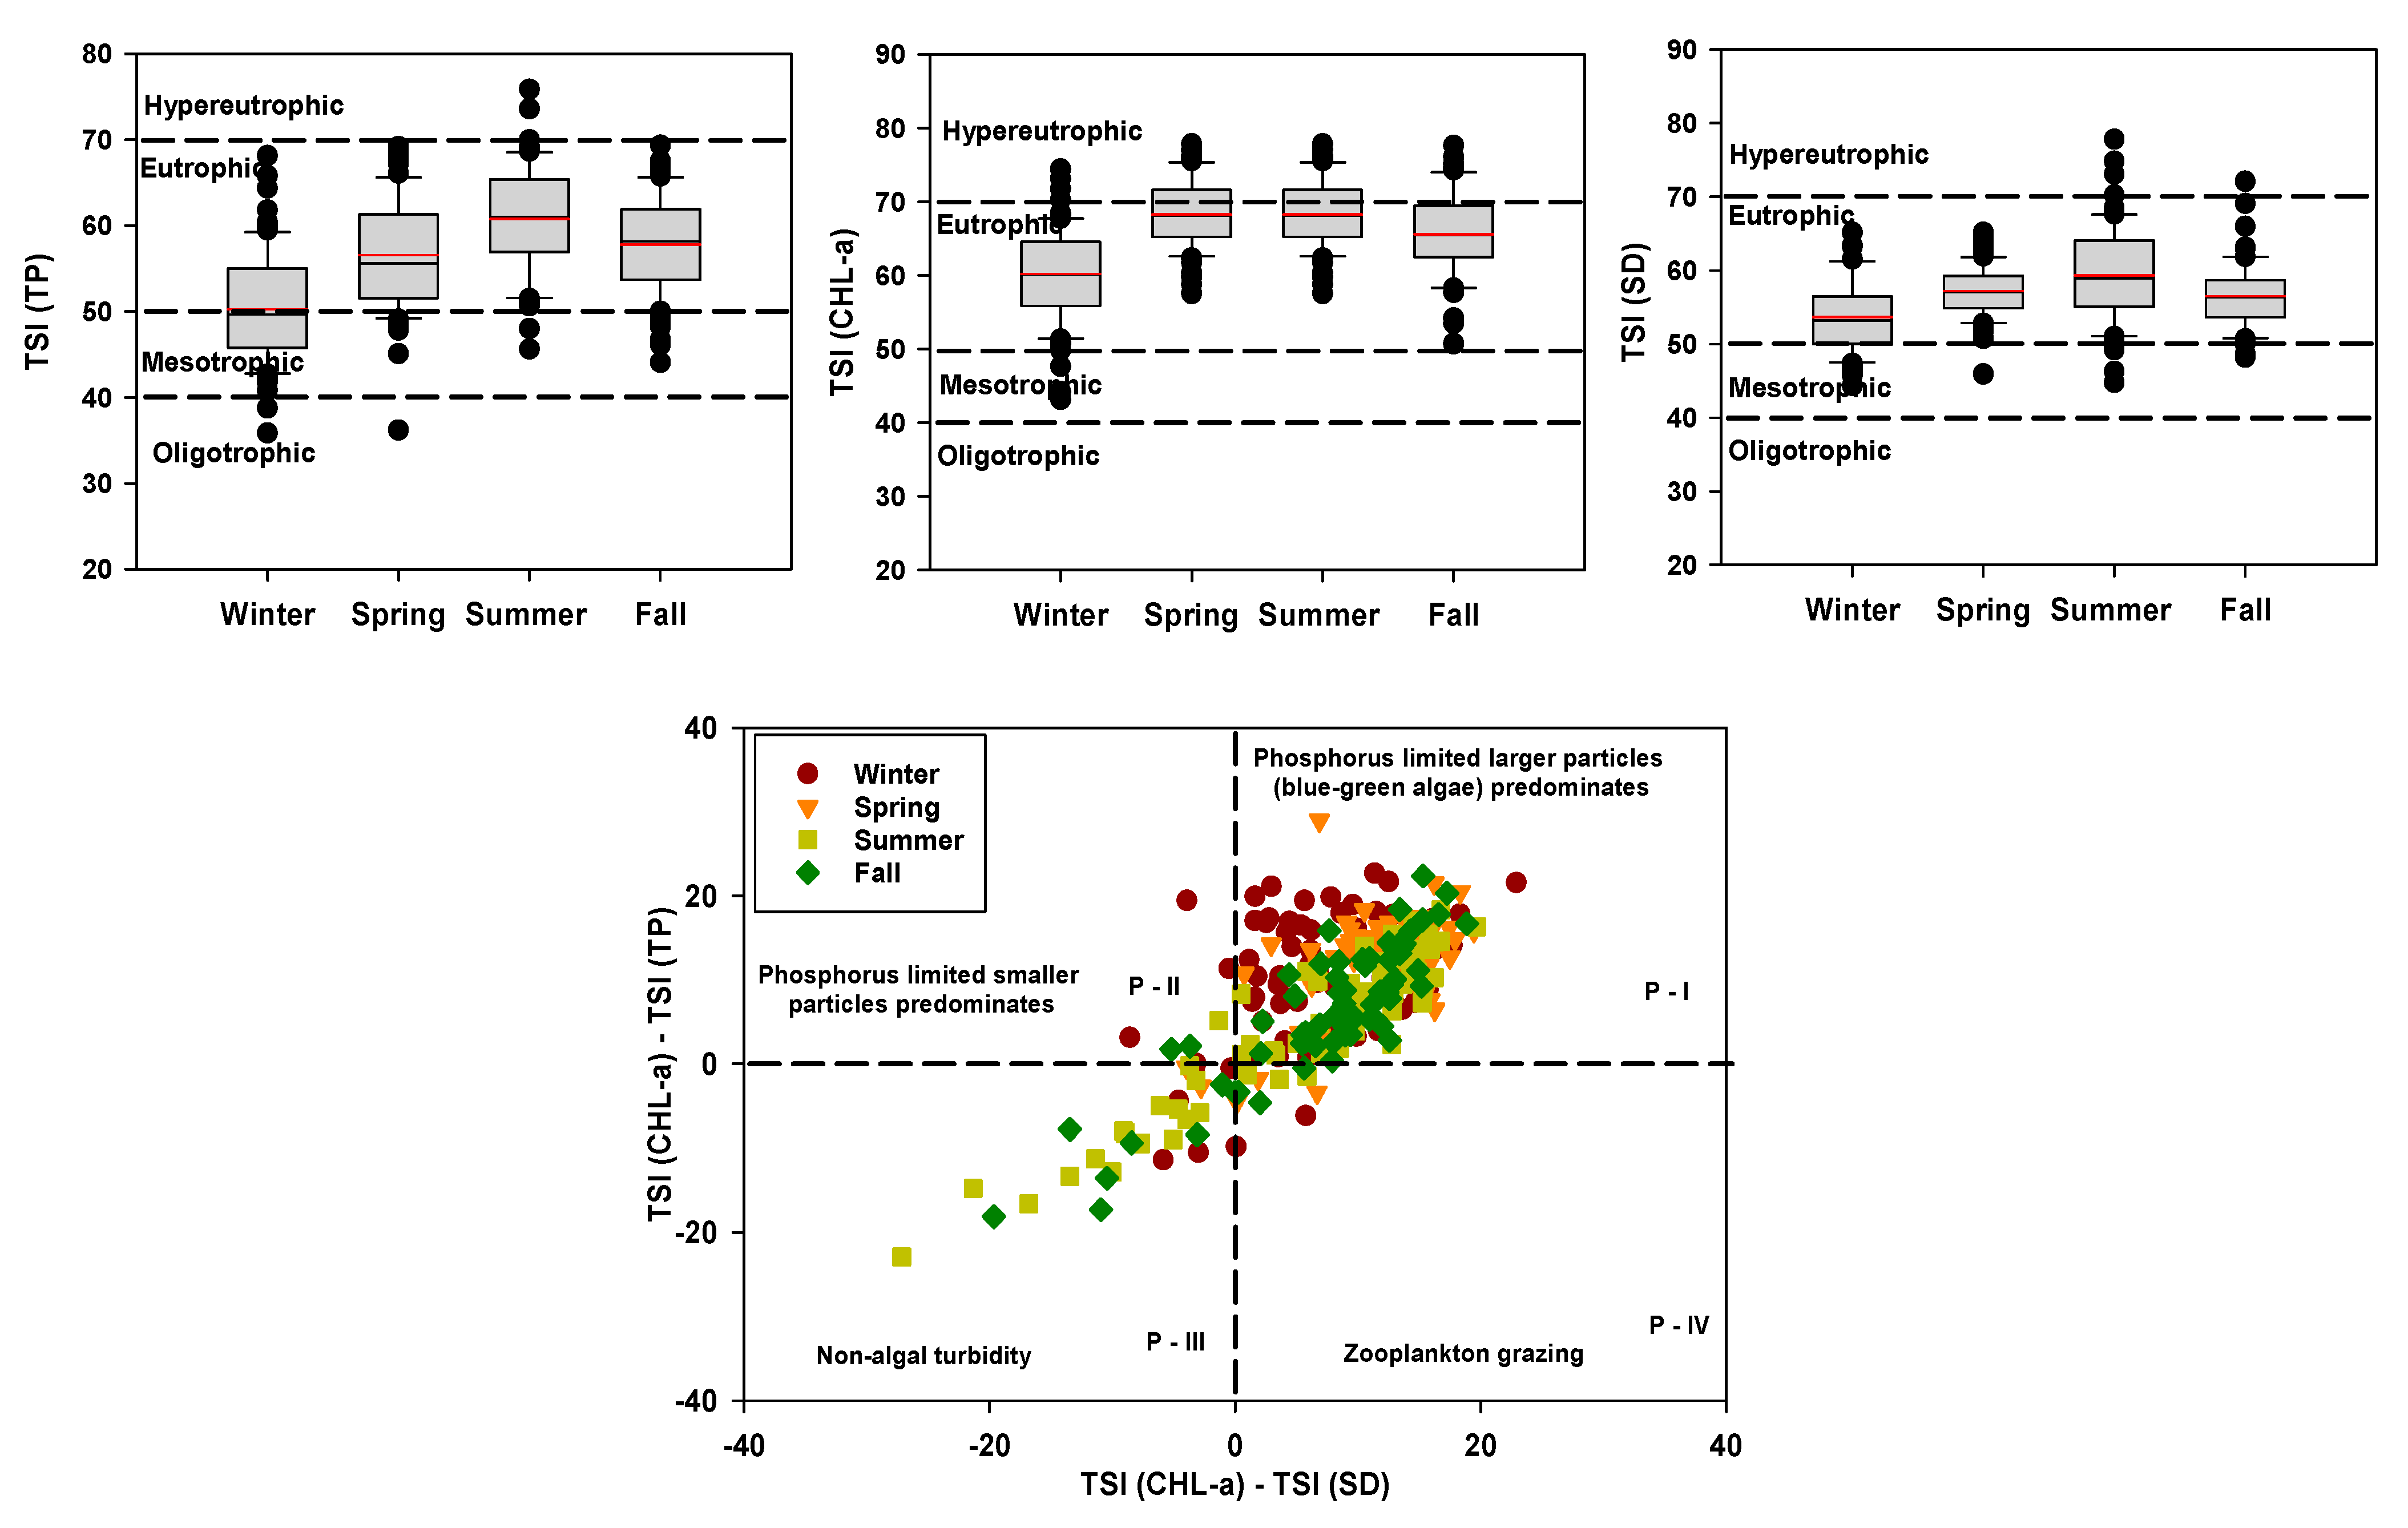
3.5. Trophic State Index and Trophic State Index Deviation

The trophic state of Paldang Reservoir, based on TP, TN, CHL-a, and SD, showed heterogeneity among sites and seasons, all of which were categorized as mesotrophic to eutrophic (Supplementary Table S3) [49,50]. These results are similar to the findings of previous trophic state classification studies in Korean reservoirs [4,51]. The primary sources of nutrients for Paldang Reservoir are agricultural fertilizer, animal manure, municipal sewage, and industrial effluents [25]. Based on TP concentrations, all sites and seasons were under eutrophic conditions, except for Site S3 and the winter season. Notably, we found that Paldang Reservoir was in a eutrophic state in all sites and seasons, on the basis of TN, CHL-a, and SD. Considering the present results, measures should be taken to control eutrophication in Paldang Reservoir.
Assessing the potential of a water source to support cyanobacterial blooms or blue-green algae is essential for water resource management [52]. WT, TP, CHL-a, and SD are essential factors for determining potential cyanobacterial growth in a reservoir [53]. The concentrations of TP and CHL-a, along with SD, in Paldang Reservoir indicate a moderate level of risk for cyanobacterial exposure (Supplementary Table S4). CHL-a is a good indicator of overall phytoplankton biomass, and monitoring CHL-a is a direct method for semiquantitative estimation of cyanobacterial biomass in aquatic systems [20]. For South Korean reservoirs supplying drinking water, a cyanobacteria watch is issued when the concentration of CHL-a exceeds 15 µg L−1. Furthermore, an alert is issued when the CHL-a concentration is greater than 25 µg L−1. Once a watch or alert has been issued, additional treatment processes are required at water treatment plants until the watch or alert is cleared. Additionally, when an alert is issued, water intake below that at which algae can inhabit and analysis of cyanotoxin in the treated water, are required [54]. The results of the present study indicate that all sites and seasons (except site S3 and winter) were under watch conditions. Previous studies of Paldang Reservoir have suggested that cyanobacterial blooms occur during the spring season, which is in line with our findings [30,32].
Analysis of TSI and TSID provides valuable information on algal chlorophyll development, nutrient variability, and other parameters in lakes and reservoirs [4,12]. TSI and TSID were estimated based on TP, CHL-a, and SD in Paldang Reservoir, and their values showed spatial and seasonal variations (Figure 4 and Figure 5). The mean TSI (TP), TSI (CHL-a), and TSI (SD) values indicate a eutrophic state during all seasons and at all sites (Figure 5, Supplementary Figure S7). These consistent eutrophic conditions may reduce DO and hamper ecosystem functions. The mean TSI (CHL-a) indicated more eutrophic conditions during spring and summer than the fall and winter. Water quality was worse in terms of TSI at Site S4 than other sites, and this site influenced water quality at the drinking water tower (Supplementary Figure S7; Site S5). Park et al. [32] revealed that Kyoungan Stream (Site S4) has a significant impact on the quality of drinking water in Paldang Reservoir.
Analysis of TSID showed that blue-green algae were predominant in the reservoir during all four seasons based on the relationships of TSI (CHL-a) with TSI (SD) and TSI (TP) (Figure 5). Blooms of blue-green algae are associated with eutrophic conditions [18]. Previous research identified the following genera of cyanobacteria in Paldang Reservoir: Anabaena, Aphanocapsa, Chroococcus, Coelosphaerium, Dactylococcopsis, Microcystis, Merismopedia, Phormidium, Oscillatoria, and Pseudoanabaena [26]. The occurrence of cyanobacteria is affected by light, temperature, pH, and nutrients. The concentration of TP is a major factor influencing the cyanobacterial contribution to total algal biomass [55]. Moreover, the biomass of cyanobacterial genera, such as Aphanizomenon, Anabaena, and Microcystis, is strongly influenced by the levels of TP and TN [55].
Nonalgal turbidity was observed during the summer and fall due to surface runoff from the watershed. Such turbidity is a common occurrence in Asian lakes and reservoirs during the monsoon period [35,56]. Small amounts of zooplankton grazing and P-limited small particles were observed in the reservoir. In addition, the TSID data indicated that TSI (CHL-a) was significantly higher than TSI (TP) during spring and winter, demonstrating that algal productivity was higher than expected and highlighting the controlling effect of P [4,18]. The water’s trophic state must remain oligotrophic to mesotrophic for drinking water purposes according to the United States Environmental Protection Agency and Korean Ministry of Environment guidelines. The reservoir water intake towers face substantial bloom problems, impeding access to the water supply for local residents.

3.6. Discriminant Analysis

To study spatial and seasonal variations of water quality, DA was performed on the raw dataset. The spatial discriminant functions (DFs) and classification matrixes (CMs) used in this study are provided in Table 2 and Table S5, respectively. Spatial standard and stepwise DFs with 14 and 8 discriminant variables, respectively, were used to generate CMs, which assigned 100% of cases correctly (Table 2 and Table S5). The stepwise spatial DA results suggest that WT, DO, EC, COD, BOD/COD, TN, TN:TP, and TCB are the most important variables for explaining spatial variations in water quality in Paldang Reservoir among the five sites. The DFs indicated that WT, COD, BOD/COD, and TN were higher at Site S4 than other sites due to industrial and domestic wastewater effluents. These results are in accordance with previous findings in Paldang Reservoir [30]. Therefore, the spatial variations of these water quality parameters were mainly related to anthropogenic activities in the watershed.
Seasonal DFs and CMs are shown in Table 3 and Table S6, respectively, and were used to evaluate seasonal changes in water quality in Paldang Reservoir. Seasonal standard and stepwise mode DFs using 14 and 3 discriminant variables, respectively, generated CMs that assigned 100% of cases correctly (Table 3 and Table S6). Temporal stepwise DA findings showed that WT, BOD, and TSS were the most important factors in temporal variations in the water quality of Paldang Reservoir among the four seasons. The DFs indicated that WT and TSS were higher during summer than other seasons. WT was highest in summer and lowest in winter due to the impact of climate seasonality [1]. TSS concentrations were higher during summer due to summer monsoon effects [35]. In contrast, BOD was highest in spring. Previous research revealed elevated organic matter concentrations during spring in Paldang Reservoir [32].
Varol et al. [2] studied surface water quality variations in Keban Reservoir, Turkey, using the DA method, and found that eight and three variables successfully explained the temporal and spatial variations, respectively, among 19 water quality parameters. Chen et al. [14] studied surface water quality variations in Danjiangkou Reservoir, China, using the DA method, and their results indicated that six and four variables effectively explained spatial and temporal variations, respectively, among 11 water quality parameters. Mustapha et al. [57] studied surface water quality variations in the upper reach of the Kano River, Nigeria, using the DA method and successfully identified 7 variables, among 23 tested, having a statistically significant effect on the spatial variations. Singh et al. [9] showed that DA allows for data reduction, where only six and two variables were sufficient to discriminate spatial and temporal variations, respectively, in the Gomti River, India. Similarly, Zhang et al. [58] applied this method to evaluate spatial-temporal variations of water quality in the southwest New Territories and Kowloon, Hong Kong, and revealed that four and eight parameters could support 84.2% and 96.1% correct assignment in temporal and spatial analysis, respectively [58]. Furthermore, they suggested that the number of monitoring variables (and the associated cost) could be reduced, as their method allowed for considerable reduction of the dimensionality of the large dataset. Overall, DA led to a considerable reduction in the present research dataset and helped determine the parameters responsible for spatial and temporal variations.

3.7. Principal Component Analysis Combined with Factor Analysis (PCA/FA)

Urbanization, domestic sewage, industrial wastewater effluents, intensive agricultural activities, and waste from animal farms and inflowing rivers are the primary sources of water pollution in Paldang Reservoir. Bartlett’s test and KMO were performed to examine the suitability of the data for PCA/FA. In the present study, the KMO value was 0.59, and Bartlett’s test was significant (p < 0.000), indicating that the Paldang Reservoir data were suitable for PCA/FA and that meaningful relationships were present among the water quality variables. PCA/FA with varimax rotation identified five varifactors (VFs), which explained 82.32% of the total variance (Table 4). Varifactor 1 (VF1) represented 25.82% of the total variance and showed a strong positive loading (>0.70) for TP, strong negative loadings for TN:TP and SD, and moderate positive loadings (between 0.5 and 0.7) for TSS, TN, and CHL-a (Table 4). This VF represents inputs of nutrients and suspended matter from untreated domestic sewage, industrial effluents, and agricultural runoff. Nutrient inputs influence algal growth in Paldang Reservoir. The negative contribution of SD to this VF is related to high levels of nutrients, suspended solids, and algal growth [4,11]. VF2 showed strong positive loadings for pH and BOD/COD, and a moderate positive loading for BOD. This VF represents organic matter concentrations in the reservoir. VF3 (17.85% of the total variance) showed strong positive loadings for WT, EC, and COD and a moderate positive loading for BOD. This VF indicates the contributions of ions and organic matter input to the reservoir from untreated domestic sewage, industrial effluents, and agricultural runoff. VF4 (9.65 of the total variance) had a strong positive loading for DO, while VF5 (9.61% of the total variance) displayed a strong positive loading for TCB. The PCA/FA findings suggest that most of the variation in reservoir water quality can be attributed to nutrients and organic matter (anthropogenic), suspended solids (both natural and anthropogenic), and ionic concentrations (both natural and anthropogenic), which are regulated by both natural and anthropogenic activities.
PCA/FA is a dimension-reduction technique that provides information about the most significant factors through simplification of the data. Therefore, this method has been utilized in various studies exploring the pollution sources affecting a water system. For example, PCA/FA was employed by Lim et al. [59] to identify sources of pollution in the Langat River, Malaysia. Four components were extracted in group 1, explaining 85% of the total variance, while six components were extracted in group 2, explaining 88% of the total variance. Based on these data, they determined that seawater intrusion, agricultural and industrial pollution, and geological weathering were mainly responsible for the river pollution. In addition, Tanriverdi et al. [60] used PCA/FA to analyze and assess the surface water quality of Ceyhan River and suggested that stations near cities were strongly affected by household wastewater, while other stations were influenced by agricultural facilities. Moreover, Jha et al. [61] identified major pollution sources influencing physicochemical variables in Aerial Bay, Andaman Islands, using the FA technique, which included rivulet flux into the bay, land run-off, prevailing biological processes, and tidal flow. Haji Gholizadeh et al. [11] identified five and four potential pollution sources to the Miami Canal in South Florida during the wet and dry seasons, respectively, which affected water quality variables. PCA/FA was used to distinguish four potential pollution types, namely, organic pollution, nutrient pollution, chemical pollution, and natural pollution, in Danjiangkou Reservoir, China, revealing that the study area was primarily influenced by industrial effluent and domestic sewage [14]

4. Conclusions

MSTs, TSI, and TSID were combined to assess the water quality of Paldang Reservoir. All variables except pH, DO, and TCB showed significant spatial variations due to the effects of anthropogenic activities. The mean values of TSI (TP), TSI (CHL-a), and TSI (SD) indicated a eutrophic state, and TSID showed that blue-green algae dominated the reservoir. PCA/FA results revealed that the concentrations of TP, TN, BOD, COD, TSS, and EC were generally linked to both anthropogenic activities and natural processes. Stepwise DA provided better results for both spatial and temporal analyses. Thus, this study demonstrated that MSTs, TSI, and TSID are effective approaches for evaluating reservoir water quality, and that these methods can be used in combination as useful water quality management tools. Relative to US EPA and MOE guidelines, the reservoir is in a eutrophic state in terms of CHL-a, which is unfavorable for drinking purposes. To improve the water quality of this reservoir, nutrient and organic matter loads from the watershed should be limited.

Supplementary Materials

The following are available online at https://www.mdpi.com/2073-4441/13/2/186/s1, Figure S1: Seasonal and Total rainfall pattern of Paldang watershed (Spring: March–May, Summer: June–August, Fall: September–November, Winter: December–February, and TRF: total rainfall), Figure S2: Loading Data of TP, TN, TSS, BOD, and COD in the Paldang Reservoir (TP—total phosphorus, TN—total nitrogen, TSS—total suspended solids, BOD—biological oxygen demand, COD—chemical oxygen demand, Spring: March–May, Summer: June–August, Fall: September–November, and Winter: December–February), Figure S3: Empirical relations among TSS, TP, and TN (TP—total phosphorus, TN—total nitrogen, TSS—total suspended solids), Figure S4: Yearly loading data of TP, TN, TSS, BOD, COD (TP—total phosphorus, TN—total nitrogen, TSS—total suspended solids, BOD—biological oxygen demand, COD—chemical oxygen demand), Figure S5: The relationship between CHL-a and TP is plotted conditional on the range of TN (TP—total phosphorus, TN—total nitrogen, CHL—chlorophyll-a), Figure S6: The relationship between CHL-a and TN is plotted conditional on the range of TP (TP—total phosphorus, TN—total nitrogen, CHL—chlorophyll-a), Figure S7: Trophic State Index of Paldang Reservoir at five different sites, Table S1: Water quality classes of Paldang Reservoir based on sites and seasons according to the Korean Ministry of Environment water quality standards for reservoirs and lakes (pH—hydrogen ion concentration, DO—dissolved oxygen, COD—chemical oxygen demand, TSS-total suspended solids, TN—total nitrogen, TP—total phosphorus, CHL—chlorophyll-a, TCB—total coliform bacteria, Ia: very good (high-quality water), Ib: good (high-quality water), II: somewhat good (lightly contaminated water), III: average (contaminated water), IV: somewhat poor (contaminated water), V: poor (highly contaminated water), VI: very poor (highly contaminated water)), Table S2: Pearson correlation analysis of water quality parameters (units mg L−1, except pH, WT (°C), EC (μS cm−1), TP (μg L−1), CHL-a (μg L−1), SD (m), and TCB (MPNML−100)). pH—hydrogen ion concentration, WT—water temperature, DO—dissolved oxygen, EC—electrical conductivity, BOD—biological oxygen demand, COD—chemical oxygen demand, TSS—total suspended solids, TN—total nitrogen, TP—total phosphorus, CHL—chlorophyll-a, SD—Secchi depth, TCB—total coliform bacteria, Table S3: Trophic state criteria based on TP, TN, CHL-a, and SD from Nurnberg (1996) for Paldang Reservoir (TN—total nitrogen, TP—total phosphorus, CHL—chlorophyll-a, SD—Secchi depth, M: mesotrophic, E: eutrophic, and H: Hypereutrophic), Table S4: Thresholds of risk associated with potential exposure to cyanobacteria in Paldang Reservoir (adopted from WHO, 2015, LRE: lower risk of exposure, MRE: moderate risk of exposure and HRE: higher risk of exposure, TP—total phosphorus, CHL—chlorophyll-a, SD—Secchi depth), Table S5: Classification matrix for discriminant analysis of spatial variations in water quality of the reservoirs, Table S6: Classification matrix for discriminant analysis of seasonal variations in water quality of the reservoirs.

Author Contributions

Conceptualization, M.M.; methodology, M.M.; software, M.M. and J.Y.K.; formal analysis, M.M.; data curation, M.M. and J.Y.K.; writing—original draft preparation, M.M.; writing—review and editing, M.M. and K.-G.A.; visualization, M.M. and K.-G.A.; supervision, K.-G.A.; funding acquisition, K.-G.A. All authors have read and agreed to the published version of the manuscript.

Funding

This work was supported by the “Korea Environment Industry & Technology Institute (KEITI)” through the “Aquatic Ecosystem Conservation Research Program” funded by the Korean Ministry of Environment (Grant number: 2020003050004).

Institutional Review Board Statement

Not applicable.

Informed Consent Statement

Not applicable.

Data Availability Statement

The datasets presented in this study are available on reasonable request from the corresponding author.

Acknowledgments

The authors would like to acknowledge the Korean Ministry of Environment for their assistance.

Conflicts of Interest

The authors declare that they have no conflicts of interest.

References

  1. Varol, M. Use of water quality index and multivariate statistical methods for the evaluation of water quality of a stream affected by multiple stressors: A case study. Environ. Pollut. 2020, 266, 115417. [Google Scholar] [CrossRef] [PubMed]
  2. Varol, M. Spatio-temporal changes in surface water quality and sediment phosphorus content of a large reservoir in Turkey. Environ. Pollut. 2020, 259, 113860. [Google Scholar] [CrossRef] [PubMed]
  3. Varol, M.; Gökot, B.; Bekleyen, A.; Şen, B. Spatial and temporal variations in surface water quality of the dam reservoirs in the Tigris River basin, Turkey. Catena 2012, 92, 11–21. [Google Scholar] [CrossRef]
  4. Mamun, M.; Kwon, S.; Kim, J.E.; An, K.G. Evaluation of algal chlorophyll and nutrient relations and the N:P ratios along with trophic status and light regime in 60 Korea reservoirs. Sci. Total Environ. 2020, 741, 140451. [Google Scholar] [CrossRef] [PubMed]
  5. Bhat, S.A.; Meraj, G.; Yaseen, S.; Pandit, A.K. Statistical Assessment of Water Quality Parameters for Pollution Source Identification in Sukhnag Stream: An Inflow Stream of Lake Wular (Ramsar Site), Kashmir Himalaya. J. Ecosyst. 2014, 2014, 1–18. [Google Scholar] [CrossRef]
  6. Mamun, M.; An, K.G. Stream health assessment using chemical and biological multi-metric models and their relationships with fish trophic and tolerance indicators. Ecol. Indic. 2020. [Google Scholar] [CrossRef]
  7. Koçer, M.A.T.; Sevgili, H. Parameters selection for water quality index in the assessment of the environmental impacts of land-based trout farms. Ecol. Indic. 2014, 36, 672–681. [Google Scholar] [CrossRef]
  8. Singh, K.P.; Malik, A.; Mohan, D.; Sinha, S. Multivariate statistical techniques for the evaluation of spatial and temporal variations in water quality of Gomti River (India)—A case study. Water Res. 2004, 38, 3980–3992. [Google Scholar] [CrossRef]
  9. Singh, K.P.; Malik, A.; Sinha, S. Water quality assessment and apportionment of pollution sources of Gomti river (India) using multivariate statistical techniques—A case study. Anal. Chim. Acta 2005, 538, 355–374. [Google Scholar] [CrossRef]
  10. Su, S.; Li, D.; Zhang, Q.; Xiao, R.; Huang, F.; Wu, J. Temporal trend and source apportionment of water pollution in different functional zones of Qiantang River, China. Water Res. 2011, 45, 1781–1795. [Google Scholar] [CrossRef]
  11. Haji Gholizadeh, M.; Melesse, A.M.; Reddi, L. Water quality assessment and apportionment of pollution sources using APCS-MLR and PMF receptor modeling techniques in three major rivers of South Florida. Sci. Total Environ. 2016, 566–567, 1552–1567. [Google Scholar] [CrossRef] [PubMed]
  12. Carlson, R.E. A trophic state index for lakes. Limnol. Oceanogr. 1977, 22, 361–369. [Google Scholar] [CrossRef] [Green Version]
  13. Chen, J.; Li, F.; Fan, Z.; Wang, Y. Integrated application of multivariate statistical methods to source apportionment ofwatercourses in the liao river basin, northeast China. Int. J. Environ. Res. Public Health 2016, 13, 1035. [Google Scholar] [CrossRef] [PubMed] [Green Version]
  14. Chen, P.; Li, L.; Zhang, H. Spatio-temporal variations and source apportionment of water pollution in Danjiangkou Reservoir Basin, Central China. Water 2015, 7, 2591–2611. [Google Scholar] [CrossRef] [Green Version]
  15. Atique, U.; An, K.G. Landscape heterogeneity impacts water chemistry, nutrient regime, organic matter and chlorophyll dynamics in agricultural reservoirs. Ecol. Indic. 2020, 110, 105813. [Google Scholar] [CrossRef]
  16. Markad, A.T.; Landge, A.T.; Nayak, B.B.; Inamdar, A.B.; Mishra, A.K. Trophic state modeling for shallow freshwater reservoir: A new approach. Environ. Monit. Assess. 2019, 191. [Google Scholar] [CrossRef]
  17. Jones, J.R.; Knowlton, M.F.; An, K.G. Trophic state, seasonal patterns and empirical models in South Korean Reservoirs. Lake Reserv. Manag. 2003, 19, 64–78. [Google Scholar] [CrossRef]
  18. Carlson, R.E. Expanding the Trophic State Concept to Identify Non-Nutrient Limited Lakes and Reservoirs. In Proceedings of a National Conference on Enhancing the States’ Lake Management Programs; North American Lake Management Society: Chicago, IL, USA, 1991; pp. 59–71. [Google Scholar]
  19. Mamun, M.; An, K.G. Major nutrients and chlorophyll dynamics in Korean agricultural reservoirs along with an analysis of trophic state index deviation. J. Asia-Pac. Biodivers. 2017, 10, 183–191. [Google Scholar] [CrossRef]
  20. Mamun, M.; Kim, J.J.; Alam, M.A.; An, K.G. Prediction of algal chlorophyll-a and water clarity in monsoon-region reservoir using machine learning approaches. Water 2020, 12, 30. [Google Scholar] [CrossRef] [Green Version]
  21. An, K.G.; Jones, J.R. Factors regulating bluegreen dominance in a reservoir directly influenced by the asian monsoon. Hydrobiologia 2000, 432, 37–48. [Google Scholar] [CrossRef]
  22. Mamun, M.; Lee, S.J.; An, K.G. Temporal and spatial variation of nutrients, suspended solids, and chlorophyll in Yeongsan watershed. J. Asia-Pac. Biodivers. 2018, 11, 206–216. [Google Scholar] [CrossRef]
  23. Nadarajah, S.; Wijenayake, W.M.H.K.; Amarasinghe, U.S. Influence of hydrology on water quality and trophic state of irrigation reservoirs in Sri Lanka. Lakes Reserv. Res. Manag. 2019, 24, 287–298. [Google Scholar] [CrossRef]
  24. Bai, X.; Ding, S.; Fan, C.; Liu, T.; Shi, D.; Zhang, L. Organic phosphorus species in surface sediments of a large, shallow, eutrophic lake, Lake Taihu, China. Environ. Pollut. 2009, 157, 2507–2513. [Google Scholar] [CrossRef] [PubMed]
  25. Eun, H.N.; Seok, S.P. A hydrodynamic modeling study to determine the optimum water intake location in Lake Paldang, Korea. J. Am. Water Resour. Assoc. 2005, 41, 1315–1332. [Google Scholar] [CrossRef]
  26. Boopathi, T.; Wang, H.; Lee, M.-D.; Ki, J.-S. Seasonal Changes in Cyanobacterial Diversity of a Temperate Freshwater Paldang Reservoir (Korea) Explored by using Pyrosequencing. Environ. Biol. Res. 2018, 36, 424–437. [Google Scholar] [CrossRef]
  27. Lee, J.E.; Youn, S.J.; Byeon, M.; Yu, S.J. Occurrence of cyanobacteria, actinomycetes, and geosmin in drinking water reservoir in Korea: A case study from an algal bloom in 2012. Water Supply 2020, 20, 1862–1870. [Google Scholar] [CrossRef]
  28. Kim, D.W.; Min, J.H.; Yoo, M.; Kang, M.; Kim, K. Long-term effects of hydrometeorological and water quality conditions on algal dynamics in the Paldang dam watershed, Korea. Water Sci. Technol. Water Supply 2014, 14, 601–608. [Google Scholar] [CrossRef]
  29. Youn, S.J.; Kim, H.N.; Yu, S.J.; Byeon, M.S. Cyanobacterial occurrence and geosmin dynamics in Paldang Lake watershed, South Korea. Water Environ. J. 2020, 1–10. [Google Scholar] [CrossRef]
  30. Park, H.K.; Cho, K.H.; Won, D.H.; Lee, J.; Kong, D.S.; Jung, D. Il Ecosystem responses to climate change in a large on-river reservoir, Lake Paldang, Korea. Clim. Chang. 2013, 120, 477–489. [Google Scholar] [CrossRef]
  31. Straskraba, M.; Tundisi, G. Guidelines of Lake Management: Volume 9 Reservoir Water Quality Management; International Lake Environment Committee: Kusatsu, Japan, 1999; Volume 9, ISBN 4906356265. [Google Scholar]
  32. Park, H.K.; Byeon, M.S.; Shin, Y.N.; Jung, D. Il Sources and spatial and temporal characteristics of organic carbon in two large reservoirs with contrasting hydrologic characteristics. Water Resour. Res. 2009, 45, 1–12. [Google Scholar] [CrossRef]
  33. Kerneïs, A.; Nakache, F.; Deguin, A.; Feinberg, M. The effects of water residence time on the biological quality in a distribution network. Water Res. 1995, 29, 1719–1727. [Google Scholar] [CrossRef]
  34. Varol, M.; Gökot, B.; Bekleyen, A.; Şen, B. Water quality assessment and apportionment of pollution sources in Tigris River (Turkey) using multivariate statistical techniques. River Res. Applic 2012, 28, 1428–1438. [Google Scholar] [CrossRef]
  35. Mamun, M.; Kim, J.Y.; An, K.G. Trophic responses of the Asian reservoir to long-term seasonal and interannual dynamic monsoon. Water 2020, 12, 2066. [Google Scholar] [CrossRef]
  36. Lee, Y.; Ha, S.Y.; Park, H.K.; Han, M.S.; Shin, K.H. Identification of key factors influencing primary productivity in two river-type reservoirs by using principal component regression analysis. Environ. Monit. Assess. 2015, 187, 1–12. [Google Scholar] [CrossRef] [PubMed]
  37. Mallin, M.A.; Cahoon, L.B. The Hidden Impacts of Phosphorus Pollution to Streams and Rivers. Bioscience 2020, 70, 315–329. [Google Scholar] [CrossRef]
  38. Fox, G.A.; Purvis, R.A.; Penn, C.J. Streambanks: A net source of sediment and phosphorus to streams and rivers. J. Environ. Manag. 2016, 181, 602–614. [Google Scholar] [CrossRef] [Green Version]
  39. Mamun, M.; Lee, S.J.; An, K.G. Roles of nutrient regime and N:P ratios on algal growth in 182 Korean agricultural reservoirs. Pol. J. Environ. Stud. 2018, 27, 1175–1185. [Google Scholar] [CrossRef]
  40. Iloms, E.; Ololade, O.O.; Ogola, H.J.O.; Selvarajan, R. Investigating industrial effluent impact on municipal wastewater treatment plant in vaal, South Africa. Int. J. Environ. Res. Public Health 2020, 17, 1096. [Google Scholar] [CrossRef] [Green Version]
  41. Lee, J.; Lee, S.; Yu, S.; Rhew, D. Relationships between water quality parameters in rivers and lakes: BOD5, COD, NBOPs, and TOC. Environ. Monit. Assess. 2016, 188, 1–8. [Google Scholar] [CrossRef]
  42. Kolpin, D.W.; Furlong, E.T.; Meyer, M.T.; Thurman, E.M.; Zaugg, S.D.; Barber, L.B.; Buxton, H.T. Pharmaceuticals, hormones, and other organic wastewater contaminants in U.S. streams, 1999–2000: A national reconnaissance. Environ. Sci. Technol. 2002, 36, 1202–1211. [Google Scholar] [CrossRef] [Green Version]
  43. Vizcaino, I.P.; Carrera, E.V.; Sanromán-Junquera, M.; Muñoz-Romero, S.; Rojo-Álvarez, J.L.; Cumbal, L.H. Spatio-temporal analysis of water quality parameters in machángara river with nonuniform interpolation methods. Water 2016, 8, 507. [Google Scholar] [CrossRef]
  44. Mallin, M.A.; Johnson, V.L.; Ensign, S.H. Comparative impacts of stormwater runoff on water quality of an urban, a suburban, and a rural stream. Environ. Monit. Assess. 2009, 159, 475–491. [Google Scholar] [CrossRef] [PubMed]
  45. Abell, J.M.; Özkundakci, D.; Hamilton, D.P.; Jones, J.R. Latitudinal variation in nutrient stoichiometry and chlorophyll-nutrient relationships in lakes: A global study. Fundam. Appl. Limnol. 2012, 181, 1–14. [Google Scholar] [CrossRef]
  46. Kawara, O.; Yura, E.; Fujii, S.; Matsumoto, T. A study on the role of hydraulic retention time in eutrophication of the Asahi River Dam reservoir. Water Sci. Technol. 1998, 37, 245–252. [Google Scholar] [CrossRef]
  47. Lee, S.; Lee, S.; Kim, S.H.; Park, H.; Park, S.; Yum, K. Examination of critical factors related to summer chlorophyll a concentration in the Sueo dam reservoir, Republic of Korea. Environ. Eng. Sci. 2012, 29, 502–510. [Google Scholar] [CrossRef] [PubMed] [Green Version]
  48. Qian, S.S. Environmental and Ecological Statistics with R, 2nd ed.; Chapman and Hall: London, UK; CRC: Boca Raton, FL, USA, 2016; ISBN 9781498728720. [Google Scholar]
  49. Nürnberg, G.K. Trophic state of clear and colored, soft- and hardwater lakes with special consideration of nutrients, anoxia, phytoplankton and fish. Lake Reserv. Manag. 1996, 12, 432–447. [Google Scholar] [CrossRef]
  50. United States Environmental Protection Agency. Guideline for Data Quality Assessment; USEPA: Washington, DC, USA, 2007.
  51. Jung, S.; Shin, M.; Kim, J.; Eum, J.; Lee, Y.; Lee, J.; Choi, Y.; You, K.; Owen, J.; Kim, B. The effects of Asian summer monsoons on algal blooms in reservoirs. Inland Waters 2016, 6, 406–413. [Google Scholar] [CrossRef]
  52. World Health Organization. Guidelines for Drinking Water Quality: Management of Cyanobacteria in Drinking Water Suppliers Information for Regulators and Water Suppliers, 4th ed.; WHO: Geneva, Switzerland, 2015. [Google Scholar]
  53. Miller, A.W. Trophic state evaluation for selected lakes in Yellowstone National Park, USA. WIT Trans. Ecol. Environ. 2010, 135, 143–155. [Google Scholar] [CrossRef] [Green Version]
  54. Cha, Y.; Park, S.S.; Kim, K.; Byeon, M.; Stow, C.A. Probablistic prediction of cyanobacteria abundance in a Korean reservoir using a Bayesian Poisson model. Water Resour. Res. 2014, 50, 2518–2532. [Google Scholar] [CrossRef] [Green Version]
  55. Wagner, C.; Adrian, R. Cyanobacteria dominance: Quantifying the effects of climate change. Limnol. Oceanogr. 2009, 54, 2460–2468. [Google Scholar] [CrossRef]
  56. Zou, W.; Zhu, G.; Cai, Y.; Vilmi, A.; Xu, H.; Zhu, M.; Gong, Z.; Zhang, Y.; Qin, B. Relationships between nutrient, chlorophyll a and Secchi depth in lakes of the Chinese Eastern Plains ecoregion: Implications for eutrophication management. J. Environ. Manag. 2020, 260, 109923. [Google Scholar] [CrossRef] [PubMed]
  57. Mustapha, A.; Aris, A.Z.; Yusoff, F.M.; Zakaria, M.P.; Ramli, M.F.; Abdullah, A.M.; Kura, N.U.; Narany, T.S. Statistical Approach in Determining the Spatial Changes of Surface Water Quality at the Upper Course of Kano River, Nigeria. Water Qual. Expo. Health 2014, 6, 127–142. [Google Scholar] [CrossRef]
  58. Zhang, X.; Wang, Q.; Liu, Y.; Wu, J.; Yu, M. Application of multivariate statistical techniques in the assessment of water quality in the Southwest New Territories and Kowloon, Hong Kong. Environ. Monit. Assess. 2011, 173, 17–27. [Google Scholar] [CrossRef]
  59. Lim, W.Y.; Aris, A.Z.; Praveena, S.M. Application of the chemometric approach to evaluate the spatial variation of water chemistry and the identification of the sources of pollution in Langat River, Malaysia. Arab. J. Geosci. 2013, 6, 4891–4901. [Google Scholar] [CrossRef]
  60. Tanriverdi, Ç.; Alp, A.; Demirkiran, A.R.; Üçkardeş, F. Assessment of surface water quality of the Ceyhan River basin, Turkey. Environ. Monit. Assess. 2010, 167, 175–184. [Google Scholar] [CrossRef]
  61. Jha, D.K.; Vinithkumar, N.V.; Sahu, B.K.; Das, A.K.; Dheenan, P.S.; Venkateshwaran, P.; Begum, M.; Ganesh, T.; Prashanthi Devi, M.; Kirubagaran, R. Multivariate statistical approach to identify significant sources influencing the physico-chemical variables in Aerial Bay, North Andaman, India. Mar. Pollut. Bull. 2014, 85, 261–267. [Google Scholar] [CrossRef]
Figure 1. The map showing the sampling sites of Paldang Reservoir.
Water 13 00186 g001
Figure 2. Yearly variation of water quality parameters in Paldang Reservoir. TP—total phosphorus, TN—total nitrogen, BOD—biological oxygen demand, COD—chemical oxygen demand, TSS—total suspended solids, CHL—chlorophyll-a, SD—Secchi depth, TCB—total coliform bacteria.
Water 13 00186 g002
Figure 3. Influence of hydrology on TP, TN, TSS, and CHL-a. TP—total phosphorus, TN—total nitrogen, TSS—total suspended solids, CHL—chlorophyll-a.
Water 13 00186 g003
Figure 4. Empirical relationship of CHL-a, TP, and TN. TP—total phosphorus, TN—total nitrogen, CHL—chlorophyll-a.
Water 13 00186 g004
Figure 5. Seasonal Trophic State Index and its deviation.
Water 13 00186 g005
Table 1. Mean value of water quality parameters at different sites and seasons (units mg L−1, except pH, WT (°C), EC (μS cm−1), TP (μ gL−1), CHL-a (μg L−1), SD (m), and TCB (MPNML−100). pH—hydrogen ion concentration, WT—water temperature, DO-dissolved oxygen, EC—electrical conductivity, BOD—biological oxygen demand, COD—chemical oxygen demand, TSS—total suspended solids, TN—total nitrogen, TP—total phosphorus, CHL—chlorophyll-a, SD—Secchi depth, TCB—total coliform bacteria.
SitespHWTDOECBODCODBOD/CODTSSTNTPTN:TPCHL-aSDTCB
S18.19 ± 0.2713.78 ± 0.82 a11.18 ± 0.61217.38 ± 31.78 a1.62 ± 0.32 a3.71 ± 0.50 a0.43 ± 0.12 abc8.22 ± 4.88 a2.56 ± 0.21 a50.38 ± 12.26 a67.24 ± 15.24 a17.46 ± 6.42 a1.31 ± 0.25 a2225.12 ± 2579.35
S28.27 ± 0.2914.01 ± 0.73 abcd11.28 ± 0.70211.72 ± 27.12 b1.73 ± 0.34 b3.82 ± 0.53 b0.45 ± 0.11 abc7.8 ± 5.44 b2.51 ± 0.19 b49.45 ± 12.37 b67.87 ± 16.59 b18.64 ± 4.16 b1.32 ± 0.20 b2357.05 ± 4172.17
S38.02 ± 0.2313.54 ± 0.74 b11.04 ± 0.57116.81 ± 28.96 c1.19 ± 0.20 c3.23 ± 0.41 c0.38 ± 0.10 a4.36 ± 1.43 c1.88 ± 0.17 c26.35 ± 7.34 c99.65 ± 39.53 c12.46 ± 2.79 c1.73 ± 0.36 c633.2 ± 650.72
S48.22 ± 0.3714.59 ± 0.69 c11.11 ± 0.78214.53 ± 40.14 d2.22 ± 0.44 d4.65 ± 0.48 d0.47 ± 0.10 b8.5 ± 2.68 d2.79 ± 0.35 d69.99 ± 35.93 d63.16 ± 22.64 d26.24 ± 9.90 d1.1 ± 0.18 d1701.32 ± 2711.27
S58.14 ± 0.3413.61 ± 0.76 d10.79 ± 0.71157.77 ± 24.11 e1.27 ± 0.16 e3.5 ± 0.35 e0.37 ± 0.08 c6.74 ± 3.10 abcd2.16 ± 0.15 e38.61 ± 10.63 e77.1 ± 25.32 e15.32 ± 3.67 e1.49 ± 0.31 e738.67 ± 697.12
Season
Spring8.41 ± 0.50 a11.43 ± 4.77 a12.16 ± 1.62 a195.3 ± 33.66 a2.09 ± 0.51 a4.2 ± 0.72 a0.49 ± 0.11 a7.22 ± 4.02 a2.57 ± 0.43 a47.83 ± 23.86 a79.55 ± 66.02 a24.33 ± 11.90 a1.3 ± 0.32 a395.51 ± 732.87 a
Summer8.13 ± 0.56 b23.23 ± 2.51 b9.09 ± 1.06 b178.05 ± 36.10 b1.76 ± 0.49 b4.17 ± 0.80 b0.42 ± 0.12 b10.75 ± 12.49 b2.24 ± 0.41 b61.76 ± 29.20 b48.83 ± 18.19 b19.56 ± 10.84 b1.21 ± 0.55 b3421.38 ± 8492 b
Fall8.04 ± 0.43 c17.82 ± 4.71 c9.9 ± 1.13 c182.75 ± 40.21 abc1.38 ± 0.41 c3.63 ± 0.62 c0.38 ± 0.13 c7.07 ± 3.77 c2.25 ± 0.31 c48.46 ± 19.42 c59.5 ± 21.58 c16.14 ± 8.96 c1.38 ± 0.39 c1898.88 ± 7296 abc
Winter8.09 ± 0.47 d3.14 ± 1.83 d13.18 ± 1.20 d178.48 ± 39.83 c1.2 ± 0.36 d3.11 ± 0.43 d0.38 ± 0.13 d3.44 ± 1.42 d2.46 ± 0.29 d29.78 ± 16.08 d112.13 ± 46.26 d12.06 ± 8.02 d1.67 ± 0.52 d400.69 ± 927.97 c
a, b, c, d Values with different superscript letters for each variable, indicate statistical differences among sites and seasons at p < 0.05 (Tukey HSD test).
Table 2. Classification functions for discriminant analysis of spatial variations in water quality of the reservoir. pH—hydrogen ion concentration, WT—water temperature, DO—dissolved oxygen, EC—electrical conductivity, BOD—biological oxygen demand, COD—chemical oxygen demand, TSS—total suspended solids, TN—total nitrogen, TP—total phosphorus, CHL—chlorophyll-a, SD—Secchi depth, TCB—total coliform bacteria.
VariablesStandard ModeStepwise Mode
SitesSites
S1S2S3S4S5S1S2S3S4S5
pH68.5768.3261.3561.7166.49
WT64.7965.8767.9471.5467.0449.9250.8553.2654.0352.24
DO76.2276.1873.1875.92072.9341.1240.9336.9039.3437.81
EC−0.30−0.34−0.72−0.45−0.560.008−0.02−0.37−0.10−0.23
BOD−848.28−851.76−842.51−878.11−842.64
COD490.21493.72483.60519.40485.9829.3331.1128.1742.9529.29
BOD/COD3179.553193.223094.433308.403115.40−0.840.36−64.3516.47−42.13
TSS−2.08−2.07−2.06−2.23−1.928
TN207.13207.32189.37220.82196.23148.86148.83131.73161.47138.90
TP1.371.371.371.421.35
TN:TP−1.35−1.34−1.10−1.35−1.20−0.42−0.41−0.18−0.41−0.28
CHL-a−4.95−4.92−4.45−4.92−4.67
SD (m)88.4488.9198.7483.9192.50
TCB−0.001−0.001−0.002−0.001−0.001−0.0005−0.0004−0.001−0.0008−0.001
(Constant)−2295.99−2316.61−2130.01−2456.2−2187.23−807−818.77−691.97−919.18−724.82
Fisher’s linear discriminant functions.
Table 3. Classification functions for discriminant analysis of seasonal variations in water quality of the reservoir. pH—hydrogen ion concentration, WT—water temperature, DO—dissolved oxygen, EC—electrical conductivity, BOD-biological oxygen demand, COD—chemical oxygen demand, TSS—total suspended solids, TN—total nitrogen, TP—total phosphorus, CHL—chlorophyll-a, SD—Secchi depth, TCB—total coliform bacteria.
VariablesStandard ModeStepwise Mode
SeasonSeason
SpringSummerFallWinterSpringSummerFallWinter
pH38.1637.9337.8838.11
WT4.164.994.643.660.601.541.180.08
DO17.8317.4117.4217.79
EC0.180.170.170.16
BOD−207.80−209.89−210.07−209.589.806.635.216.03
COD102.58102.18101.04101.13
BOD/COD713.31711.79708.23708.02
TSS−1.00−0.96−1.00−1.060.260.320.220.14
TN47.0945.1145.1545.83
TP0.520.540.510.50
TN:TP−0.09−0.09−0.09−0.08
CHL-a−1.07−1.07−1.06−1.07
SD (m)21.7922.3022.1323.01
TCB−0.0002−0.0001−0.0001−0.0001
(Constant)−553.79−551.02−535.15−532.22−16.02−26.89−16.30−5.36
Fisher’s linear discriminant functions.
Table 4. Varimax rotated component matrix for water quality parameters (Kaiser–Meyer–Olkin (KMO) = 0.59, Bartlett’s test was significant (p = 0.000), extraction method: principal component analysis, and rotation method: varimax with Kaiser normalization, and bold and italic values represent strong and moderate loadings, respectively). pH—hydrogen ion concentration, WT—water temperature, DO—dissolved oxygen, EC—electrical conductivity, BOD-biological oxygen demand, COD—chemical oxygen demand, TSS—total suspended solids, TN—total nitrogen, TP-total phosphorus, CHL—chlorophyll-a, SD—Secchi depth, TCB—total coliform bacteria.
VariablesComponents
VF1VF2VF3VF4VF5
pH0.20.81−0.080.07−0.14
WT−0.270.470.71−0.17−0.14
DO0.0010.110.020.950.03
EC0.12−0.020.87−0.050.08
BOD0.320.640.530.220.09
COD0.34−0.220.780.30−0.04
BOD/COD0.090.920.01−0.020.16
TSS0.60−0.350.040.410.33
TN0.600.240.46−0.130.44
TP0.880.200.15−0.040.09
TN:TP−0.840.020.010.010.05
CHL-a0.680.440.29−0.001−0.20
SD (m)−0.75−0.27−0.06−0.22−0.24
TCB0.06−0.01−0.010.060.91
Eigenvalues3.612.712.501.351.34
Percentage of variance25.8219.3717.859.659.61
Cumulative percentage25.8245.1963.0572.7082.32
Publisher’s Note: MDPI stays neutral with regard to jurisdictional claims in published maps and institutional affiliations.

