3.1.2.1. UV–VIS and Synchronous Scan Fluorescence Spectroscopic Evaluation
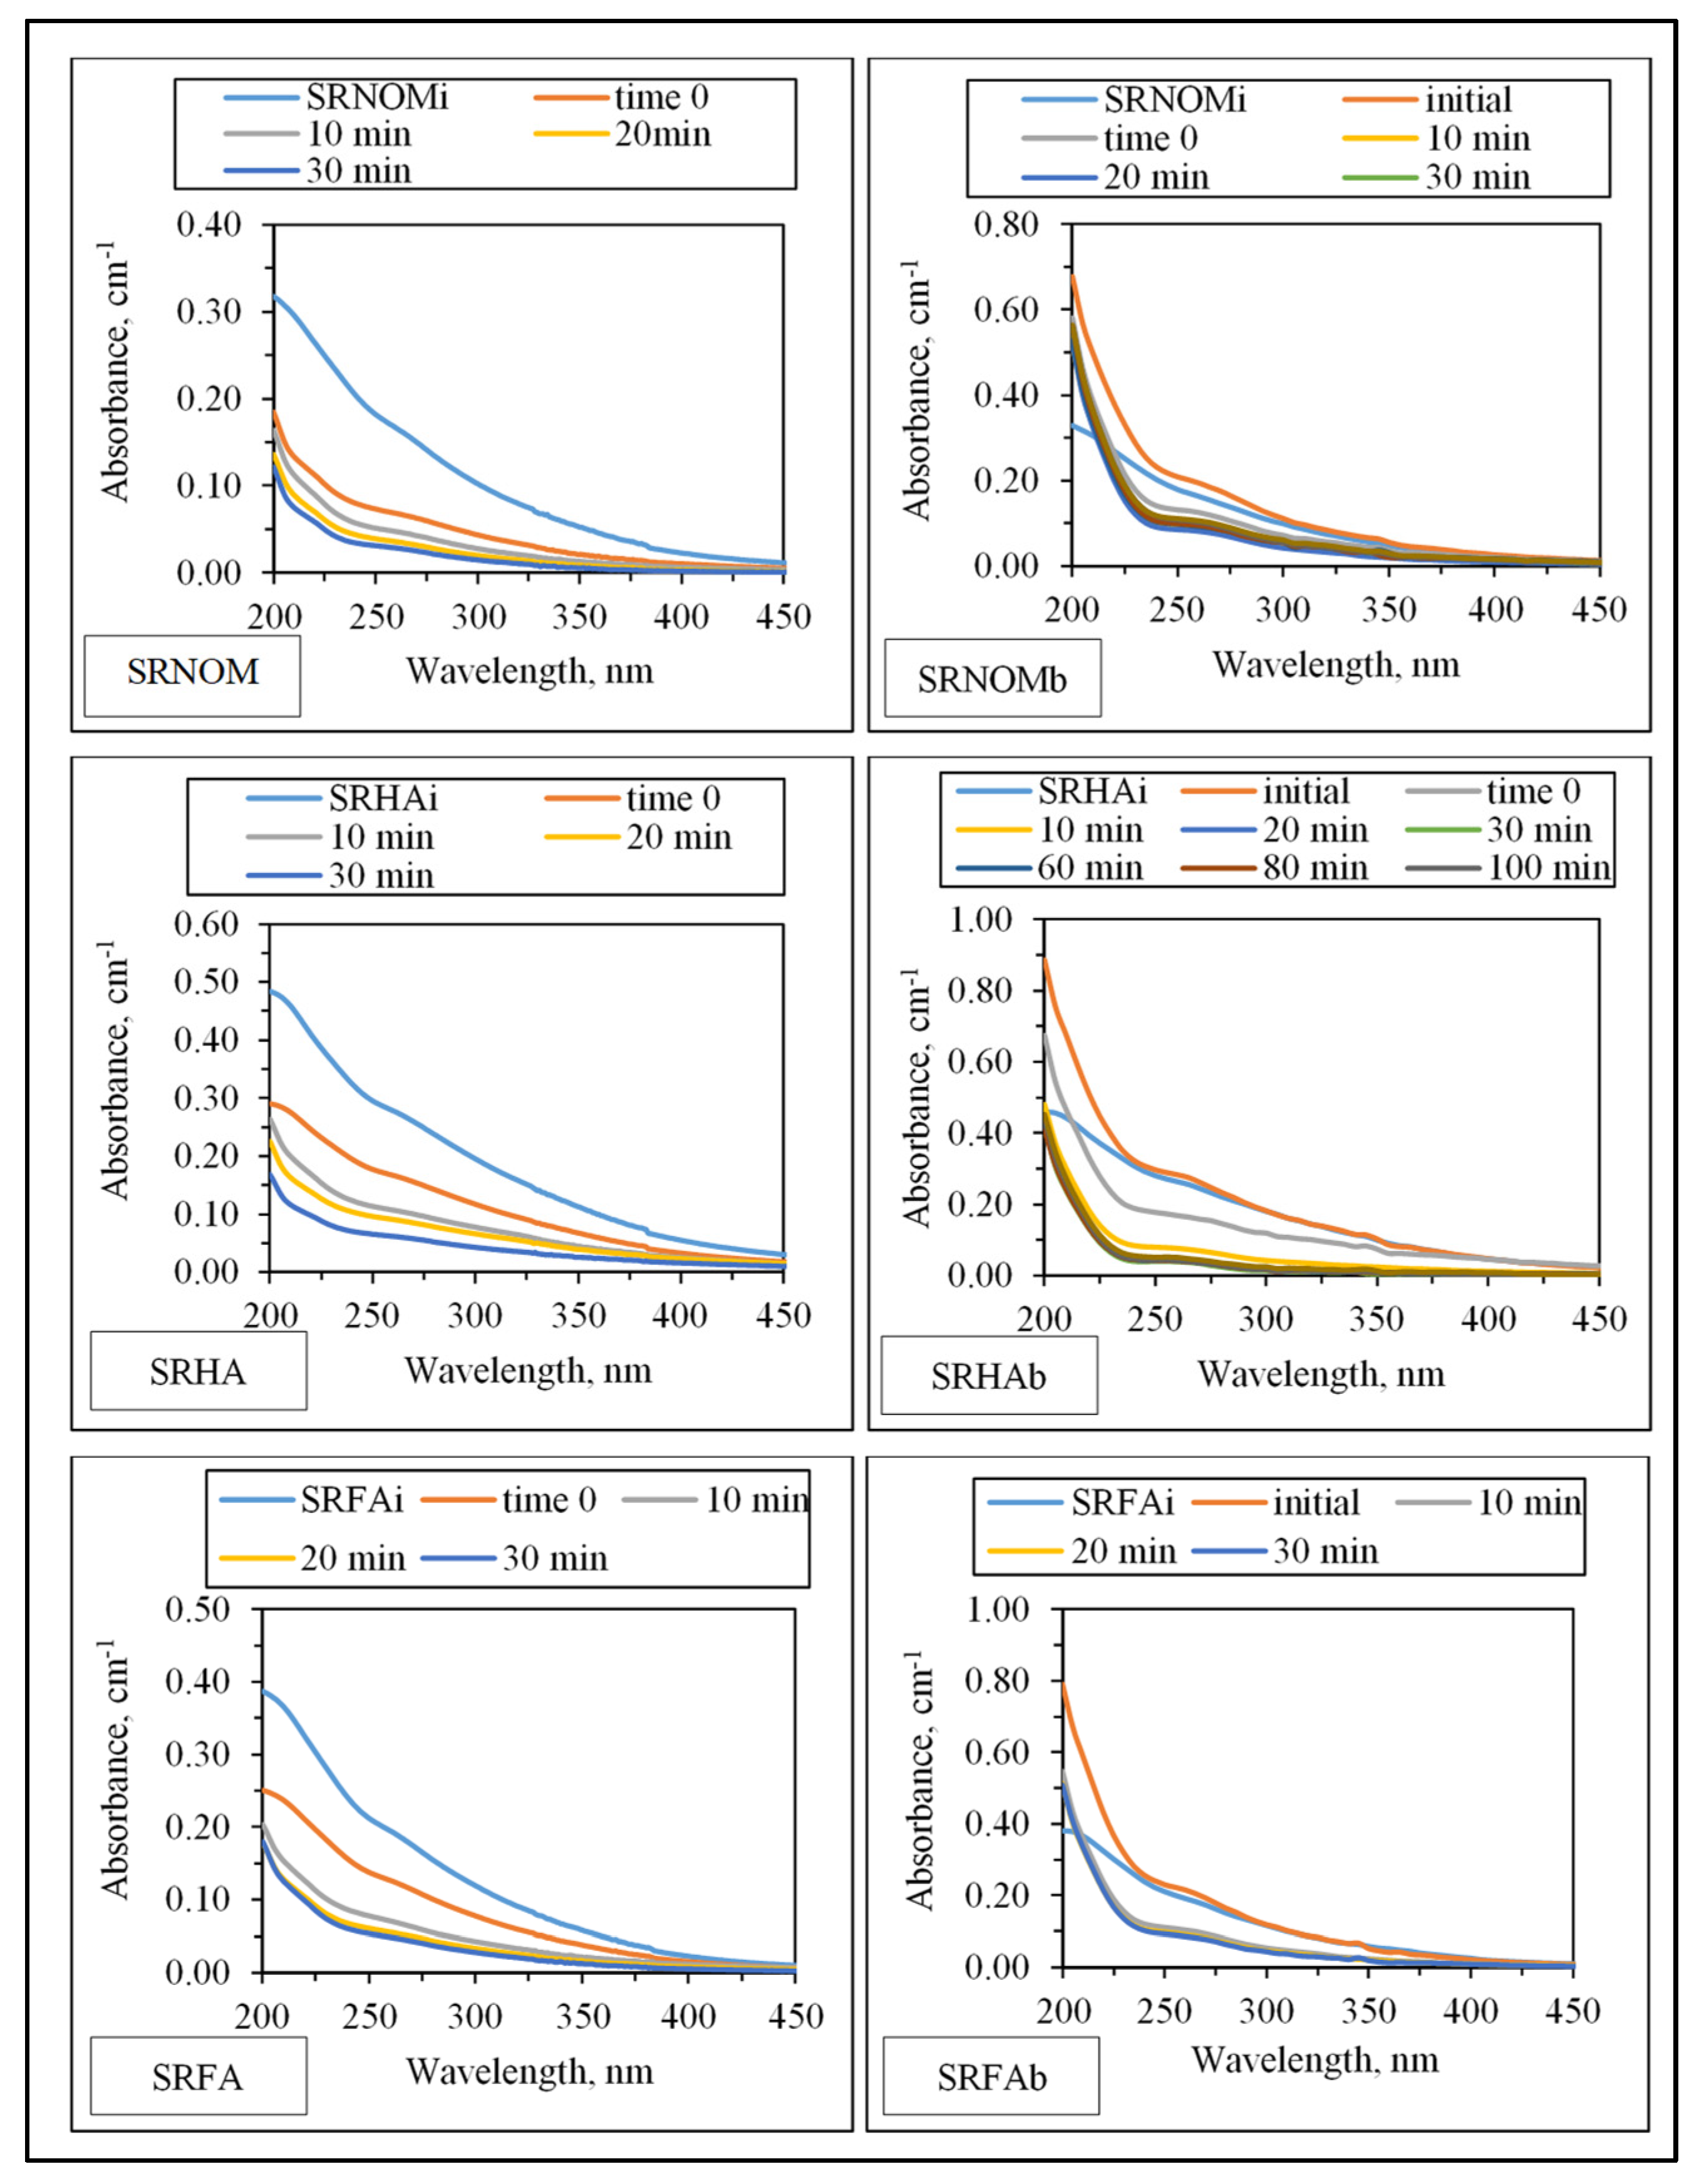
UV–VIS absorption spectral features displayed a decaying profile of absorbance with respect to increasing wavelength (
Figure 3). SRNOM
i, SRHA
i, and SRFA
i represent sole NOM analogue compounds, the initial represents the organic matrix obtained by successive filtration through 0.45 μm and 0.22 μm membrane filters right after addition of
E. coli to the solution matrix in the absence of LF, and t = 0 represents organic matrix obtained by successive filtration through 0.45 μm and 0.22 μm membrane filters in the presence of NOM and
E. coli and LF. The extent of the initial adsorption of humic sub-fractions onto LF both in the presence and in the absence of
E. coli could also be visualized by initial adsorption data of humic UV–VIS parameters. In the absence of
E. coli, the initial adsorption of SRNOM onto LF revealed a 50–60% reduction in UV–VIS parameters, and SRHA displayed an increase of 40% removal of all UV–VIS parameters. However, UV–VIS parameters expressed different attractions to the LF surface, color-forming moieties being preferentially adsorbed (54%) onto LF in comparison to UV-absorbing centers (38%) of SRFA. However, in the presence of
E. coli, the adsorption extent decreased to 24–37% for SRNOM and 12–40% for SRHA and preferential adsorption of color-forming moieties in comparison to UV-absorbing centers of SRFA was observed. It should also be emphasized that the release of EPS from
E. coli affected the adsorption extents under all conditions. Considering the sole effect of NOM analogue compounds on
E. coli inactivation upon solar simulated irradiation conditions, protection from photoinactivation was reported in an HA range of 1–50 mg/L [
25].
Insignificant absorbance values for λ > 400 nm indicated the absence of chromophoric groups (color-forming moieties) related to the presence of systems including conjugated double bonds, aromatic rings, and phenolic functional groups containing atoms with lone pairs of electrons. Initial conditions revealed the release of organics expressing a shoulder in the 240–280 nm wavelength range. Absorbance values at λ = 280 nm were not significantly different from SRNOMi, SRHAi, and SRFAi. However, in the UV range of λ > 250 nm, a sharp absorbance increase was evident under all conditions irrespective of NOM type. Upon introduction of LF to the suspension composed of E. coli and NOM compounds, the overall effect of surface interactions could be assessed by decreased absorbance values. The resultant organic matrix and E. coli cells were further subjected to solar photocatalysis. Following initiation of light exposure, a time-dependent decrease in absorbance was recorded in all spectral wavelength ranges.
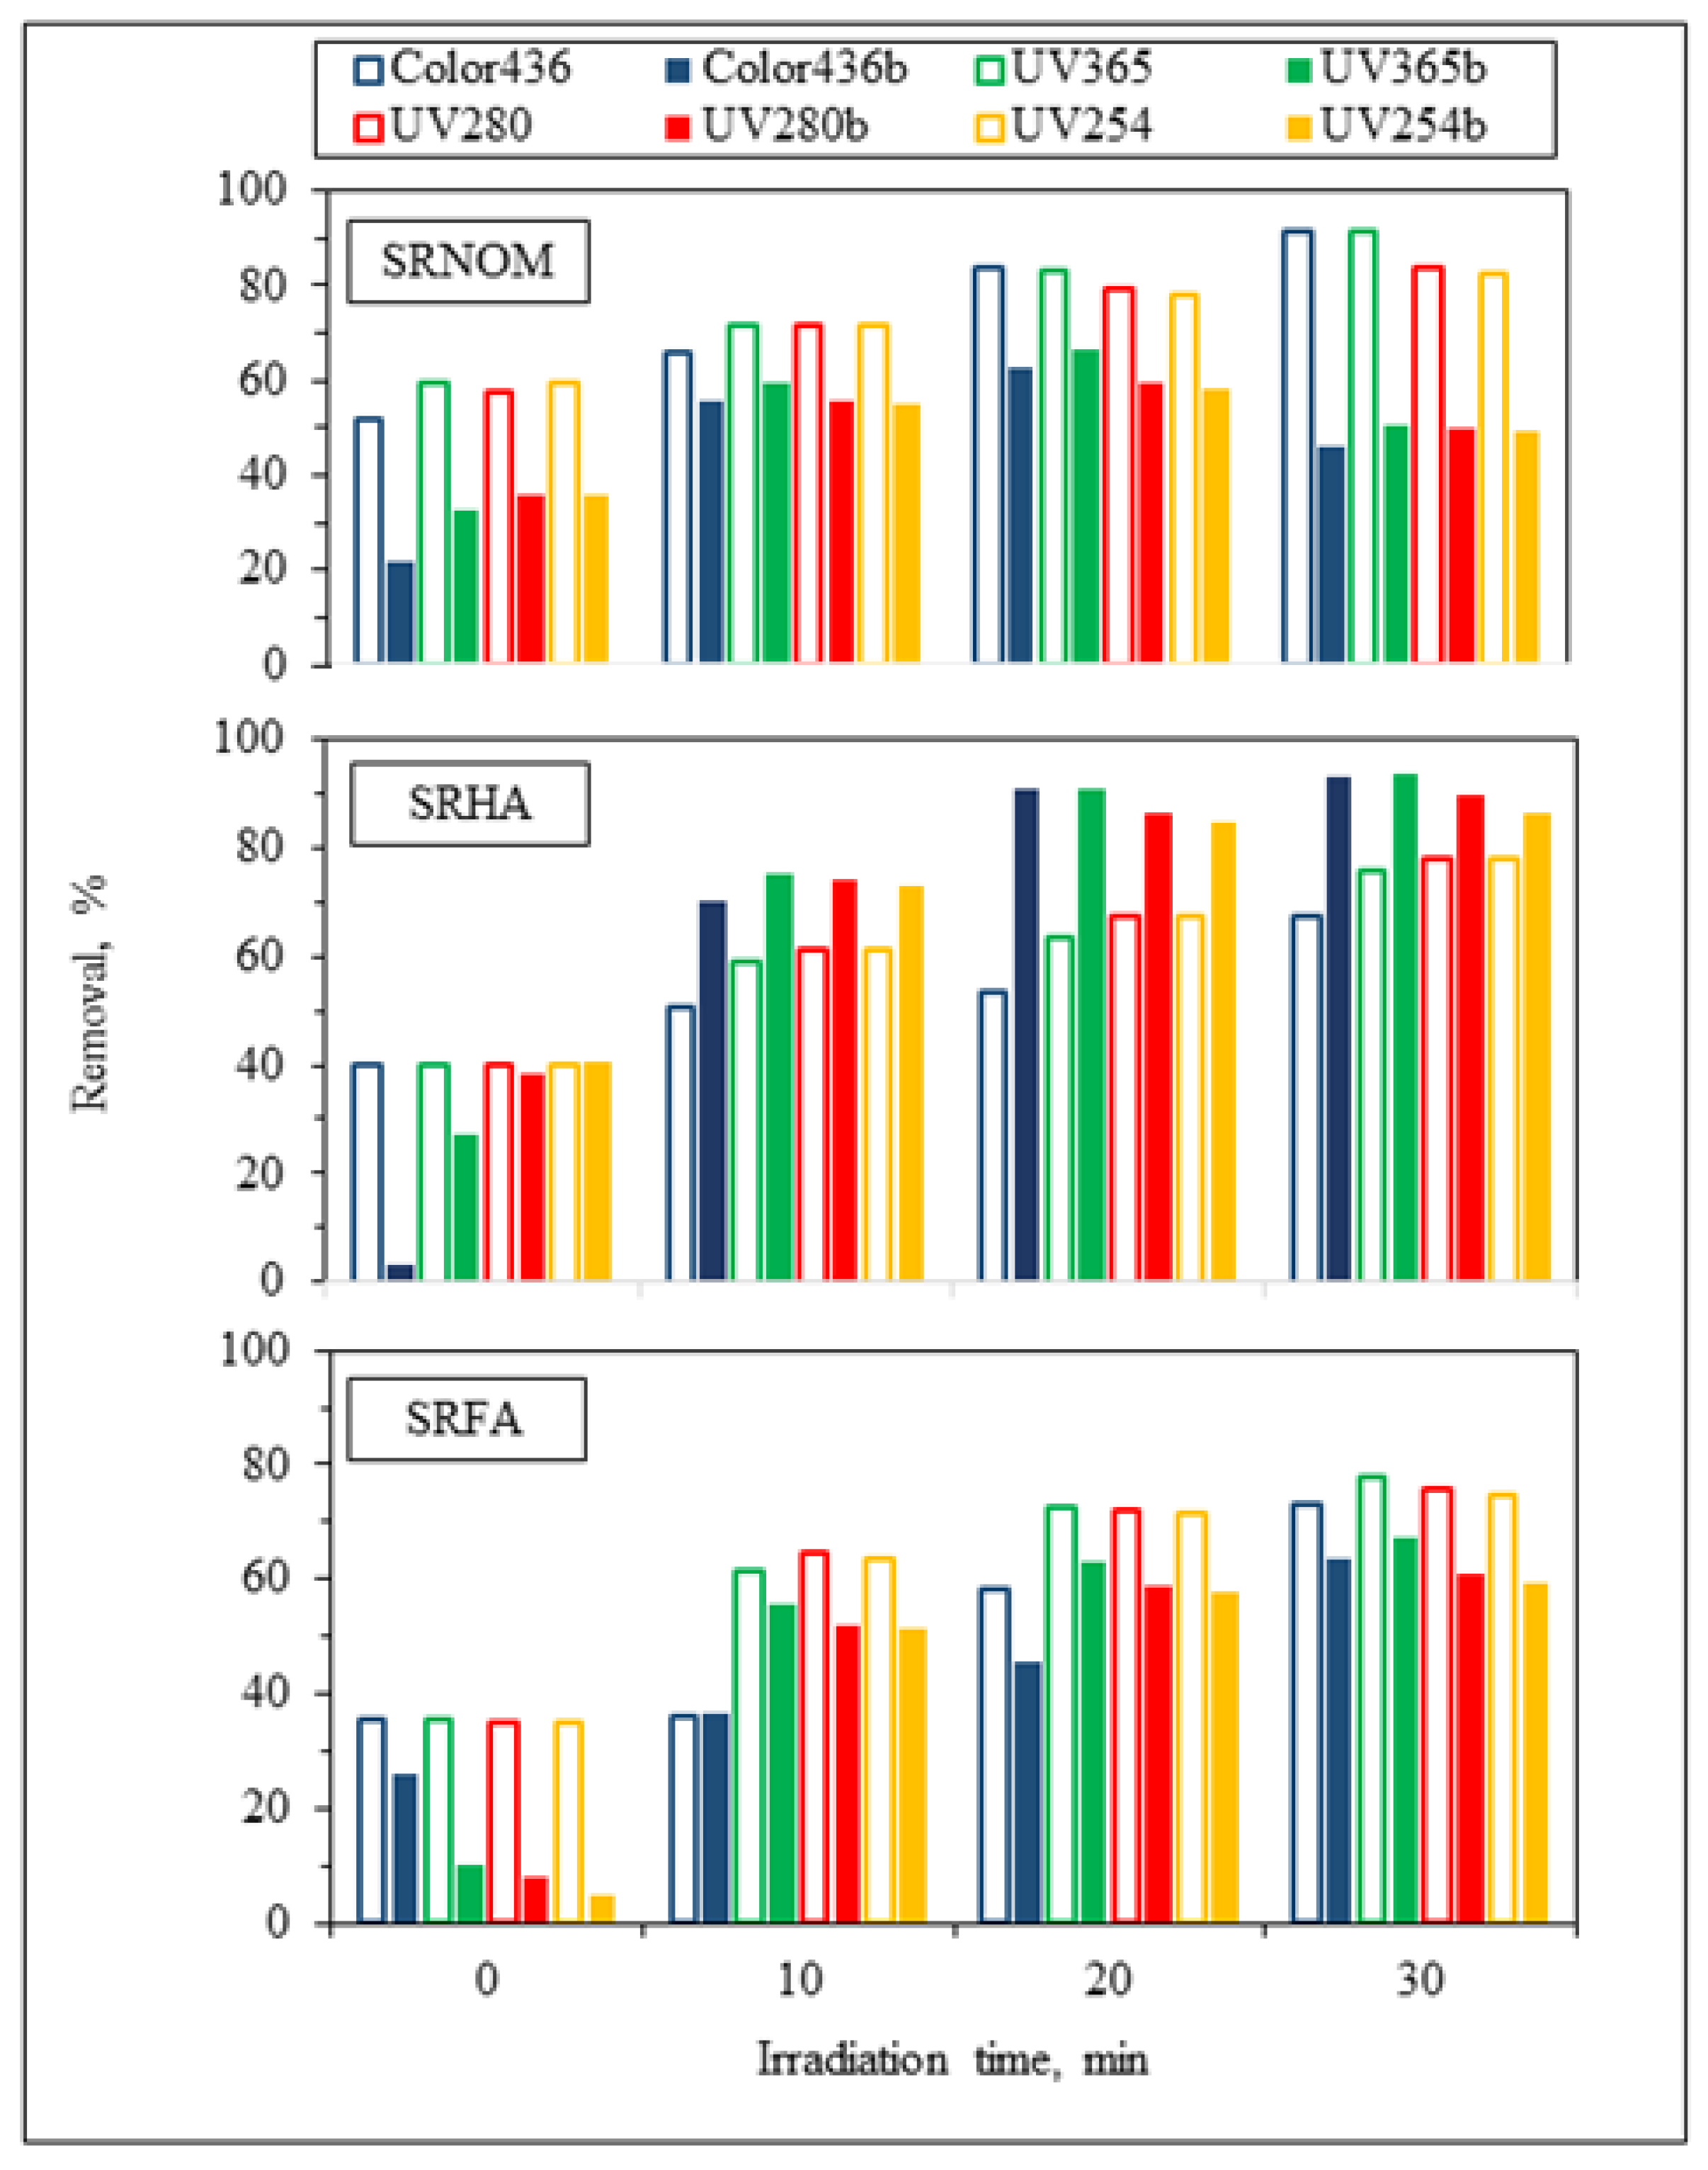
For the assessment of specified UV–VIS parameters, irradiation-time-dependent removal profiles in the absence/presence of
E. coli using NOM analogues were addressed in
Figure 4. Prior to evaluation of solar photocatalytic removal efficiencies of specified UV–VIS parameters, initial adsorption percentages were calculated to understand the surface coverage of LF in the absence/presence of
E. coli. Upon instantaneous adsorption onto LF, UV
254 adsorption percentages were reduced from 60% to 36% for SRNOM and from 35% to 5% for SRFA, and no change was observed for SRHA. Regarding effective sizes of system variables, LF is expected to be adsorbed on
E. coli cells through electrostatic interactions, whereas NOM analogues would have a tendency to be adsorbed onto LF, which was already adsorbed on bacterial cells. Consequently, the reduction in the surface coverage of LF particles could be attributed to occupying available sites of LF by
E. coli cells, therefore reducing the interactions between active sites of the LF catalyst and NOM compounds [
26,
27].
Following an irradiation period of 30 min, UV
254 removal efficiencies were reduced from 83% to 49% for SRNOM and from 75% to 59% for SRFA, whereas in the presence of SRHA, the UV
254 removal efficiency showed enhancement from 78% to 86%, indicating that the presence of
E. coli significantly affects the overall removal efficiency of aromatic content either as enhancement or as diminution. In the presence of both
E. coli and NOM analogues, UV
254 removal efficiencies of organic matrices were revealed in decreasing order as SRHA > SRFA > SRNOM. The reason could be attributed to the aromatic content of NOM analogues, which has a strong effect on light transmission as well as energy consumption from UVC and solar irradiation [
28]. Enhancement of the removal of specified UV–VIS parameters in the presence of SRHA could be related to its higher degree of aromaticity, as expressed by the SUVA
254 value (7.27 L/mg m), in comparison to SRNOM (4.18 L/mg m) and SRFA (4.53 L/mg m) (
Table S1).
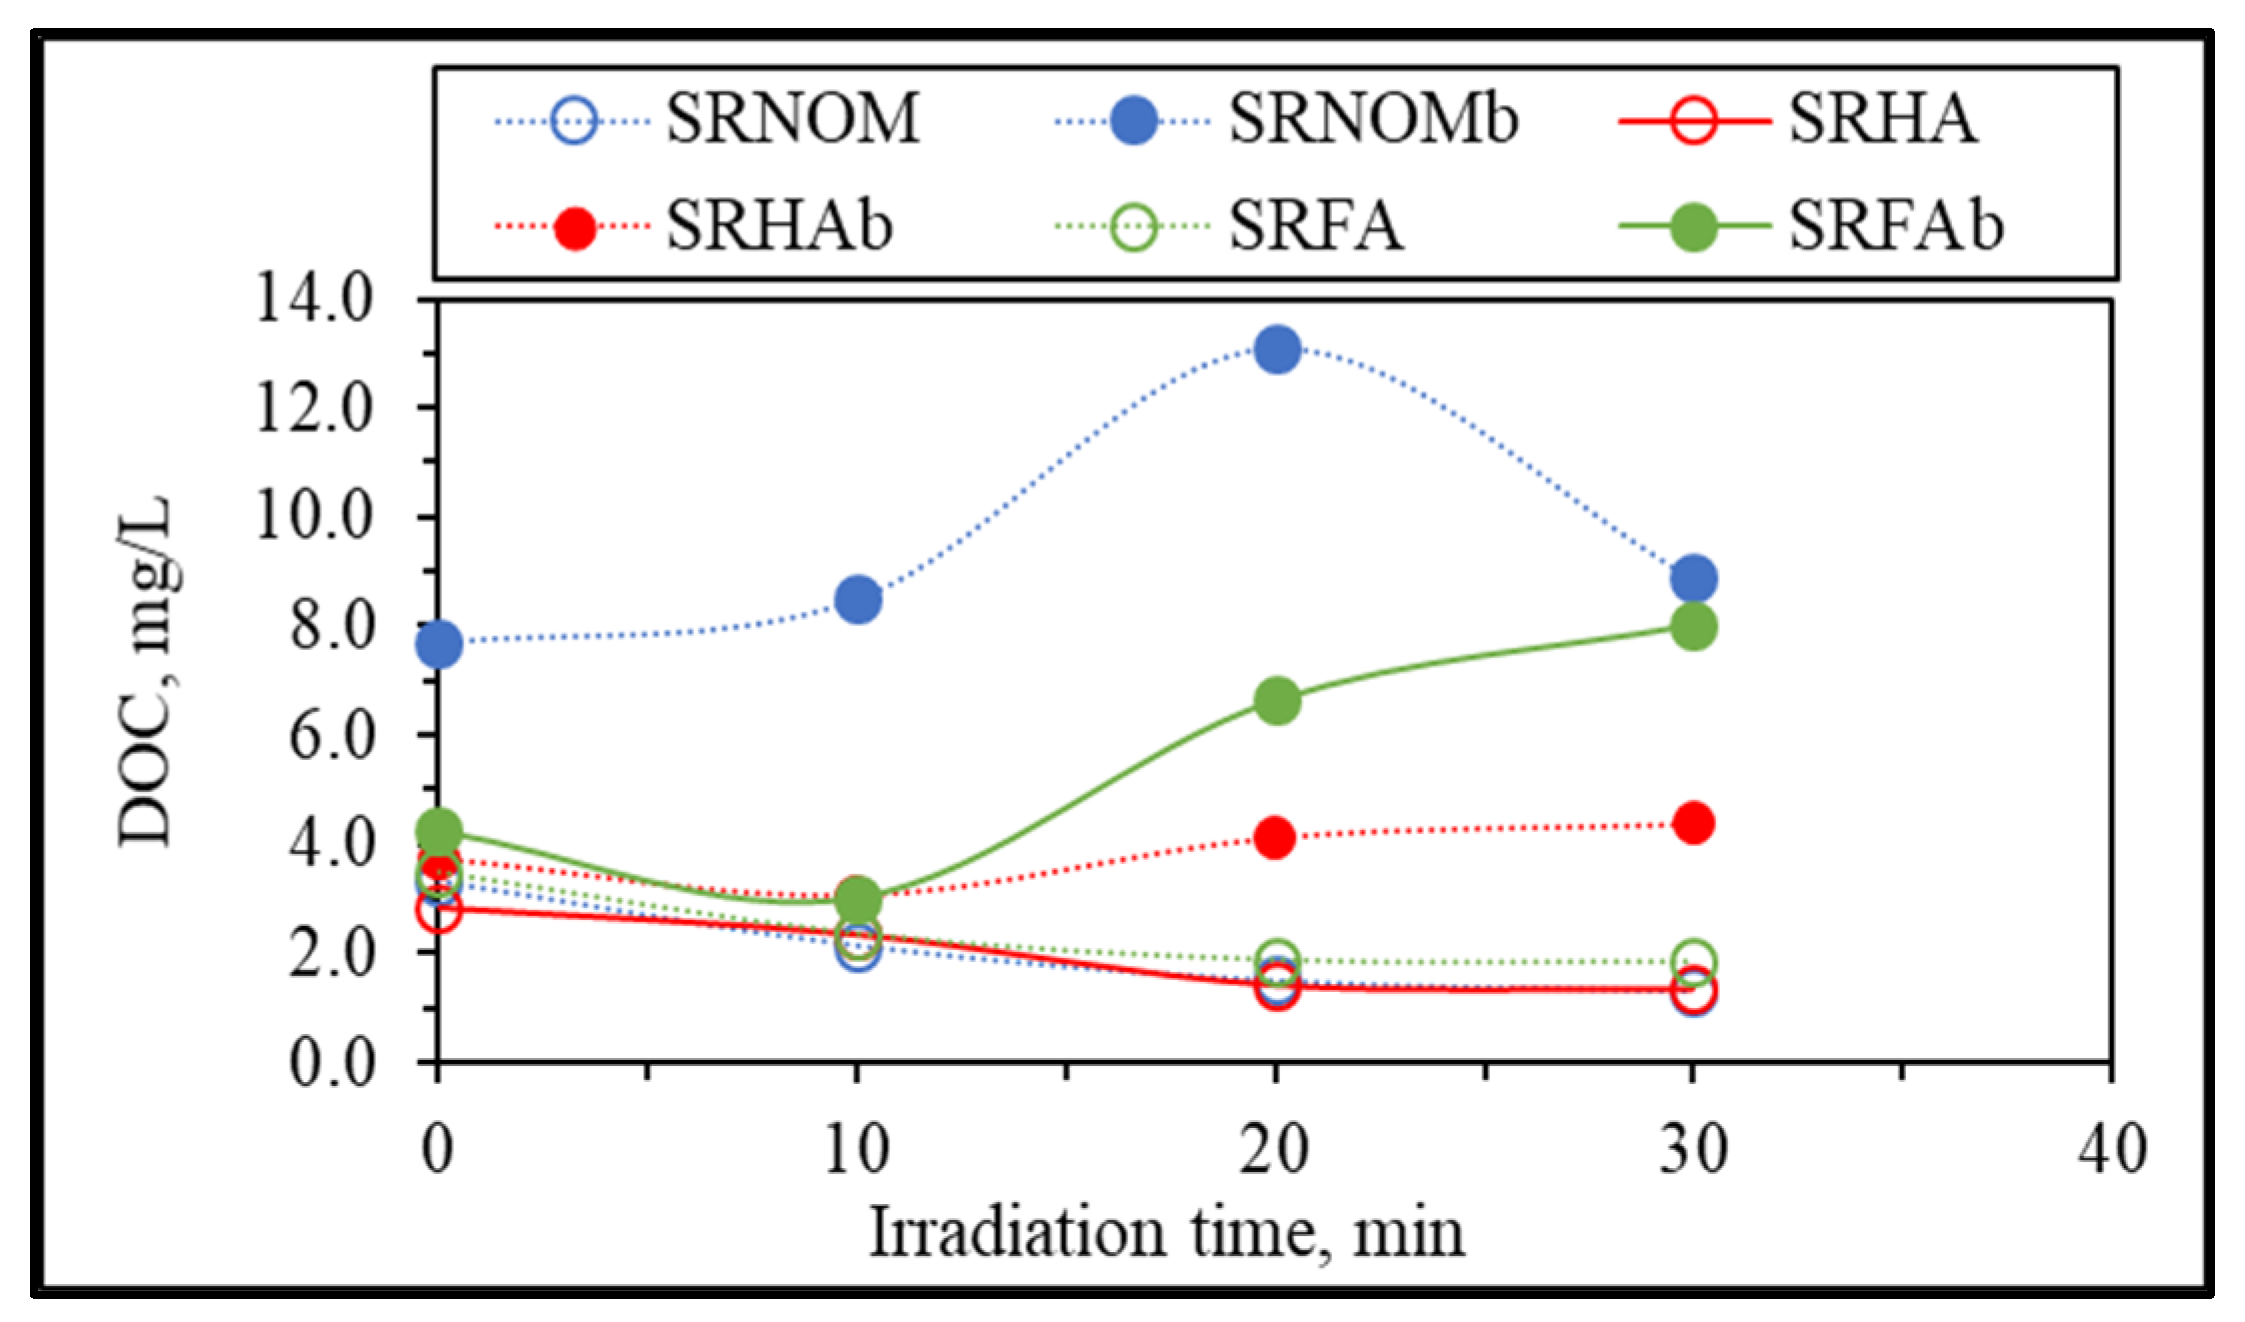
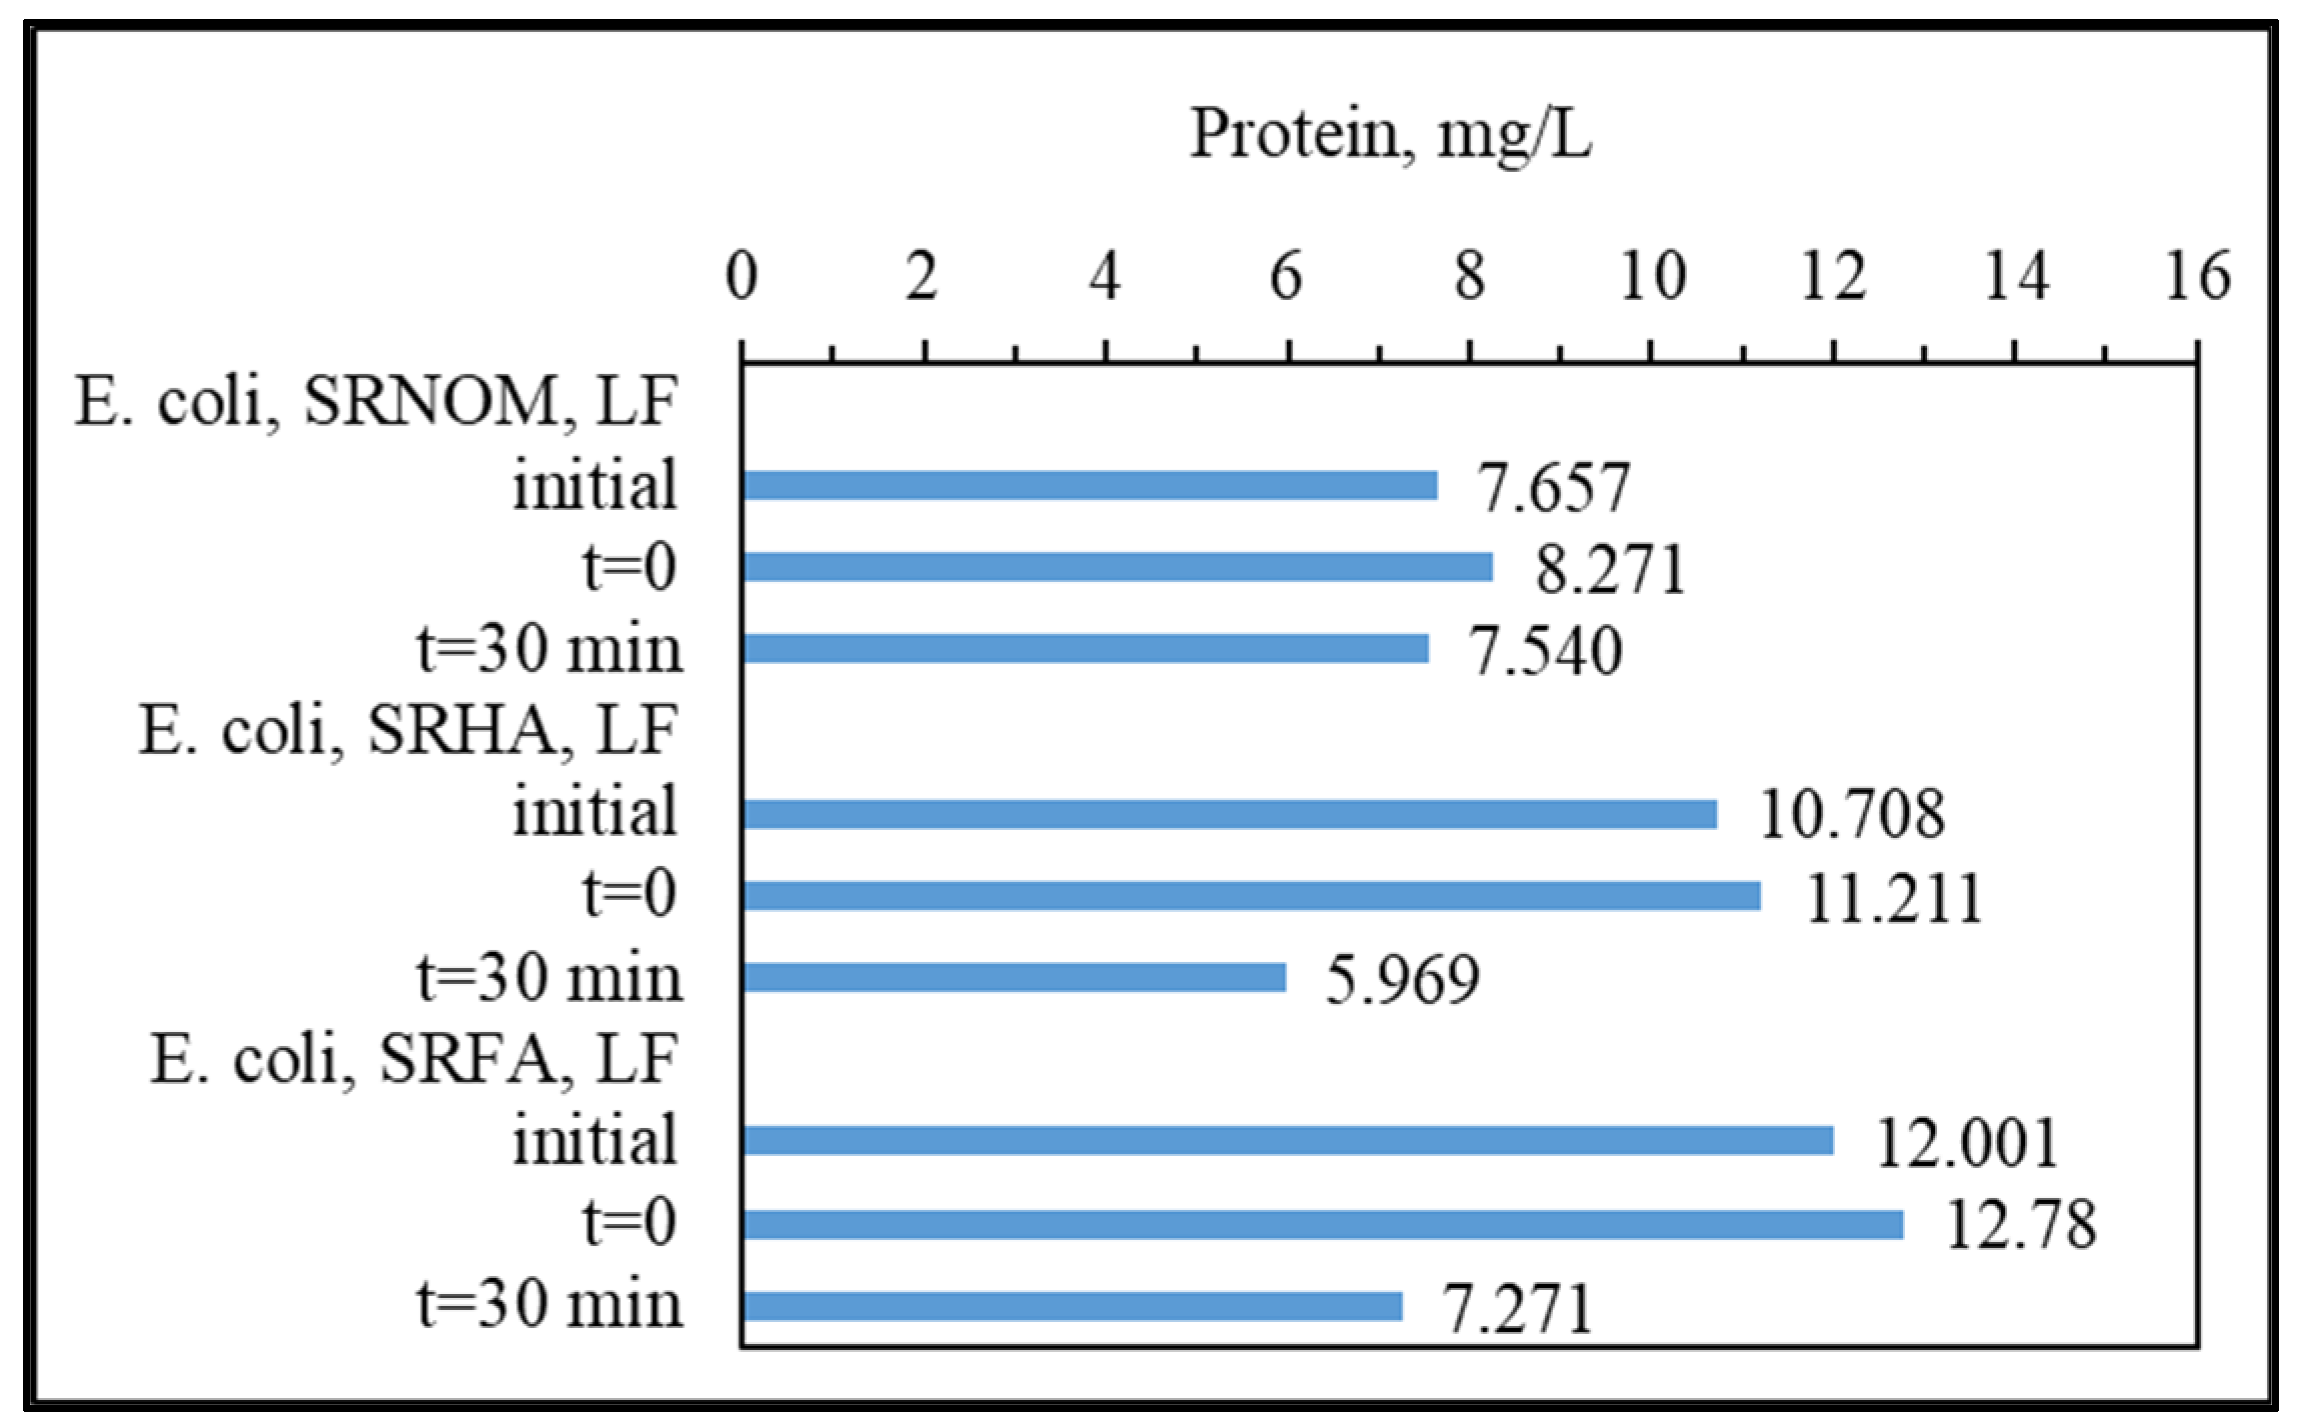
Further evaluation of changes in organic matrices upon solar photocatalytic degradation of NOM compounds in the absence/presence of
E. coli was assessed in terms of irradiation-time-dependent changes in DOC contents, as presented in
Figure 5.
Upon exposure to the solar photocatalytic degradation process, NOM representatives expressed a humic-like exponential decay profile for the DOC content with respect to increasing irradiation periods [
29]. In contrast, the presence of
E. coli displayed variations in DOC contents with respect to irradiation time, especially following t
irr = 20 min, which could be attributed to the release of cell components via the attack of reactive species on the cells. Upon destruction of bacterial cells, the release of aromatic proteins, such as tryptophan, tyrosine, and phenylalanine, as well as carbohydrates, contributes to the overall organic composition and therefore increases the DOC content, because these components can be retained in the reaction medium even after filtration through a 0.45 μm filter [
30,
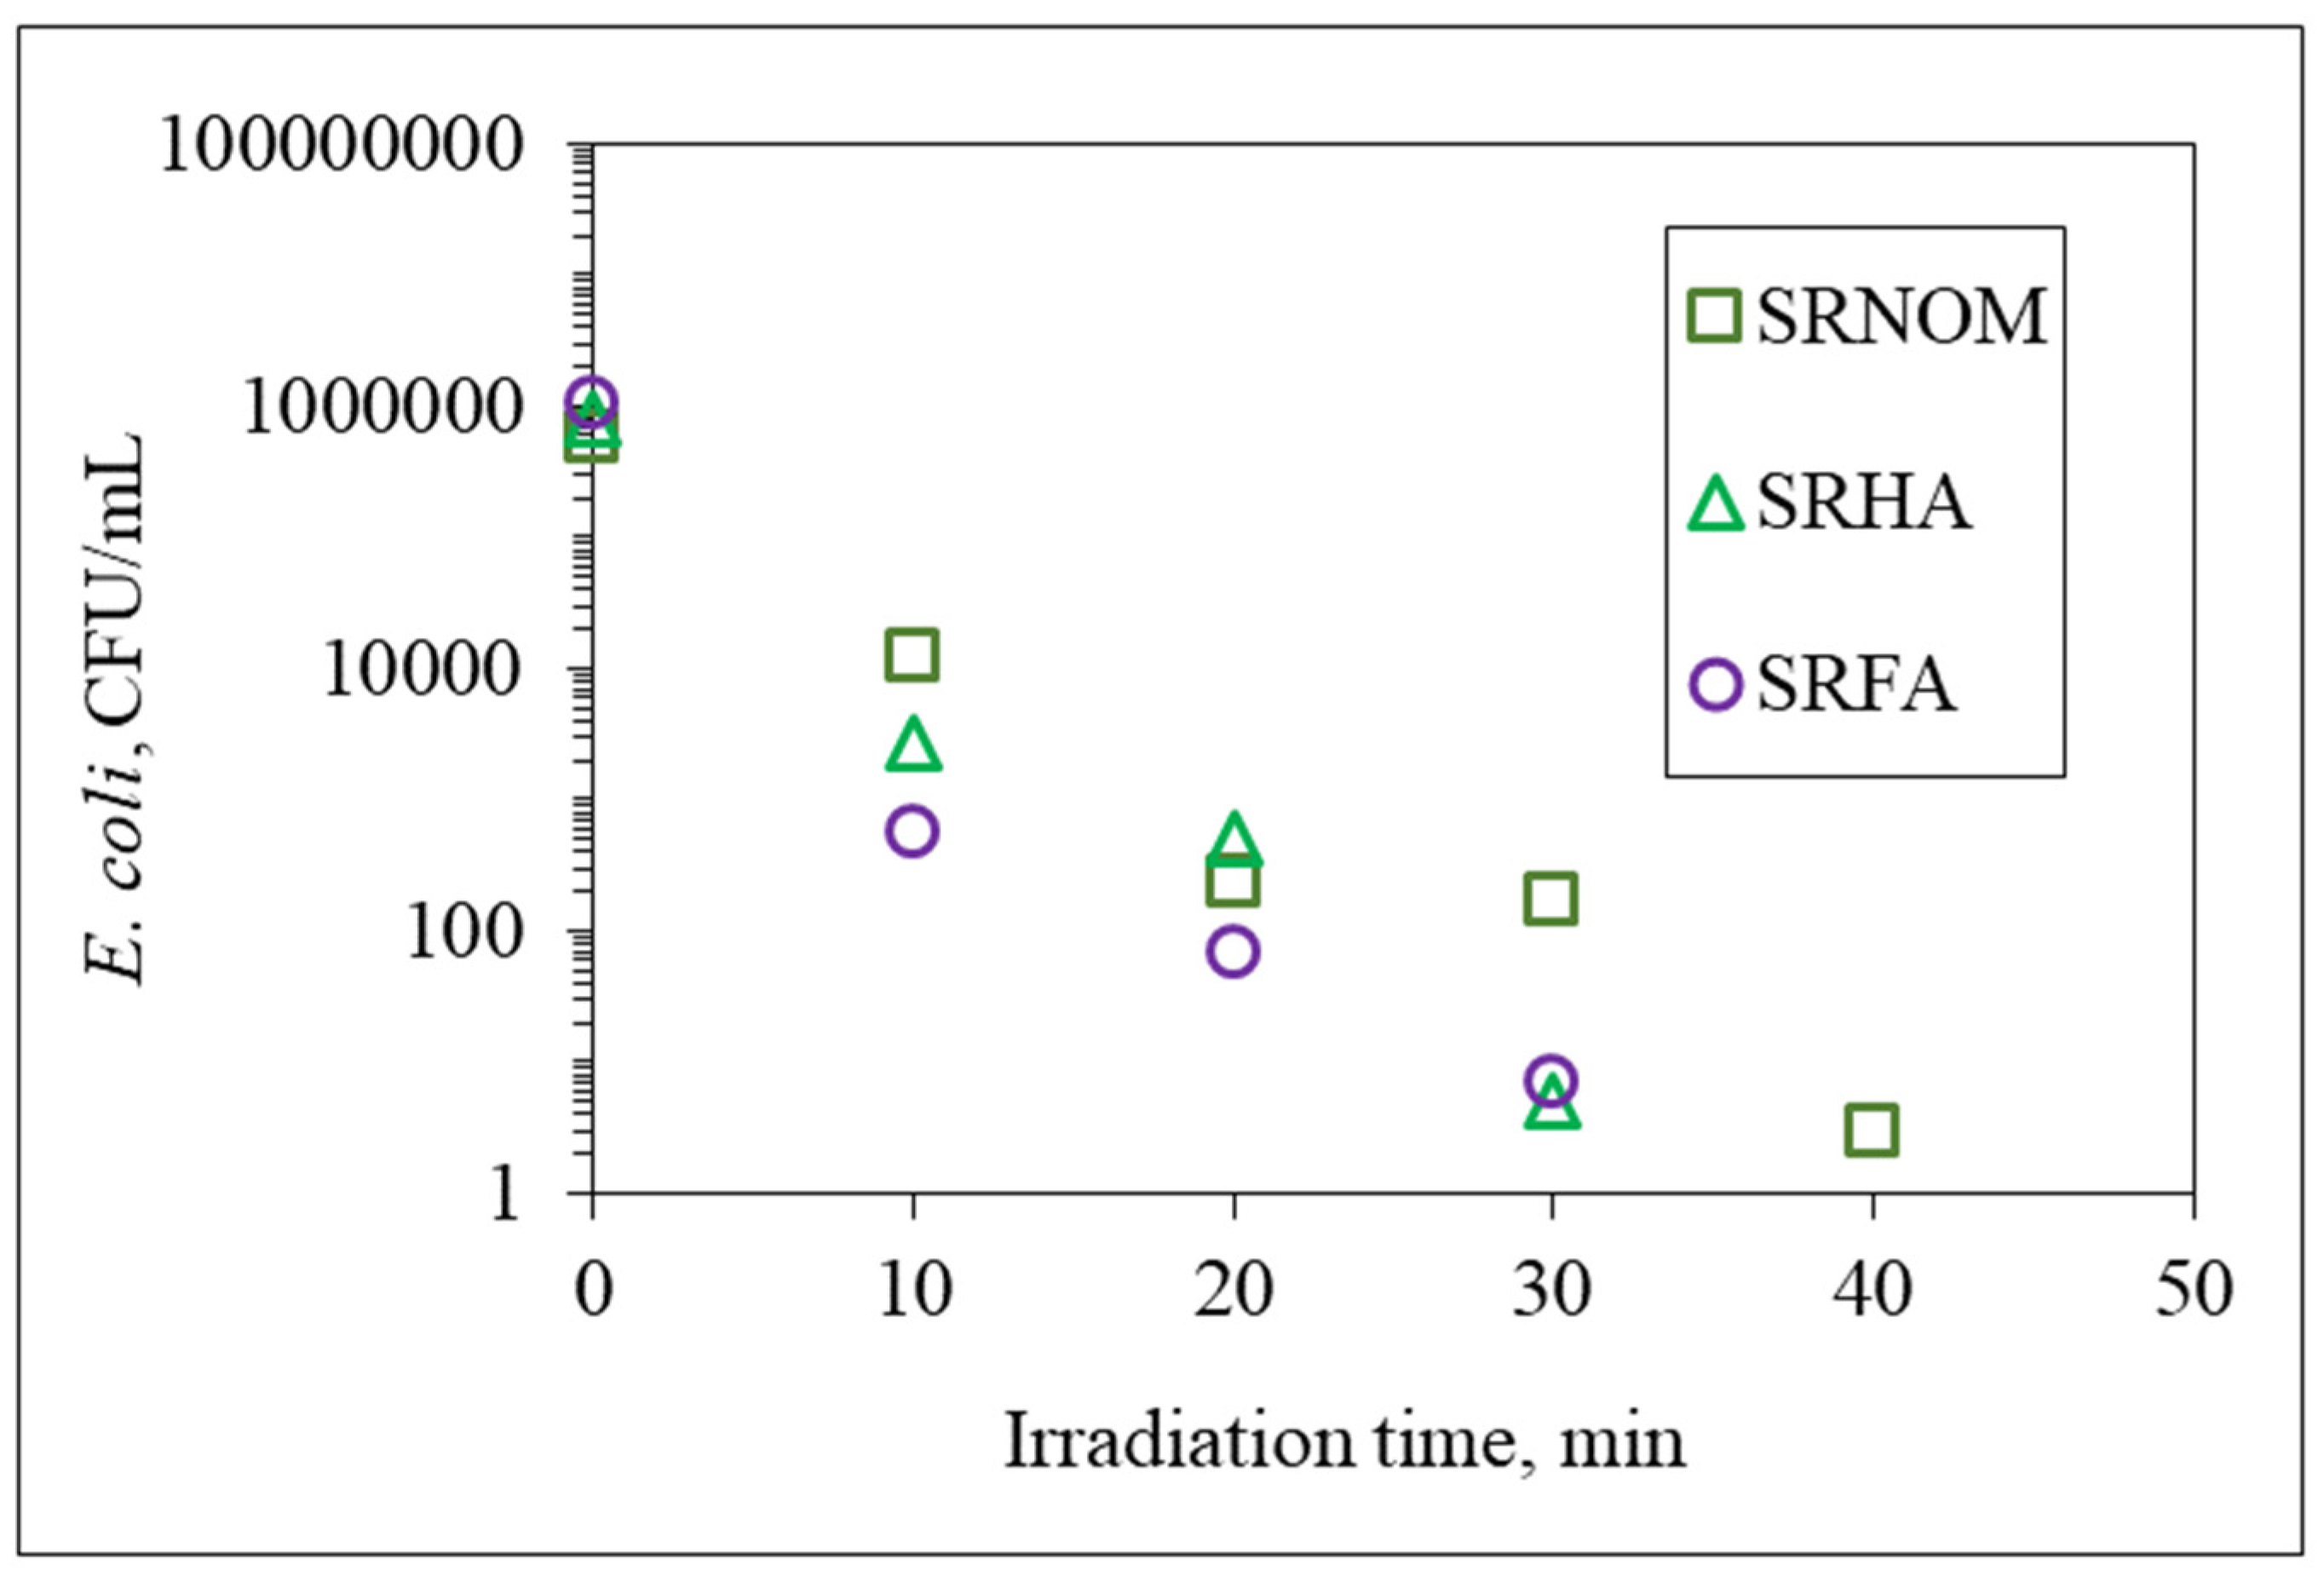
31]. In the presence of SRHA and SRFA, a 2-log reduction in the bacterial count was achieved following t
irr = 30 min, which led to the release of cell components that ended up with an increase in the total organic carbon content, whereas for the same irradiation period and in the presence of SRNOM, a noticeable reduction in the overall DOC content was observed. The reason could be the bacterial inactivation profile in the presence of SRNOM, which revealed a shoulder between t
irr = 20 min and 30 min, indicating that the primary reaction is addressed to solar photocatalytic degradation of SRNOM and/or cell-released organics in NOM-initiated reactions instead of bacterial cell destruction.
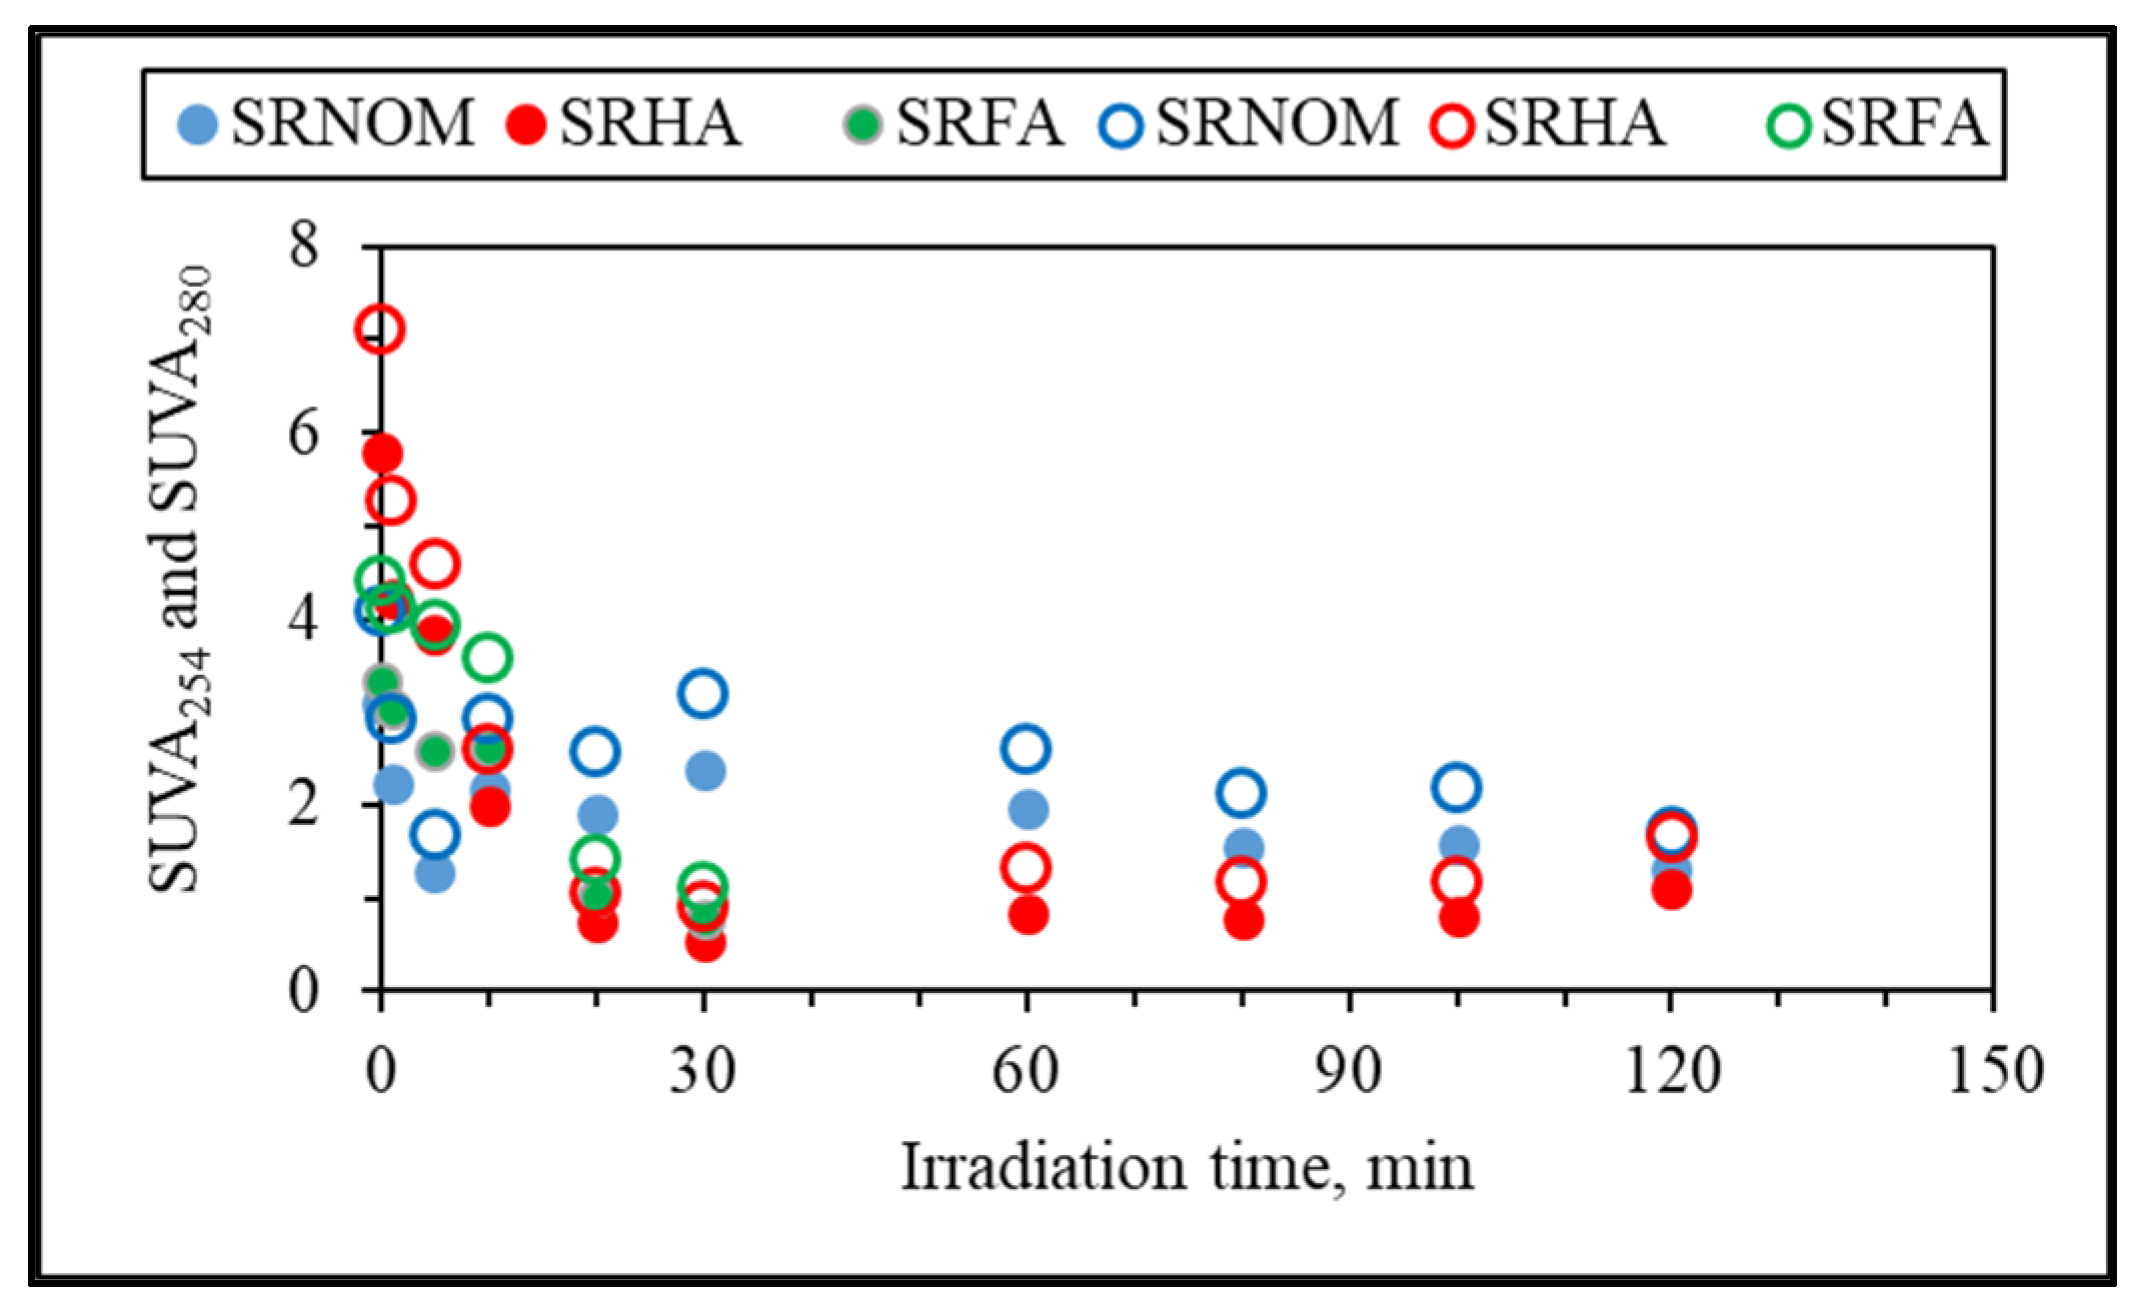
Additional elucidation of the system was directed to specific UV–VIS absorbance (SUVA, L/mg m) parameters named SUVA
254 and SUVA
280, which are defined as the DOC normalized values of UV–VIS absorbance values at 254 nm and 280 nm and explained successive removal of UV–VIS parameters in accordance with DOC contents (
Figure 6). Since insignificant release of color-forming moieties was obtained in comparison to UV-absorbing centers, only SUVA
280 and SUVA
254 were presented.
It could be deduced from specific UV parameters that upon an irradiation period of 30 min, specified UV parameters and DOC were removed simultaneously, being more significant for SRFA and SRHA. However, SRNOM expressed a slight increase followed by a decreasing order with respect to increasing exposure times. Nevertheless, since all of the specific UV parameters were less than 4, the organic matrix could be considered as expressing mostly an aliphatic character lacking color-forming chromophoric centers. Upon further exposure (tirr > 30 min), a steady trend was observed that could be ascribed either to a slow removal of both counterparts or to insignificant release of recalcitrant non-UV-absorbing organics.
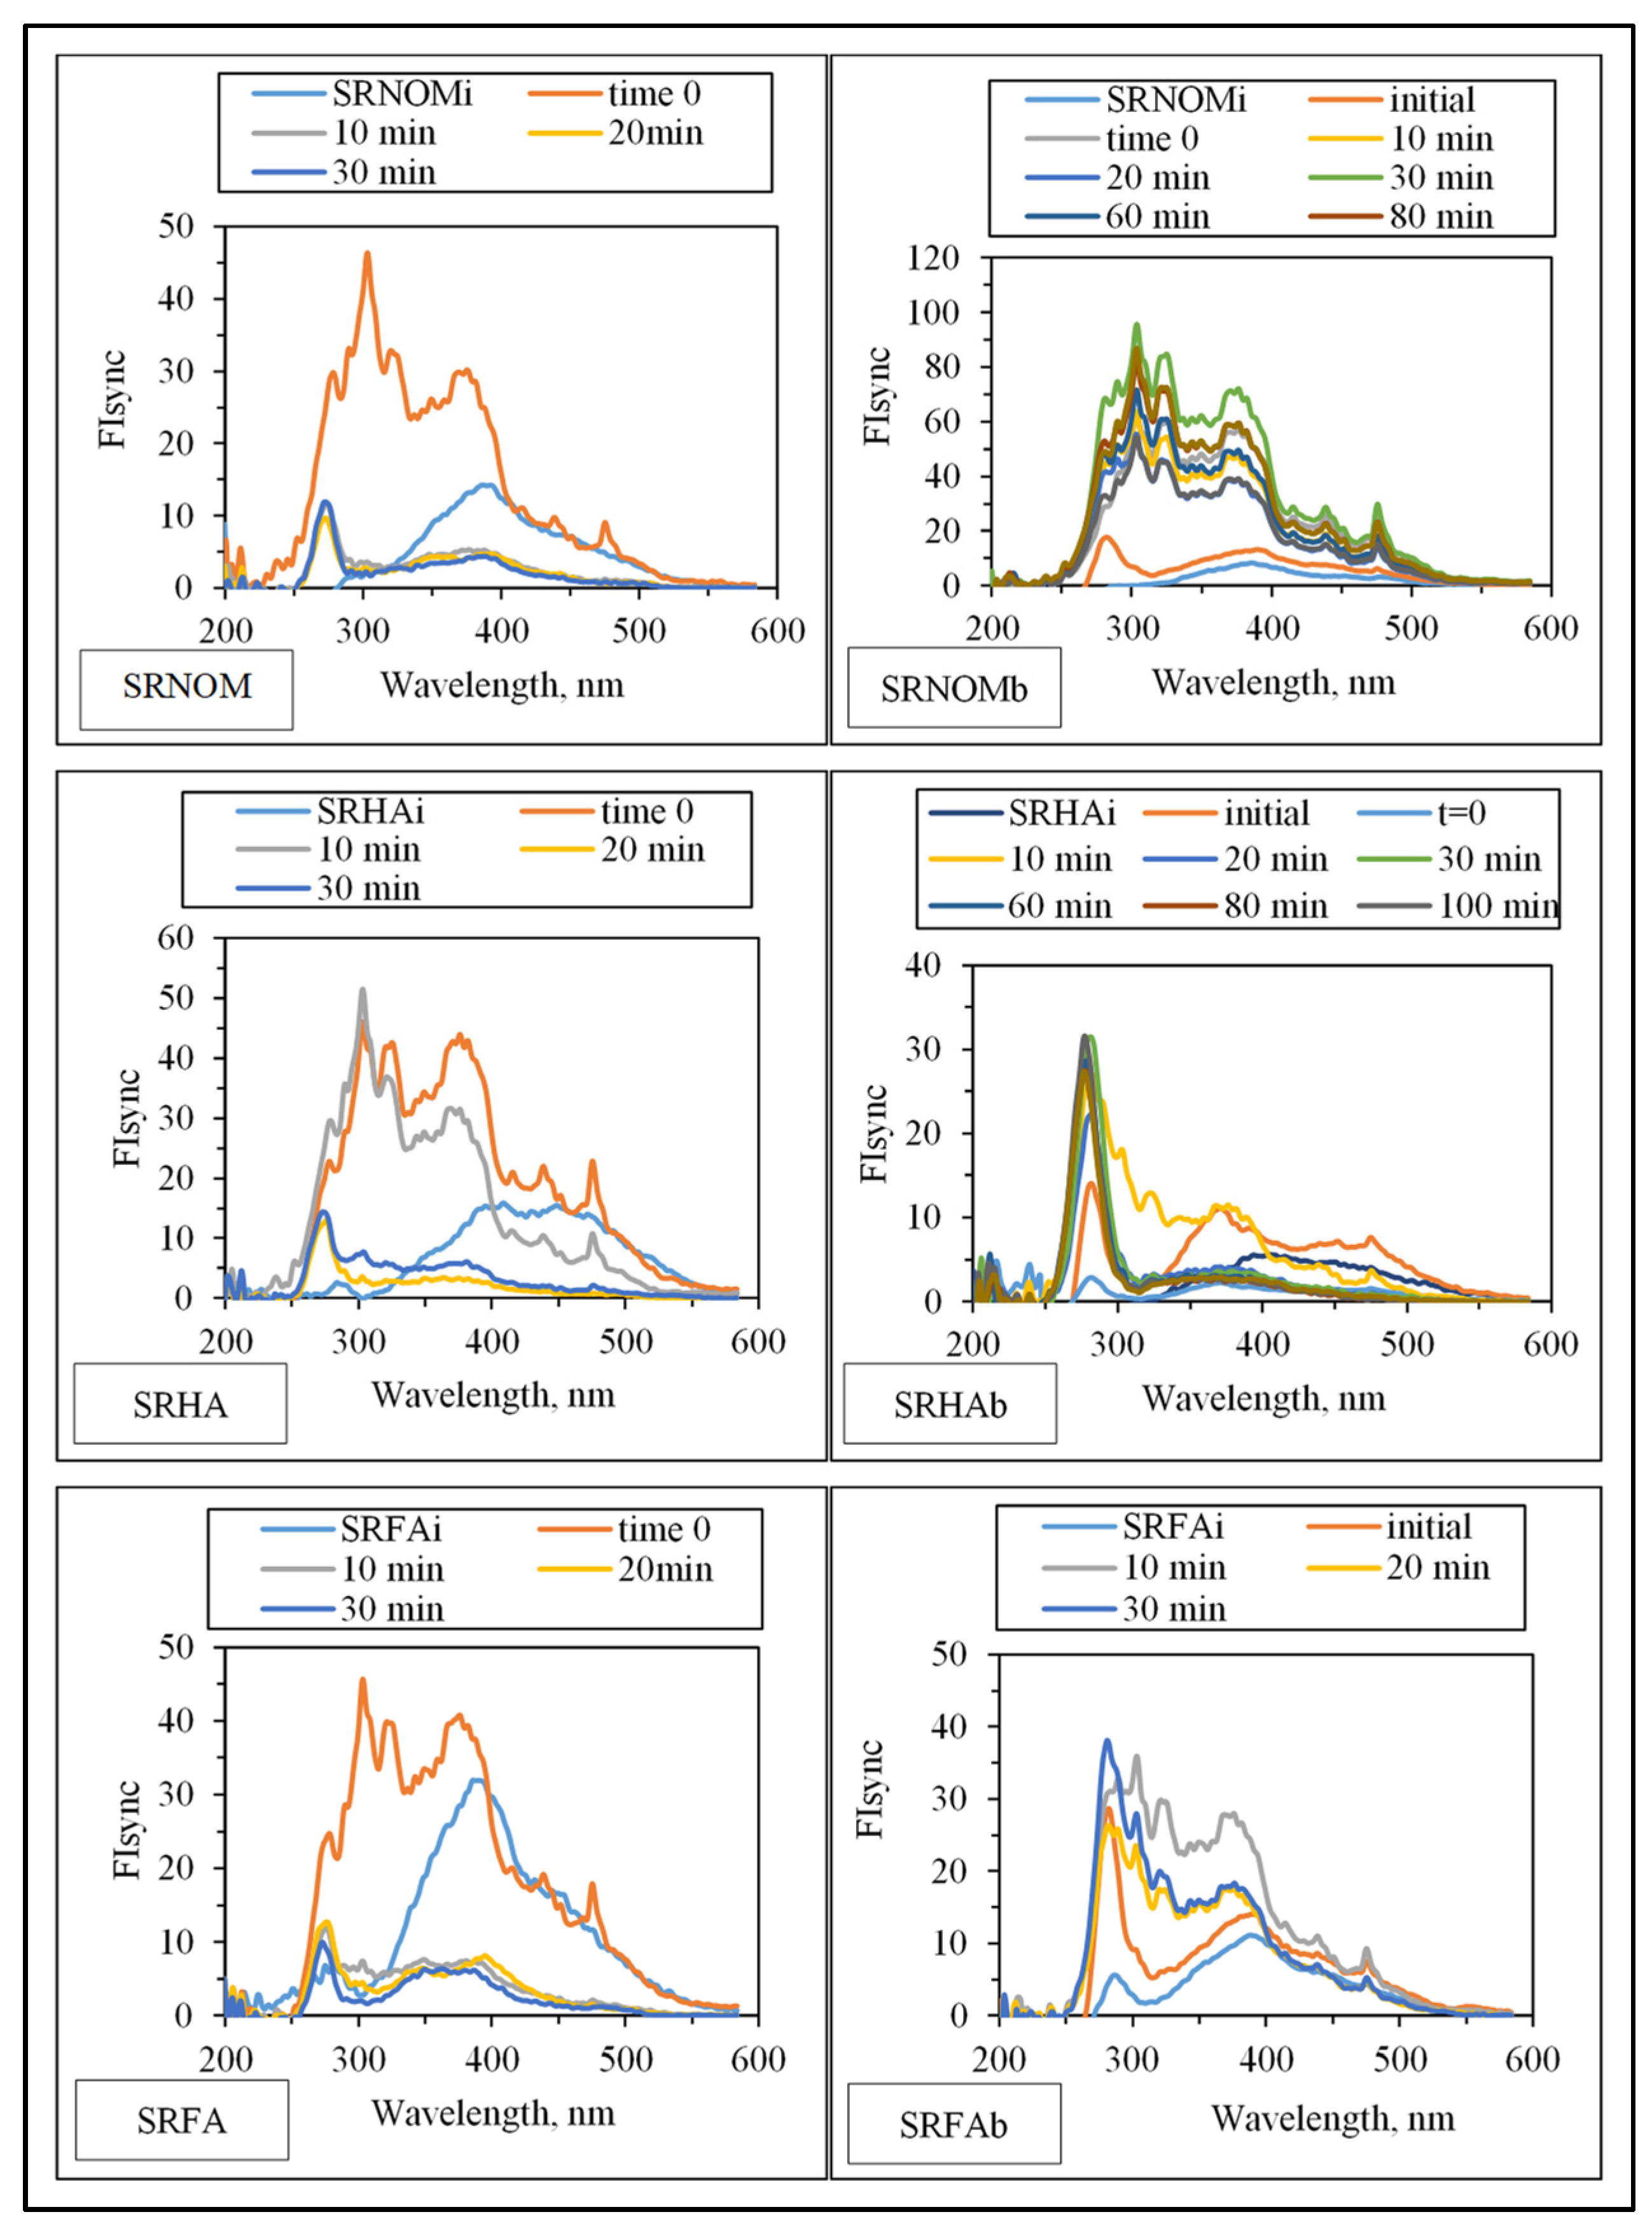
Synchronous scan fluorescence spectral features (indicated as synchronous scan fluorescence intensity, FIsync) of the organic matrix expressed irradiation-time-dependent variations with respect to the NOM analogue type (
Figure 7).
Emergence of fluorophoric centers was more pronounced in the presence of SRNOM comparison with SRHA and SRFA. Fluorescence intensity profiles presented a broad distribution in the emission wavelength range of 250–500 nm. However, SRHA expressed more ordered fluorescence spectra with a well-defined peak at λ = 280 nm and a rather broad peak at λ = 375 nm. Synchronous scan fluorescence spectra of SRFA resembled those of SRNOM, with a peak at λ = 280 nm accompanied by broad fluorophoric regions in the longer-wavelength region. Complete removal of all fluorophores was not observed in accordance with UV–VIS spectral features as well as DOC contents; however,
E. coli cells were almost completely removed (<10
2 CFU/mL) upon an irradiation period of 30 min. The underlying photochemical and photocatalytic reactions taking place in the presence of
E. coli and NOM compounds were presented in
SI.
3.1.2.2. EEM Fluorescence Features in Combination with PARAFAC Modeling
Discrimination of organic matrix components originating from either degradation of NOM or destruction of
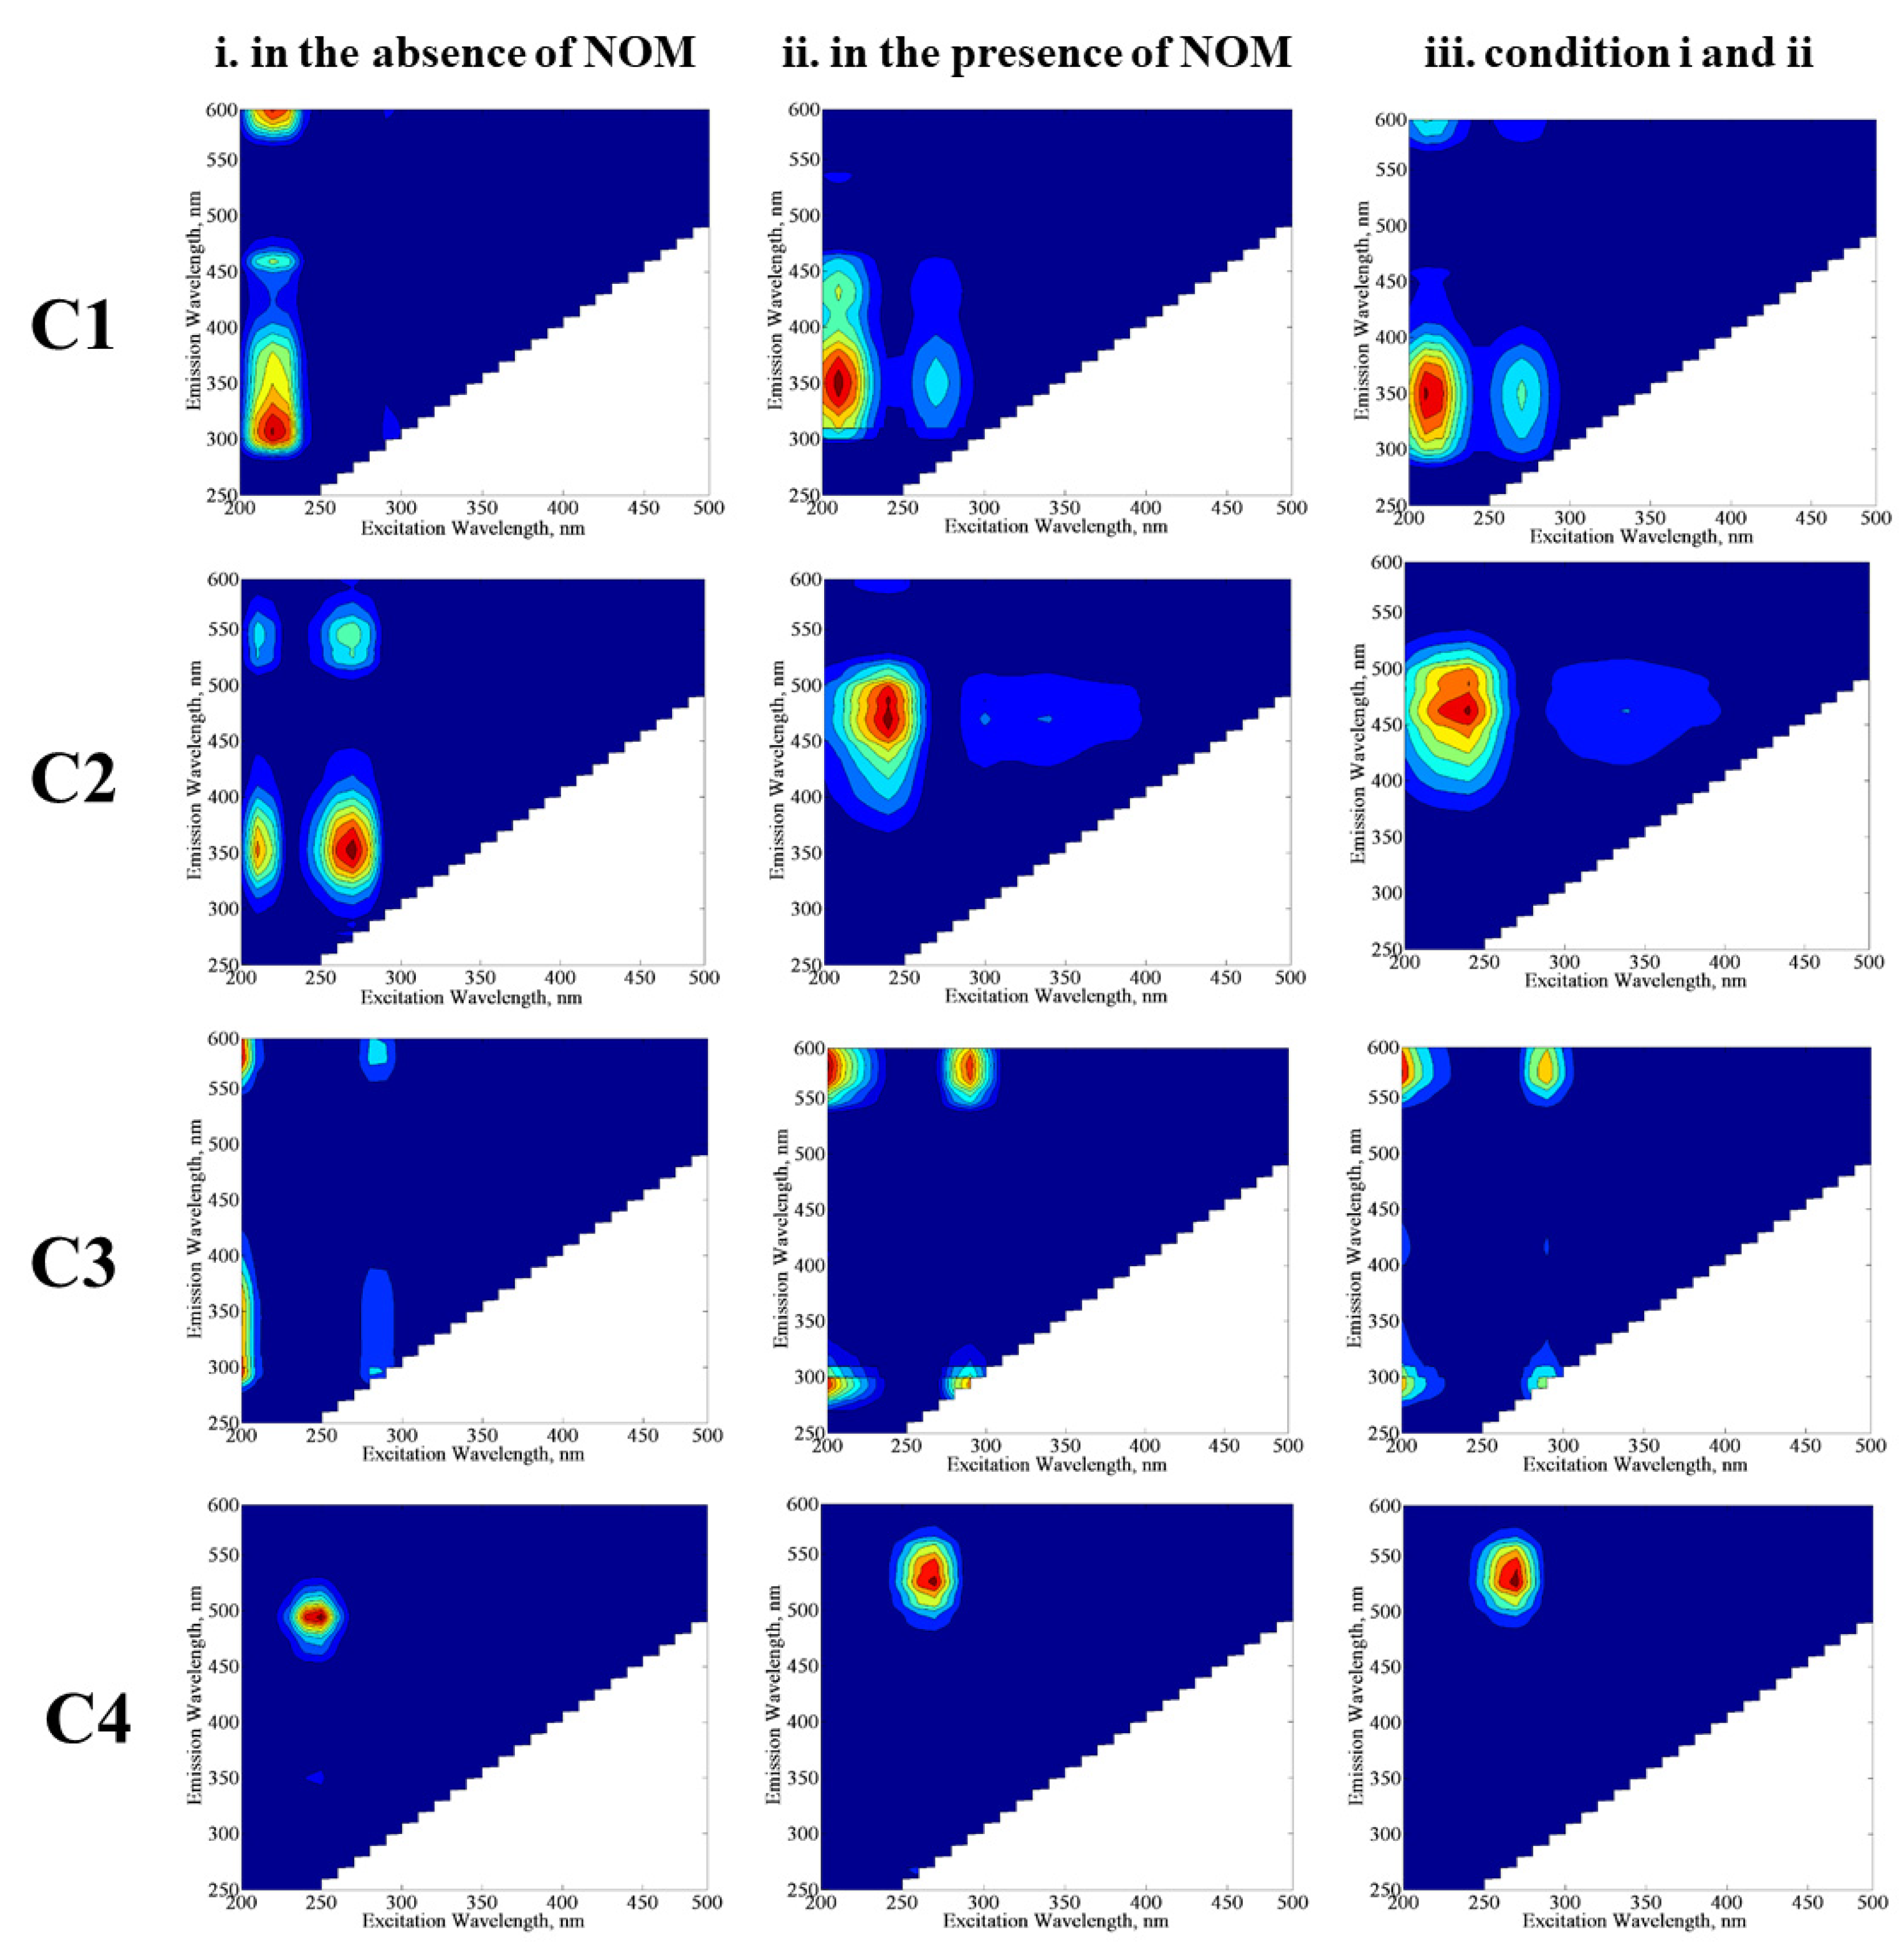
E. coli would provide further information about the behavior of these individual components with their own environmental significance. The excitation and emission maxima values of the components (C1, C2, C3, and C4) determined by the PARAFAC model (
Figure 8) were compared with related studies in order to classify fluorescence components derived from the SPCI of
E. coli in the absence/presence of NOM compounds. Four fluorescent components were successfully decomposed by PARAFAC modeling in the EEM data set of 70 samples, including the SPCI of
E. coli in the absence/presence of NOM using LF. To obtain further insight into the effect of NOM analogues, PARAFAC modeling was performed for three conditions: (i) samples in the absence of NOM, (ii) samples in the presence of NOM, and (iii) samples including conditions i and ii. The samples in the absence of NOM analogue compounds were compiled from a previous study reported by Birben et al. [
6]. PARAFAC modeling may give different outcomes with respect to the samples defined in the beginning of the model, and to represent this situation, the authors ran the PARAFAC model three times with different sample inputs: (i) comprises EEMs of
E. coli inactivation in the absence of NOM (SS, DW, MQ, WM), (ii) comprises EEMs of
E. coli inactivation in the presence of NOM representatives (SRNOM, SRHA, and SRFA), and (iii) comprises both samples from i and ii. Modeling i. and ii together (which is basically iii) aimed to show the shielding effect of humic-like fluorophores for the visualization of protein-like fluorophores.
In the absence of NOM compounds, component 1 (C1) displayed two peaks at Ex/Em = 210/300 nm and 210/460 nm, which are related to protein/polyphenol-like components; more specifically, C1 could be regarded as a tryptophan-like fluorescent component [
32,
33,
34,
35]. In the presence of NOM compounds, C1 displayed two peaks at Ex/Em = 210/350 nm and 210/380 nm, which also corresponds to protein/polyphenol-like components. When PARAFAC modeling was run by using all data for conditions i and ii, C1 expressed two maxima at Ex/Em = 210/350 nm, and this component was also classified as a protein/polyphenol-like component. Although the absence and/or presence of NOM seems to cause an insignificant difference in the classification of C1 by PARAFAC modeling, peak positions for the emission wavelength displayed differences in the absence/presence of NOM, which could be attributed to the higher degree of aromaticity related to NOM.
Component 2 (C2) exhibited one primary maxima at Ex/Em = 250/450 nm, referring to a microbially derived fulvic-like or humic-like component of NOM released from degradation of microorganisms [
36,
37,
38]. The presence of C1 and C2 strongly indicated that solar photocatalytic decay of
E. coli or release of their cell organic matter is likely the source of fluorophoric components resembling natural waters. Component 3 (C3) revealed one maxima at Ex/Em = 245/475 nm for conditions ii and iii, whereas this component almost displayed no maxima for condition i. The reason could be attributed to the relevance of C3 to NOM-related reaction matrices. Component 4 (C4) showed one maxima at Ex/Em = 250/500 nm for condition i, whereas the Ex/Em maxima shifted to 260/525 nm for conditions ii and iii. In a similar manner achieved for C1, a shift of the Ex/Em maxima of C3 in the presence of NOM could be attributed to its higher aromaticity as well as molecular weight, causing a masking effect on the fluorescence features of bacteria-derived organics. Both C3 and C4 were identified as humic-like components [
39,
40,
41].
Expressing fluorescence maxima at longer emission wavelengths, i.e., Em > 450 nm, C3 and C4 revealed humic-like component characteristics with a higher degree of aromaticity and a high molecular weight [
33,
35,
37]. Depending on their fluorescence maxima values, the components presented molecular weights in the order of C3 > C4 > C2 > C1.
Although half of the experimental studies were performed in the absence of NOM, the PARAFAC model identified two different humic-like components with a highly aromatic structure and a higher molecular weight. The reason of the occurrence of this humic-like fluorescence could be attributed to a hypothetic abiotic condensation process by which carbohydrates and amino acids can produce compounds with a melanin structure [
42]. It was previously reported that this type of reaction may occur between carbohydrates and proteins released by bacteria [
43]. With respect to the experimental data of this study, it has been reported that the SPCI of
E. coli ends up with the release of carbohydrates and proteins via cell lysis; therefore, the condensation reaction between these compounds could be the source of humic-like components identified by the PARAFAC model. In addition, another plausible explanation of humic-like fluorescent components could be auto-oxidative crosslinking of unsaturated lipids released by organisms [
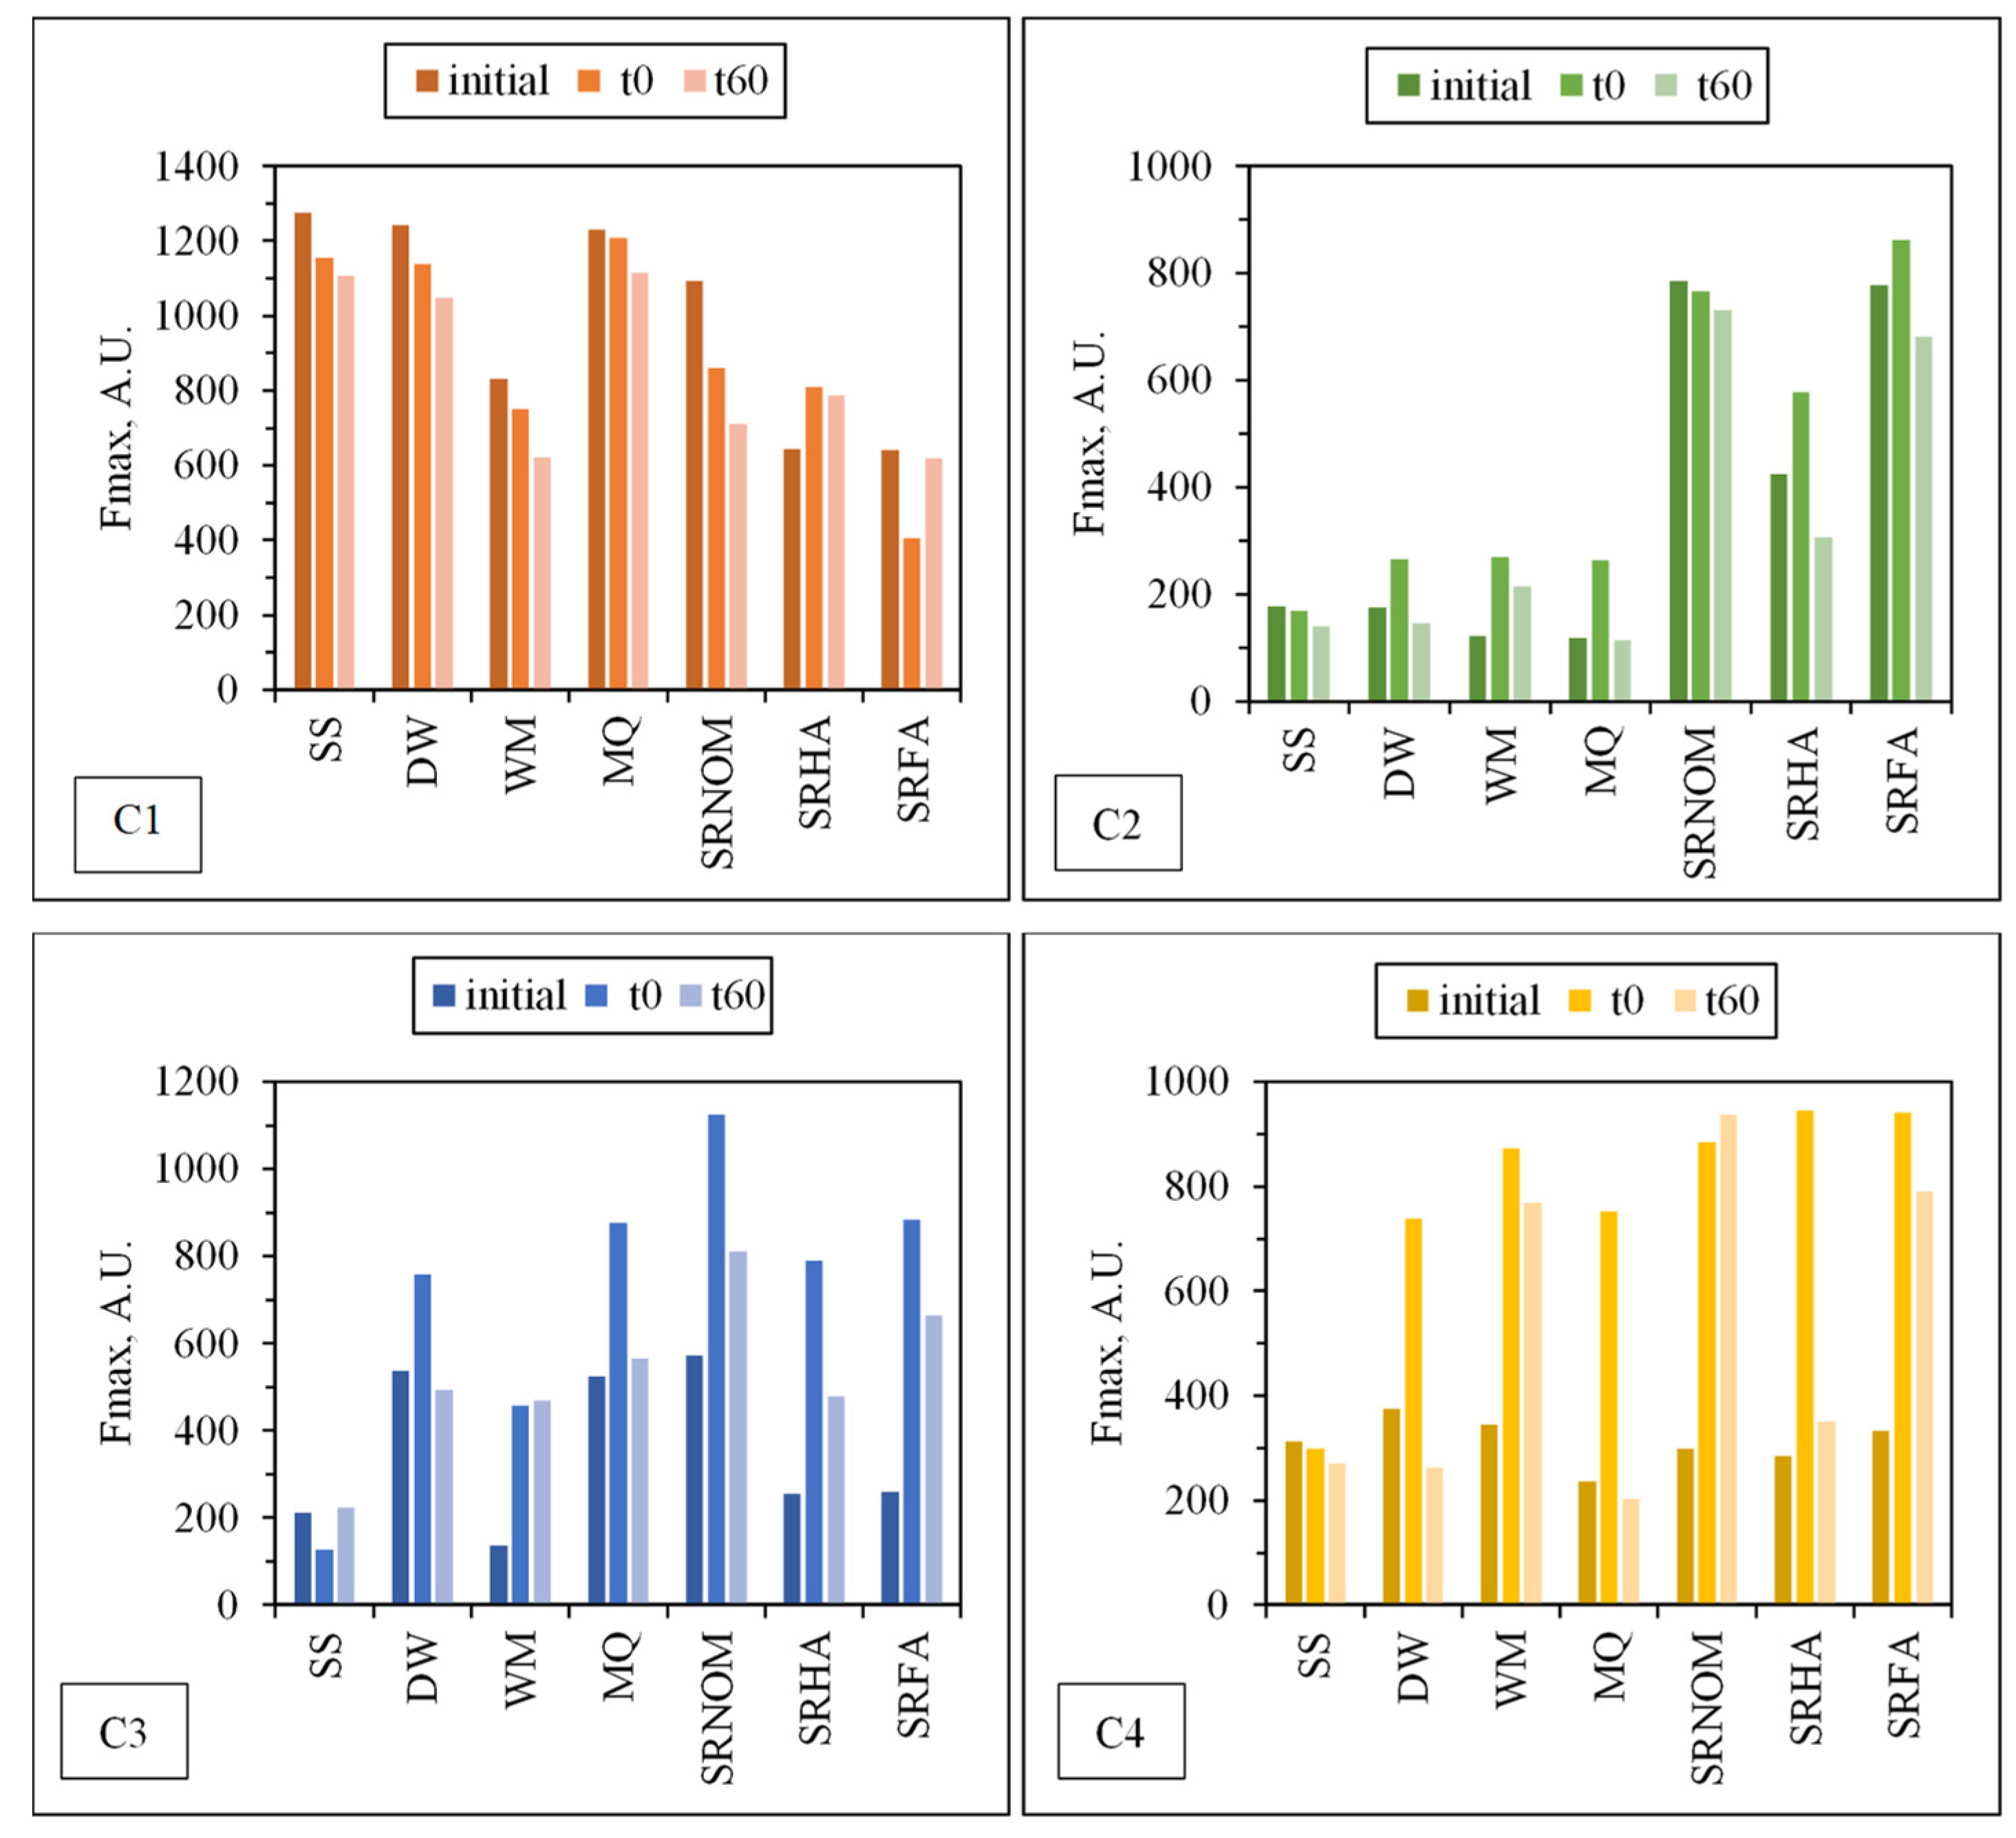
44,
45]. To perform a further assessment of the fate of individual PARAFAC components following solar photocatalysis, changes in the Fmax values of each component under all experimental conditions are presented in
Figure 9. Fluorescent components identified by EEM/PARAFAC have distinct excitation and emission spectra. However, identified components may represent a single fluorophore or a group of similar fluorophores. Once identification of the components explaining the greatest variation proceeded, calculation of the distribution of components could be performed for each sample. PARAFAC modeling could make quantitative determination of an analyte possible by adding a known amount of this analyte for the determination of its concentration in each sample. Otherwise for an unknown PARAFAC component, it is impossible to convert fluorescence intensities to concentration values. Therefore, the maximum fluorescence intensities (Fmax) of the identified DOM components were used as the representative of the relative proportions of the components. Fmax is derived by multiplying the maximum excitation and maximum emission loading for each component by its score, which produces intensities in the same measurement scale as the original EEMs.
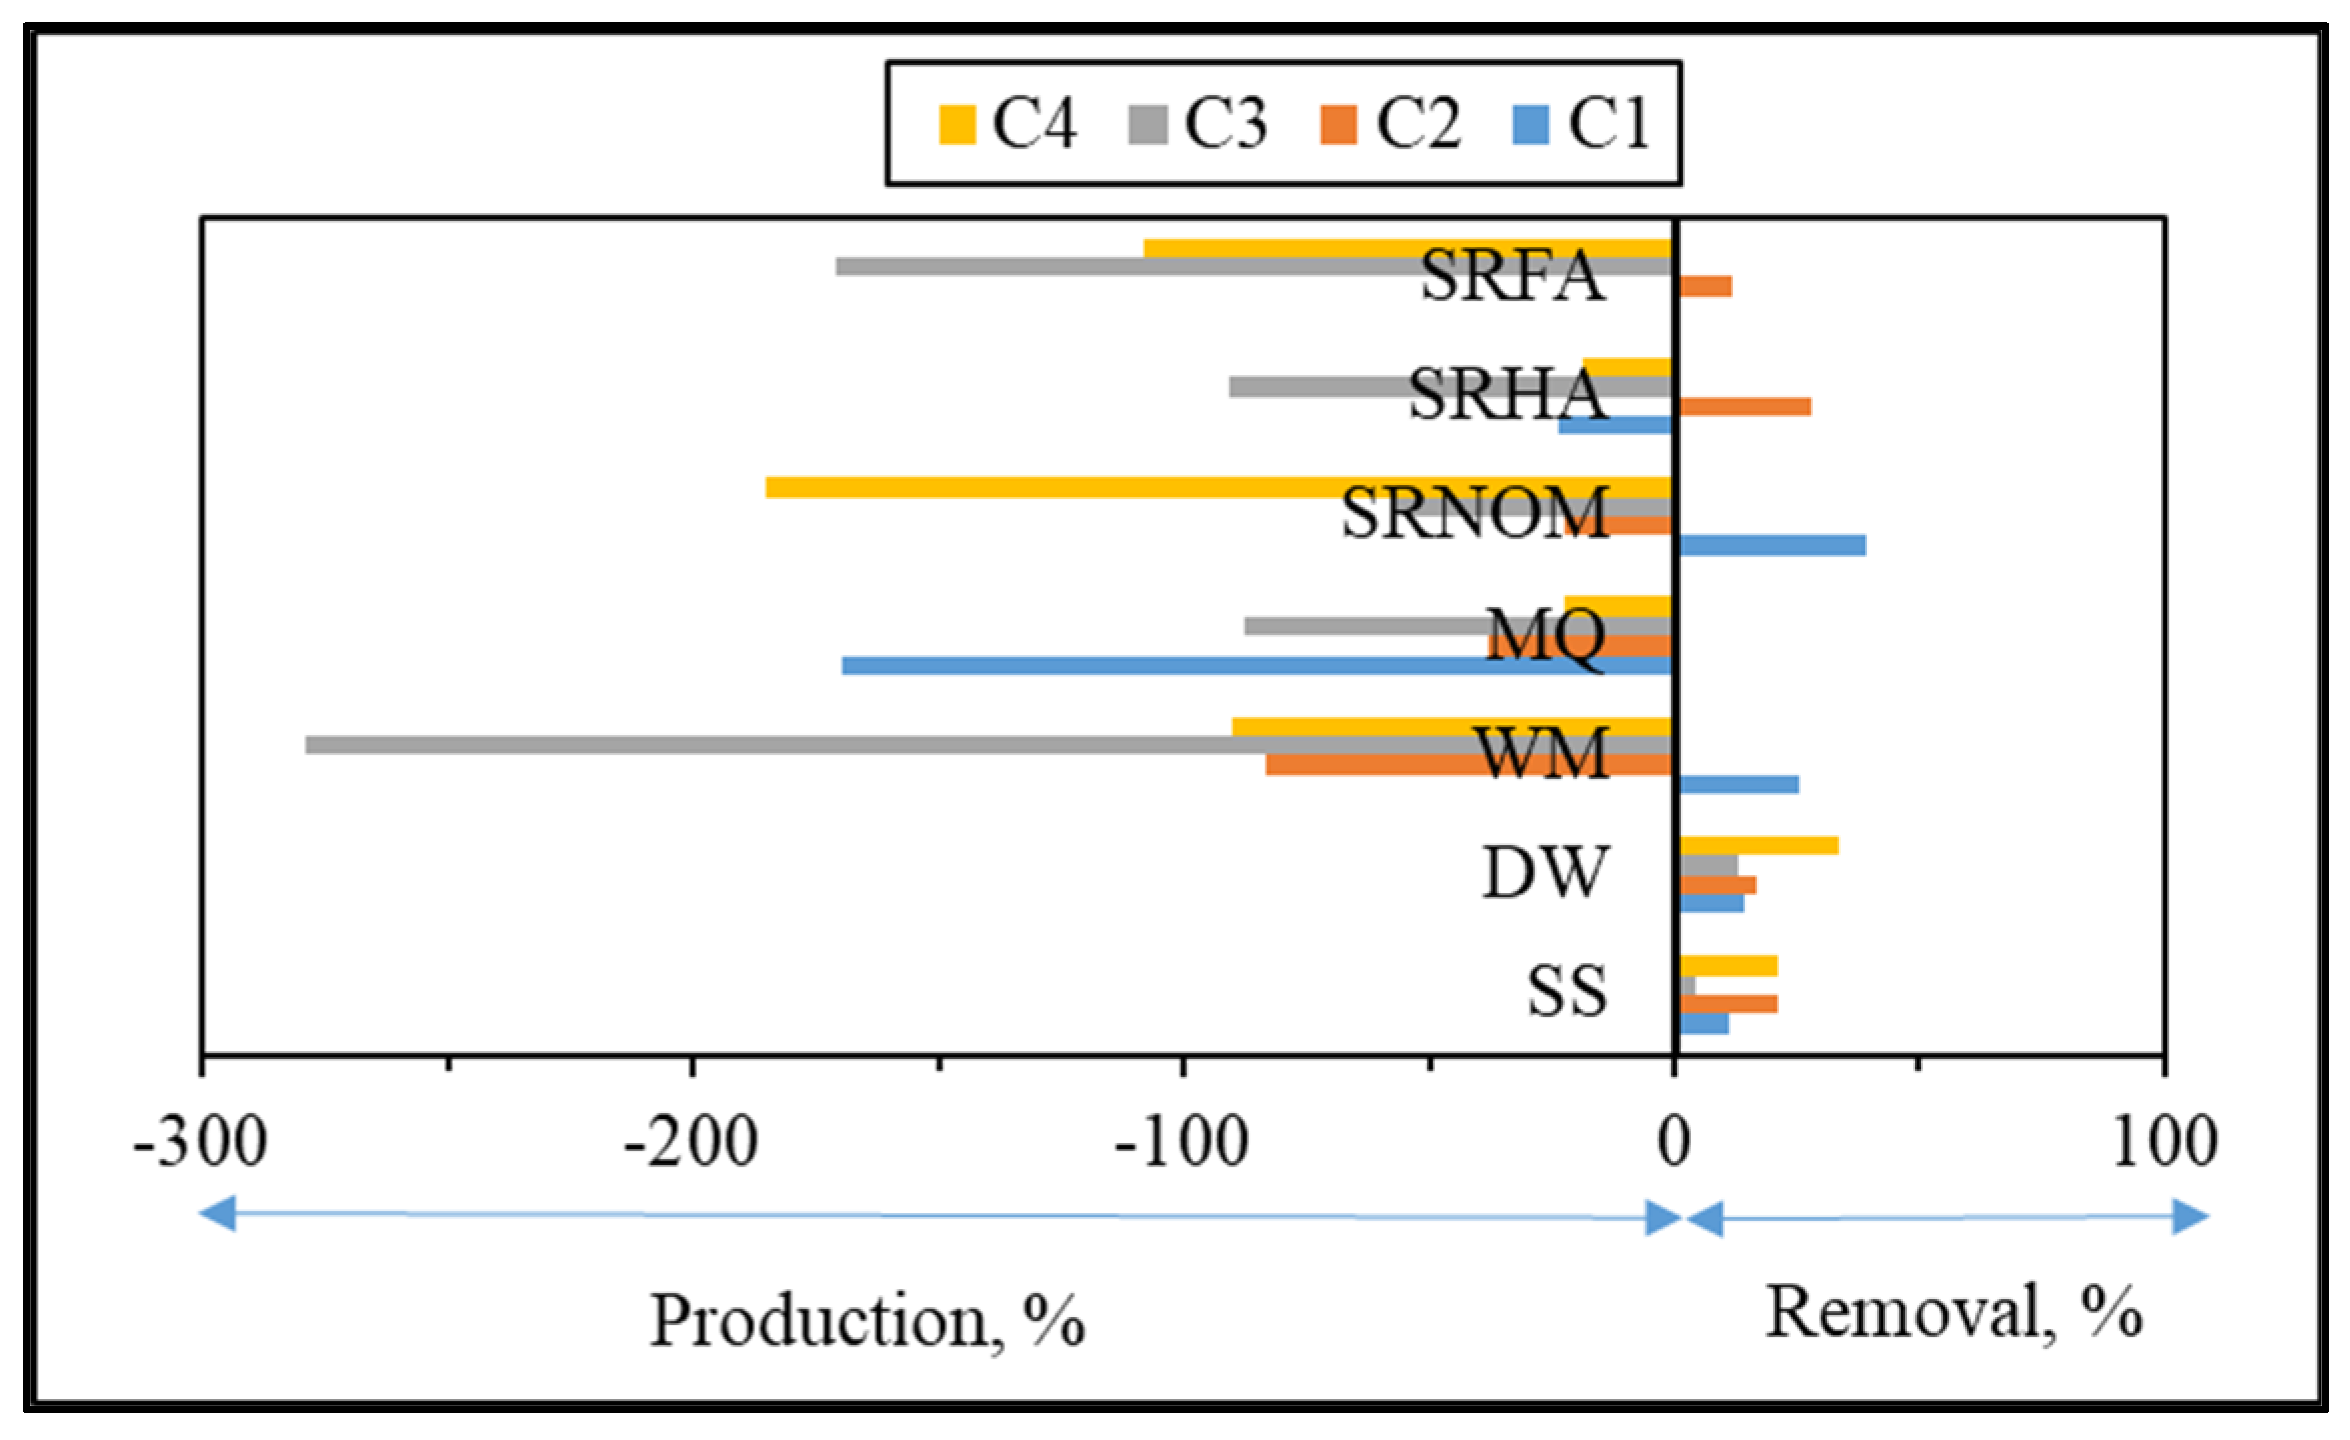
For comparison, changes in the normalized Fmax (Fmax
t/Fmax
i) intensities of each component were presented for an irradiation period of 60 min in the absence/presence of NOM (
Figure 10).
Upon exposure to SPCI for t
irr = 60 min, C1 removal efficiencies were found to be 11% for SS, 14% for DW, 26% for WM, and 39% for SRNOM, whereas a 170% increase was attained in the presence of MQ, and 24% and 1% increases were achieved for SRHA and SRFA, respectively. It has been previously reported that solar photocatalytic degradation of proteins could be expected as a result of ROS attack on the aromatic ring of tryptophan-like proteins [
46,
47]. Removal of the protein-like component (C1) was observed in the presence of SS, DW, WM, and MQ; however, an increase in C1 (18%) and irrelevant removal (< 5%) of C1 were attained in the presence of SRHA and SRFA, which could be attributed to the competitive reactions between humic matter and protein-like components for ROS. Moreover, since SPCI is also continuing, bacteria-derived organics are also released concomitantly via cell lysis. Consequently, competitors for ROS are bacteria, bacteria-derived organics, and NOM in the presence of SRNOM, SRHA, and SRFA.
The most noticeable increase was observed for C3 and C4 in the presence of WM, SRNOM, SRHA, and SRFA, whereas under the same experimental conditions, removal of these fluorophores could be observed in the presence of SS and DW. The reason could be the emergence of these fluorophores only after the SPCI of E. coli, followed by solar photocatalytic degradation of these in situ generated fluorophores. However, in the presence of NOM, various reactions could occur, such as (i) the SPCI of E. coli; (ii) solar photocatalytic degradation of NOM; (iii) solar photocatalytic degradation of E. coli-derived organics, i.e., proteins and carbohydrates; and (iv) reactions between degraded and/or non-degraded fractions of NOM and bacteria-derived organics. Although C3 and C4 were regarded as fluorescent components with a higher molecular weight and aromaticity, their normalized Fmax values indicated the formation of these fluorophores under the specified conditions. As a result of SPCI, bacteria-derived organics would be released into the reaction medium due to cell lysis, while degradation of humic matter could also proceed concomitantly. Consequently, condensation reactions between bacteria-derived organics as well as humic fractions could be expected, which then generates high-molecular-weight fluorescence components, such as C3 and C4.
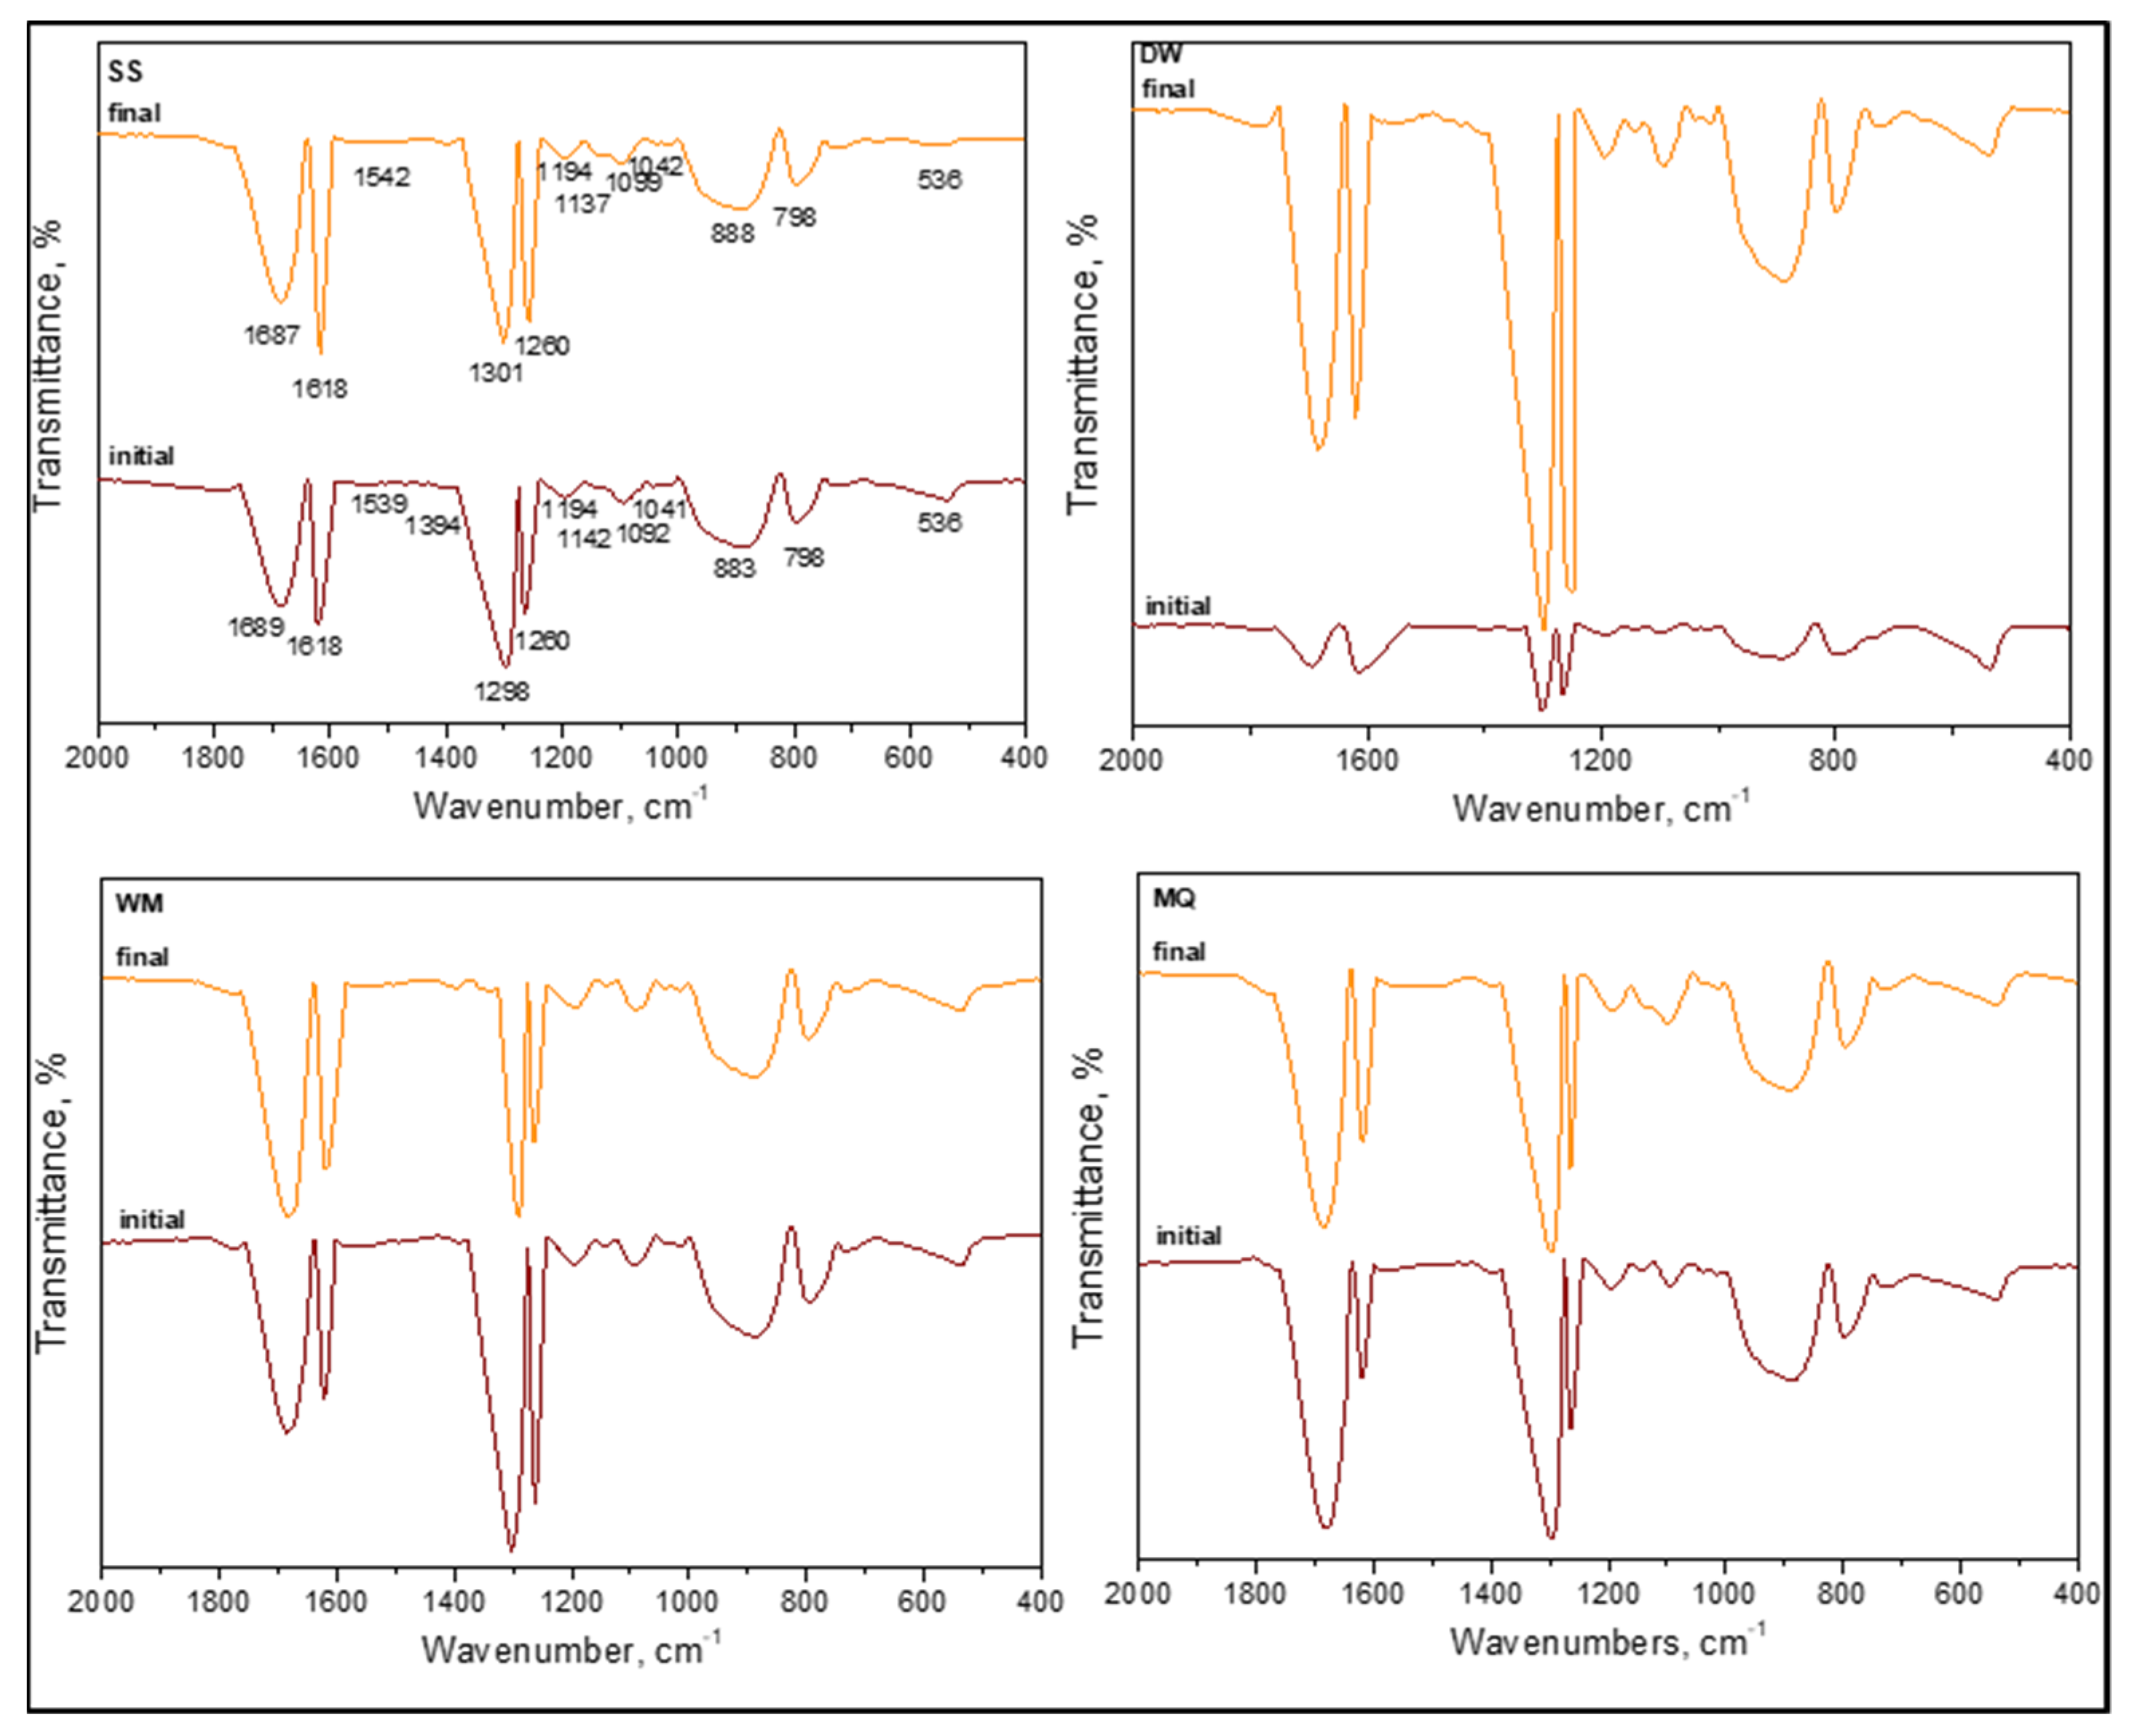
3.1.2.3. FTIR Spectroscopy
Since the main purpose was to elucidate FTIR spectral features of the complex reaction medium prior to and following the SCPI of E. coli in the absence/presence of organic matter, emphasis was given primarily to the band positions rather than band intensities.
In general, an IR absorption spectrum of bacteria is divided into five major areas:
Area 1 (~3000–2800 cm−1): commonly dominated by C‒H stretching of fatty acid compounds related to lipid content
Area 2 (~1700–1500 cm−1): dominated by proteins
Area 3 (~1450–1200 cm−1): a mixed region dominated by the carboxylic groups of proteins, free amino acids, and polysaccharides (1450–1400 cm−1), and RNA/DNA and phospholipids (1250–1200 cm−1)
Area 4 (~1200–900 cm−1): dominated by polysaccharides
Area 5 (<900 cm−1): the fingerprint region containing bands that cannot be assigned to specific functional groups
FTIR spectral bands attributed to the main organic components of
E. coli both as solely and following irradiation upon the use of TiO
2 have been assessed in detail by Kiwi et al. [
48,
49,
50]. With respect to the above-given major windows and the data reported by Kiwi et al., the peaks related to the main components of the cell wall of
E. coli as the LPS content, phospholipid bilayer, and peptidoglycan layer were compiled and presented in
Table S3 in the SI section. In accordance with these bands, the following descriptive variations were observed under the specified experimental conditions. For comparison purposes, the samples originating from the experimental study performed in the absence of organic matter were also subjected to FTIR analyses. All FTIR data were evaluated with respect to spectral properties observed in both transmission mode (
Figure 11 and
Figure 12) as well as second-derivative mode (
Figures S3 and S4). Designated wavenumbers were mostly derived from both spectral features, and fingerprint regions were presented.
3.1.2.4. FTIR Spectral Features of E. coli in the Absence of Organic Matter
In the absence of organic matter, the SPCI of
E. coli was followed under various aqueous medium conditions, i.e., SS, DW, WM, and MQ [
6]. The samples were designated as (i) initial (t = 0 condition) and (ii) final following SPCI for an irradiation period of 60 min. From a general perspective, all samples displayed the existence of organics upon introduction of LF and were produced in situ during 0.45 μm membrane filtration (
Figure 11). Slight shifts were recorded in all specific regions most probably due to the masking effect of the solution matrix on the possible interactions between the species.
Contrary to the absence of amide A (ν3300 cm−1) and amide B (ν3100 cm−1) bands of NH stretching, the presence of amide I (ν1700–1600 cm−1), amide II (ν1600–1500 cm−1), and amide III (around ν1290–1280 cm−1) bands were evident under all conditions irrespective of the solution matrix composition. These peaks were related to peptide bonds, and as the major protein band, the amide I band was mainly associated with the C=O and C–N stretching vibrations, whereas amide II represented mainly in-plane N–H bending and C‒N and C‒C stretching vibrations. Furthermore, amide IV–VII bands in region ν750–200 cm−1 were not considered due to the complexity of identification. Excluding the slight shifts in peak positions, their presence under both initial and final conditions expressed the resistance of these organic fractions to SPCI using LF.
The presence of lipids designating the cell wall destruction were expected in the ν2950–2840 cm−1 region mainly described as asymmetric and symmetric aliphatic C‒H stretching vibrations of CH3 and CH2 groups and around the ν1740 cm−1 region related to C=O stretching of carbonyl vibrations present in triglycerides. All samples displayed the aforementioned peaks with slight shifts under both initial and final conditions, being not affected by the solution properties.
Referring to the peaks of carbohydrates that were expected in the region of ν1200–950 cm
−1, designating the sugar rings of LPS as v1170 cm
−1 related to the C‒O stretching, ν1120–1140 cm
−1 as the asymmetric C–O–C stretching vibration band of glycosidic linkages, and ν1060–1040 cm
−1 as symmetric δ(COH) stretching vibration of carbohydrates, all samples exhibited slight shifts with respect to the components present in the solution matrix. Since no difference was observed between the FTIR spectral features of initial and final samples, the continuous removal and emergence of the specified groups could be visualized. Asymmetric and symmetric phosphate (PO
2−) stretching vibrations of the nucleic acid detected at ν1280–1200 cm
−1 and the symmetric PO
2− band of DNA at ν1085 cm
−1 were present with slight shifts in all samples referred to as initial and final under all conditions. Contrary to the findings of Kiwi et al., it should also be mentioned that neither the δ(CH
2) scissor (ν1470 cm
−1) nor –COO (~ν1400 cm
−1) stretching bands were detected. In a similar manner, the ν1575 cm
−1 band related to aspartate or glutamate carboxylate stretching was not observed. Under all conditions and irrespective of the reaction medium properties, ν1620 cm
−1 represented H–O stretching vibration related to water absorption. The band at around ν1390 cm
−1 could be attributed to the presence of NO
3− in WM medium that was detected following solar photocatalysis contrary to the insignificant contribution under the initial condition most probably due to the attractive electrostatic interactions toward the positively charged LF surface. Considering out-of-plane bending of aromatic C–H in the ν975–775 cm
−1 region and asymmetric C–N stretching at ν966 cm
−1, specific interest should be directed to LF. In all samples, the presence of LF could be detected by the peaks of Fe–O and O–Fe–O stretching bonds at around ν850 cm
−1 and Fe–O stretching of FeO
6 octahedron groups at ν560 cm
−1 [
51]. Contrary to XPS verification, the absence of the ν1490–1382 cm
−1 band related to the splitting of the asymmetric stretching of metal carbonates and the ν425 cm
−1 band due to Fe‒O‒Fe bending or deformation modes should also be mentioned [
7].
Bearing in mind the variations in selected aqueous medium compositions, MQ expressed the immediate burst out due to osmotic pressure followed by DW that could also be related to limited survival conditions. However, the presence of WM components expressed a decreasing intensity profile upon irradiation in comparison to the initial condition, most probably due to competing inorganic–organic reactions resulting in both band positions and relative intensities.
Interestingly, no significant correlation could be visualized with reaction kinetics [
6] and FTIR spectral features emphasizing the non-selective oxidation mechanism of solar photocatalysis. However, with respect to UV–VIS and fluorescence spectral properties, the resistance of DNA groups to ROS-mediated solar photocatalysis was evidenced by FTIR spectra [
52].
It should also be mentioned that FTIR data were limited to a selected irradiation period, and therefore, possible detection of the remaining E. coli cells as well as organics could be achieved. Therefore, elucidation of FTIR peaks upon the SPCI of E. coli using LF should only be considered under a qualitative basis rather than related to kinetics of simultaneously operating inactivation and degradation. More significantly, the effect of the aqueous solution composition was found to be weak on the band positions exhibiting slight shifts, although relatively minor variations were detected in intensities.
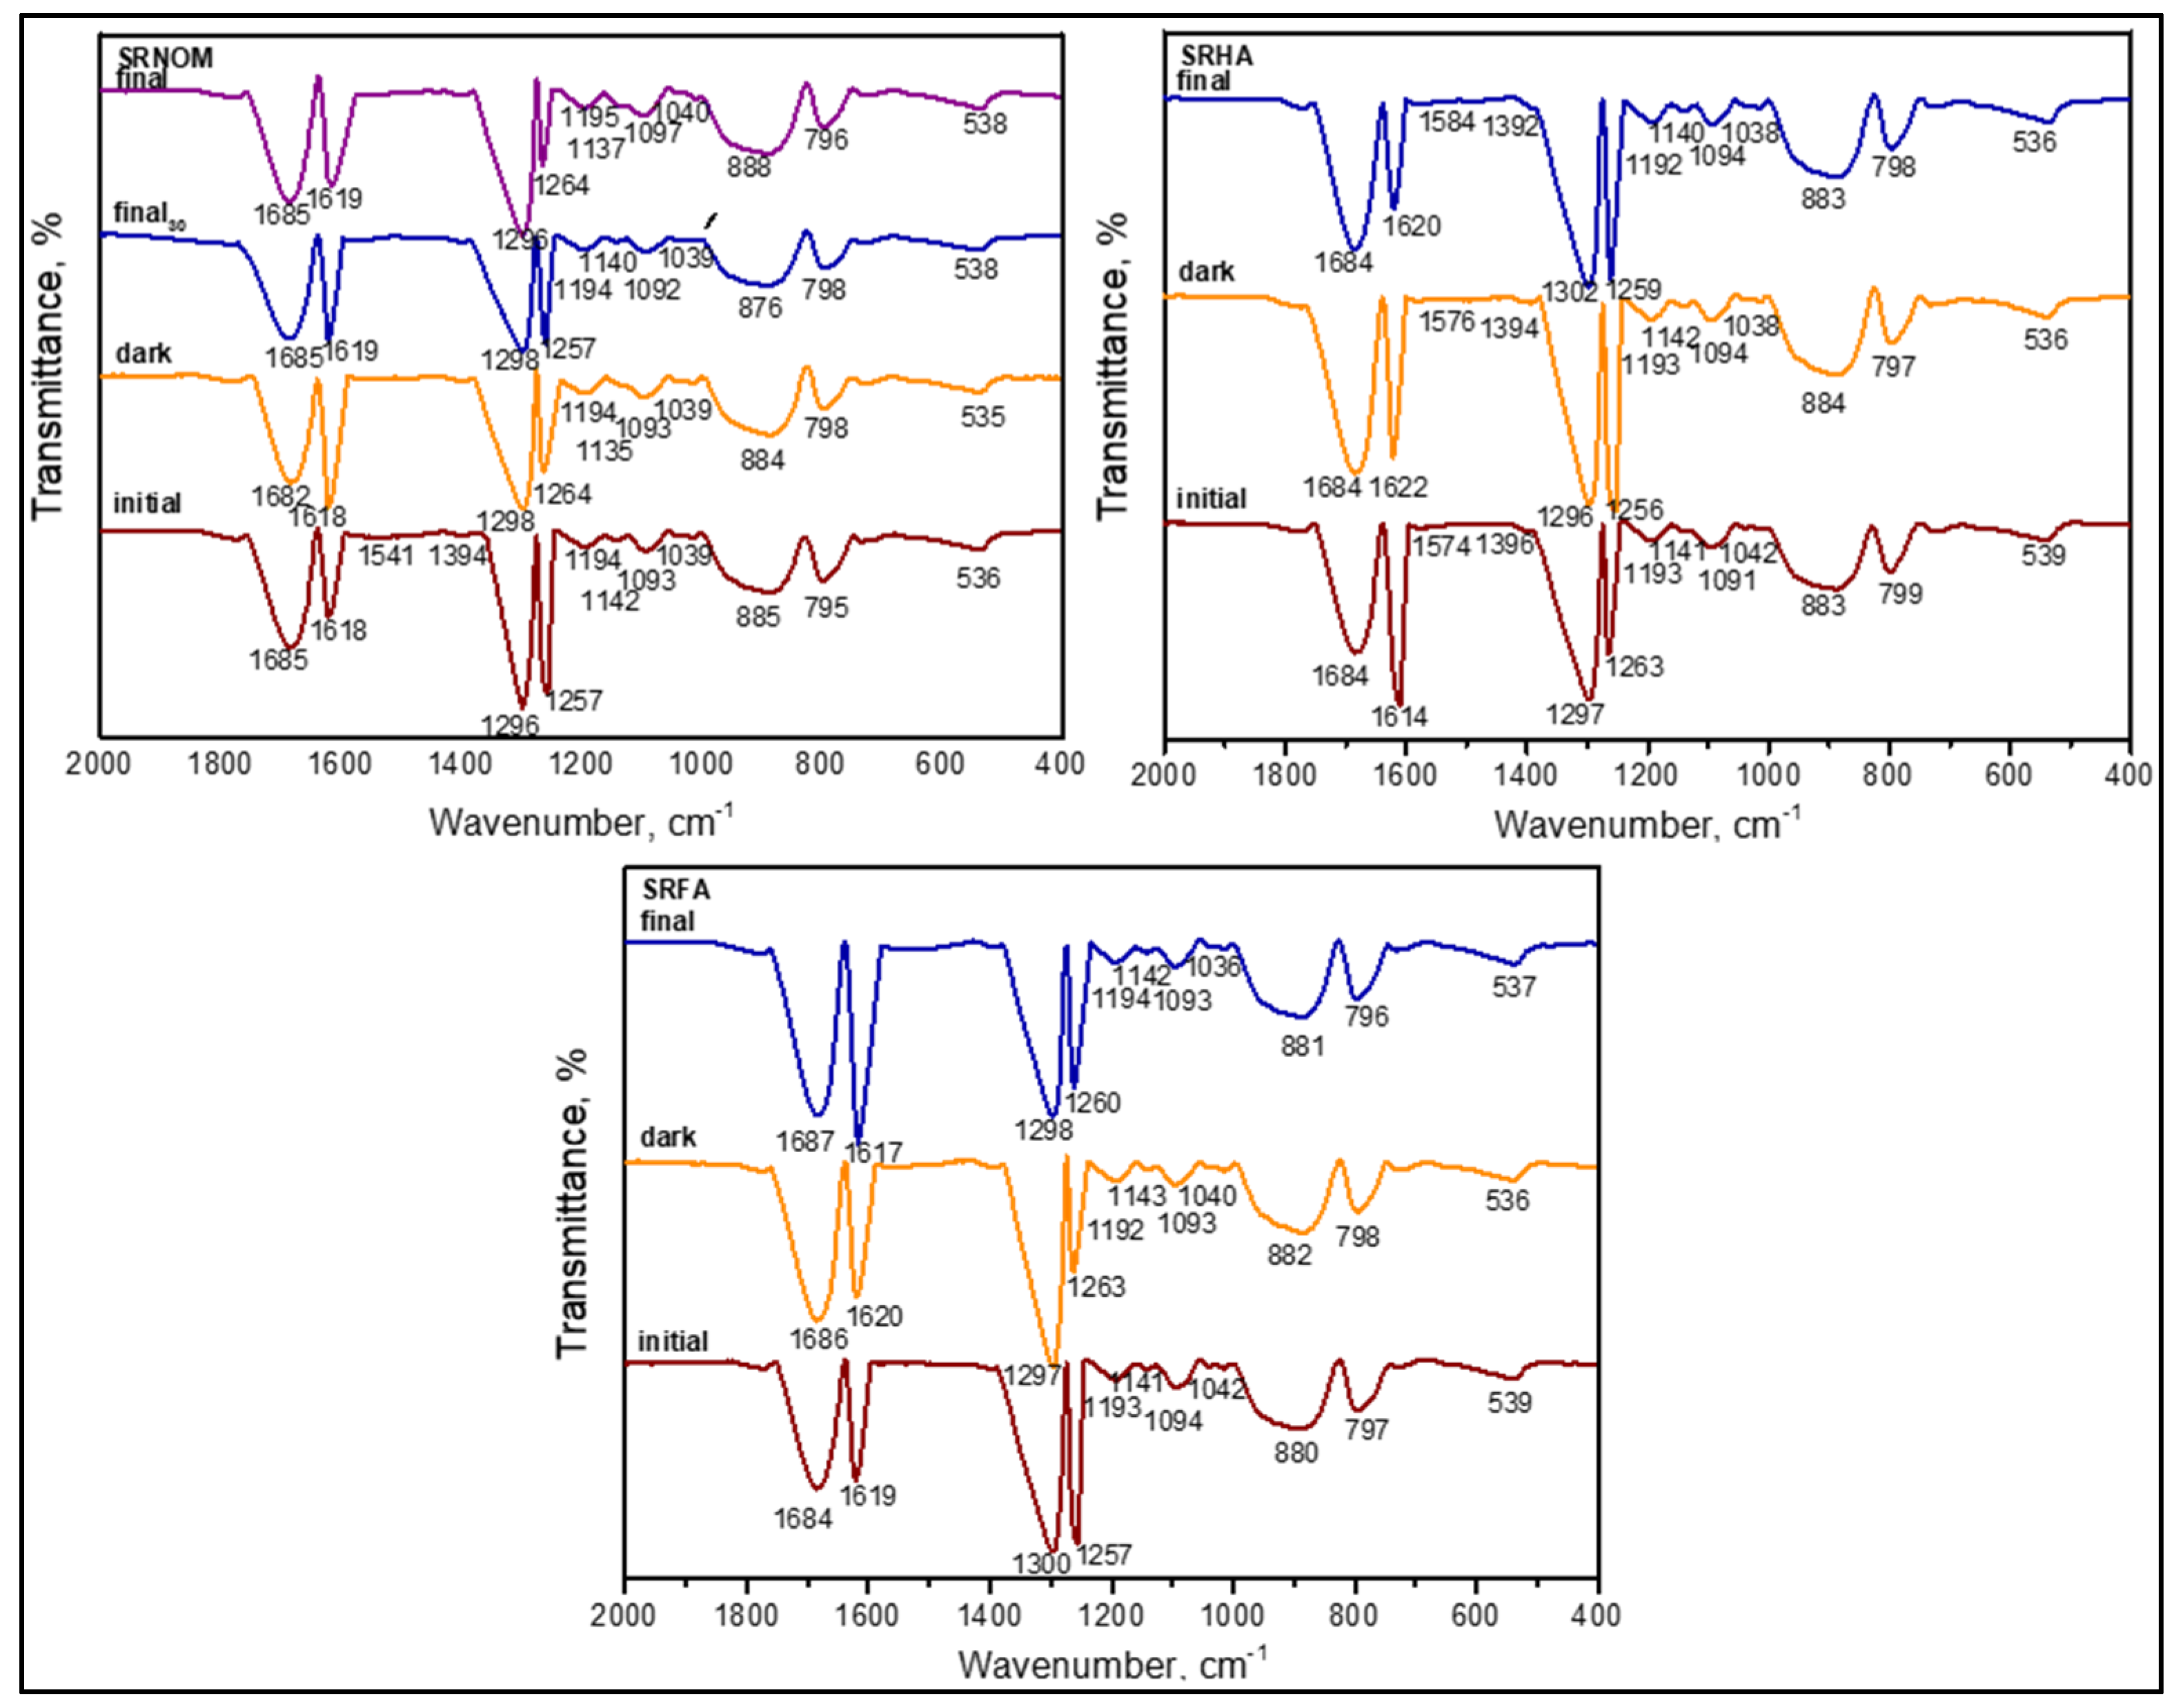
3.1.2.5. FTIR Spectral Features of E. coli in the Presence of Organic Matter
The SPCI of
E. coli was followed under various aqueous medium conditions consisting of organic matter such as SRNOM, SRHA, and SRFA. All samples were considered in the presence of LF. As indicated above, the expected vibrational bands (cm
−1) of the functional groups are presented in
Table S3 in SI. In a similar manner, the samples were designated as (i) initial and (ii) final, following SPCI. From a general perspective, all samples displayed the existence of functional groups ascribed to both humic substances as well as
E. coli both prior to and following SCPI (
Figure 12).
SRNOM as a heterogeneous polydisperse organic matrix mainly composed of both humic and fulvic acids displayed the absence of bands in the region of ν3400–3600 cm−1 that were associated with O‒H stretching (alcohols, phenols, and carboxylic groups), N–H stretching (trace/minor), and hydrogen-bonded OH groups. However, upon enlargement of the spectra, a weak broad band at ~ν3100 cm−1 related to amide B bands of N‒H stretching-vibration-related amide II groups could be visualized. In contrast, amide I groups in the ν1760–1600 cm−1 region related to C=O and C‒N stretching vibrations could also be noticed under all conditions, even upon prolonged dark interactions (tirr = 30 min) and during SPCI for irradiation periods of 30 min and 60 min. Apart from the slight shifts in peak positions, their presence under both initial and final conditions showed the resistance of these organic fractions to SPCI using LF. It should be indicated that these carbonyl vibrations could be concurrently related to both the presence of triglycerides originating from E. coli and/or the humic organic core.
The absence of a vibrational band at ν1660–1630 cm
−1 of C=O of quinone and/or H-bonded conjugated ketones and ν1620–1600 cm
−1 referring to aromatic C=C skeletal vibrations and COO¯ symmetric stretching could be correlated to the organic matrix filtered. as evidenced by UV–VIS and synchronous scan fluorescence spectroscopic features (
Figure 3 and
Figure 7).
As denoted by the presence of lipids indicating cell wall destruction, vibrations in the ν2950–2840 cm−1 region of asymmetric and symmetric aliphatic C–H stretching vibrations of CH3 and CH2 groups were evidently noticed expressing resistance to degradation via solar photocatalytic oxidation. In contrast, carbohydrate peaks expected in the region of ν1200–950 cm−1 designating the sugar rings of LPS as ν1170 cm−1 related to the C‒O stretching, ν1120–1140 cm−1 as the asymmetric C–O–C stretching vibration band of glycosidic linkages, and ν1060–1040 cm−1 as symmetric δ(COH) stretching vibration of carbohydrates, all samples exhibited slight shifts with respect to the components present in the solution matrix. However, no difference was observed between initial and final samples, indicating that during SPCI, the disappearance and emergence of these groups were expected, as verified by both DOC contents and specified spectral properties.
Asymmetric and symmetric PO2− stretching vibrations of the nucleic acid at ν1280–1200 cm−1 and the symmetric PO2−band of DNA at ν1085 cm−1 were present with slight shifts as ν1257–1262 cm−1, as evidenced by both transmission and second-derivative spectral features. It should be indicated that the amide III band at ν1290–1280 cm−1 expressing C‒N stretching and N–H stretching could also be demonstrated. Moreover, bands at ν1260–1200 cm−1 of C‒O stretching and OH deformation of COOH and C–O stretching of aryl ethers and phenols were detected. However, the absence of bands at ν1385–1380 cm−1 of the symmetrical stretching of carboxylic groups could also be related to the organic matter composition of the solution passing through 0.45 μm membrane filters. Concurrently, these groups could also be used in surface interactions along with the bands in the region of ν3400–3600 cm−1 that were associated with the O‒H stretching of alcohols and carboxylic groups.
The aspartate or glutamate carboxylate stretching band at ν1575 cm
−1 was not observed, as evidenced by both protein contents and UV–VIS and synchronous scan fluorescence spectral features of the filtered samples (
Figure 3 and
Figure 7).
In accordance with the SPCI of sole E. coli performed under various aqueous medium conditions, neither δ(CH2) scissor (ν1470 cm−1) stretching nor –COO (~ν1400 cm−1) asymmetric stretching bands were detected. The vibrational band at ν1620 cm−1 of H–O stretching related to water absorption was clearly apparent under all experimental conditions. More specifically, out-of-plane bending of aromatic C‒H groups at the vibrational band at ν975–775 cm−1 was detected at around ν795–800 cm−1 by transmission as well as via second-derivative spectra. Although expected in this band region as ν996 cm−1, an asymmetric C‒N stretching band was not observed.
The possible effects of SRHA and SRFA were directly compared to the FTIR spectral bands detected in the presence of SRNOM (
Figure 12). Since SRHA was composed of a denser aromatic core and functional groups mainly composed of carboxylic and phenolic groups, similarities to SRNOM were expected. Although the major bands were almost similar, upon the SPCI of
E. coli, slight variations in ν
a(CH
3), ν
a(CH
2), ν
s(CH
3), and ν
s(CH
2) band positions as well as shapes were visualized. The presence of SRFA exerted a similar effect with variations quite different in comparison to the FTIR spectral features attained in the presence of SRHA and SRNOM. Slight shifts were recorded in all specific regions most probably due to the masking effect of the organic solution matrix on the possible interactions between the species.
Excluding minor dissimilarities, the observed close proximities expressed the significant behavior of the specific organic matrix and E. coli system during solar photocatalysis. Due to the surface-oriented nature of the non-selective oxidation mechanism, continuously operating the removal and formation of organic fractions originating from either humic matter or E. coli destruction could result in an almost consistent presence of all vibrational bands.
It should also be mentioned that the FTIR data were limited to a selected irradiation period, enabling the possible detection of the remaining E. coli cells as well as determination of characteristic properties of the organics. Therefore, elucidation of FTIR peaks upon the SPCI of E. coli using LF should only be considered under a qualitative basis rather than related to kinetics of simultaneously operating inactivation and degradation.
It should be indicated that no complete mineralization was targeted. Direct discrimination was not focused on the FTIR spectra of sole E. coli and/or organic matter due to the expected complex reaction mechanism operating under irradiation in the presence of LF. Moreover, pH-dependent surface interactions prevailing both prior to and under irradiation during SPCI and varying size effects would strongly alter FTIR spectral features.
It should also be mentioned that organic matter should pass through 0.45 μm membrane filters due to the operational definition of DOC; therefore, FTIR spectra expected for solid samples would be erroneously interpreted [
53].


 ,
, 


