Article

OpenHi.net: A Synergistically Built, National-Scale Infrastructure for Monitoring the Surface Waters of Greece

by
Nikos Mamassis
1,*,
Katerina Mazi
2,
Elias Dimitriou
3,
Demetris Kalogeras
4,
Nikolaos Malamos
5,
Spyridon Lykoudis
2,
Antonis Koukouvinos
1,
Ioannis Tsirogiannis
6,
Ino Papageorgaki
1,
Anastasios Papadopoulos
3,
Yiannis Panagopoulos
3,
Demetris Koutsoyiannis
1,
Antonis Christofides
1,
Andreas Efstratiadis
1,
Georgios Vitantzakis
2,
Nikos Kappos
2,
Dimitrios Katsanos
2,
Basil Psiloglou
2,
Evangelos Rozos
2,
Theodora Kopania
2,
Ioannis Koletsis
2 and
Antonis D. Koussis
2
add Show full author list remove Hide full author list
1
Department of Water Resources & Environmental Engineering, National Technical University of Athens, 15780 Athens, Greece
2
Institute for Environmental Research & Sustainable Development, National Observatory of Athens, 15236 Athens, Greece
3
Institute of Marine Biological Resources & Inland Waters, Hellenic Centre for Marine Research, 19013 Anavyssos, Greece
4
Institute of Communication and Computer Systems, National Technical University of Athens, 15780 Athens, Greece
5
Department of Agriculture, University of Patras, 26504 Rio, Greece
6
Department of Agriculture, University of Ioannina, 45110 Ioannina, Greece
*
Author to whom correspondence should be addressed.
Water 2021, 13(19), 2779; https://doi.org/10.3390/w13192779
Submission received: 27 July 2021 / Revised: 28 September 2021 / Accepted: 30 September 2021 / Published: 7 October 2021
(This article belongs to the Special Issue Application of Smart Technologies in Water Resources Management)

Abstract

:
The large-scale surface-water monitoring infrastructure for Greece Open Hydrosystem Information Network (Openhi.net) is presented in this paper. Openhi.net provides free access to water data, incorporating existing networks that manage their own databases. In its pilot phase, Openhi.net operates three telemetric networks for monitoring the quantity and the quality of surface waters, as well as meteorological and soil variables. Aspiring members must also offer their data for public access. A web-platform was developed for on-line visualization, processing and managing telemetric data. A notification system was also designed and implemented for inspecting the current values of variables. The platform is built upon the web 2.0 technology that exploits the ever-increasing capabilities of browsers to handle dynamic data as a time series. A GIS component offers web-services relevant to geo-information for water bodies. Accessing, querying and downloading geographical data for watercourses (segment length, slope, name, stream order) and for water basins (area, mean elevation, mean slope, basin order, slope, mean CN-curve number) are provided by Web Map Services and Web Feature Services. A new method for estimating the streamflow from measurements of the surface velocity has been advanced as well to reduce hardware expenditures, a low-cost ‘prototype’ hydro-telemetry system (at about half the cost of a comparable commercial system) was designed, constructed and installed at six monitoring stations of Openhi.net.

1. Introduction

“Good-quality” hydro-data (precipitation, stream- and groundwater flow, and quality) are essential for water resources planning, management and decision-making, for hydrological and hydraulic applications and services, as well as in hydrological research. These purposes are served to society’s maximum benefit when the water data are managed properly and are freely available (cf. Resolution 25, WMO Cg-XIII, 1999). Advances in data science (databases-DB, geographical information systems-GIS, web services) and in observational technologies (e-monitoring) allow data systems to be more agile and responsive to the needs for efficient and effective data sharing and service delivery [1].
A recent survey on hydrologic measurements and observations, conducted by the International Association of Hydrological Sciences [2] showed that the hydrological community considers maintaining the monitoring networks as the main challenge and that using advanced technology entails high maintenance costs and access to trained staff and resources. Such difficulties have caused observations to decrease consistently since the 1980s, while most research groups cannot afford costly monitoring equipment. Hydrologists have confronted the above challenges by designing, developing and deploying their own sensors, taking advantage of open source controllers such as Arduino (https://www.arduino.cc, accessed on 28 September 2021) [3]. These experiences motivated us to explore building certain of our equipment, also including off-the shelf components, in order to develop low-cost, easily accessible, and tailored sensors.
This work describes the establishing of the hydrological information network Open Hydrosystem Information Network (Openhi.net) for the surface waters of Greece. Openhi.net aims to enhance the sustainability of water resources and associated ecosystems, and their climate resilience, as well as to contribute to flood hazard reduction. Since the 1950s, streamflow in Greece has been monitored by the Public Power Corporation, which has been systematically gauging the main rivers in mountainous areas for the hydroelectric power plant design and operation, and by the Ministries of Public Works and of Agriculture as a part of their water resources development, flood protection and land reclamation activities. These entities have also established an extensive network of meteorological stations, comprising mainly conventional rainfall gauges for daily observations. The National Meteorological Service and (recently) the National Observatory of Athens collect finely resolved data extending across the spectrum of meteorological variables. Finally, the Institute of Geology & Mineral Exploration of Greece (supervised by the Ministry for Development) monitors the groundwater resources.
Until the 1990s, the hydrological and meteorological data were collected by conventional means. The continuously recording instruments used paper charts; hence, regular replacing (daily, weekly etc.) of that paper was required. In the 1990s, various public entities (municipalities, prefectures, institutes) installed automatic telemetric stations, mainly for collecting meteorological data. During the same period, the evolution of informatics led to digitizing older conventional data and providing them through the ubiquitous internet. Hydroscope [4,5] was the first attempt at unifying the fragmented hydro-meteorological information landscape. It created a national data base (DB); however, that effort was only partially successful. Today Hydroscope is maintained statically by the Special Secretariat for Water, Ministry of Environment and Energy. One lesson learned was that data from various sources that did not follow a common model could not be harmonized; thus, ground truth could not be ascertained. Consequently, Hydroscope was not perceived as a success in federated data acquisition. Today, several telemetric networks are in operation, collecting surface-water information independently from each other at the local to the regional scale.
Open Hydrosystem Information Network (Openhi.net) was created to remedy such shortcomings: it is a large-scale infrastructure for collecting, processing and storing data on the surface waters of Greece, serving applied, research and operational needs [6]. The tenet underlying Openhi.net is openness, free access to data and monitoring infrastructure. Paramount in this work is that partners develop and manage their own DBs, but according to common agreed-upon standards, and provide data to a common, publicly accessible DB; therefore, aspiring partners must also agree to offer their data for public access. In its pilot phase Openhi.net operates a small number of stations in few river basins, but it is envisioned as a precursor of a national hydro-data infrastructure for the surface waters of Greece. The observed variables fall in four areas: (1) water quantity: river-lake stage and streamflow; (2) water quality: temperature, pH, conductivity, and dissolved oxygen; (3) meteo-variables: temperature, rainfall, wind speed, relative humidity and solar radiation; and (4) soil variables: temperature and soil moisture.
Openhi.net includes (a) a web-platform, for visualizing, processing and managing telemetric data; (b) three pilot telemetric networks, installed for monitoring quantity and quality of surface waters, as well as meteorological and soil variables; and (c) a GIS component offering web-services relevant to geo-information for water bodies (topologically consistent hydrographic network, lakes, reservoirs etc.). Openhi.net also (i) fosters the development of smart, low-cost hydrometric and data transmission technologies, (ii) evaluates the existing gauging infrastructure, and (iii) supports the development of a strategic plan for establishing a national monitoring network. In our connected world, pooling multiple data sources allows researchers and practitioners to come together in creative ways, enhances data understanding and results in broadly applicable insights.
Openhi.net aims to bring together existing networks and to provide reliable information on the country’s surface waters to various users, such as water resources professionals, environmental agencies, researchers and the public. The visibility of the project is important, as inter alia: (a) historical measurements are critical for the management of water resources, for the design of hydraulic and renewable energy projects, for climatic assessments and for agricultural management; (b) real-time observations are crucial for the operation of early warning systems; and (c) incorporation of existing networks into the infrastructure gives the opportunity for more effective management and dissemination of this important information.
The OpenHi.net was developed by the cooperation of Universities and Research Institutes that are involved in the measurement of hydrometeorological variables. Currently the OpenHi.net consortium consists of the following partner organizations:
  • Department of Water Resources & Environmental Engineering (DWREE), National Technical University of Athens (NTUA);
  • Institute for Environmental Research & Sustainable Development, National Observatory of Athens (NOA);
  • Institute of Marine Biological Resources & Inland Waters, Hellenic Centre for Marine Research (HCMR);
  • Institute of Communication & Computer Systems (ICCS) of NTUA;
  • Department of Agriculture, University of Ioannina (UnIo).
NTUA (DWREE and ICSS) designed the functionality of the system, developed the web platform and database, and performed its pilot operation; NOA created the water-quantity monitoring infrastructure and collected streamflow data (instrumentation, hydrometric campaigns, new discharge estimation method); HCMR created the water-quality monitoring infrastructure and collected data on relevant variables; and UnIo created the infrastructure for collecting meteorological data and soil variables.
In the following, the paper presents, in Section 2, the IT aspects of OpenHi.net, i.e., the architecture of the web platform and the GIS component, with their provided services. Section 3, System Demonstration, describes the three networks mentioned above. Section 4, Applications, includes certain system facilities, and technological (hydro-telemetric station) and hydraulic research (discharge estimation method from surface velocity observations) results. The paper closes with Section 5, Conclusions.

2. Open Hydrosystem Information Network (Openhi.net)

2.1. Web Services

The system offers services that are related to the management of monitoring stations and the retrieval of hydrological and Geographical data. The main services offered by the platform are:
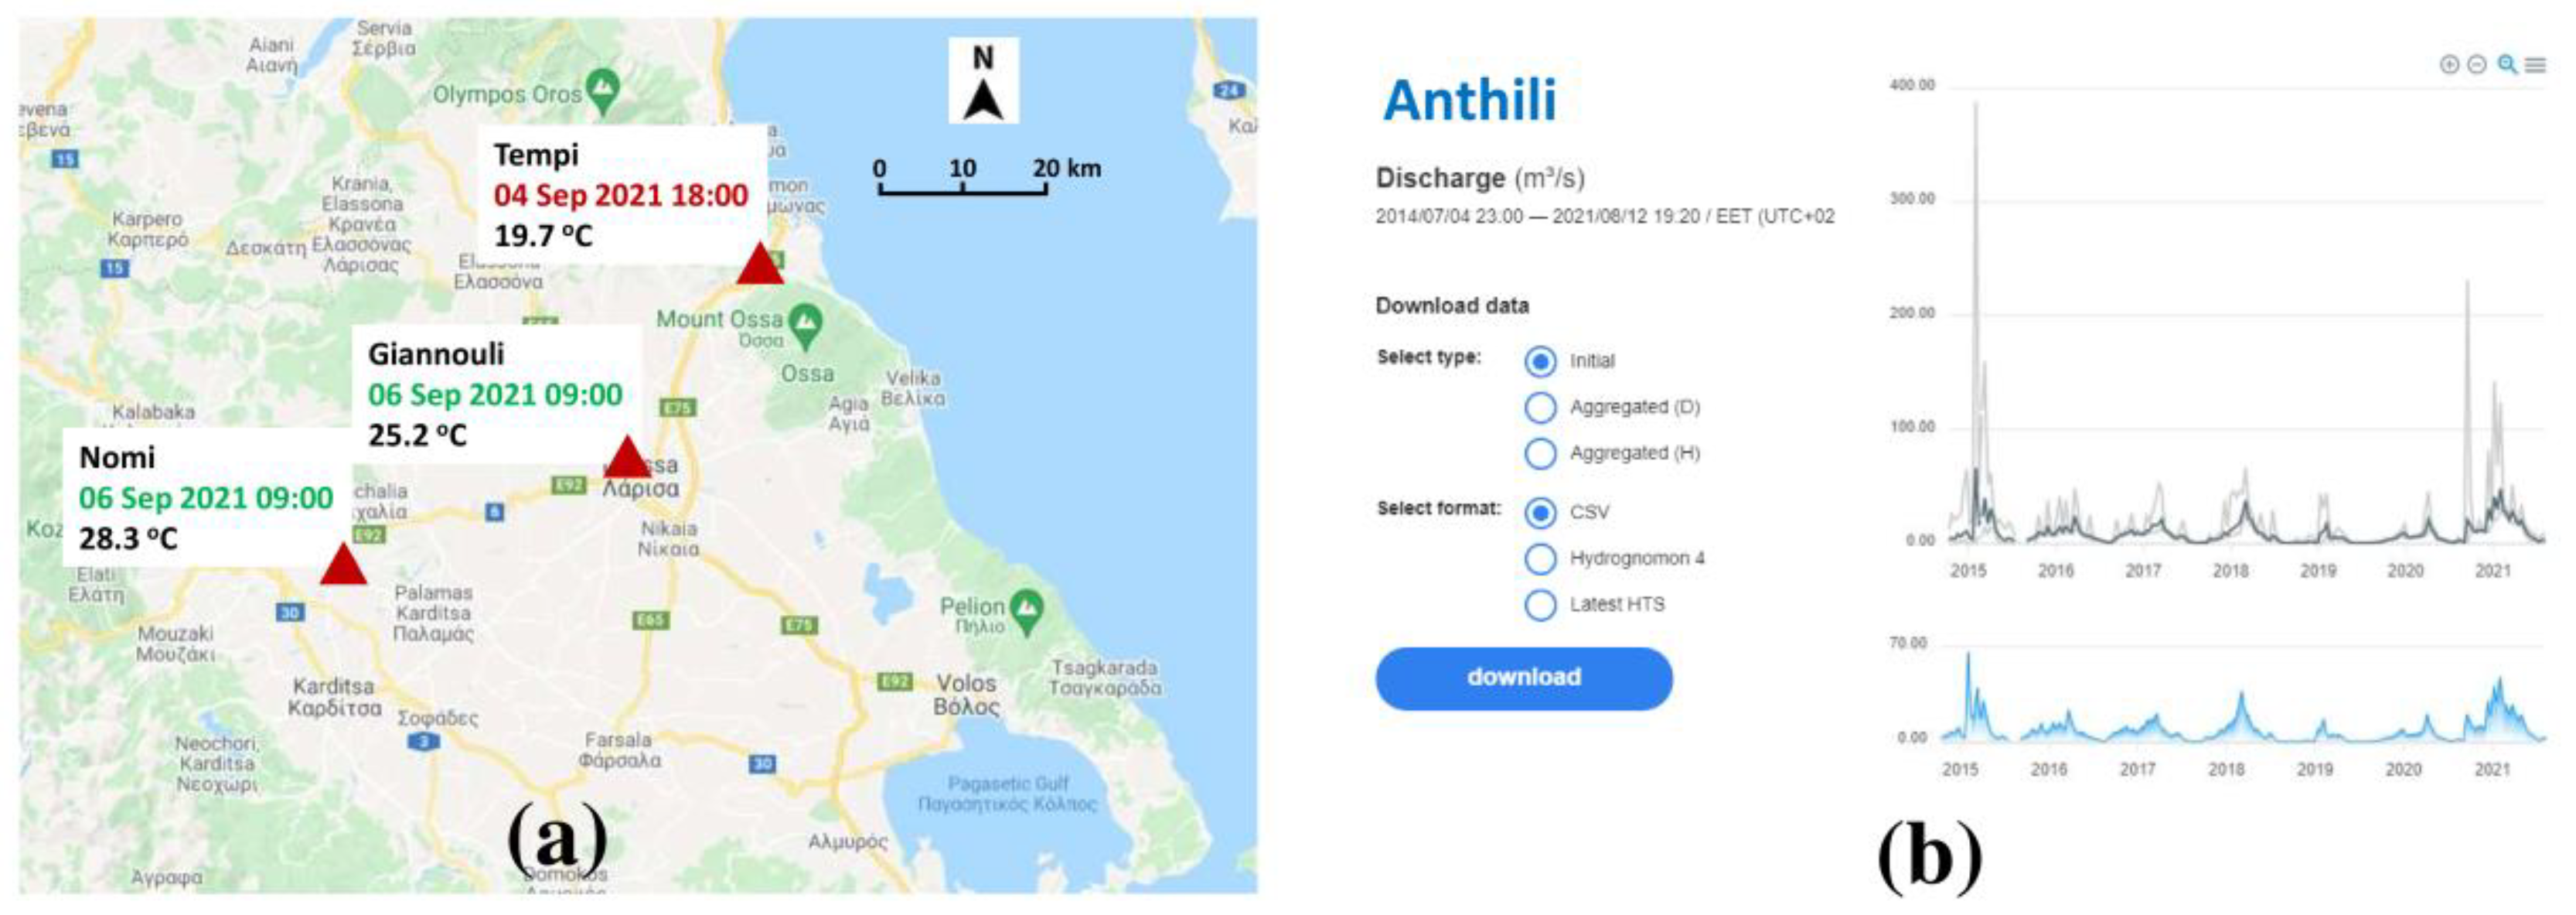
  • A dynamic map showing in near-real-time observations for each selected variable;
  • Retrieval of raw and processed time series;
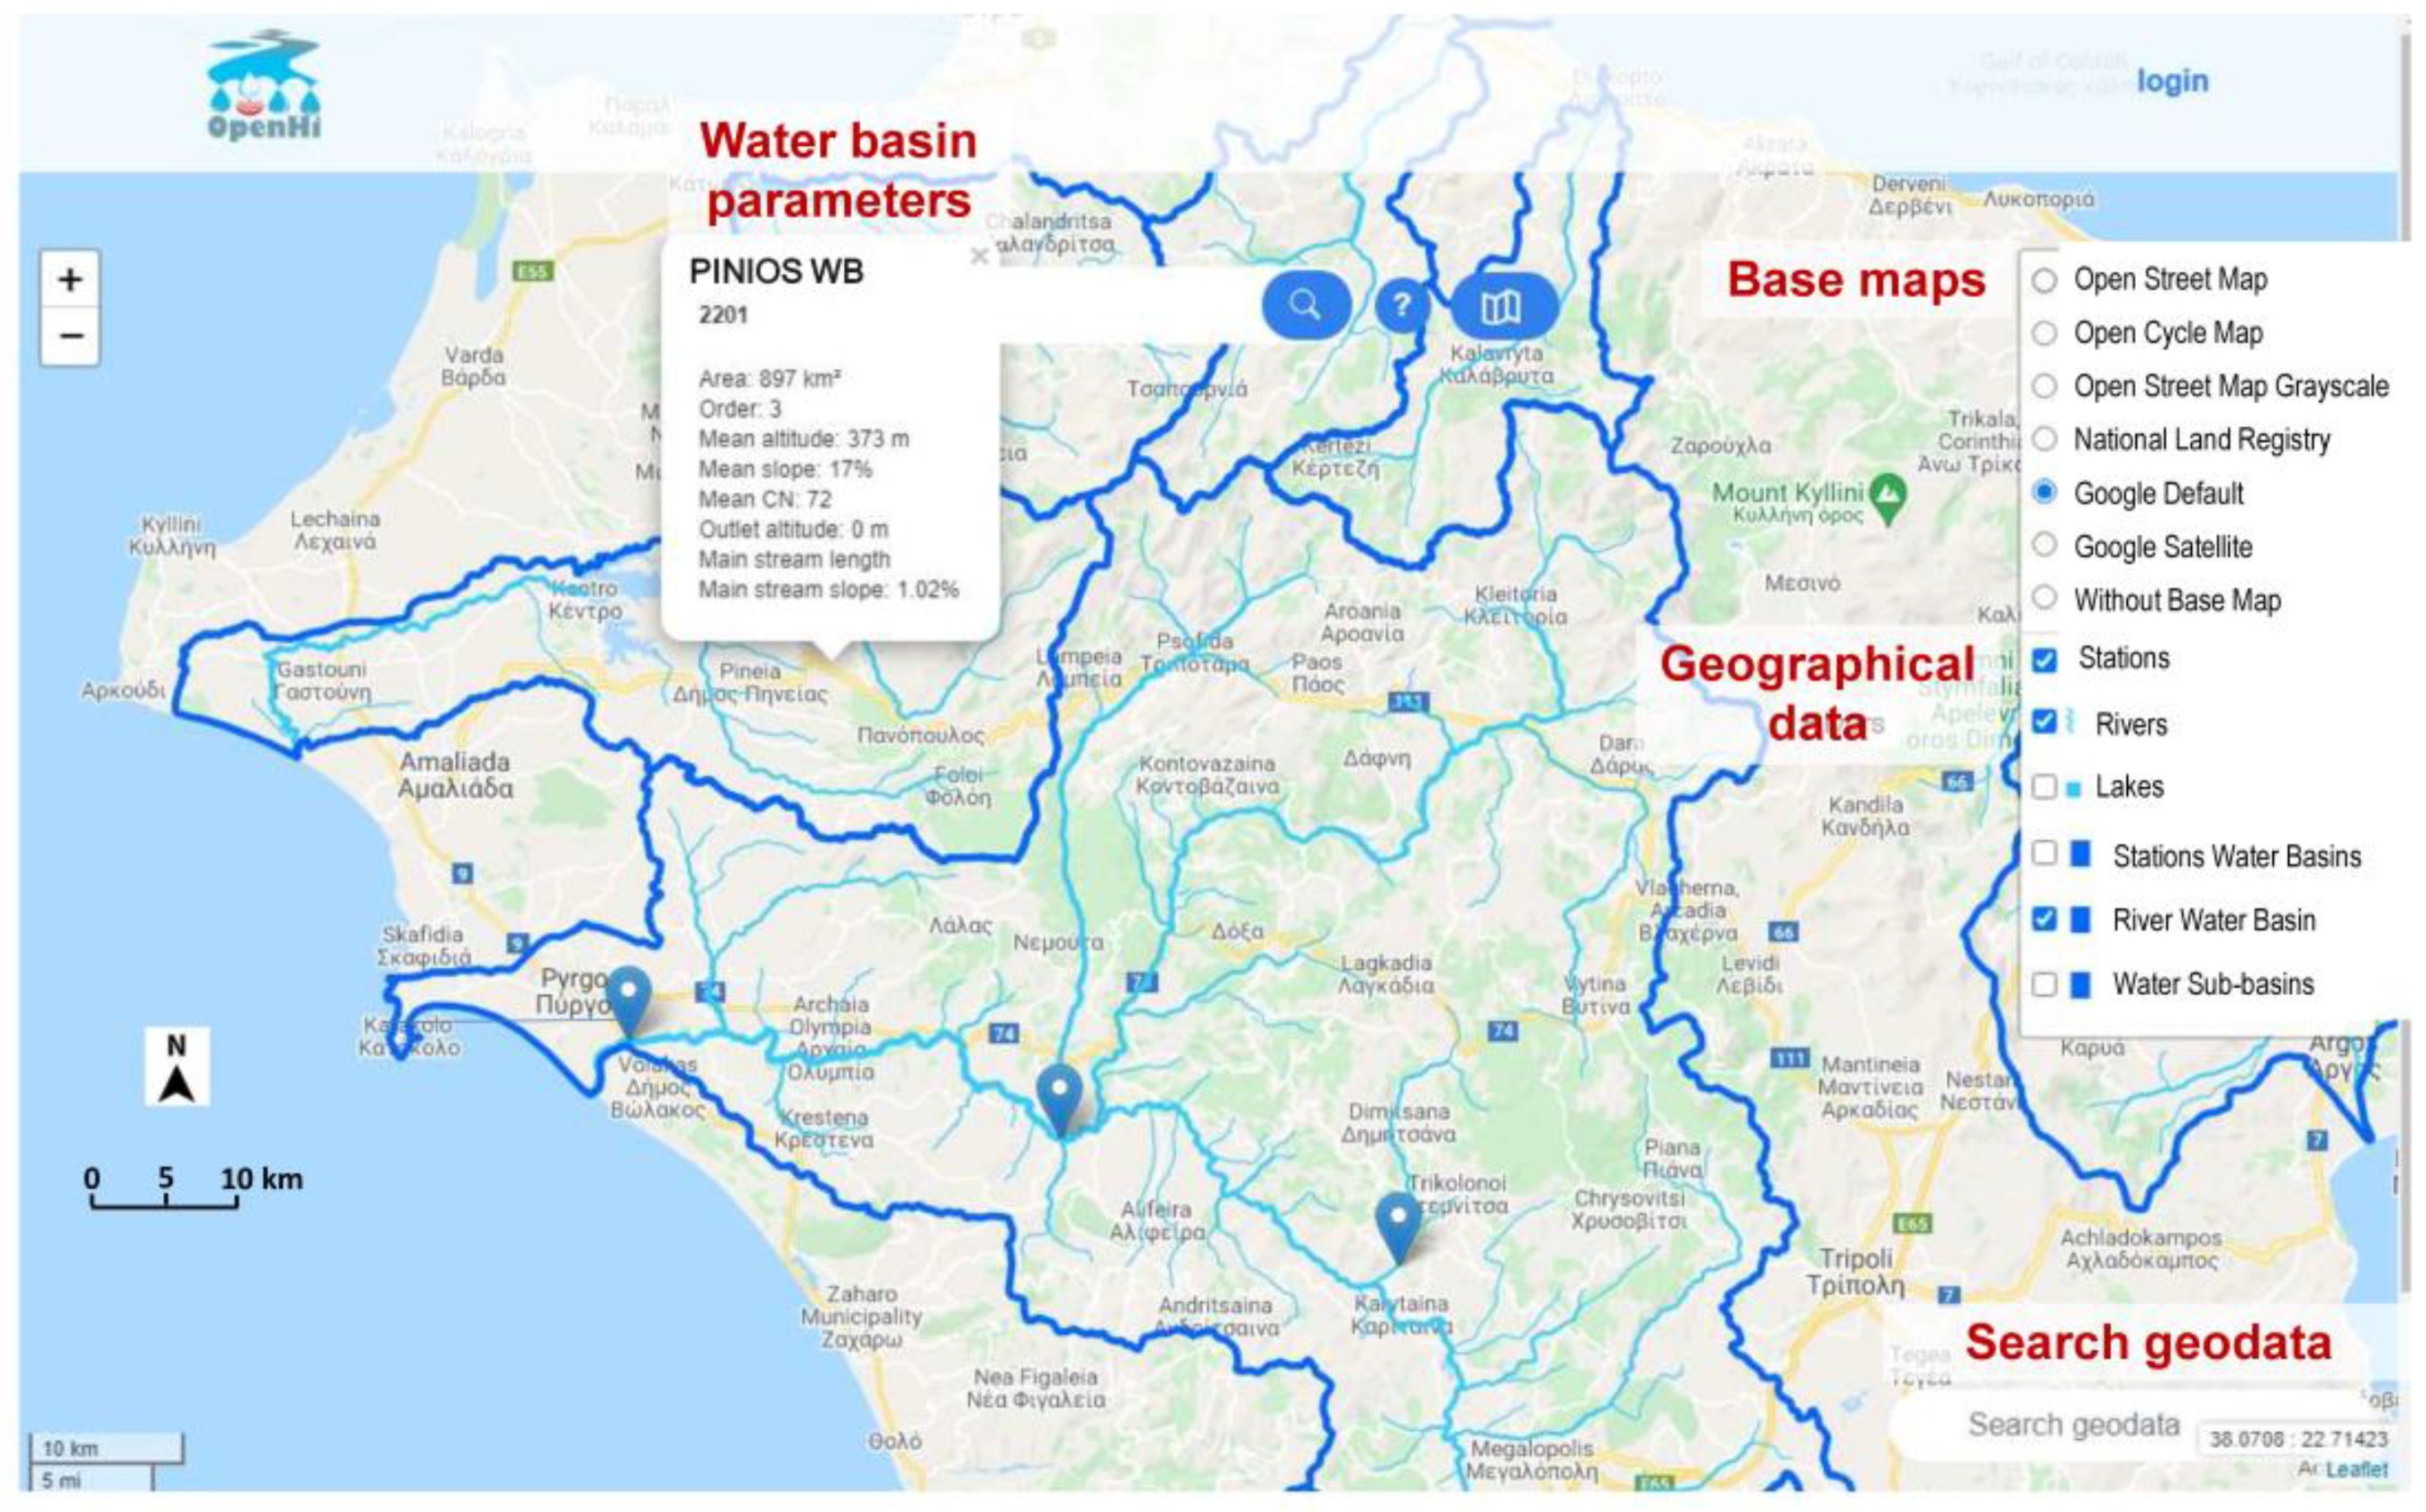
  • Retrieval of geographical data and water basin processed parameters (area, slope, time of concentration etc.);
  • Integration of new stations in the system, which includes applications for station management, data correction and time series process.
Figure 1a presents the dynamic map for real time observations. The temperature of the river water, at a certain time, is depicted for three stations. The green color of the data at the stations Nomi and Giannouli denotes that observations are in real time. The red color of the data in the station Tempi means that the measurement is outdated.
Figure 1b presents the application for retrieval of raw and processed time series of river discharge. The user can view, in a diagram, raw or aggregated (hourly, daily) discharge data from Anthili station. In addition, the user can download the selected time series in various formats.
Geographical information is essential for several environmental applications. The system offers web-services related to hydrological-geographical data for hydrographic network, lakes and reservoirs, river water basins and basins upstream of monitoring stations at the national level. The user can access, query and download the geographic data through the Openhi.net platform. The application for handling geographical data is presented in Figure 2.
In Figure 2, certain features of the application are depicted. For a selected water basin, its boundaries and the processed parameters (area, slope, mean altitude etc.) appear in a window. The application supports several base maps (Open Street, Google etc.) and offers geographical data (stations, rivers, water basins etc.). A geodata search capability is also provided for reading the geographical names stored in the database and zooming to the relevant boundary.

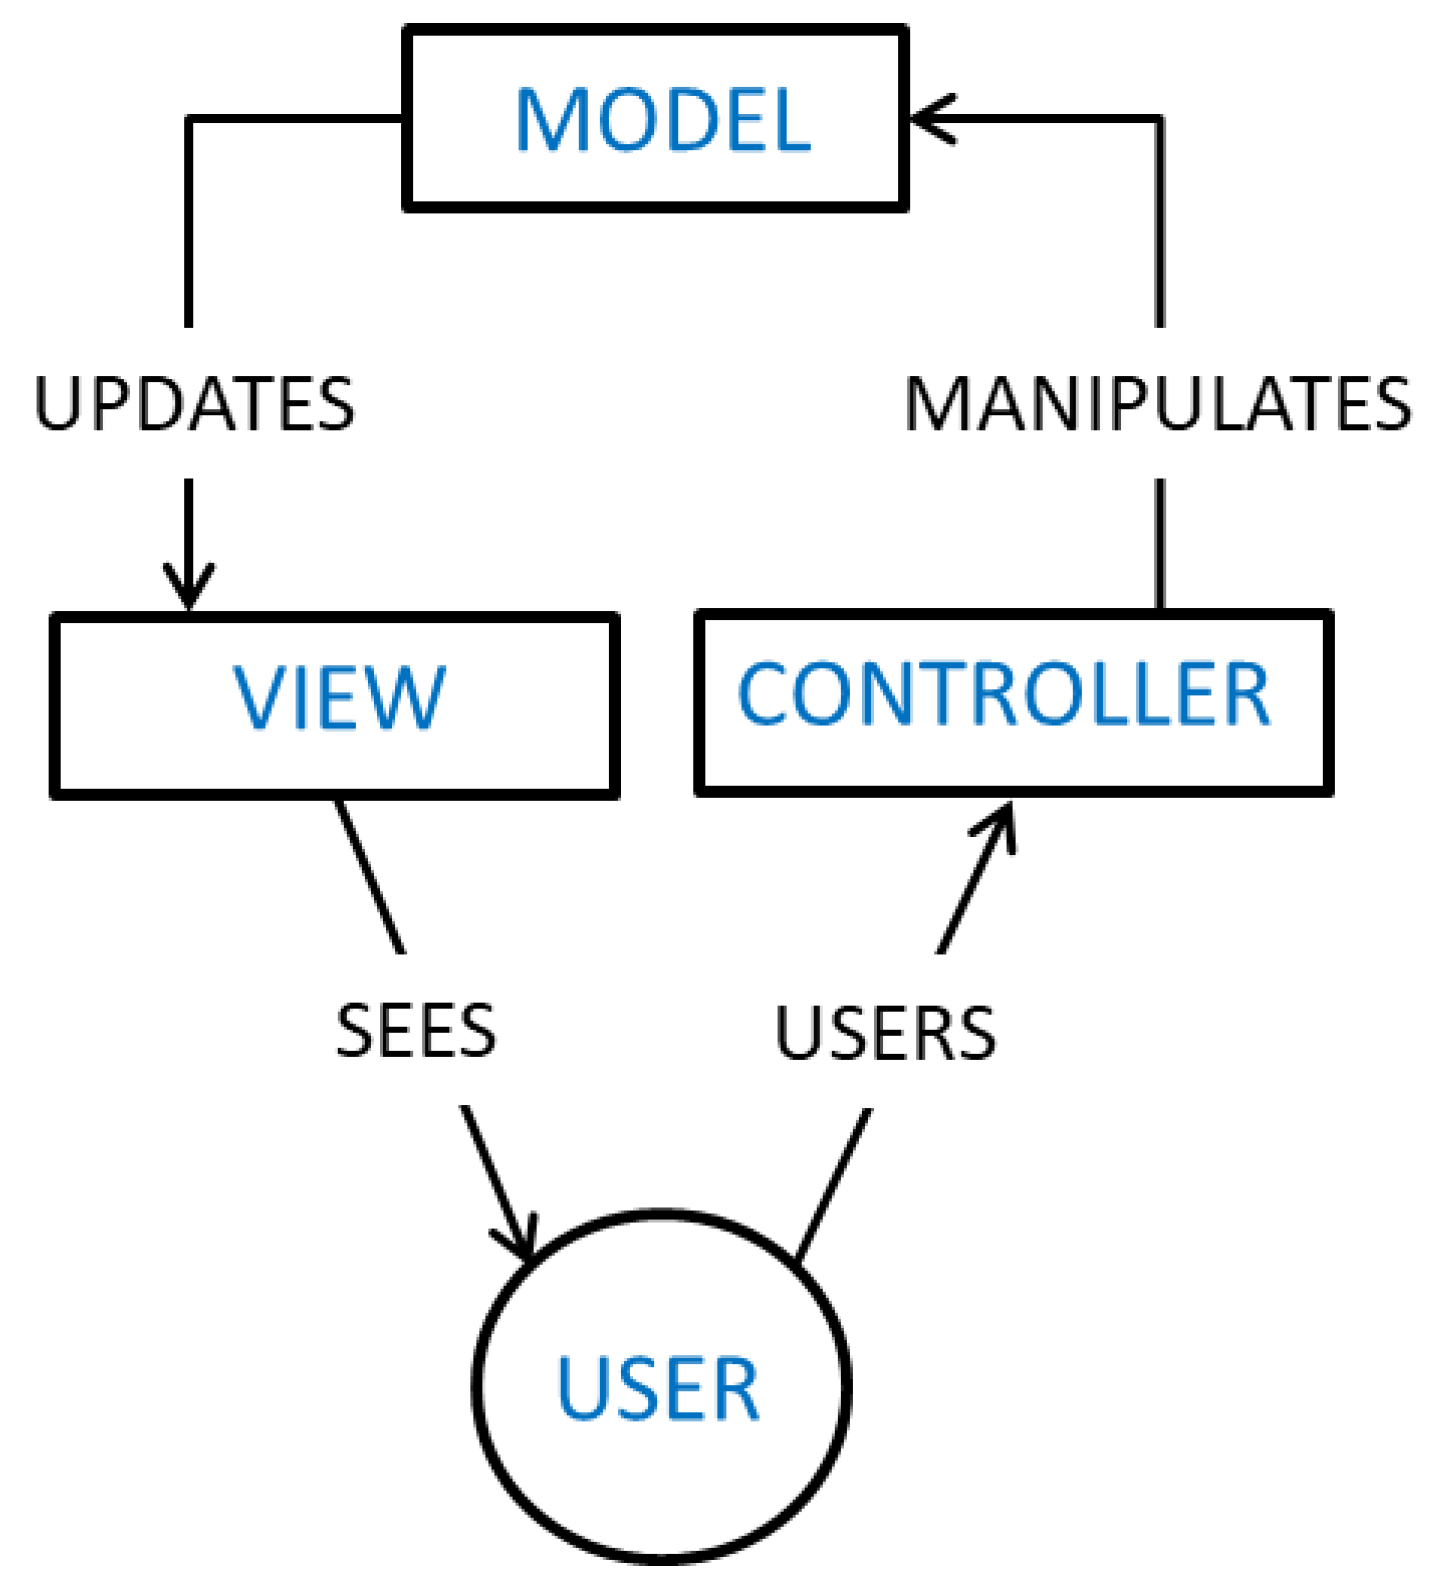
2.2. Platform Design
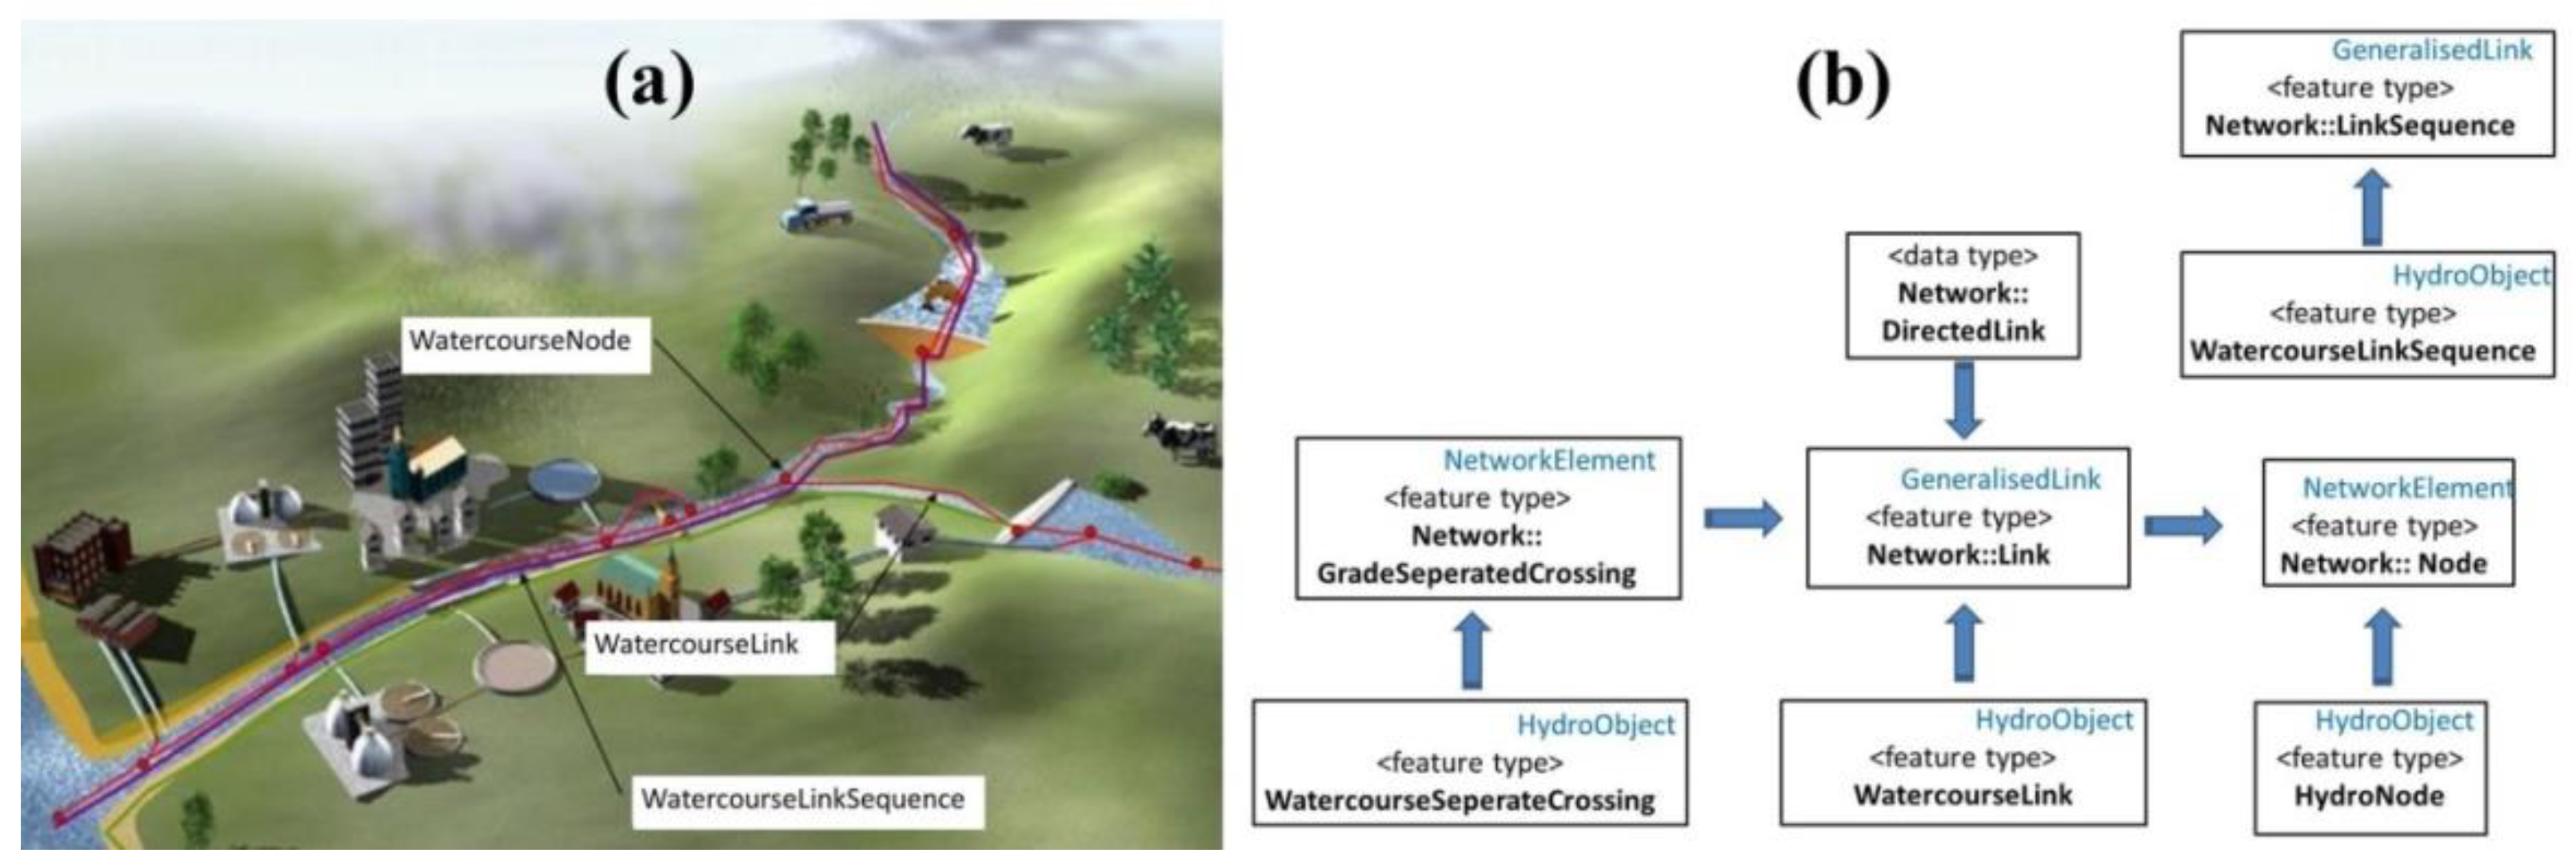
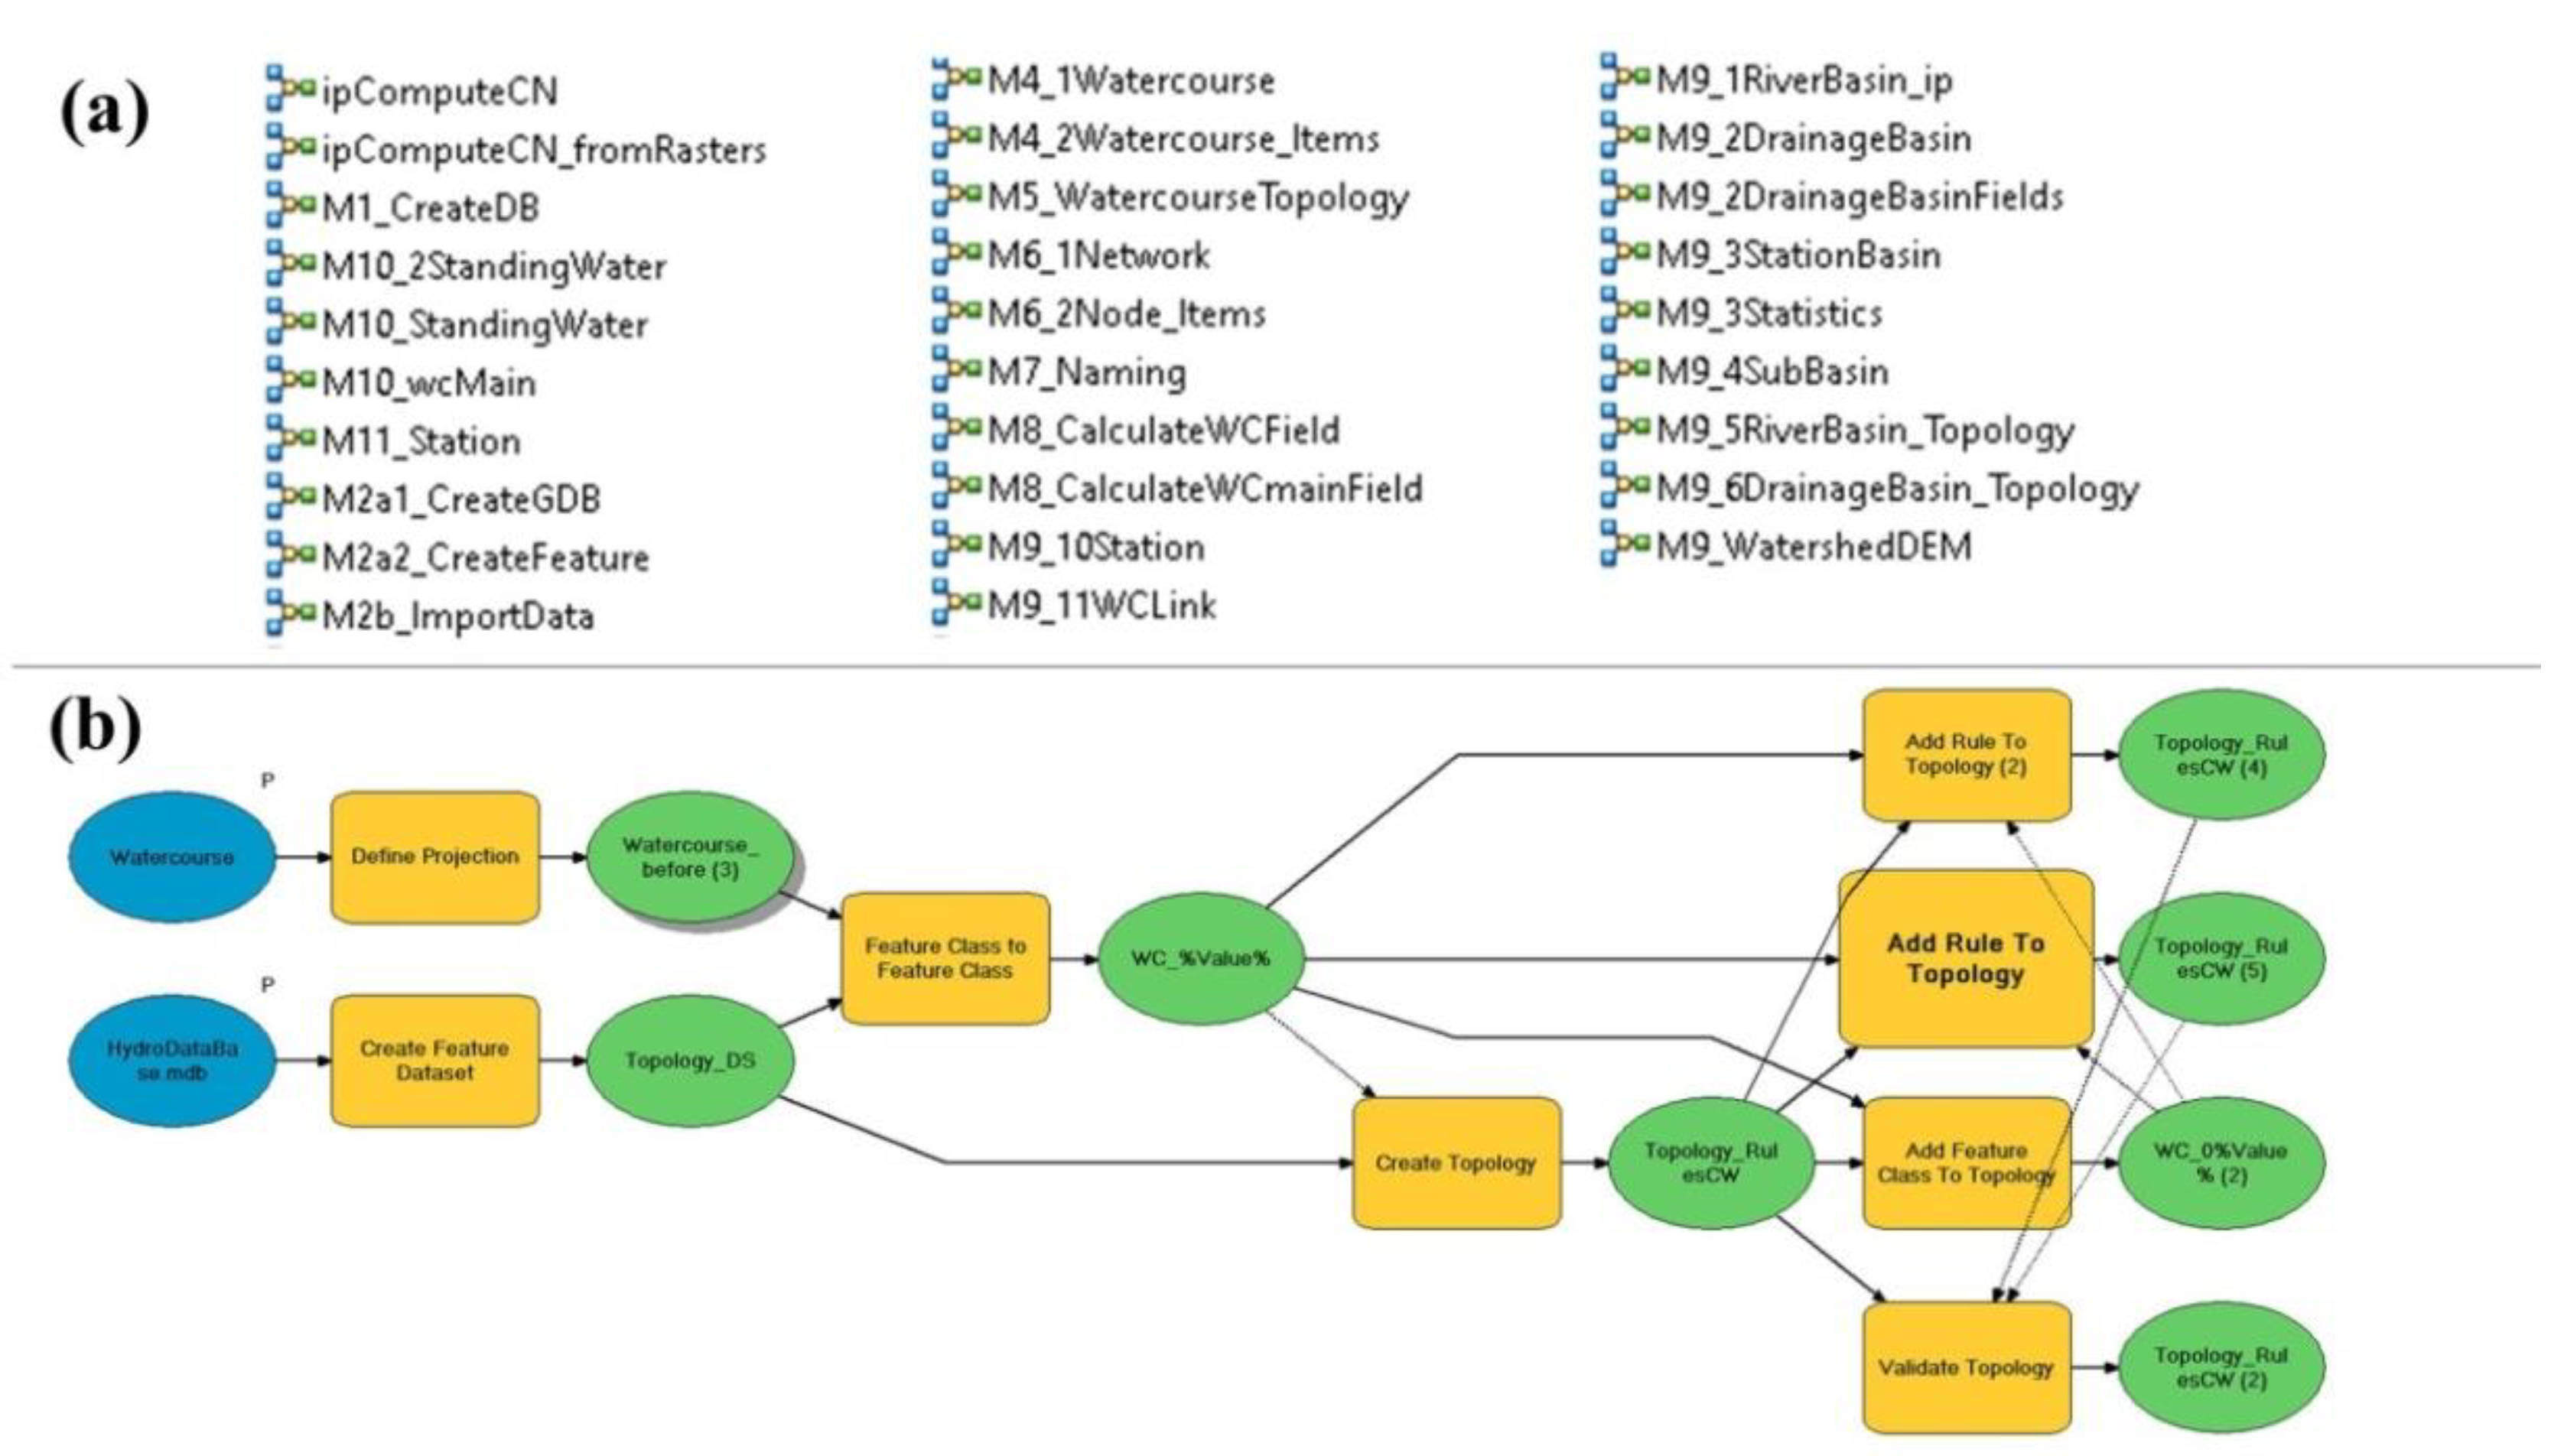
The proposed platform is built upon the successful web 2.0 technology [7] that currently prevails on all online platforms, mainly due to the ever-increasing capabilities of browsers that can consume not only plane static pages but also dynamic data, and in our case, time series. The proposed platform is built around the well-known architectural Model–View–Controller pattern [8] for web applications, Figure 3.
This pattern places a separation between the User Interface, i.e., the View component and the Controller component. The Model represents data and the rules that govern access to and updates of this data. In enterprise software, a model often serves as a software approximation of a real-world process. The platform considers stations, instruments, administrators and time series as objects (classes, in the modelling terminology) with associated attributes. The View renders the contents of a Model and specifies exactly how the model data should be presented. When the model data change, the View must update its presentation as needed. The Controller translates the user’s interactions with the view into actions that the model will perform. In this web 2.0 application, they appear as GET and POST HTTP request (HTTP POST). The Controller implements the required business logic for implementing actions imposed by end-users or administrators. For instance, a typical workflow action is the elimination of “improper” time series values extending beyond the rational dynamic range of a value.
As this platform constitutes a national infrastructure with multiple stakeholders, it is important to: (a) model the workflow relations originating from a contributing member-organization and their own set of stations and (b) automatically process raw data to quality checked time series. In a sense, there are multiple administrators, each one corresponding to an affiliated member organization. In this initial phase of the project, NOA, HCMR, NTUA and UoI are the contributing members of this common infrastructure. Initially, a member organization instantiates a new station with its equipment, within the web 2.0 platform. Afterward, the member administrator initiates data quality control or an aggregation process across selected time series data. This means that the platform can generate derivative quality-checked time series, in contrast to the original “dirty” raw data.
Older implementations [5] incorporated a file-based approach, where time series data were stored in flat files and only metadata were stored in a relational DB. Such a scheme did not allow for value-related queries across an area, as for instance, what was the one-hour aggregated rainfall depth in a river basin? The proposed system accommodates a data persistence layer that incorporates a time series and a GIS DB. This allows time-interval related data handling of stored values as well as related spatial and geographic data. The implemented system utilizes TimeScaleDB, a well-known open source Postgress extension for column-oriented data, where the main row information is time and columns represent the different time series values.

2.3. GIS Component

The geographical database design and implementation adopts the “Data Specification on Hydrography—Technical Guidelines” of the Directive 2007/2/EC [9]. Data stored in the database are following the INSPIRE scheme, according to which watercourses, standing waters, drainage basins and river basins are the basic elements to specify surface waters. Additionally, watercourse links and watercourse nodes have to be created to enforce the network connectivity and topology. For each physical water above-mentioned elements, the INSPIRE Directive proposes tables and relative fields, for example concerning watercourses length, slope, stream order etc., to be implemented.
Elevations are extracted from the European Digital Elevation Model at 25 m resolution. Extraction (before editing) of a primary watercourse line is performed through the EU-DEM, by applying an upslope 10-km2 contributing-area threshold, following Directive 2000/60/ECC. Other main data sources used are: (a) hydrographic network, lakes and reservoirs from implementation of the Directive 2000/60/ECC, (b) hydrographic network from the implementation of the Directive 2007/60/EC, (c) hydrographic network from OpenStreetMap (publicly available), and (d) hydrographic networks from scanned maps at the scale ~1:50,000. Several models are designed and created to run the geographical processes and to perform attribute calculations. Watercourse extraction from the filled EU-DEM, hydrographic network definition and river basin delineation are certain primary processes in the geomorphologic attributes’ calculation.
Stored attributes of watercourses are segment length and slope, geographical name and stream order. Geographical names are collected using the above-mentioned four sources, applying a buffer of 150 m; the stream order follows the Strahler method. Attributes stored for lakes and reservoirs are area, elevation and geographical name. Area is calculated at the elevation given by the EU-DEM. Several attributes stored for basins such as: area, mean elevation, slope, river length, etc. The average filled EU-DEM value and average slope value (in percent rise) are stored as mean elevation and mean slope of the basin. The curve number of a basin is related with the runoff coefficient and was computed according to an empirical formula developed by NTUA [10]. Strahler order is used to define the watercourse order based on a hierarchy of tributaries. The group of segments that constitutes the main watercourse is used to calculate the length and slope of the main watercourse. A hydrographic network has been also created from the watercourse’s links and nodes as a way to quantify the stream network connectivity. For each watercourse link, the start and end nodes are recorded in the watercourse link attribute table. The whole procedure is based on the relevant INSPIRE design specifications shown in Figure 4.
Elements (watercourse node, watercourse link, watercourse link sequence) are referred to a hydro-model as specified from the INSPIRE Directive. Elements such as wastewater treatment plans are not part of the network schema. A physical representation of elements is depicted in Figure 4a, while the relative unified modeling language diagram is presented in Figure 4b. Spatial relationships between features (watercourses, basins, nodes) are defined using relevant and validated topological rules of hydrology. A toolbox with several models was created to perform the geographical processes and to run calculations of spatial and geomorphological attributes, Figure 5.
Such models (Figure 5a) are: (1) watercourse extraction, (2) hydrographic network definition, (3) river basin delineation, (4) creation of an INSPIRE based geo-DB, (5) data import from various sources and data export to the geo-DB, (6) a naming model, to give name to each segment of the watercourse using the names from the four aforementioned hydrographic networks, and (7) a basin’s mean curve number calculation. The procedures of watercourse topology model are depicted in Figure 5b. All the modeling procedures and output datasets are considered at the scale of 1:50,000. The ArcGIS Model Builder environment is used as the main spatial analysis tool and final editing is performed with the QGIS software. Furthermore, QGIS is used to make the connection to the ArcGIS geodatabase and to transfer the data to PostGIS (Postgres). Finally, the MapServer software is used for publishing the data to the web to access, query and download the geographic data.

3. Demonstration of the System
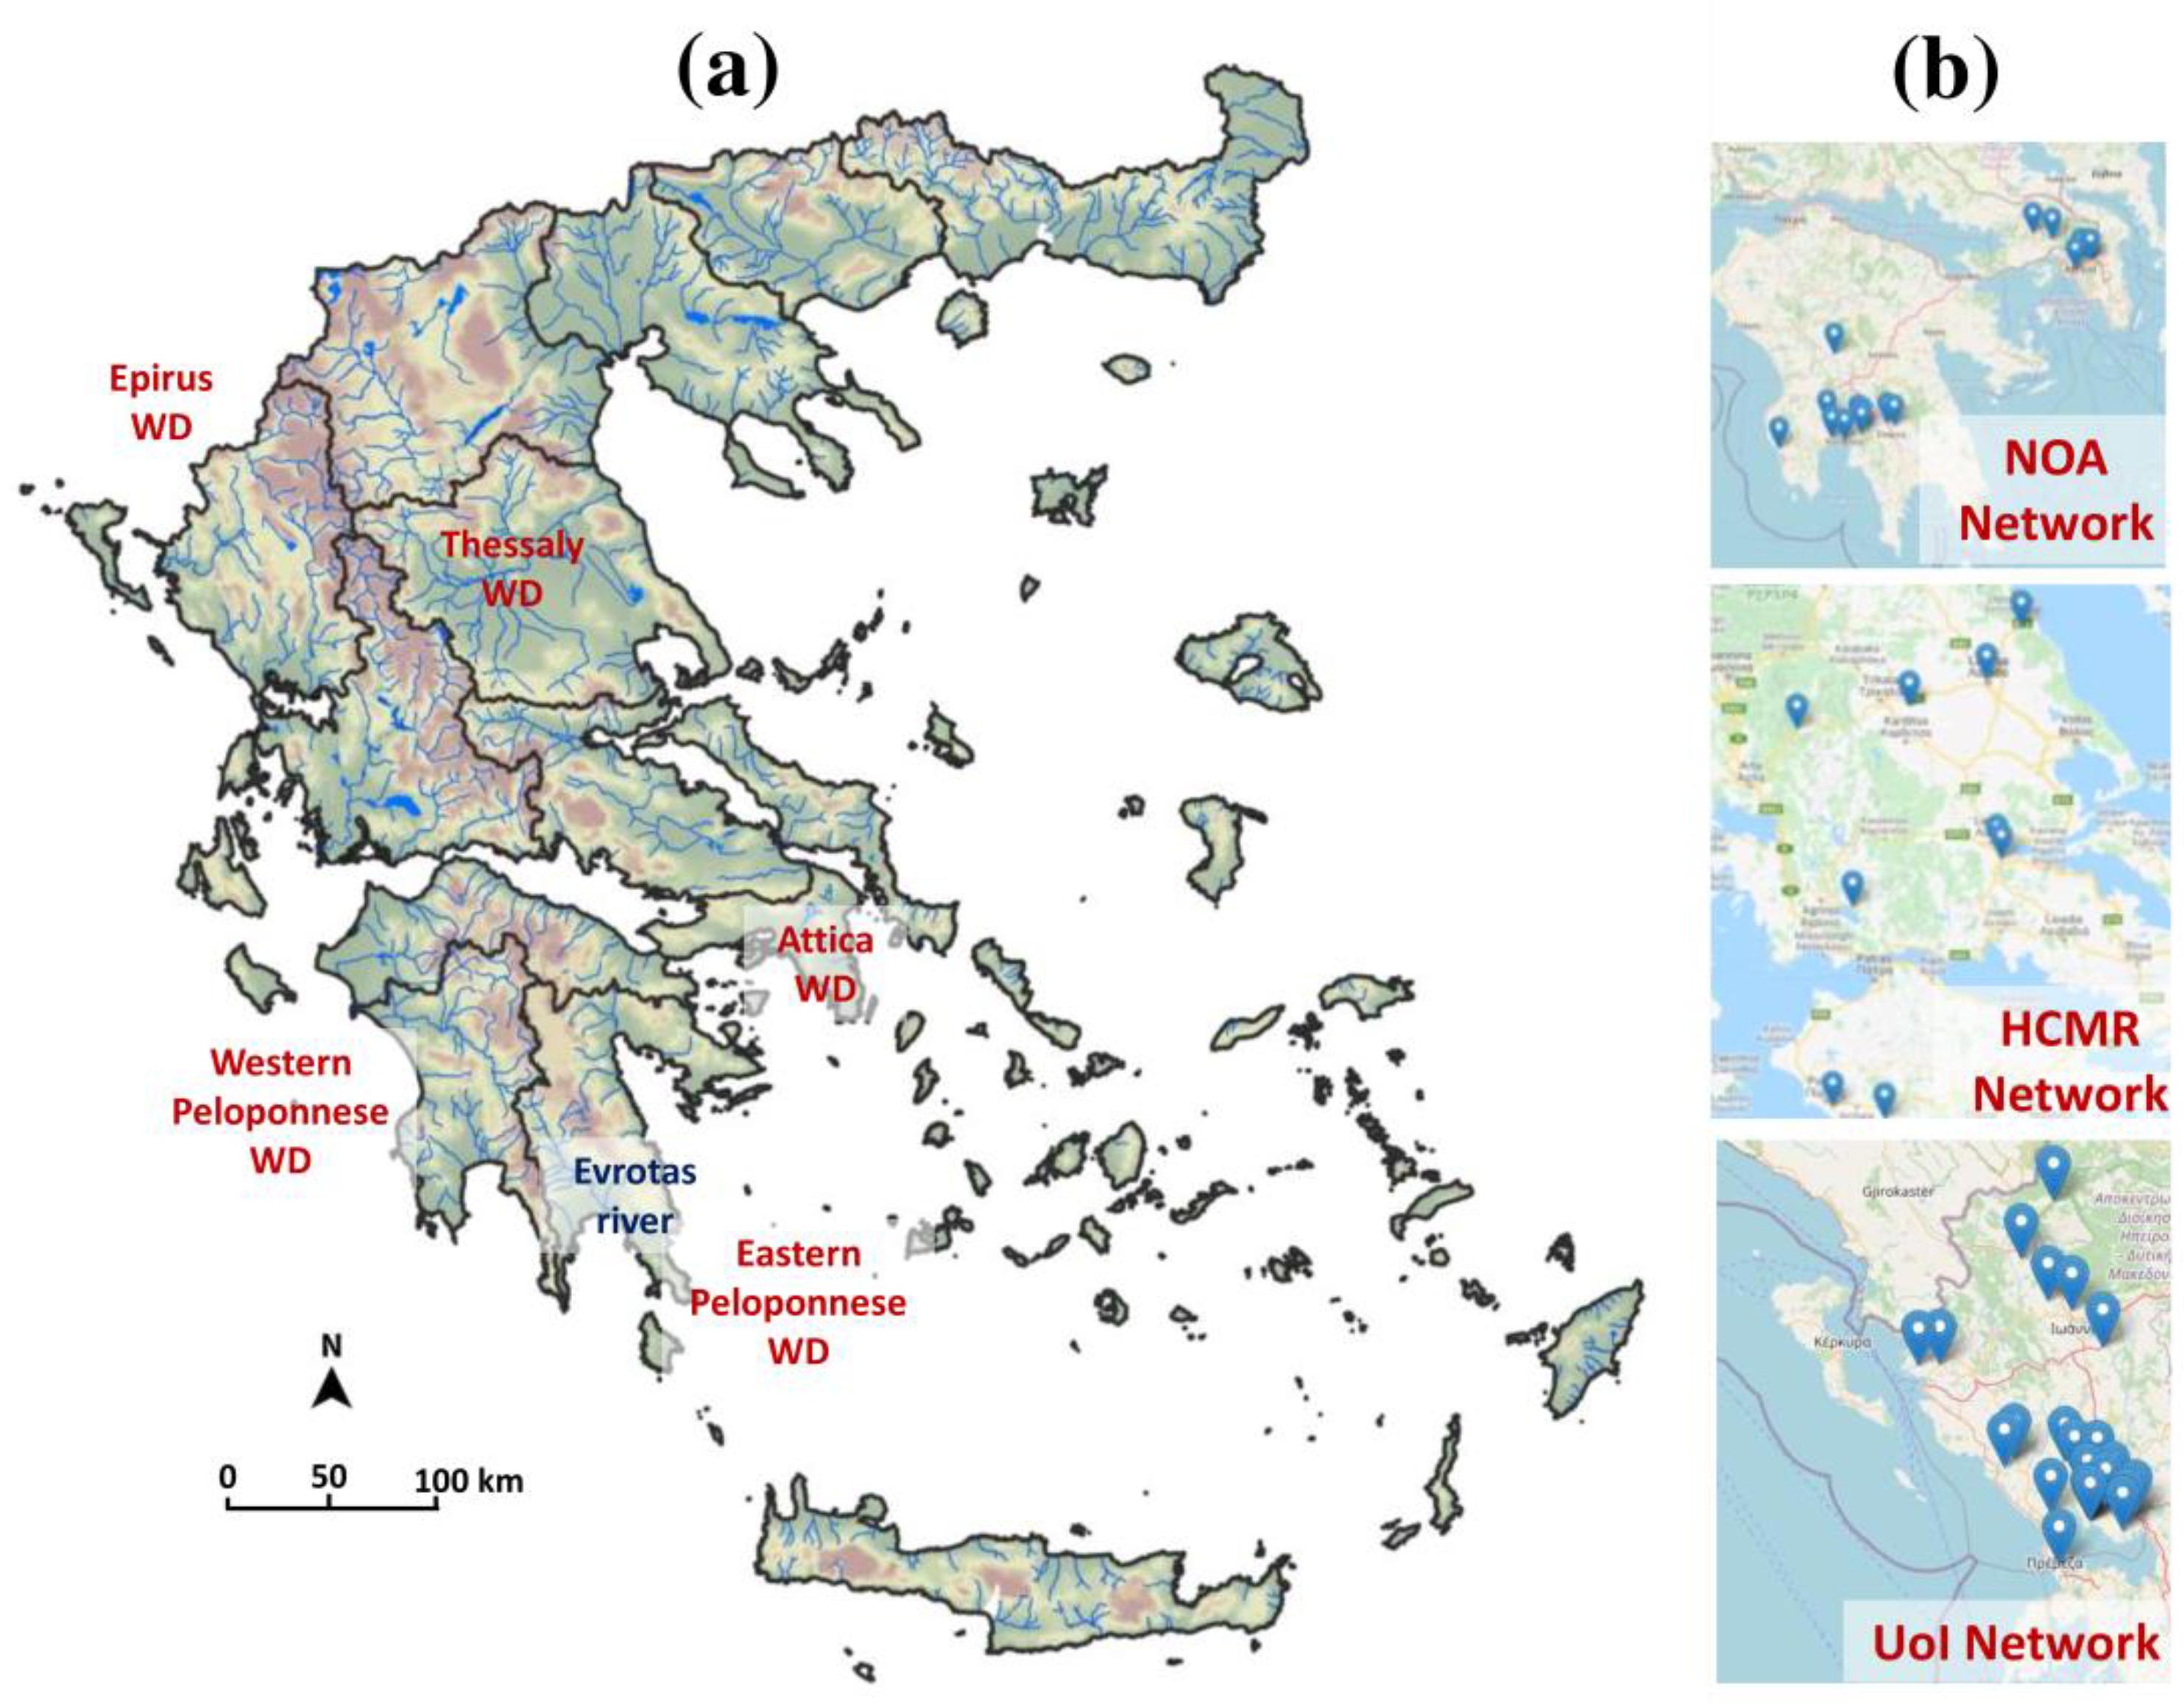
3.1. Introduction

Figure 6a shows the rivers, lakes and water districts of Greece. The positions of the stations of three pilot networks that were installed in the framework of the project are depicted in Figure 6b. HCMR operates the water-quality monitoring network that extends mainly across the Thessaly and Eastern Peloponnese water districts, while NOA operates the water-quantity monitoring network located in Attica, Central and Western Peloponnese water districts. Finally, UnIo operates the network for collecting meteorological data and soil related variables in the Epirus water district.

3.2. Water Quality Pilot Network

The Institute of Marine Biological Resources and Inland Waters of HCMR has surveyed the existing network of automatic water quality stations in Greek rivers, and by applying a GIS-based multi-criteria decision analysis, has identified the monitoring needs, along with the priority areas, for the installation and operation of new automatic telemetric stations [11]. Thus far, eight stations have been established that measure water stage and four physicochemical characteristics of water: pH, temperature, electrical conductivity, and dissolved oxygen. These characteristics are directly measurable through a single instrument assembly, with the respective sensors attached to it [12]. The stations are installed under bridges; power for the instrumentation and the telemetry, via GSM networks, is supplied through a solar panel [13].
Conversely, these four physicochemical quantities are all important for the biogeochemical characteristics of surface water ecosystems [14]. Water temperature controls the rate of chemical reactions and the biological activity affecting fish growth and reproduction [15]. The pH of water is controlled by chemical reactions that produce or consume hydrogen ions; there are pH standards for drinking water [16], while deviations from the allowable range due to pollution can damage animals and plants that live in water. The pH is measured with a hydrogen-ion electrode. The electrical conductivity of water, expressed in microsiemens per centimeter (μS/cm), is a measure of the ability of electric current to pass through water, increases with the concentrations of dissolved ions and is considered a key variable to determine the suitability of water for irrigation. Finally, DO, typically ranging from 2 to 10 mg/L, is important for the survival of aquatic organisms, bacterial activity, photosynthesis and availability of nutrients [14].
The real-time monitoring of the above variables can thus reveal the starting point of a pollution event and can subsequently affect (a) the decisions of water management authorities regarding drinking and irrigation water, (b) the required adjustments of water treatment strategies, and (c) the suitability of a water body for recreational use, or possible actions against adverse effects on aquatic life. Moreover, these common physicochemical characteristics can be used as surrogates for many other constituents in water including salinity, sediment, bacteria and nutrients or can be associated with them through regression analyses to further facilitate the evaluation of water quality [14,17].
Our experience with the stations operation and data received thus far provides evidence that in most of the installed instruments the pH and dissolved oxygen sensors require increased maintenance and quality checks compared to the more reliable sensors of water stage, temperature and electrical conductivity. It seems that, for periods of several months without sensor calibration, the specific conditions at the installation sites, biofouling and a river’s sedimentation regime largely determine the level of a sensor’s deviation from proper functioning.

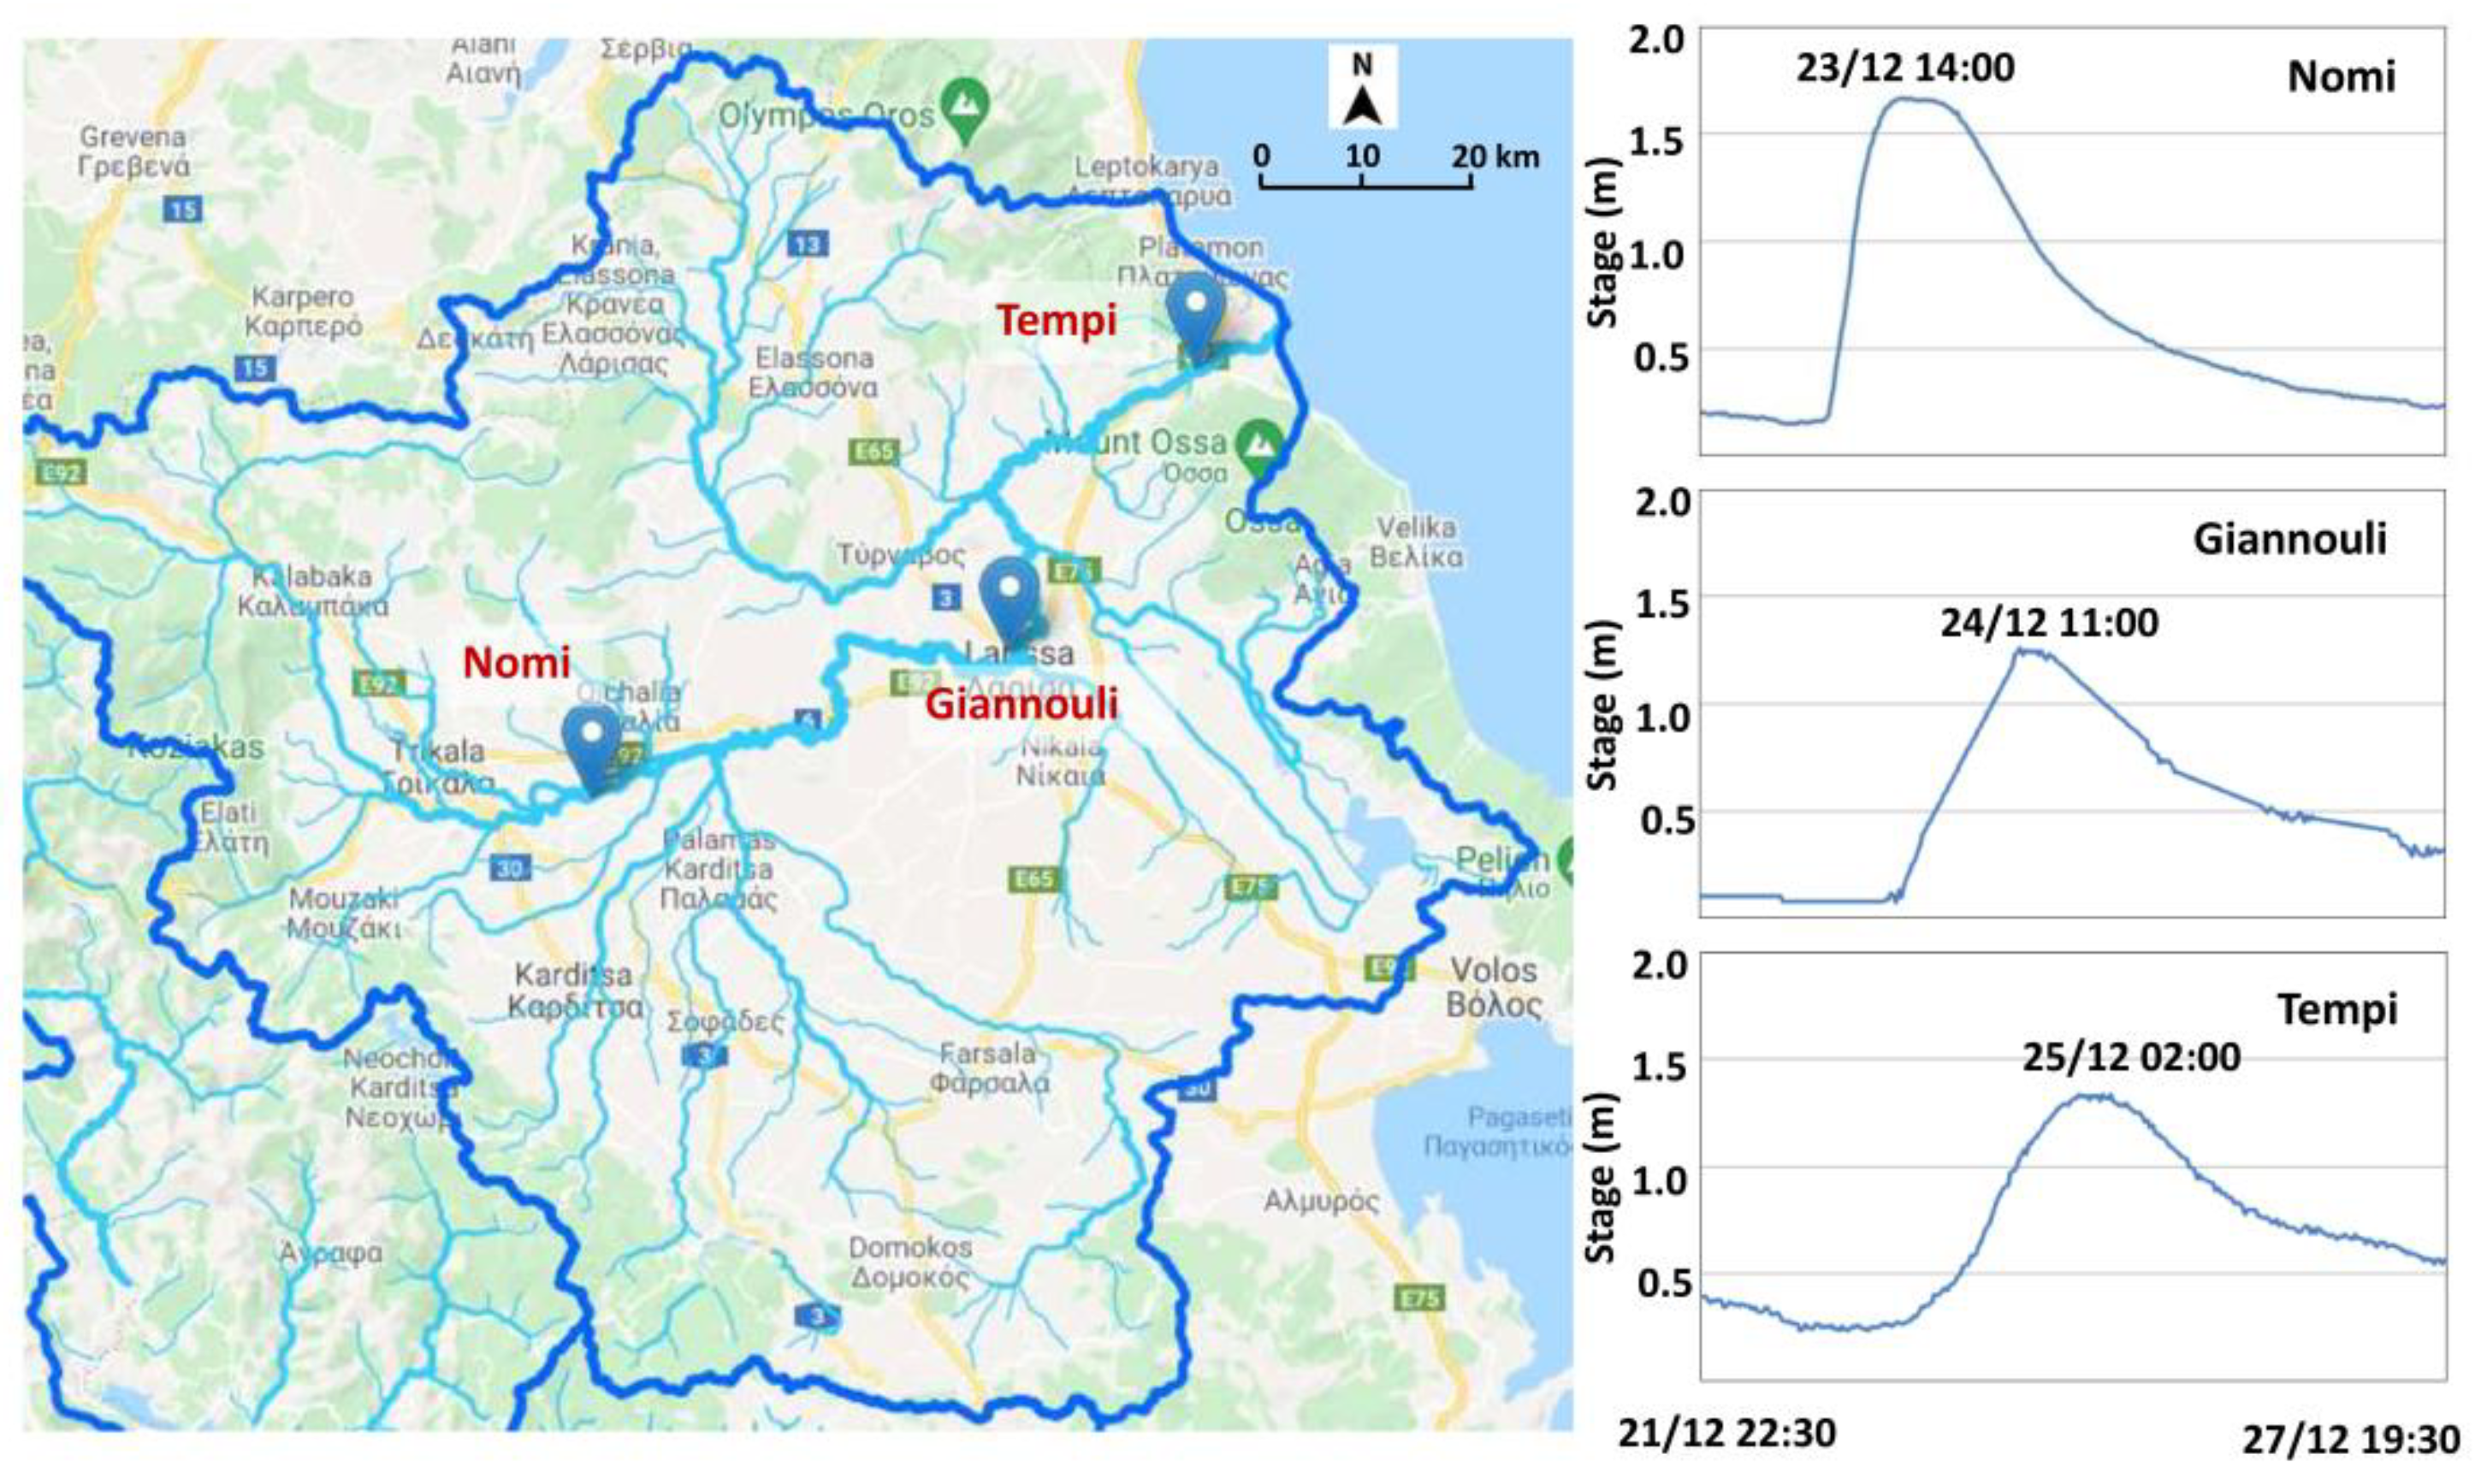
3.3. The Hydrometric Network

Hydronet is a pilot streamflow monitoring network established and operated by the Institute for Environmental Research and Sustainable Development of the National Observatory of Athens (NOA) within the “Hydronet” project (2018–2021) Hydro-Telemetric Network of Surface Waters: Gauging instruments, smart technologies, installation and operation [18]. Hydronet aspires to establish time series of high-quality data for water resources management and for risk assessment of hydrological extremes, as well as for water-use planning and hydraulic infrastructures design. Sixteen stations are currently in operation (ten commercial and six designed and constructed by NOA), six in Attica, seven in the Western Peloponnese and three in Eastern Peloponnese water districts.
In the past, NOA has installed and operated two hydro-telemetric networks in four of the above-mentioned basins (TELEFLEUR, 1998–2001; DEUCALION, 2011–2014). That acquired experience has been useful in the design, installation, operation and maintenance of Hydronet. The selection of basins has been prioritized based on relevant socio-economic and environmental assets and land use (inter alia, the safety of the population in flood-prone areas). Population density and economic activities (industrial/tourism/transportation) are relevant for selecting the basins of Kifissos (Athens) and Sarantapotamos in Attica water district and the basins of Nedon, Selas, and Pamissos in Western Peloponnese water district. Agricultural activities are important mainly in Evrotas basin (Eastern Peloponnese water district), but also in the upstream reaches of the Nedon, Selas, and Pamissos streams in Messinia; the pristine river Loussios (Western Peloponnese water district) is monitored mainly for ecological reasons. Severe floods (also flash floods) have occurred in Attica, particularly in Kifissos river basin [19,20], and parts of the city of Kalamata were inundated by the overflows of Nedon in the past. Criteria considered in designing Hydronet, to ensure its economically viable, long-term operation, included also the available financial resources, the stations’ proximity to NOA (for reduced travel time and costs) and their deployment in geographically adjacent areas (for efficient field campaigns and station maintenance).
Hydraulic suitability criteria were applied in the selection of monitoring sites. The cross-sections, natural or constructed, had to be well-formed—stable and relatively narrow, ideally at bridges—and easily accessible for observations in field campaigns (set-up of rating curves; see “Discharge determination from surface-velocities”), with conventional current meters and/or modern flow metering devices (ADCP or hand-held radar). The monitoring stations are equipped with water level sensor, modem, thermometer (air) and rain gauge (in some). Measurements of the water stage are taken every 10 min and the data are sent to NOA’s Hydronet server for automatic processing (quality control) and storage and then forwarded to Openhi.net. The operating status of the stations is monitored automatically from Hydronet’s server, twice a day. Data quality control is along similar lines and procedures used in HCMR’s water quality network; therefore, it will not be elaborated here. To ascertain resilience against vandalism, the equipment is installed out of sight, or in difficult-to-reach places, preferably under a bridge, but far from the water and debris, to avoid destruction during floods. Solar panels, receiving enough sunlight, keep a station’s battery recharged and telecommunications working, thus ensuring continuous operation of an unattended hydro-telemetric station.

3.4. The Agrometeorological Network

Modern irrigation management techniques require extensive data concerning the soil, plant, and atmosphere continuum in fine spatial and temporal scales. The objective of those techniques is to estimate the water available for the irrigation of plants. Drivers are rainfall and evapotranspiration representing the water supply and water removal, respectively. A new method was presented [21] for estimating the irrigation water requirements and for irrigation scheduling based on agro-meteorological data, with site-specific crop and soil-water data for the plain of Arta in Epirus region (https://irmasys.eu/, released in 2015 and since then operational, accessed on 12 July 2021). This system utilizes information from a network of 18 telemetric agro-meteorological stations that were installed during the last six years by the University of Ioannina in eight plains in the Epirus water district with significant agricultural productivity, i.e., Ioannina, Arta, Preveza, Thesprotiko, Kanalaki, Kestrini, Kalpaki and Konitsa. These stations were installed according to WMO and FAO requirements [22].
The network of stations across the region of Epirus is depicted in Figure 6b. The objective was to cover as many land reclamation organizations as possible. All stations have modular design, to support different types of sensors. At each station are installed sensors for wind speed and wind direction, rainfall, air temperature, relative humidity and solar radiation. Six stations are equipped with additional sensors for soil moisture and soil temperature at three different depths. Data are transmitted by UHF or GPRS to the communications center and are freely provided in near-real time by the Openhi.net online time series database: (https://system.openhi.net, accessed on 30 September 2021). This network of agrometeorological stations constitutes valuable infrastructure for the water district of Epirus, providing near-real time data for most of the cultivated areas [23,24].

4. Applications

4.1. Surveillance of Environmental Parameters

The knowledge of the evolution of environmental quantities in real- time and in space is important for flood and environmental protection. Several surveillance techniques for detecting or predicting relevant extreme values have been developed and incorporated in various early warning systems [25,26]. In the Openhi.net platform specific applications were developed to monitor the evolution of quantities over time, by examining consecutive values of time series but also in space by examining their time series at different geographical locations.
For time series “surveillance”, two distinct notification applications were designed and implemented in the platform. The first application inspects whether the current value of a variable is greater/lower than a given threshold. The second application concerns the evolution of the variable and examines the differences of current value from values at previous time steps. Consider the river stage time series in Figure 7a. For the current stage xt are calculated:
(a) the differences of the current value from previous values for multiple (1…n) time lags Δ1t = xtxt−1, Δ2t = xtxt−2, Δnt = xtxt−n (Figure 7a) and
(b) the probability distributions (empirical or theoretical for a particular model) of differences for various time lags Δ1t, Δ2t, Δnt. The thresholds for each time lag are calculated according to a probably defined exceedance (Figure 7b).
The thresholds are stored for each time series, and in case they are exceeded, the system triggers a notification to predefined recipients.
Surveillance of variables such as dissolved oxygen, pH and water temperature is essential to detect rapidly environmental disasters. Conversely, river stage and discharge surveillance are important to flood protection.
Furthermore, the monitoring of time series in space is critical, for example, information on a rapidly rising stage upstream can provide useful flood mitigation services by increasing the reaction time downstream. The space–time evolution of the Pinios river stage, at three stations along the river during a flood event, is depicted in Figure 8.
The analysis of the recorded stages in Pinios river during major flood events reveals considerable travel times of the flood peak from the upstream station Nomi to the intermediate station Giannouli and the downstream station Tempi. In the flood event of 22–26 December 2019 that is presented in Figure 8, the travel time of flood peak between the two upstream stations is 21 h and between the two downstream stations about 15 h. Although the formation and propagation of the flood wave depends on the magnitude and spatio-temporal pattern of the rainfall, these time lags are long enough to provide downstream communities with the time needed for adequate preparation.

4.2. Data Quality Control Algorithms and Assessment of the Operation of Stations

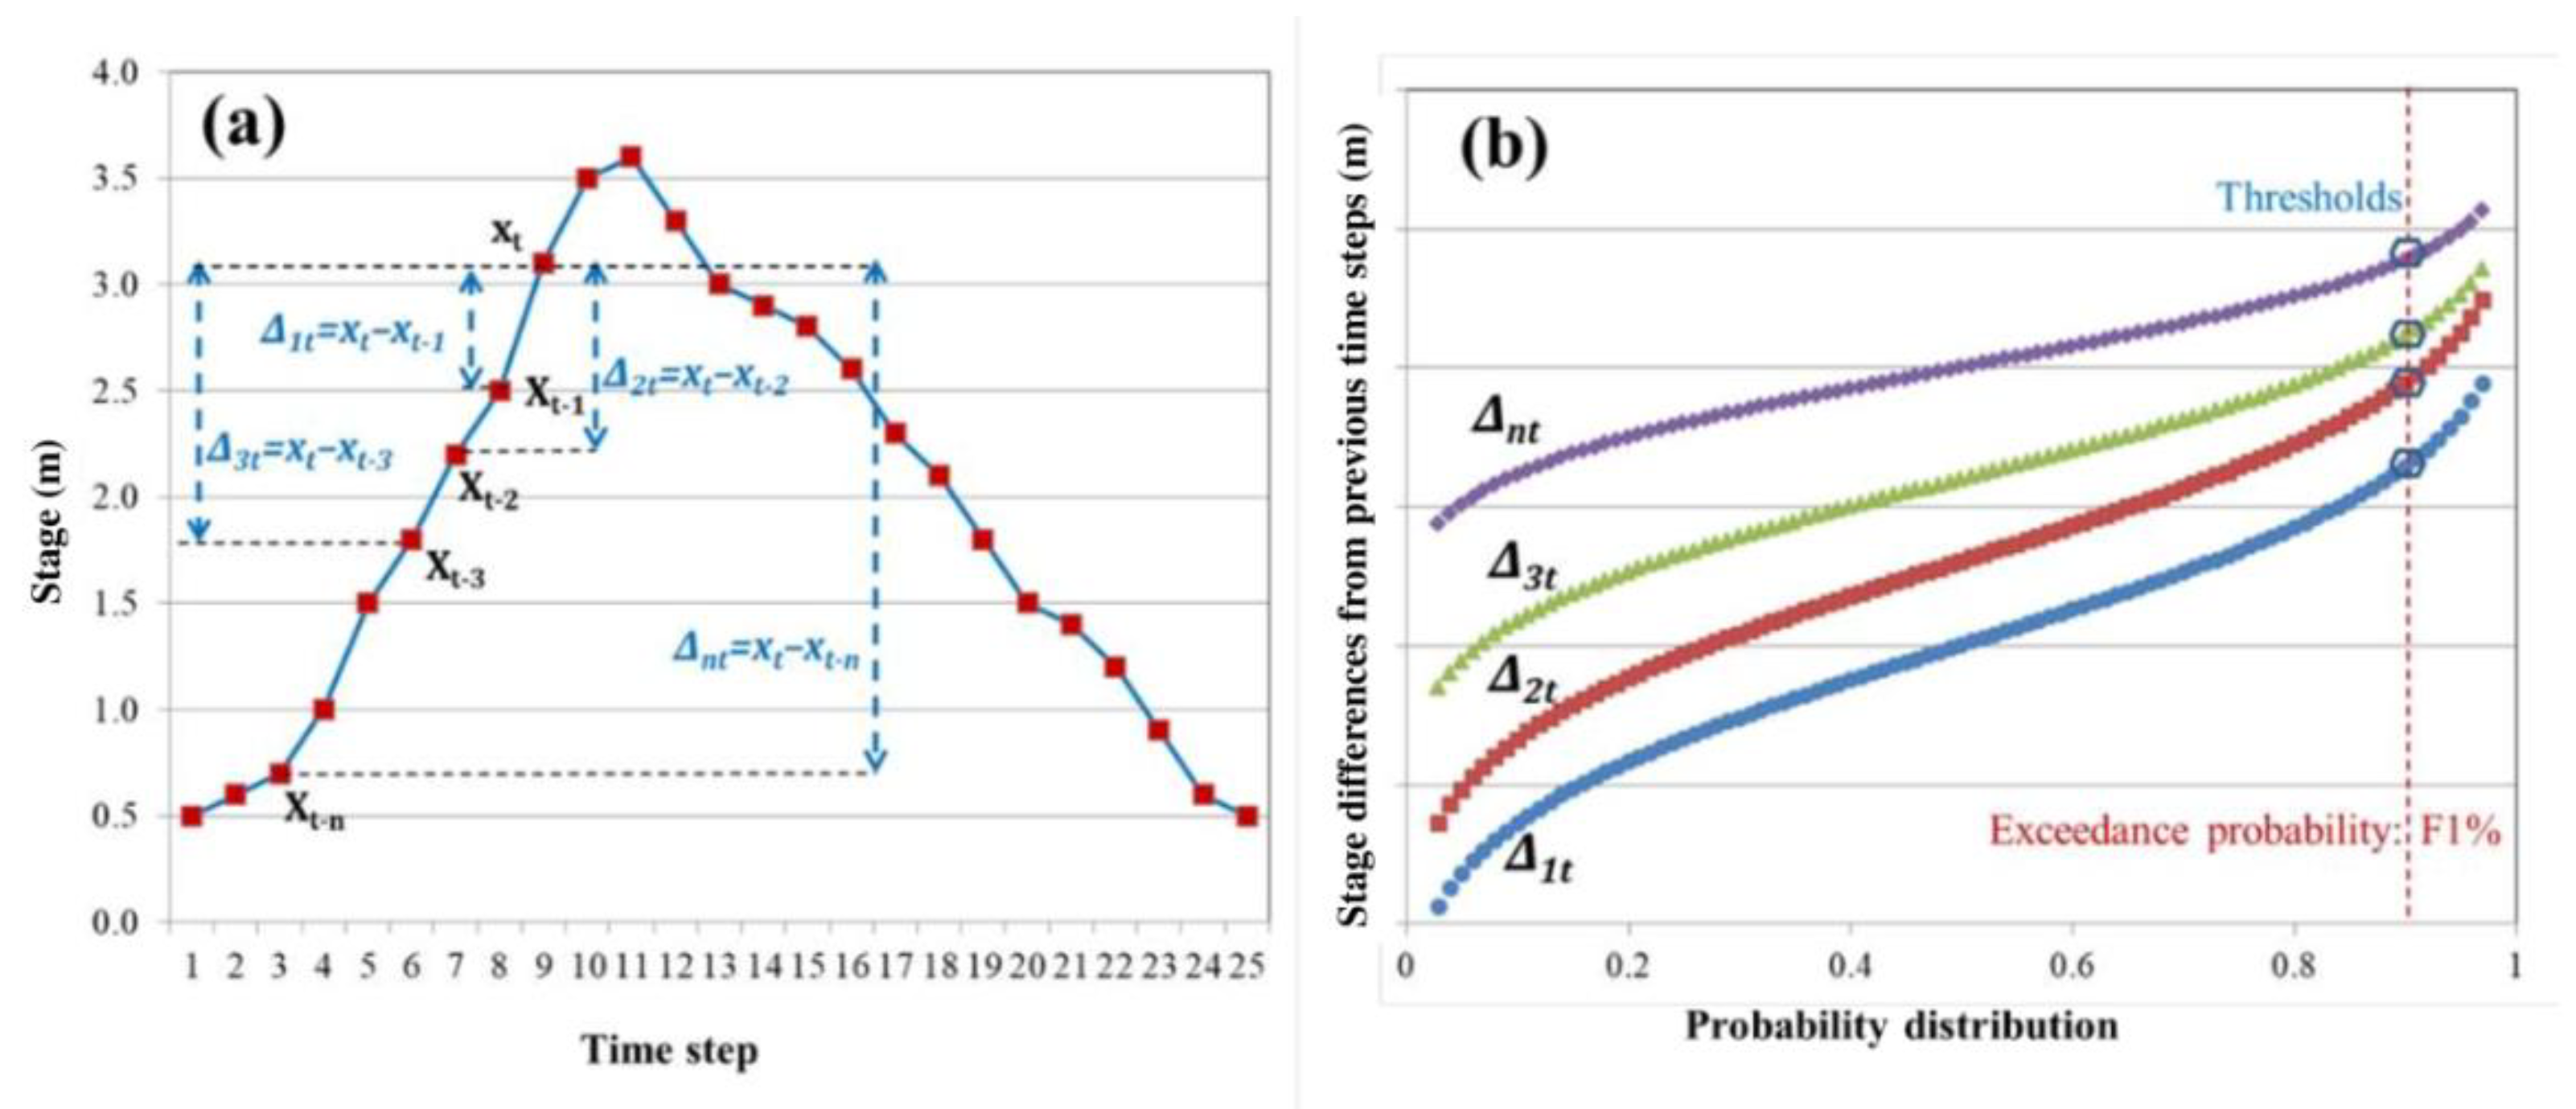
4.2.1. Surface Water Quantity

Proper site selection and installation of the hydrometric instruments, along with regular site inspection and sensor maintenance, are crucial for obtaining data of good quality. Inspections and maintenance of hydrometric stations may occur several times per year, as automated data collection is usually complemented by flow measuring campaigns; a minimum of two visits per year is required to check the condition of and re-map a stream cross-section—an influential factor for stage measurements.
The raw data of the sensors are offloaded to a server at 10 min intervals, treated for missing and/or duplicate records, quality checked, flagged, and subsequently uploaded on the Openhi.net DB. Our sensors measure stage by a remote sensing technique; therefore, they may be influenced by various interferences leading to faulty measurements. Telecommunication may also cause errors, as the stations may be located in remote areas with poor cellular network coverage.
The data are checked initially for physical plausibility according to the sensor specifications and the physical characteristics of the river cross-section (“range-test”). Then, the data are checked for abrupt changes compared to their respective moving averages over time-windows specifically selected for each basin typology, according to the experience gained from the Telefleur and Deucalion projects. No modifications are made to the raw data (except for negative stage values that are set to zero and missing values set to −99), to allow application of a different quality control scheme, if desired by the potential user. Instead, all values are quality-flagged, according to the four-digit scheme presented in Table 1, where each test affects a certain digit of the flag below; these flags should be considered as inseparable from a datum itself.
Tests based on signal quality are not applied to all data, since certain sensors do not provide such output. Air temperature and rainfall also undergo similar quality control procedures and are quality flagged.

4.2.2. Surface Water Quality

Ensuring good data quality of the automatic monitoring network of surface waters begins before the data are recorded, through proper station site survey, systematic site maintenance, and rigorous and regular sensor calibration. Using similar instruments and instrument configurations throughout the network also facilitates comparing data values from sensor to sensor objectively, allowing for efficient troubleshooting. Site visits at each station occur at least twice per year, when onsite measurements with a portable instrument are compared directly with a station’s measurements. Thus far, deviations of the latter from reference standards have been lowest for temperature and highest for dissolved oxygen, since temperature is measured by simple and stable sensors, recording accurately under any type of environment, while dissolved oxygen sensors are affected strongly by biofouling and suspended sediment deposition. From ~50 comparisons of in-situ measurements and station records in 2019 and 2020, the mean deviations for all variables indicated that the stations tended to underestimate slightly the true values. Mean deviations were negative for all sites, with the lowest (<1%) for temperature and the highest (20%) for dissolved oxygen. A seasonal analysis has also shown that the variability of percentage deviations for all variables among the four seasons did not differ considerably [13].
The raw time series data from the sensors are offloaded to a server at intervals ranging from 10 min to 1 h, and subsequently uploaded in the Openhi.net time series database. As raw data may include erroneous sensor readings due to various reasons, subsequent reliability checks are applied, yielding quality-checked derivative time series. Initially, algorithmic plausibility tests are applied to observations with pass/fail criteria based on allowable value ranges and variability, to detect possibly erroneous values. In a second stage, suspicious values are flagged and examined graphically to determine whether they represent extreme natural phenomena and should be kept in the data series without labels or are of poor quality and must remain flagged.
A range-based test verifies that an observation is within a predetermined range, i.e., that it falls within certain minimum and maximum values. Variability is examined by step and persistence tests. Step tests typically evaluate the change in magnitude between sequential observations and flag values as implausible if this change exceeds a preset maximum value or is lower than a preset minimum one. A persistence test assesses whether multiple consecutive observations vary minimally with time, indicating a possible technical problem. The quality control checks implemented in the water-quality monitoring network in rivers are summarized in Table 2 below.

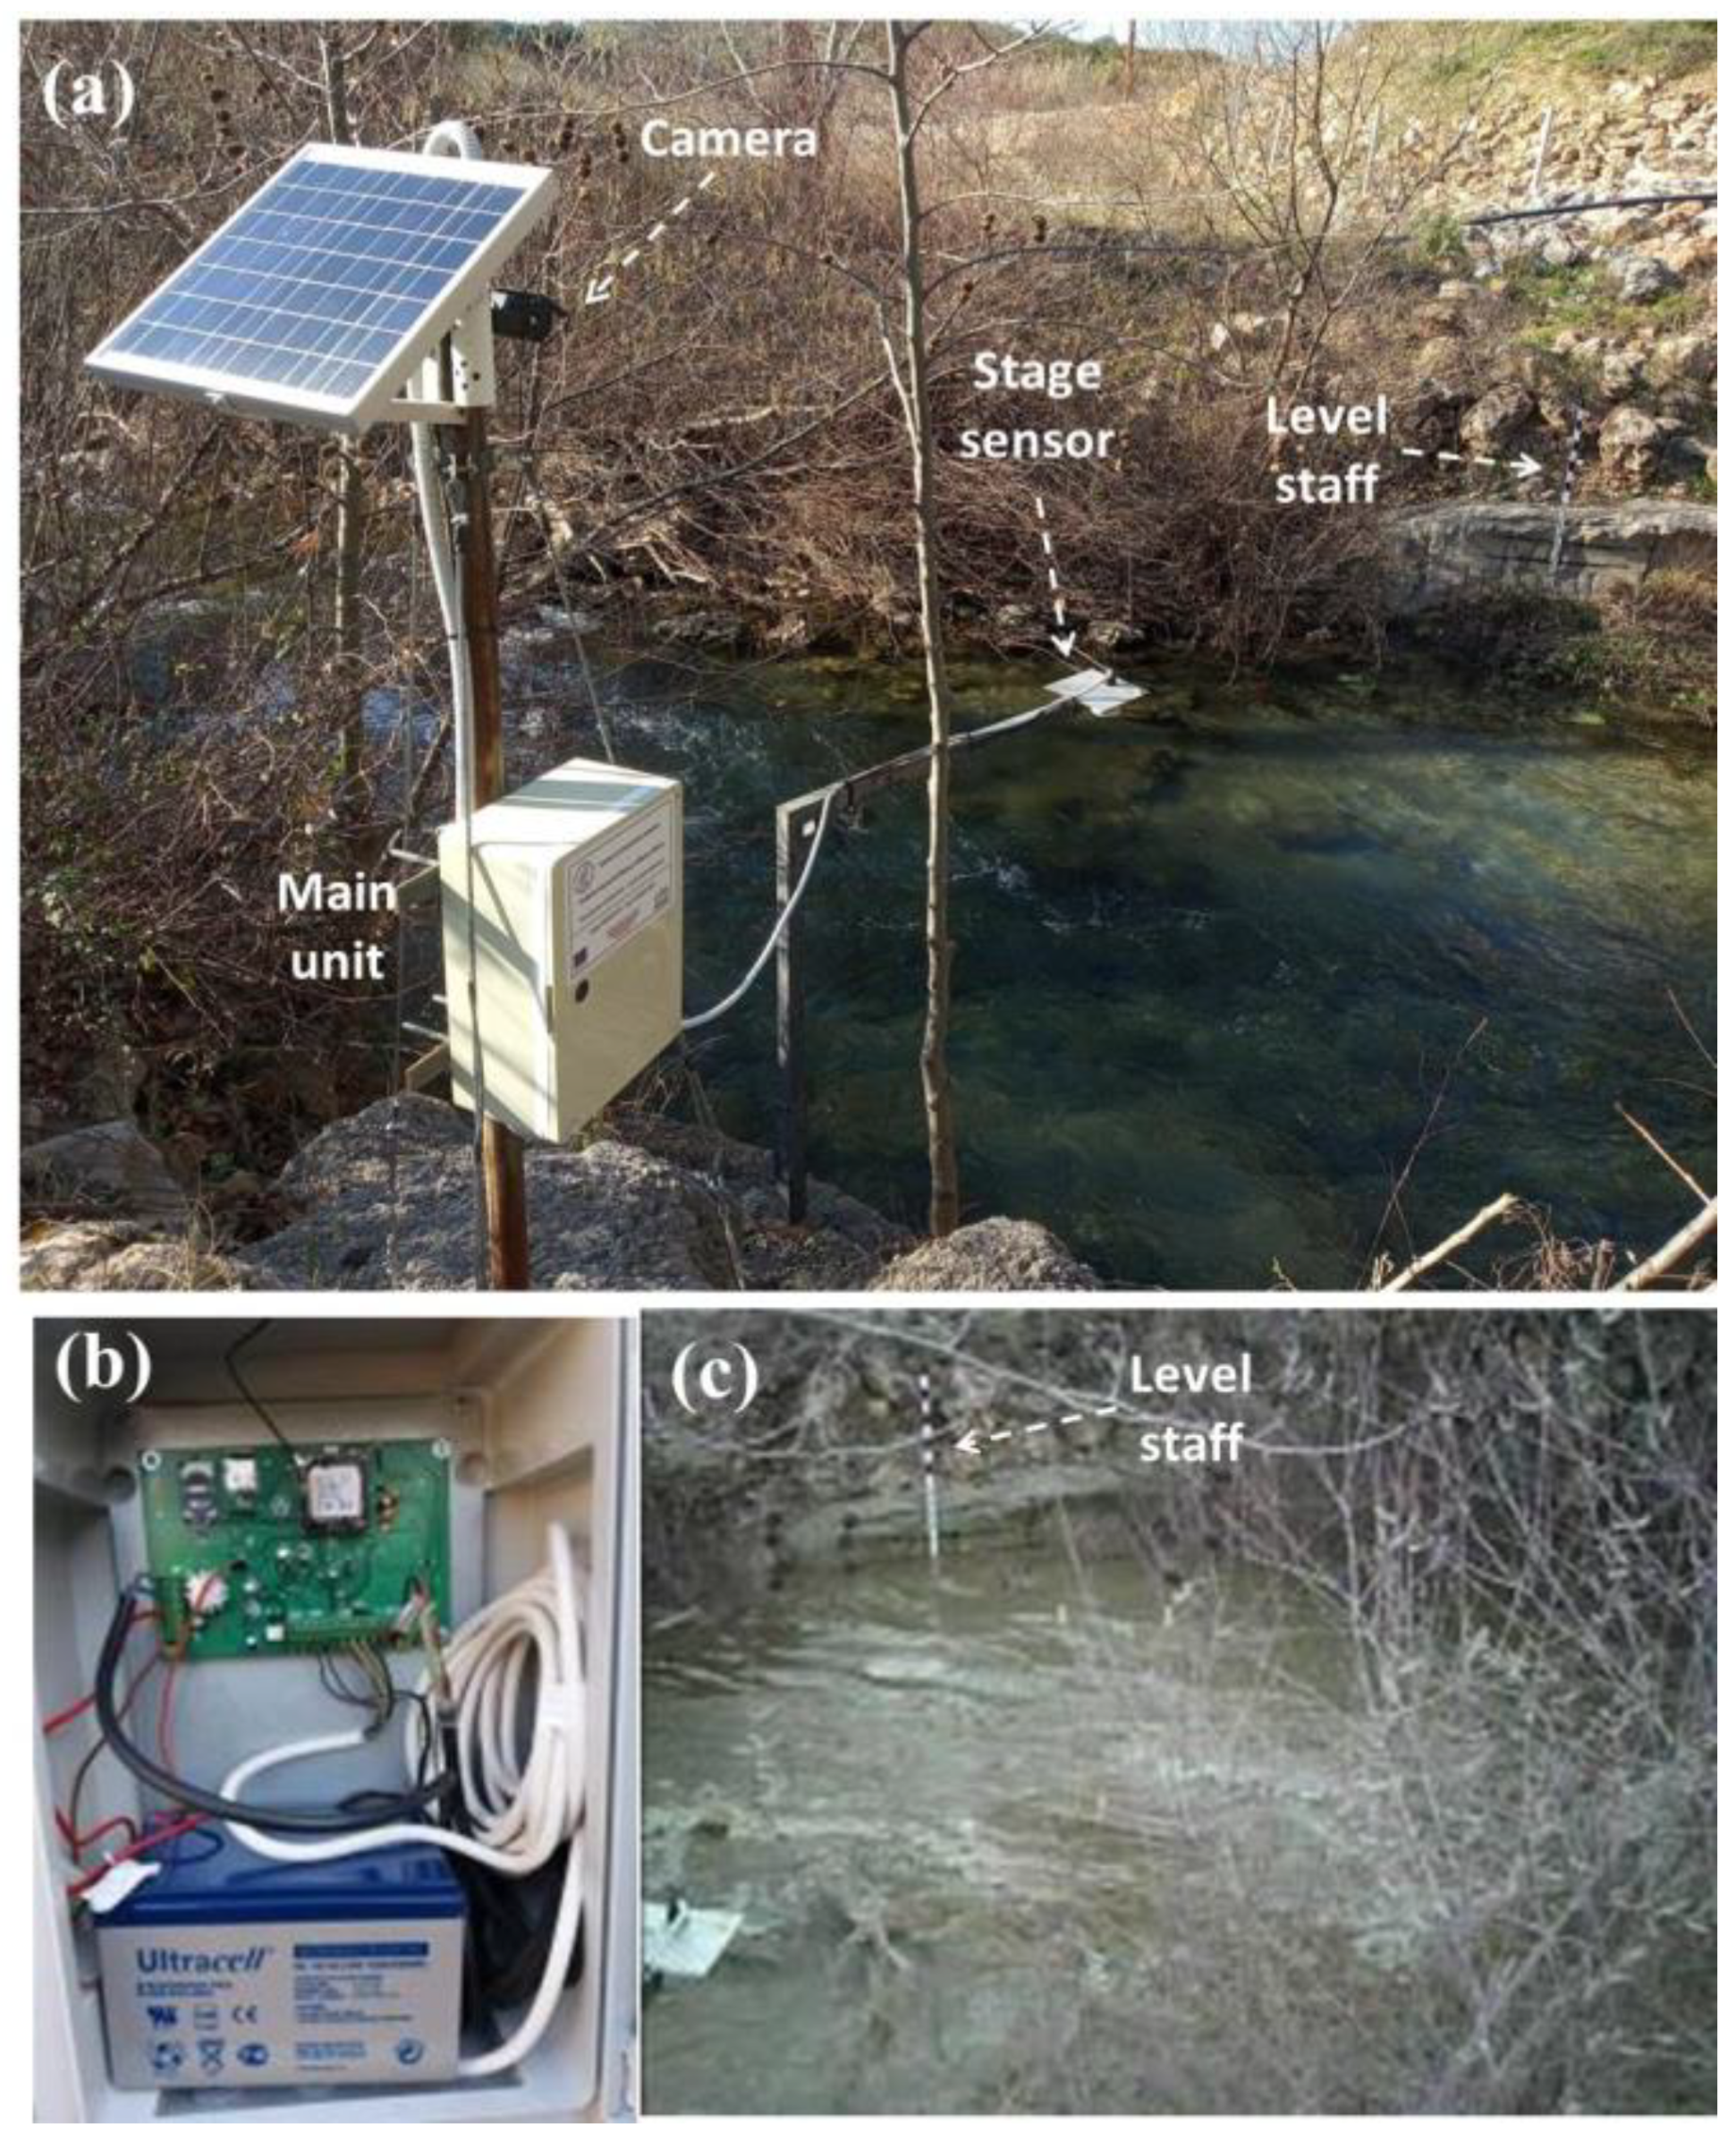
4.3. Development of an Inexpensive Hydro-Telemetric Station

To reduce expenditures for hydrometric equipment, a prototype hydro-telemetry system was designed and constructed. That system combines custom-built firmware and intelligent sensing technologies with telecommunication at low cost, about 50% of the price of a comparable commercial station. This prototype, Figure 9, is equipped with an ultrasonic sensor for measuring stage, an air thermometer, a GPRS modem, a camera and a data logger (it can also receive input from a rain gauge) and is powered by a solar panel; data and photos are transmitted to NOA’s server via mobile internet. The system’s additional advantages are flexibility in programming, low maintenance cost, and the ability to extend its capabilities with additional sensors (e.g., it is already compatible with water quality sensors and a video camera). Six stations have been produced and have been installed at stream-sites in Attica and in Evrotas, Laconia.
A typical station installation (Figure 9a) comprises the main unit, a water level ultrasound sensor (dbi6), a temperature sensor with thermistor (10 ΚΩ @ 25 °C), a VGA camera, a solar panel, an antenna, and a level staff serving as the scale for identifying the water level directly from the picture. Measurements and pictures are programmed to be taken every 10 min; the data are sent to NOA’s Hydronet server at the same time intervals. The main unit of the station is a board that includes a microcontroller, a GPRS modem with multiband antenna, a sim card, a memory card, serial communication ports, ports for connecting a rain gauge (not shown) and a temperature probe. The board is ready to accept inputs from additional sensors (if needed) such as a multi-parameter water quality sensor. The water-tight station box (Figure 9b) houses the main board, the rechargeable battery VRLA 12 V/12 Ah, cables and connection terminals. Figure 9c shows a picture of the river taken automatically by the station’s camera, also informing on the general conditions prevailing in the stream, e.g., regarding debris and vegetation, as well as on whether the water level is closer to the sensor than the minimum distance for valid measurement.

4.4. Discharge Estimation in Open Channels from Surface Velocity Measurements

The discharge through a cross-section of a stream is estimated indirectly for operational purposes, by converting observed stages h to flows Q via rating curves Q(h). Rating curves at monitoring stations are established, in principle, by measuring and integrating the velocity field over a cross-section of known bathymetry for a range of flows. However, there are practical issues involved. Point-sampling of the velocity field with a current meter is tedious and often dangerous (prohibitive in high flows). Conversely, an Acoustic Doppler Current Profiler (ADCP), which measures velocities based on the frequency shift of a transmitted signal scattered back to the transceiver from particles in the water, is too expensive for routine use in small streams that may be additionally difficult to access. Velocities can also be measured with a portable ADCP by wading in the stream, but the hydrographer is again exposed to risks at high flows.
The alternative of estimating the mean velocity V as a fraction fv of the surface velocity v surf, V = fv v surf, has thus gained attention, due to its safe and low-cost operations; image velocimetry [27] and hand-held radar allow conducting such observations safely and rapidly. Discharge estimation from surface velocities would be particularly useful in the study of small basins often encountered in many places along the northern rim of the Mediterranean, e.g., in parts of Greece or in Liguria region, Italy, where the steep terrain and short response times cause dangerous floods. However, applying the rule of thumb V = 0.86 v surf allows estimating the flow only roughly. By hydraulic reasoning, a constant fv is an approximation. The study of the variation of the fv-ratio ascertains that fv depends on the spread of the velocities about their mean, expressed by the momentum distribution factor β = E v 2 /V2 that relates to the coefficient of variation Cv = (standard deviation σ)/(mean μ = V) = (β − 1)1/2 [28]. The small range of fv (for 0 ≤ Cv ≤ 0.39, 1 ≤ β ≤ 1.15 in turbulent streamflows) contains the errors in estimating the flow rate; thus, a maximum-entropy based method was developed in which fv(β), with β estimated from the macro-geometry and the bed roughness (β is larger for rough, irregular and compact cross-sections and smaller for smooth, regular and wide cross-sections). Testing that method in two shallow streams (depth/width ≈ 1/15) in the Peloponnese, Greece, it was found capable of determining the discharge within ±5%; applying the rule of thumb V = 0.86vsurf in one of the streams resulted in a ~17% error. To further support a hydrographer’s judgement, we are currently studying the underpinnings of the fv-ratio hydromechanically (results to be reported in a future publication).

5. Conclusions

The federated approach of data acquisition and storage, with free-access provision, exemplified by the pilot Openhi.net demonstrated its feasibility; it also set a standard for data collection and management in Greece. This may motivate other surface-water telemetric monitoring networks operating independently in Greece to follow and ultimately become stakeholders in a national infrastructure. Through that infrastructure, a synergy among networks would provide effective management and dissemination of the information, but also efficient design of the future network.
The pilot operation of Openhi.net has confirmed that maintaining the monitoring networks is the main challenge and that using advanced technology entails high maintenance costs and access to trained staff and resources (opinion expressed by the hydrological community in a recent survey on hydrologic measurements and observations [2]. We dealt successfully with the second challenge by designing, developing, constructing and deploying a custom, low-cost, telemetric stream-stage monitoring station (at about 50% of the cost of a commercial-equivalent).
The OpenHi.net platform permits the incorporation of geographic information to the study of the environmental processes. Access to processed geographical data supports the retrieved hydrological measurements, in order to describe the tempo-spatial behavior of variables. The geographical data set that was created at the national level includes “standardized” hypsometric and hydrographic information for water basins of Greece. Emphasis was given to the development of a reliable elevation model and a river layer with nodes that includes network connectivity. Exploiting the developed infrastructure, users can supplement hydrological time series with relevant water basin characteristics that are essential for environmental applications.
The variety of environmental variables, the amount of data included in the system and the architecture of the platform triggered scientific research in specific issues. Research results were incorporated in specific applications that assist environmental data manipulation and management. The pilot use of features such as data quality control, notification system and discharge estimation module verified their feasibility in water resources management platforms.

Author Contributions

Designer of paper structure, A.D.K.; writing and editing, A.D.K. and N.M. (Nikos Mamassis); with contributions from K.M., D.K. (Demetris Koutsoyiannis), E.D., N.M. (Nikolaos Malamos), I.P. and S.L.; Developed parts of the system and reviewed the manuscript, A.K., I.T., A.P., Y.P., A.C., A.E., G.V., D.K. (Dimitrios Katsanos), N.K., B.P., E.R., T.K., I.K. and D.K. (Demetris Kalogeras). All authors have read and agreed to the published version of the manuscript.

Funding

This research was funded by the Open Hydrosystem Information Network (OpenHi.net) research project, which received funding from the Special Secretary of Operational Programme “Competitiveness, entrepreneurship and innovation”.

Institutional Review Board Statement

Not applicable.

Informed Consent Statement

Not applicable.

Data Availability Statement

The data presented in this study are openly available in https://openhi.net/.

Conflicts of Interest

The authors declare no conflict of interest.

Abbreviations

AbbreviationDefinition
ADCPAcoustic Doppler Current Profiler
DBData Base
DEMDigital Elevation Model
DWREEDepartment of Water Resources and Environmental Engineering
FAOFood and Agriculture Organization
GIS Geographical Information System
GPRS modemGeneral Packet Radio Service modem
GSMGlobal System for Mobile Communications
HCMRHellenic Centre for Marine Research
ICCSInstitute of Communication & Computer Systems
NOANational Observatory of Athens
NTUANational Technical University of Athens
Openhi.netOpen Hydrosystem Information Network
QGISQuantum Geographical Information System
UnIoUniversity of Ioannina
VGA cameraVideo Graphics Array camera
VRLAValve Regulated Lead Acid
WMOWorld Meteorological Organization

References

  1. Pecora, S.; Lins, H.F. E-monitoring the nature of water. Hydrol. Sci. J. 2020, 65, 683–698. [Google Scholar] [CrossRef]
  2. Tauro, F.; Selker, J.; van de Giesen, N.; Abrate, T.; Uijlenhoet, R.; Porfiri, M.; Manfreda, S.; Caylor, K.; Moramarco, T.; Benveniste, J. Measurements and Observations in the XXI century (MOXXI): Innovation and multidisciplinarity to sense the hydrological cycle. Hydrol. Sci. J. 2018, 63, 169–196. [Google Scholar] [CrossRef] [Green Version]
  3. Cressey, D. Age of the Arduino. Nature 2017, 544, 125–126. [Google Scholar] [CrossRef] [PubMed]
  4. Koutsoyiannis, D.; Tsakalias, G.; Christofides, A.; Manetas, A.; Sakellariou, A.; Mavrodimou, R.; Papakostas, N.; Mamassis, N.; Nalbantis, I.; Xanthopoulos, T. HYDROSCOPE: Creation of a National Data Bank of Hydrological and Meteorological Information, Research and Technology Days ’95, NTUA; National Technical University of Athens: Athens, Greece, 1995; Available online: http://www.itia.ntua.gr/94/ (accessed on 15 July 2021).
  5. Mamassis, N.; Tiligadas, E.; Koutsoyiannis, D.; Salahoris, M.; Karavokiros, G.; Mihas, S.; Noutsopoulos, K.; Christofides, A.; Kozanis, S.; Efstratiadis, A. HYDROSCOPE: National Databank for Hydrological, Meteorological and Geographical Information, Towards a Rational Handling of Current Water Resource Problems: Utilizing Data and Informatics for Information, Hilton Hotel, Athens. 2010. Available online: http://www.itia.ntua.gr/968/ (accessed on 15 July 2021).
  6. Efstratiadis, A.; Mamassis, N.; Koukouvinos, A.; Koutsoyiannis, D.; Mazi, K.; Koussis, A.D.; Lykoudis, S.; Demetriou, E.; Malamos, N.; Christofides, A. Open hydrosystem information network: Greece’s new research infrastructure for water. In Proceedings of the European Geosciences Union General Assembly, Vienna, Austria, 3–8 May 2020; Geophysical Research Abstracts: Göttingen, Germany, 2020; Volume 22, p. EGU2020-4164. [Google Scholar] [CrossRef]
  7. O’Reilly, T. What Is Web 2.0: Design Patterns and Business Models for the Next Generation of Software. Intern. J. Digit. Econ. 2007, 65, 17–37. Available online: https://mpra.ub.uni-muenchen.de/4580/ (accessed on 12 September 2021).
  8. Ning, W.; Liming, L.; Yanzhang, W.; Wang, Y.; Jing, W. Research on the Web Information System Development Platform Based on MVC Design Pattern. In Proceedings of the IEEE/WIC/ACM Web Intelligence and Intelligent Agent Technology, Sydney, NSW, Australia, 9–12 December 2008; pp. 203–206. [Google Scholar] [CrossRef]
  9. INSPIRE Thematic Working Group Hydrography. Data Specification on Hydrography—Technical Guidelines, Guidance document. 2014. Available online: https://inspire.ec.europa.eu/id/document/tg/hy (accessed on 17 June 2021).
  10. Savvidou, E.; Efstratiadis, A.; Koussis, A.D.; Koukouvinos, A.; Skarlatos, D. The curve number concept as a driver for delineating hydrological response units. Water 2018, 10, 194. [Google Scholar] [CrossRef] [Green Version]
  11. Mentzafou, A.; Panagopoulos, Y.; Dimitriou, E. Designing the National Network for Automatic Monitoring of Water Quality Parameters in Greece. Water 2019, 11, 1310. [Google Scholar] [CrossRef] [Green Version]
  12. In-Situ Inc. In-Situ Aqua TROLL 400 Multiparameter Probe Spec Sheet. January 2020. Available online: https://in-situ.com/ (accessed on 1 November 2020).
  13. Panagopoulos, Y.; Konstantinidou, A.; Lazogiannis, K.; Papadopoulos, A.; Dimitriou, E. A New Automatic Monitoring Network of Surface Waters in Greece: Preliminary Data Quality Checks and Visualization. Hydrology 2021, 8, 33. [Google Scholar] [CrossRef]
  14. Wagner, R.J.; Boulger, R.W., Jr.; Oblinger, C.J.; Smith, B.A. Guidelines and standard procedures for continuous water-quality monitors-Station operation, record computation and data reporting: U.S. Geological Survey. Tech. Methods 2006, 51, 1-D3. [Google Scholar] [CrossRef]
  15. Patil, P.N.; Sawant, D.V.; Deshmukh, R.N. Physico-chemical parameters for testing of water—A review. Int. J. Environ. Sci. 2012, 3, 1194–1207. [Google Scholar]
  16. WHO. World Health Organization Guidelines for Drinking-Water Quality, Incorporating the First Addendum, Licence: CC BY-NC-SA 3.0 IGO, 4th ed.; WHO: Geneva, Switzerland, 2017. [Google Scholar]
  17. Christensen, V.G.; Rasmussen, P.P.; Ziegler, A.C. Real-time water quality monitoring and regression analysis to estimate nutrient and bacteria concentrations in Kansas streams. Water Sci. Technol. 2002, 45, 205–219. [Google Scholar] [CrossRef] [PubMed]
  18. Mazi, K.; Koussis, A.D.; Lykoudis, S.; Vitantzakis, G.; Dimitriadis, P.; Kappos, N.; Psiloglou, B.; Katsanos, D.; Koletsis, I.; Rozos, E.; et al. HYDRO-NET: Hydro-telemetric Network for surface waters—Innovations and Prospects. In Proceedings of the 23rd EGU General Assembly, online. 19–30 April 2021; p. EGU21-14956. [Google Scholar] [CrossRef]
  19. Koussis, A.D.; Lagouvardos, K.; Mazi, K.; Kotroni, V.; Sitzmann, D.; Lang, J.; Zaiss, H.; Buzzi, A.; Malguzzi, P. Flood forecasts for an urban basin with integrated hydro-meteorological model. J. Hydrol. Eng. 2003, 8, 1–11. [Google Scholar] [CrossRef]
  20. Mazi, K.; Koussis, A.D. The July 8, 2002 storm over Athens: Analysis of the Kifissos River/Canal overflows. Adv. Geosci. 2006, 7, 301–306. [Google Scholar] [CrossRef] [Green Version]
  21. Malamos, N.; Tsirogiannis, I.L.; Christofides, A. Modelling irrigation management services: The IRMA_SYS case. Int. J. Sustain. Agric. Manag. Inform. 2016, 2, 1–18. [Google Scholar] [CrossRef] [Green Version]
  22. Allen, R.G.; Pereira, L.S.; Raes, D.; Smith, M. Crop Evapotranspiration-Guidelines for Computing Crop Water Requirements-FAO Irrigation and Drainage Paper 56; FAO: Rome, Italy, 1998; Volume 300, p. D05109. [Google Scholar]
  23. Fotia, K.; Mehmeti, A.; Tsirogiannis, I.; Nanos, G.; Mamolos, A.P.; Malamos, N.; Barouchas, P.; Todorovic, M. LCA-Based Environmental Performance of Olive Cultivation in Northwestern Greece: From Rainfed to Irrigated through Conventional and Smart Crop Management Practices. Water 2021, 13, 1954. [Google Scholar] [CrossRef]
  24. Malamos, N.; Tsirogiannis, I.L.; Tegos, A.; Efstratiadis, A.; Koutsoyiannis, D. Spatial interpolation of potential evapotranspiration for precision irrigation purposes. Eur. Water 2017, 59, 303–309. [Google Scholar]
  25. Alfieri, L.; Salamon, P.; Pappenberger, F.; Wetterhall, F.; Thielen, J. Operational early warning systems for water-related hazards in Europe. Environ. Sci. Policy 2012, 21, 35–49. [Google Scholar] [CrossRef]
  26. Gullick, R.W.; Gaffney, L.J.; Crockett, C.S.; Schulte, J.; Gavin, A.J. Developing Regional Early Warning Systems for US Source Waters. J. Am. Water Works Assoc. 2004, 96, 68–82. [Google Scholar] [CrossRef]
  27. Rozos, E.; Dimitriadis, P.; Mazi, K.; Lykoudis, S.; Koussis, A. On the Uncertainty of the Image Velocimetry Method Parameters. Hydrology 2020, 7, 65. [Google Scholar] [CrossRef]
  28. Koussis, A.D.; Dimitriadis, P.; Lykoudis, S.; Kappos, N.; Katsanos, D.; Koletsis, I.; Psiloglou, B.; Rozos, E.; Mazi, K. Discharge estimation from surface-velocity observations by a maximum-entropy based method. (revised manuscript under review, Hydrological Sciences Journal).
Figure 1. (a) Dynamic map for real-time observations. (b) Application for retrieval of raw and processed data.
Water 13 02779 g001
Figure 2. Application for geographical data handling.
Water 13 02779 g002
Figure 3. Typical Model–View–Controller development pattern for web applications (adapted from [8].
Water 13 02779 g003
Figure 4. (a) Physical representation of elements; (b) database and relations for the hydro network model (adapted from [9]).
Water 13 02779 g004
Figure 5. The OpenHiGis toolbox with the (a) list of containing models; (b) watercourse topology model of OpenHi.tbx.
Water 13 02779 g005
Figure 6. (a) Rivers, lakes and water districts of Greece, (b) pilot networks of NOA, HCMR, and UnIo.
Water 13 02779 g006
Figure 7. Examination of time evolution of river stage: (a) calculation of the differences of the current value from previous values and (b) definition of thresholds.
Water 13 02779 g007
Figure 8. Space–time evolution of Pinios river stage.
Water 13 02779 g008
Figure 9. (a) Station equipped with main unit, ultrasound stage sensor, air temperature probe, solar panel, VGA camera, antenna and conventional level staff, (b) box containing the station’s main unit, (c) shot taken automatically by the VGA camera.
Water 13 02779 g009
Table 1. Quality tests applied on the stage data recorded by NOA’s automatic stations.
ProblemReliability CheckType of DataDefinitionQuality Flag
1234Status
stage unrecognized by the dataloggerMissing code testmissing valuestage = −6999−9999NA *
obstacle interferenceRange testnegative value (not missing)−6999 < stage < 01 A **
maximum stage exceededRange testextreme valuesStage < maxStage2 A
none normal valuesAll other cases0 A
missing signal qualityMissing code testmissing valueSignal = −6999 9 NA
too low or too high signal qualityRange testextreme valuesSignal <= 0
signal >= 300
1
3
NA
noneRange testoptimal signal quality
acceptable signal quality
152 <= signal <= 210
210 <= signal <= 300
0
7
A
too low or too high signal qualityno testunacceptable values2nd Flag digit = 1 or 3 8 NA
Less than 18 data pointsno testnormal values 7 A
abrupt changeMoving average testnormal valuesΔstage *** > maxΔstage 1 W ****
noneMoving average testnormal valuesΔstage *** <= maxΔstage 0 A
NA *: not acceptable; A **: acceptable; Δstage ***: stage—stage3h_MovingAverage; W ****: acceptable with warning.
Table 2. Quality tests applied to the data recorded by the HCMR automatic stations.
ProblemReliability CheckType of DataDefinition
empty record
multiple empty records
Null test
Gap test
missing data or long period with missing dataleave empty records
implausible valuesRange testextreme valuesmin-max preset limits
extreme values
(within plausible range of observation)
Extreme value testextreme values2.5% smallest & 2.5% largest observations
extreme differences of values (within plausible range of observations)Extreme difference testdifferences (absolute) of consecutive pairs of values2.5% smallest & 2.5% largest consecutive absolute differences of the observations
persistent values
(within plausible range of observations)
Stuck value testconsecutive differences (absolute) of two consecutive valuesZero-change of the last 48 1-h or 96 (half-hour) recorded values
Publisher’s Note: MDPI stays neutral with regard to jurisdictional claims in published maps and institutional affiliations.

