
Streamflow Changes of Small and Large Rivers in the Aldan River Basin, Eastern Siberia


Abstract
:1. Introduction
2. Study Object, Materials and Methods
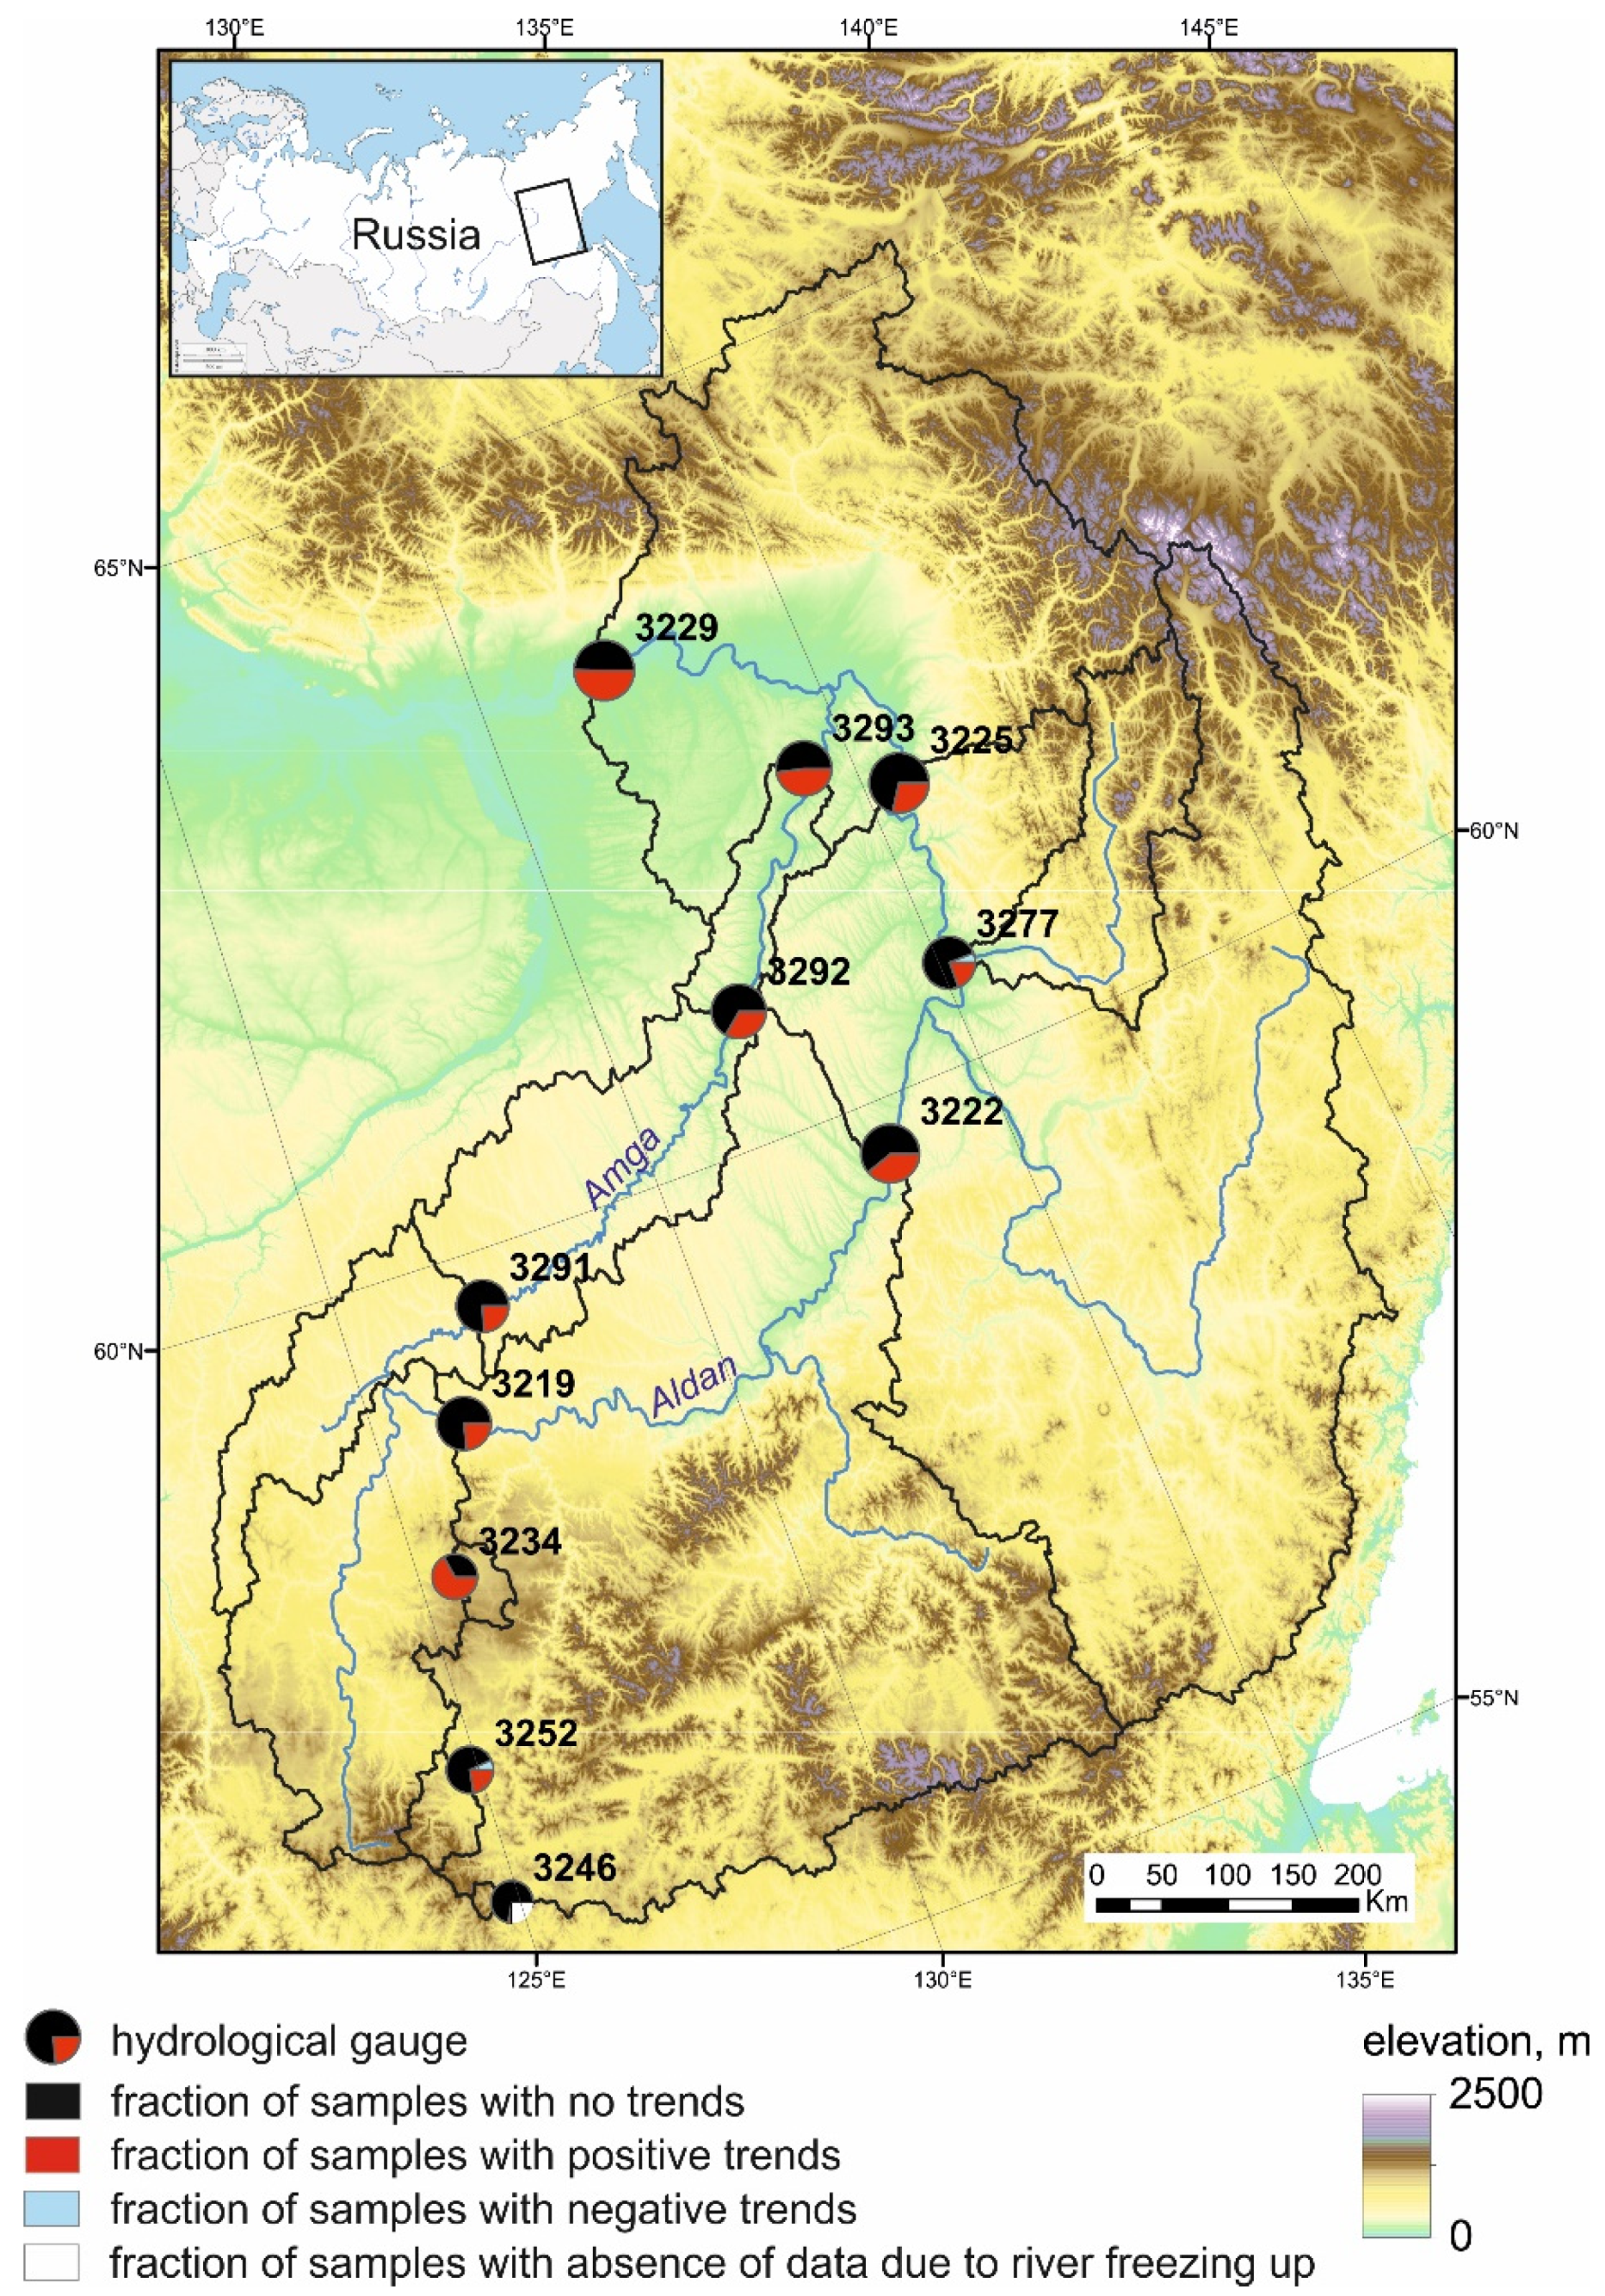
2.1. Study Area
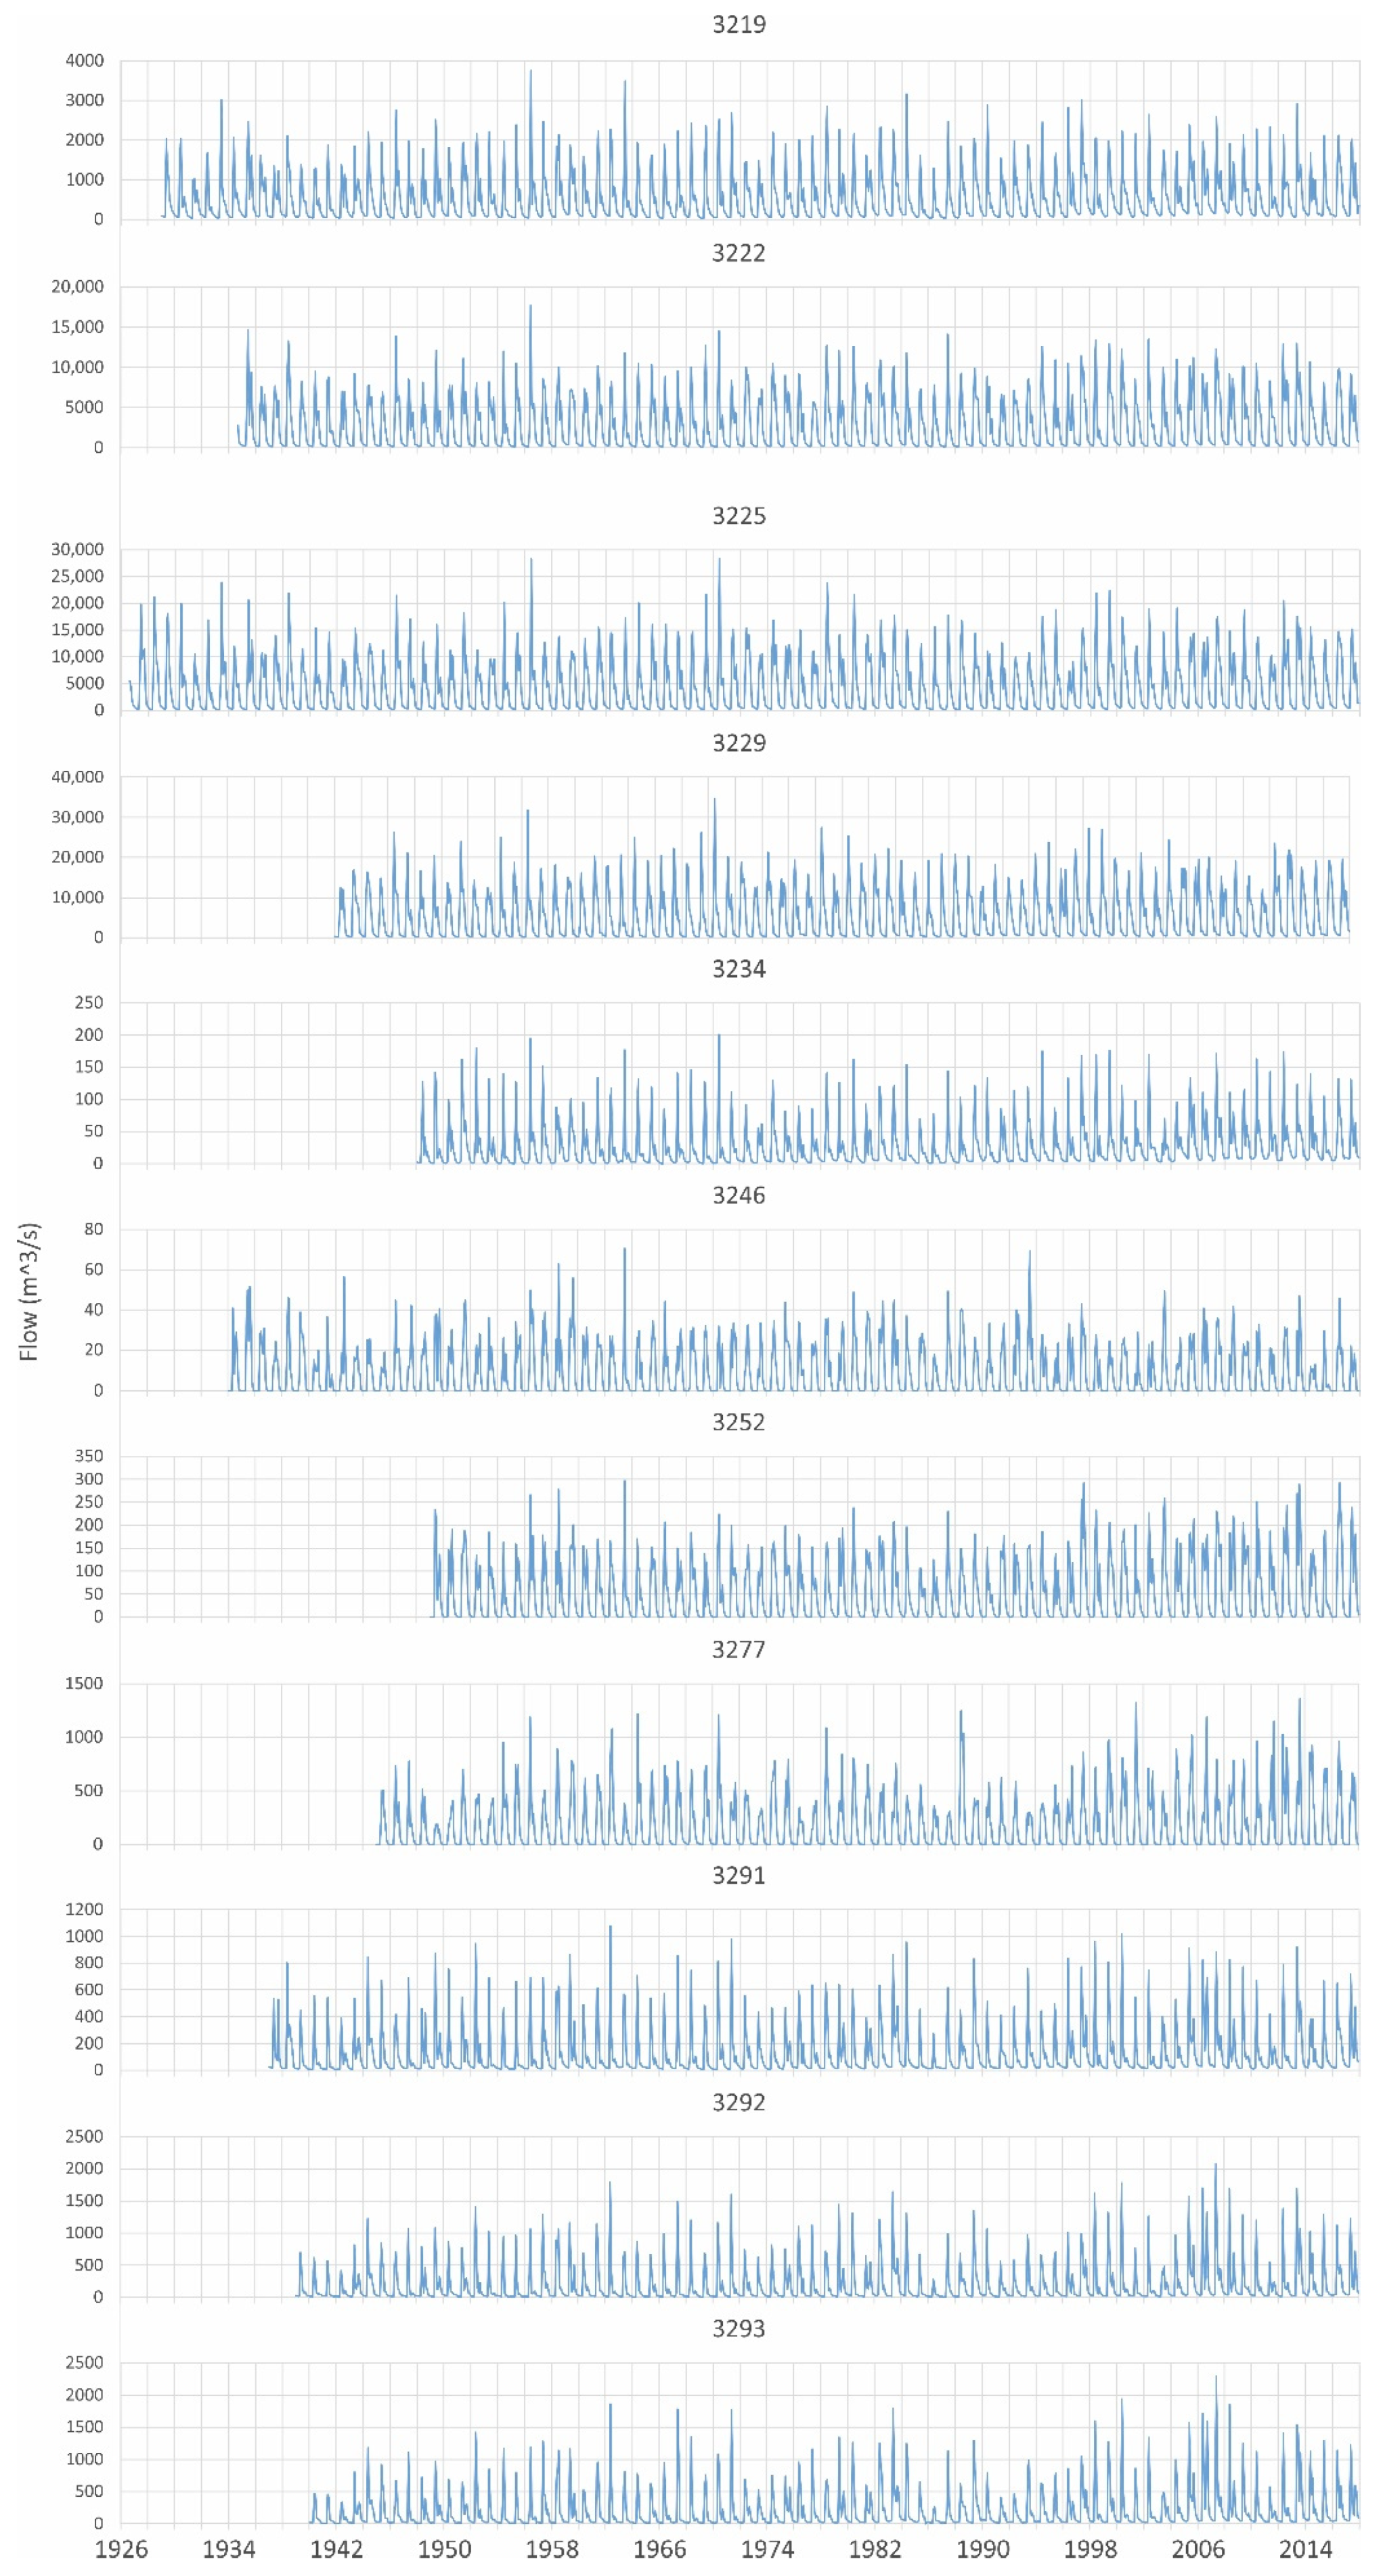
2.2. Datasets
2.3. Methods
3. Results
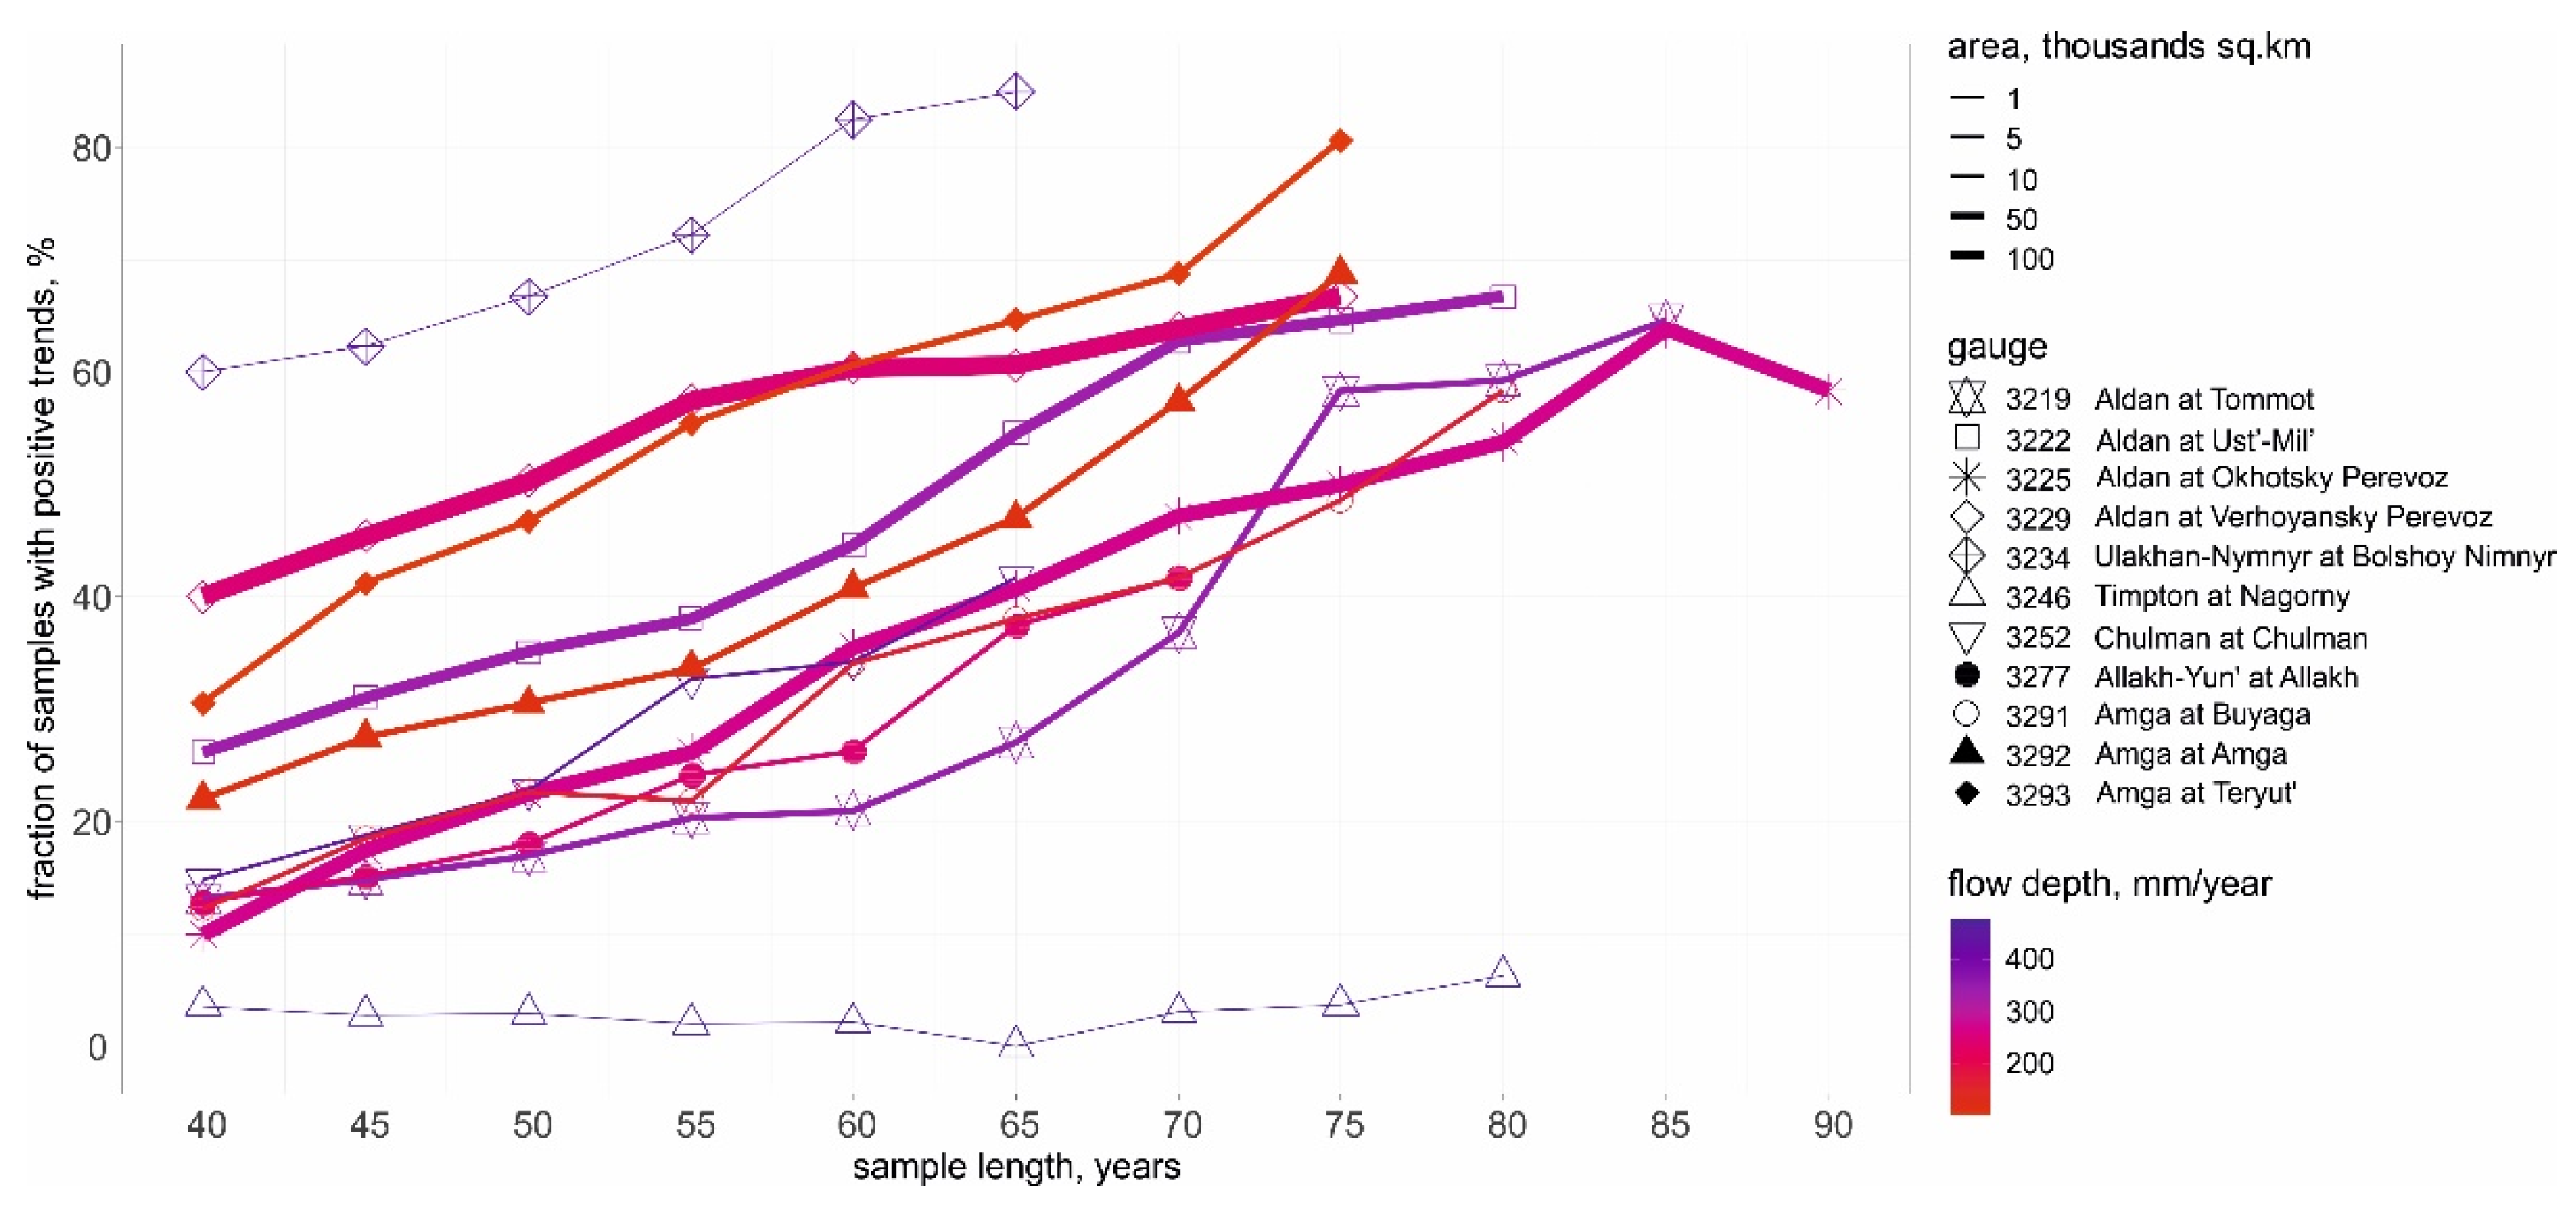
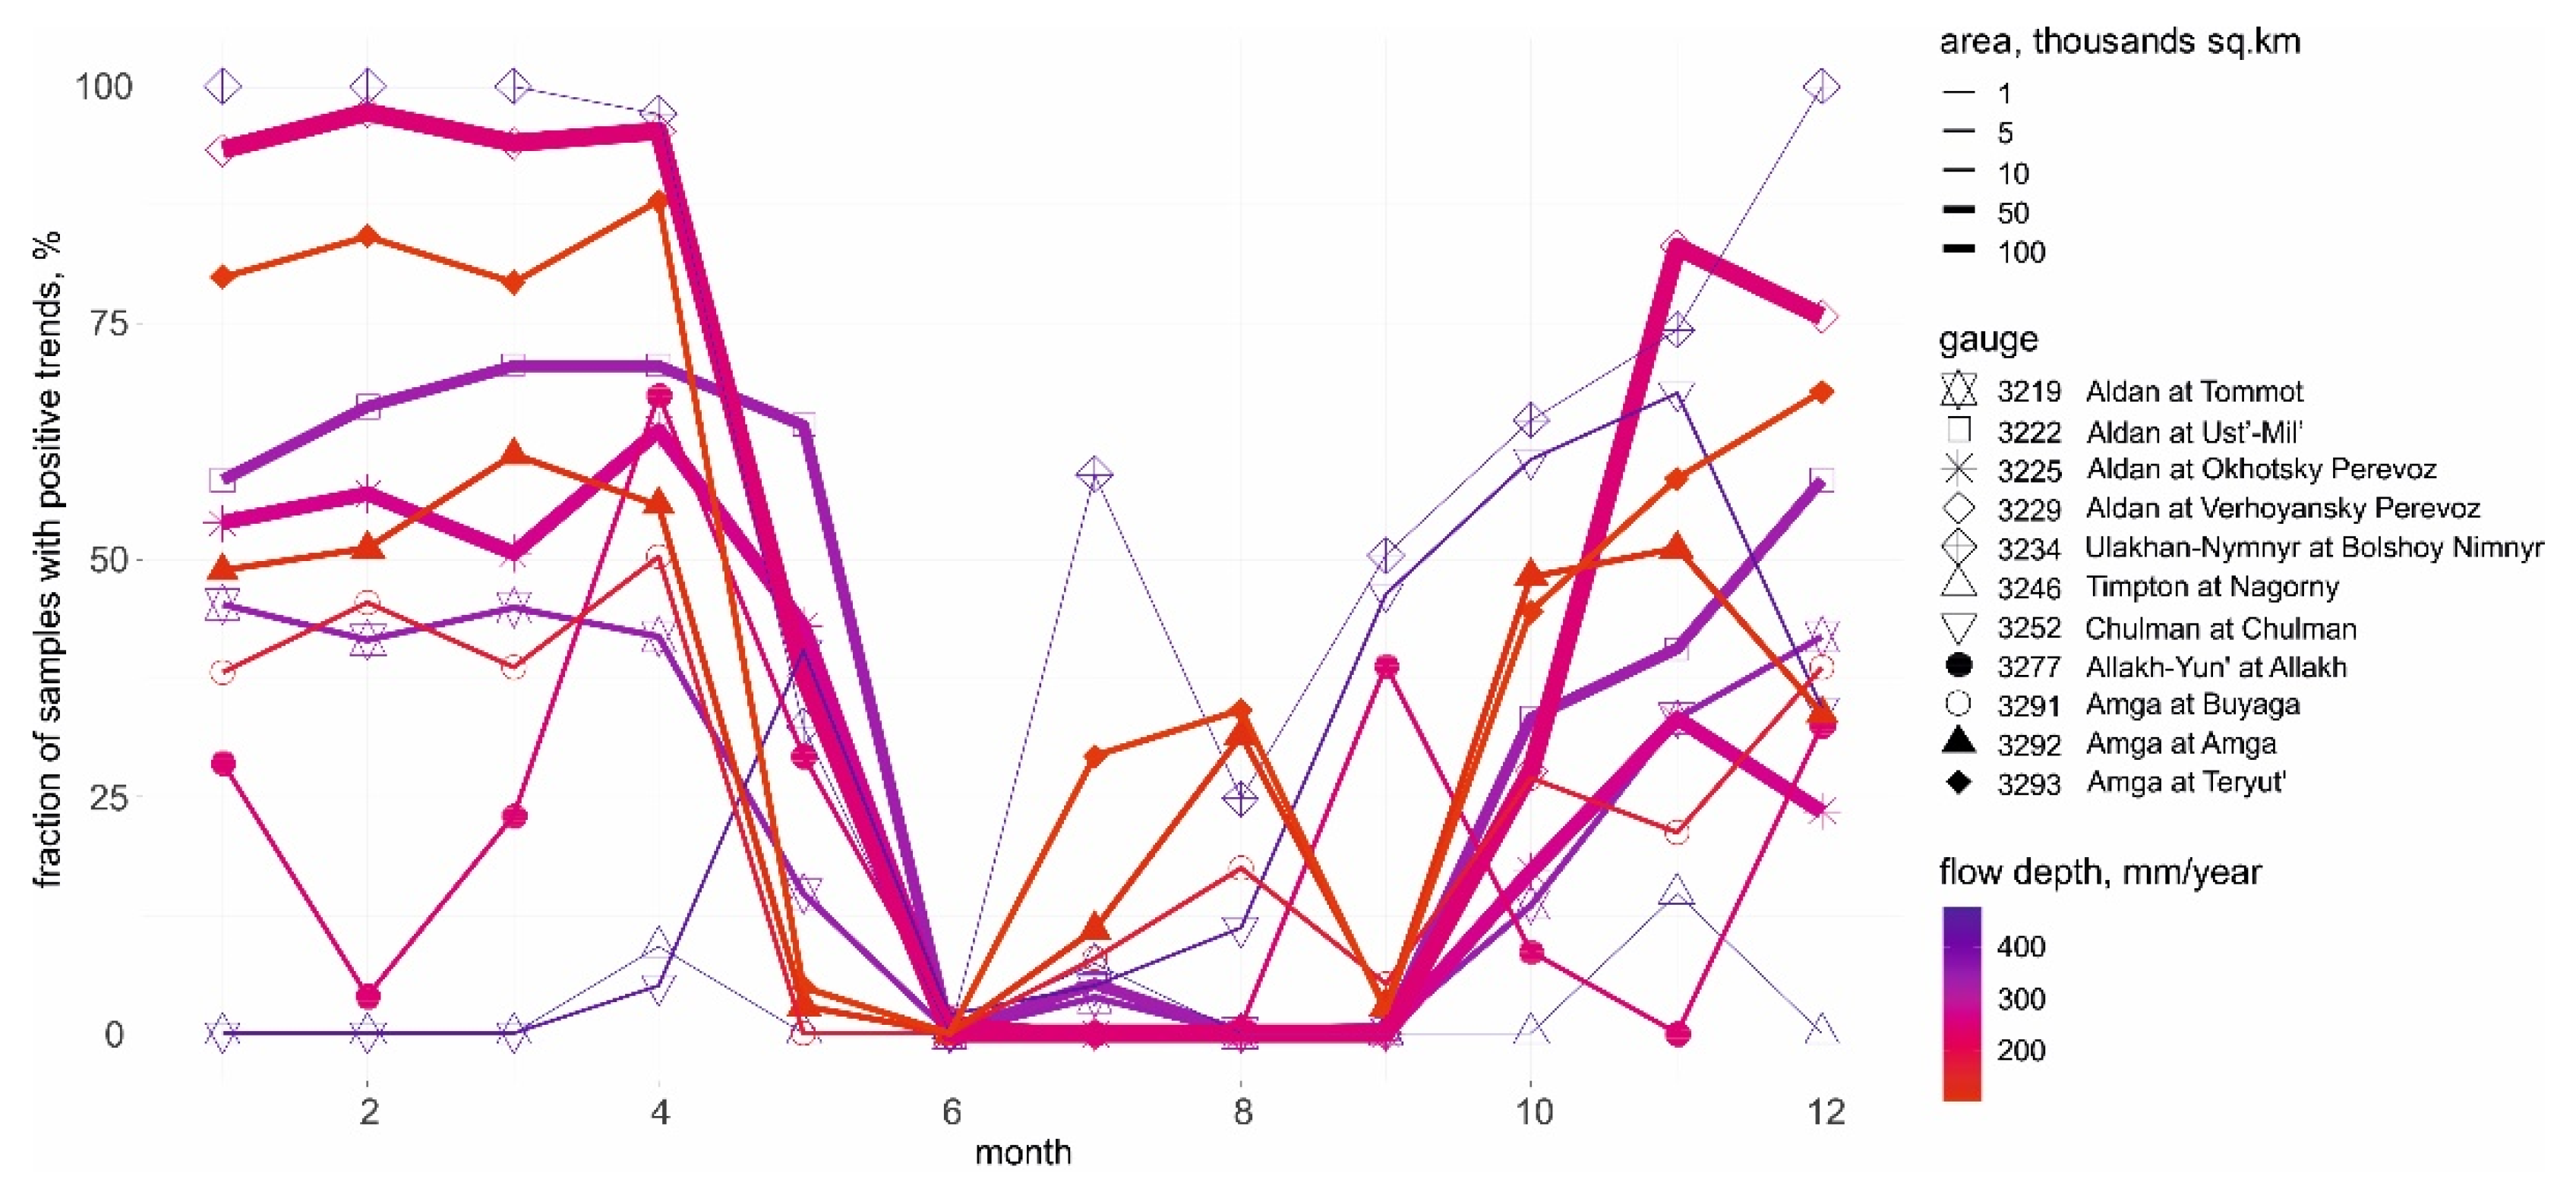
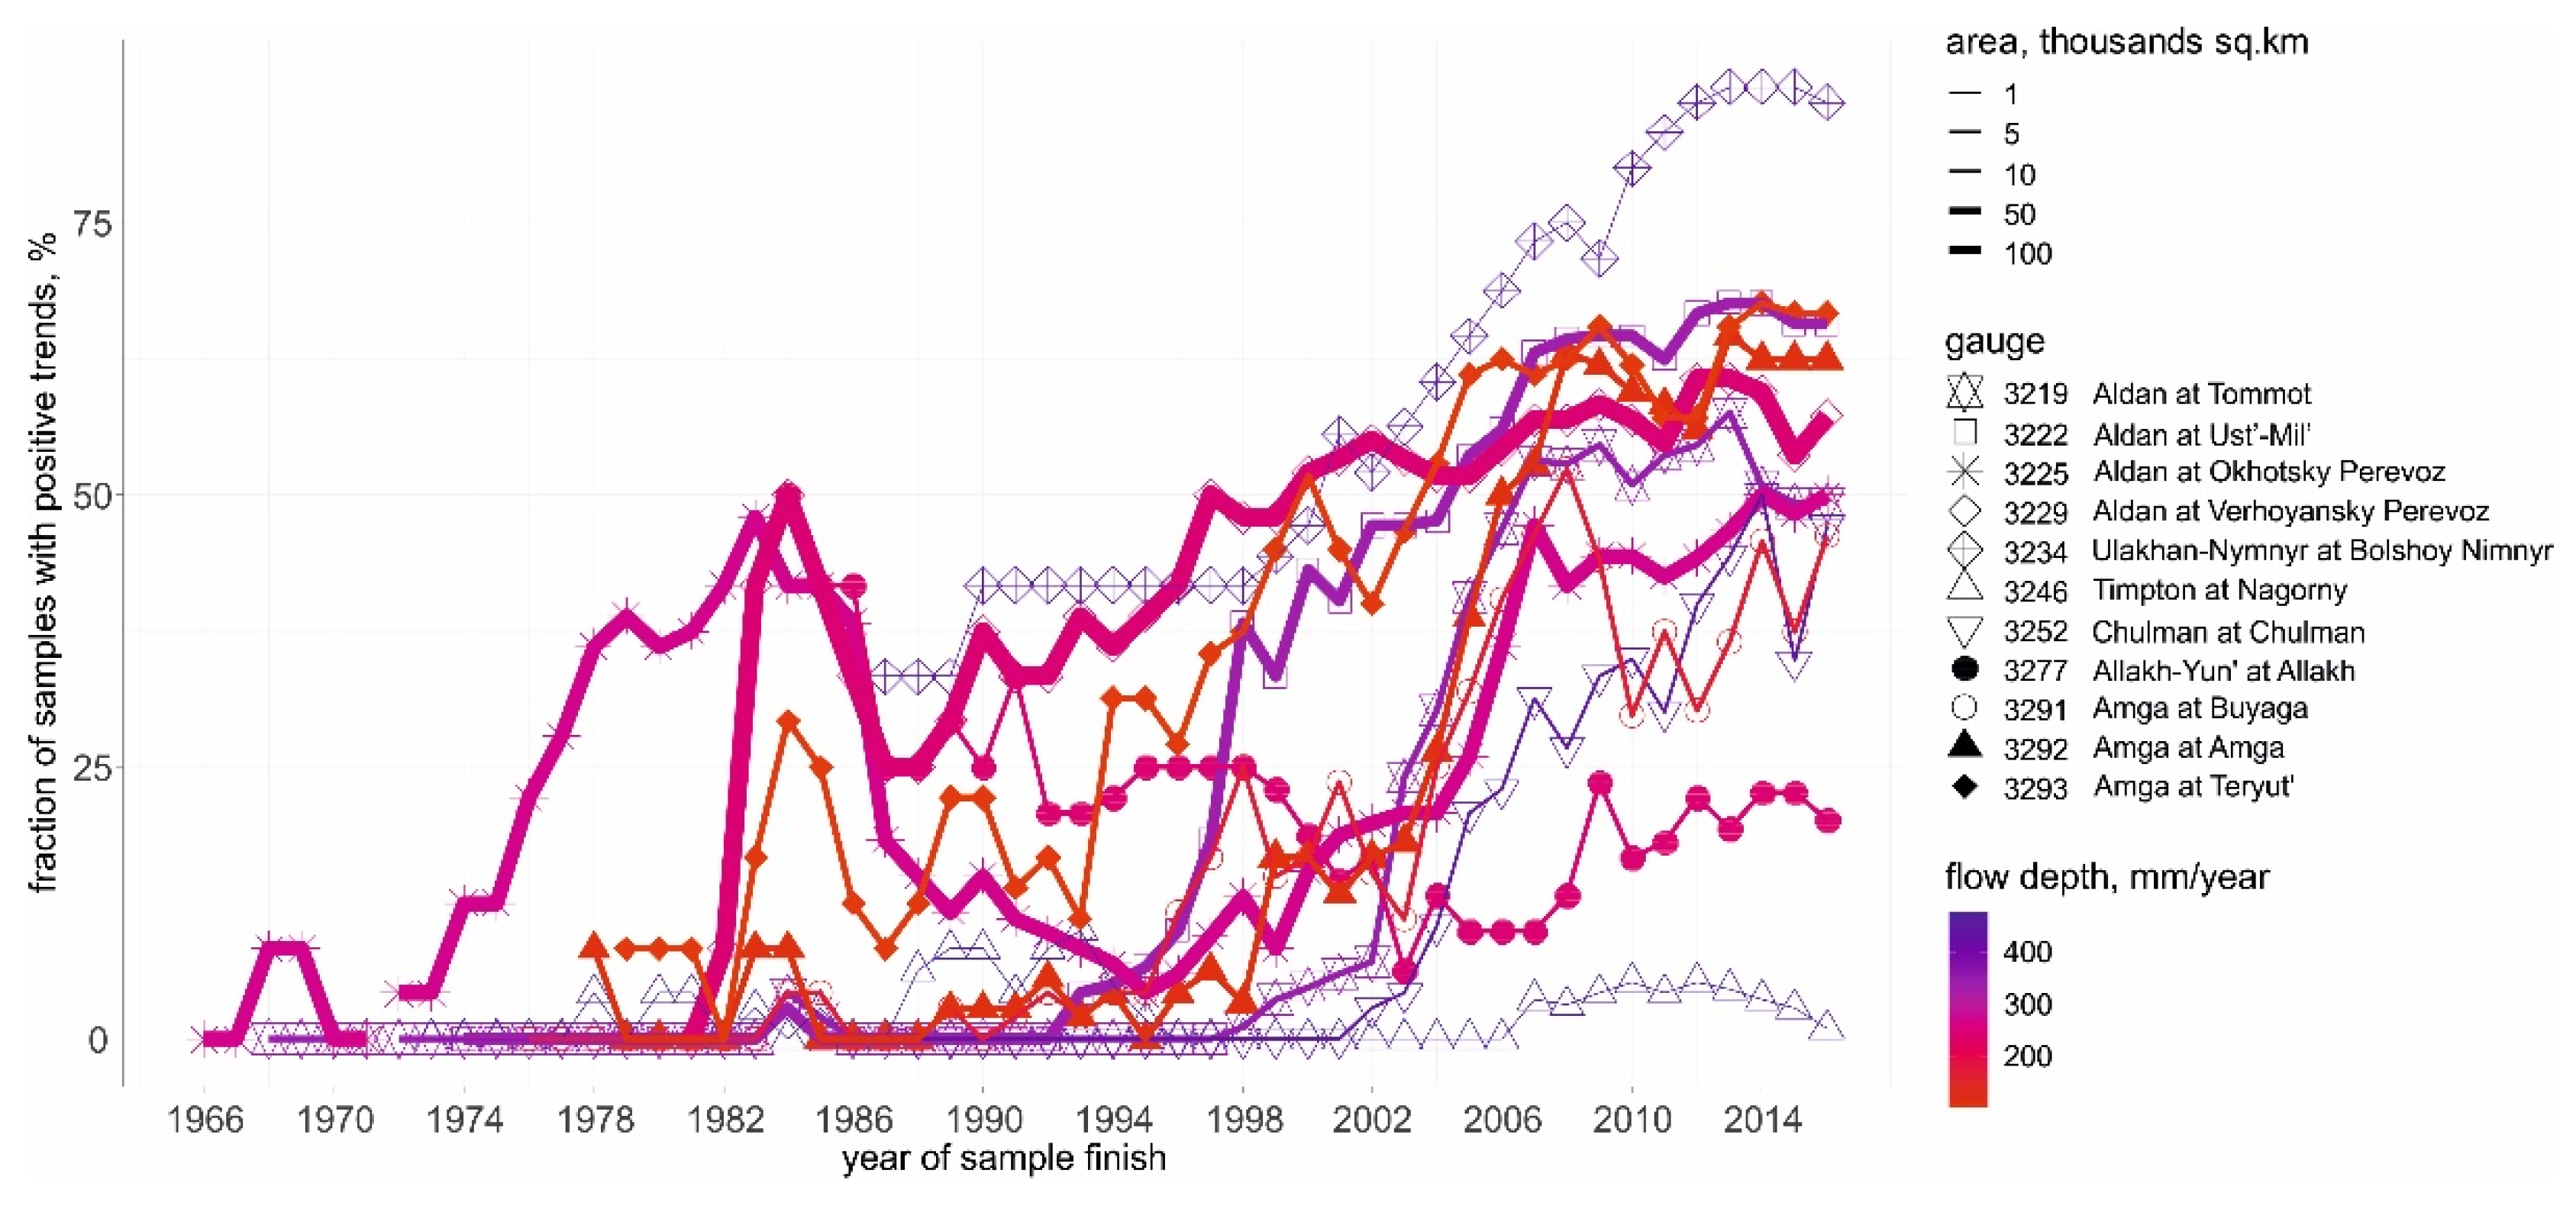
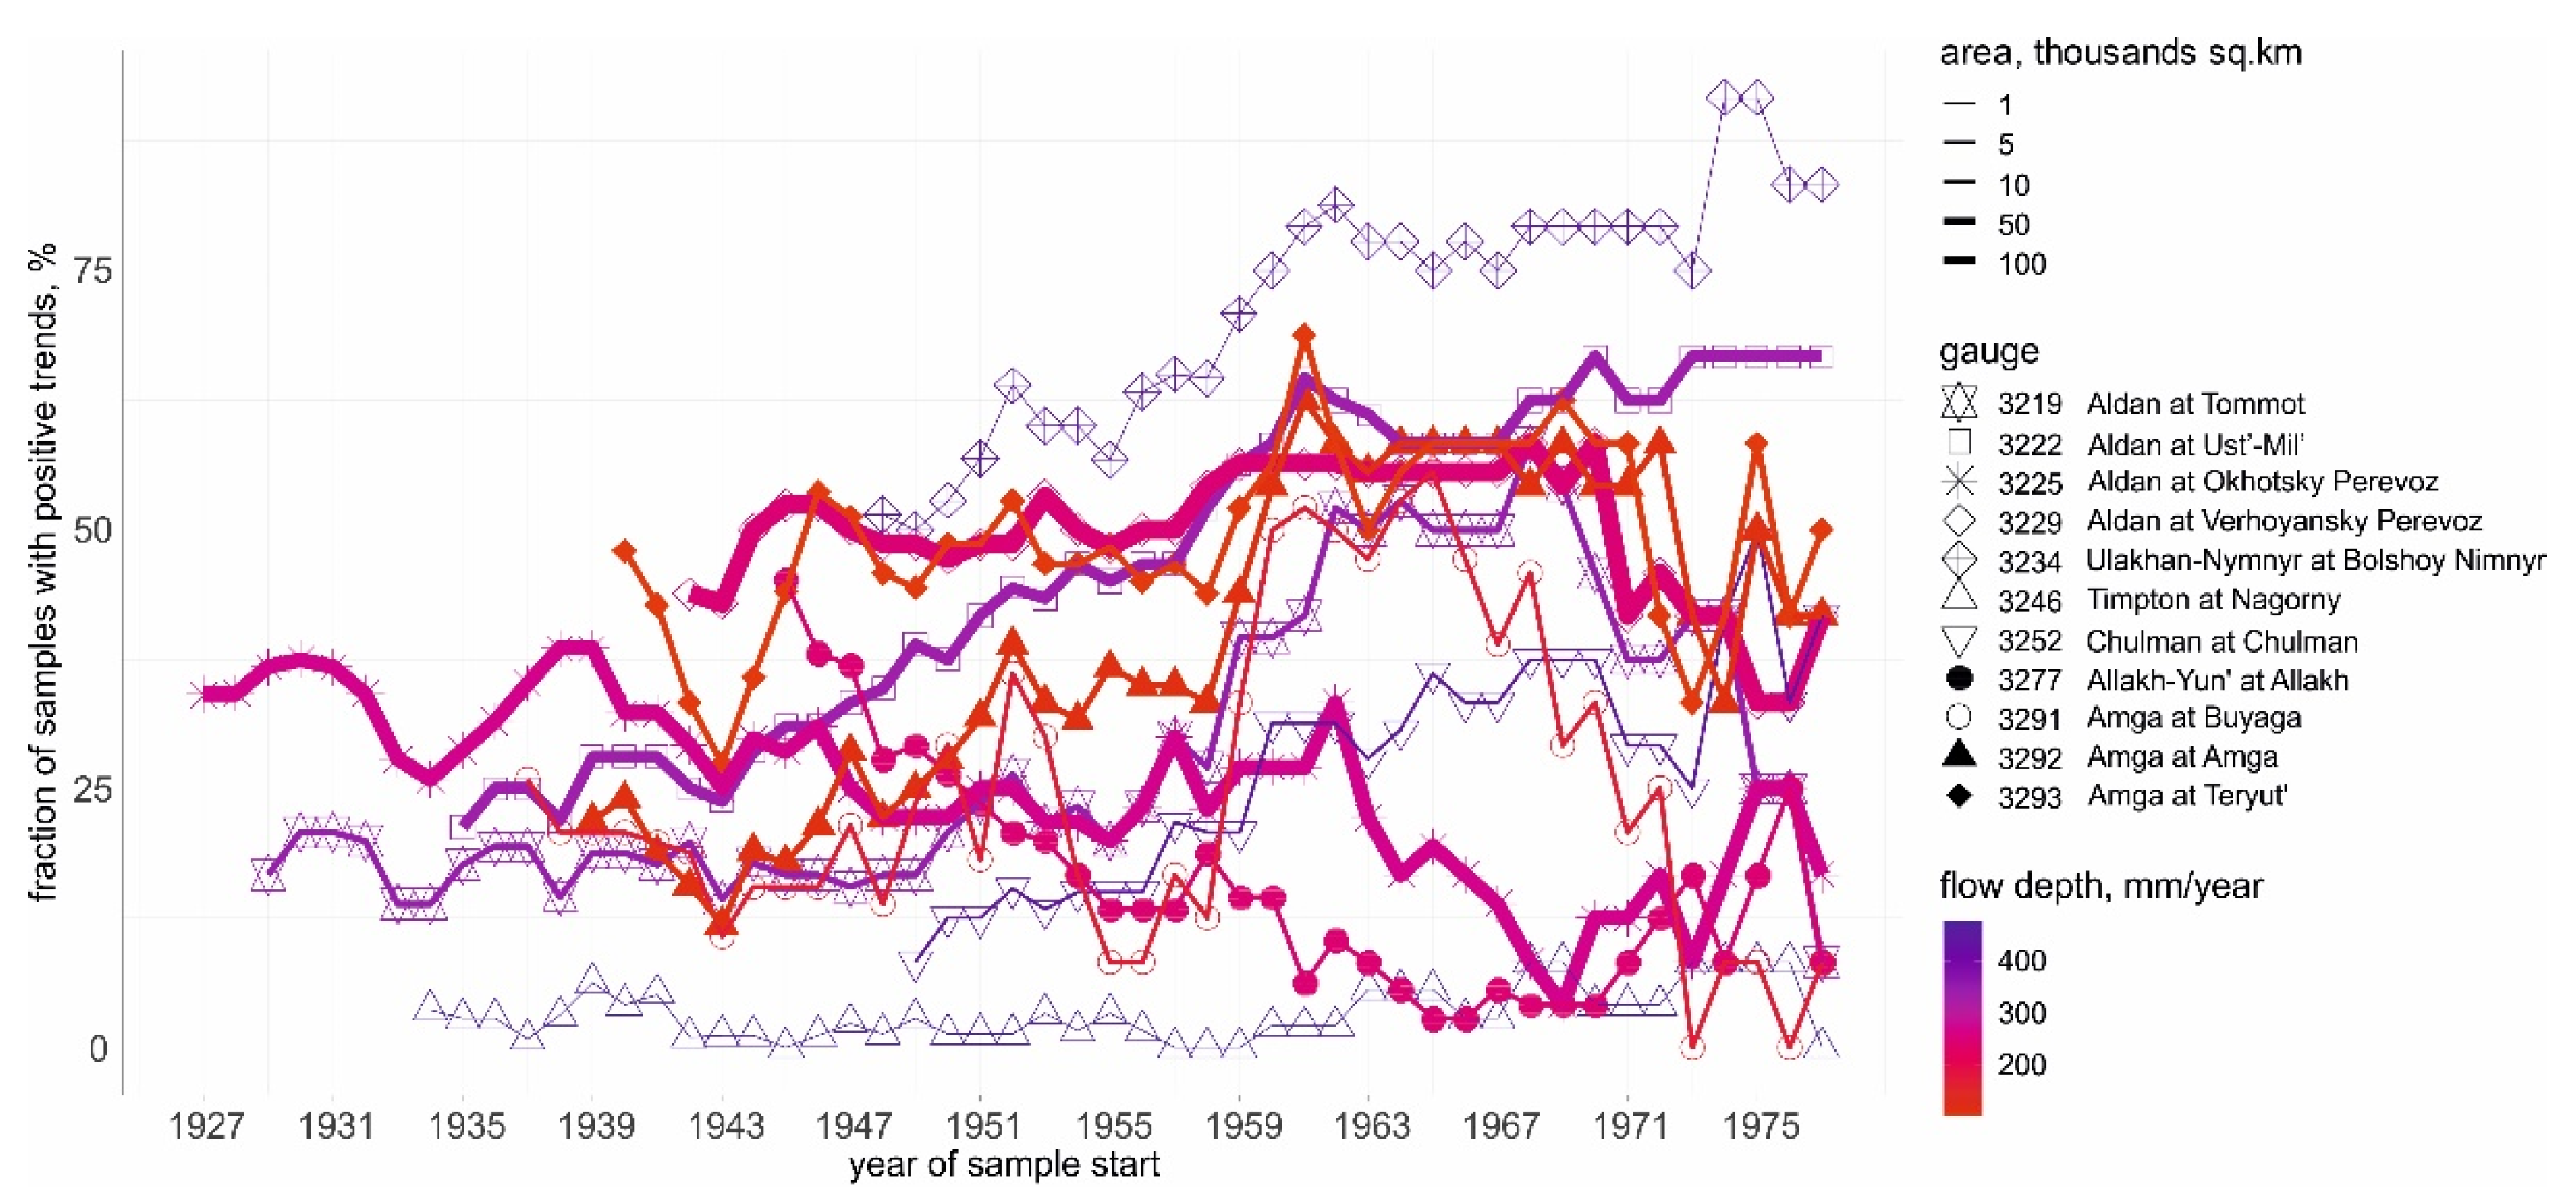
3.1. Trends Dependence on Month, Sample Length, Finish and Start Years
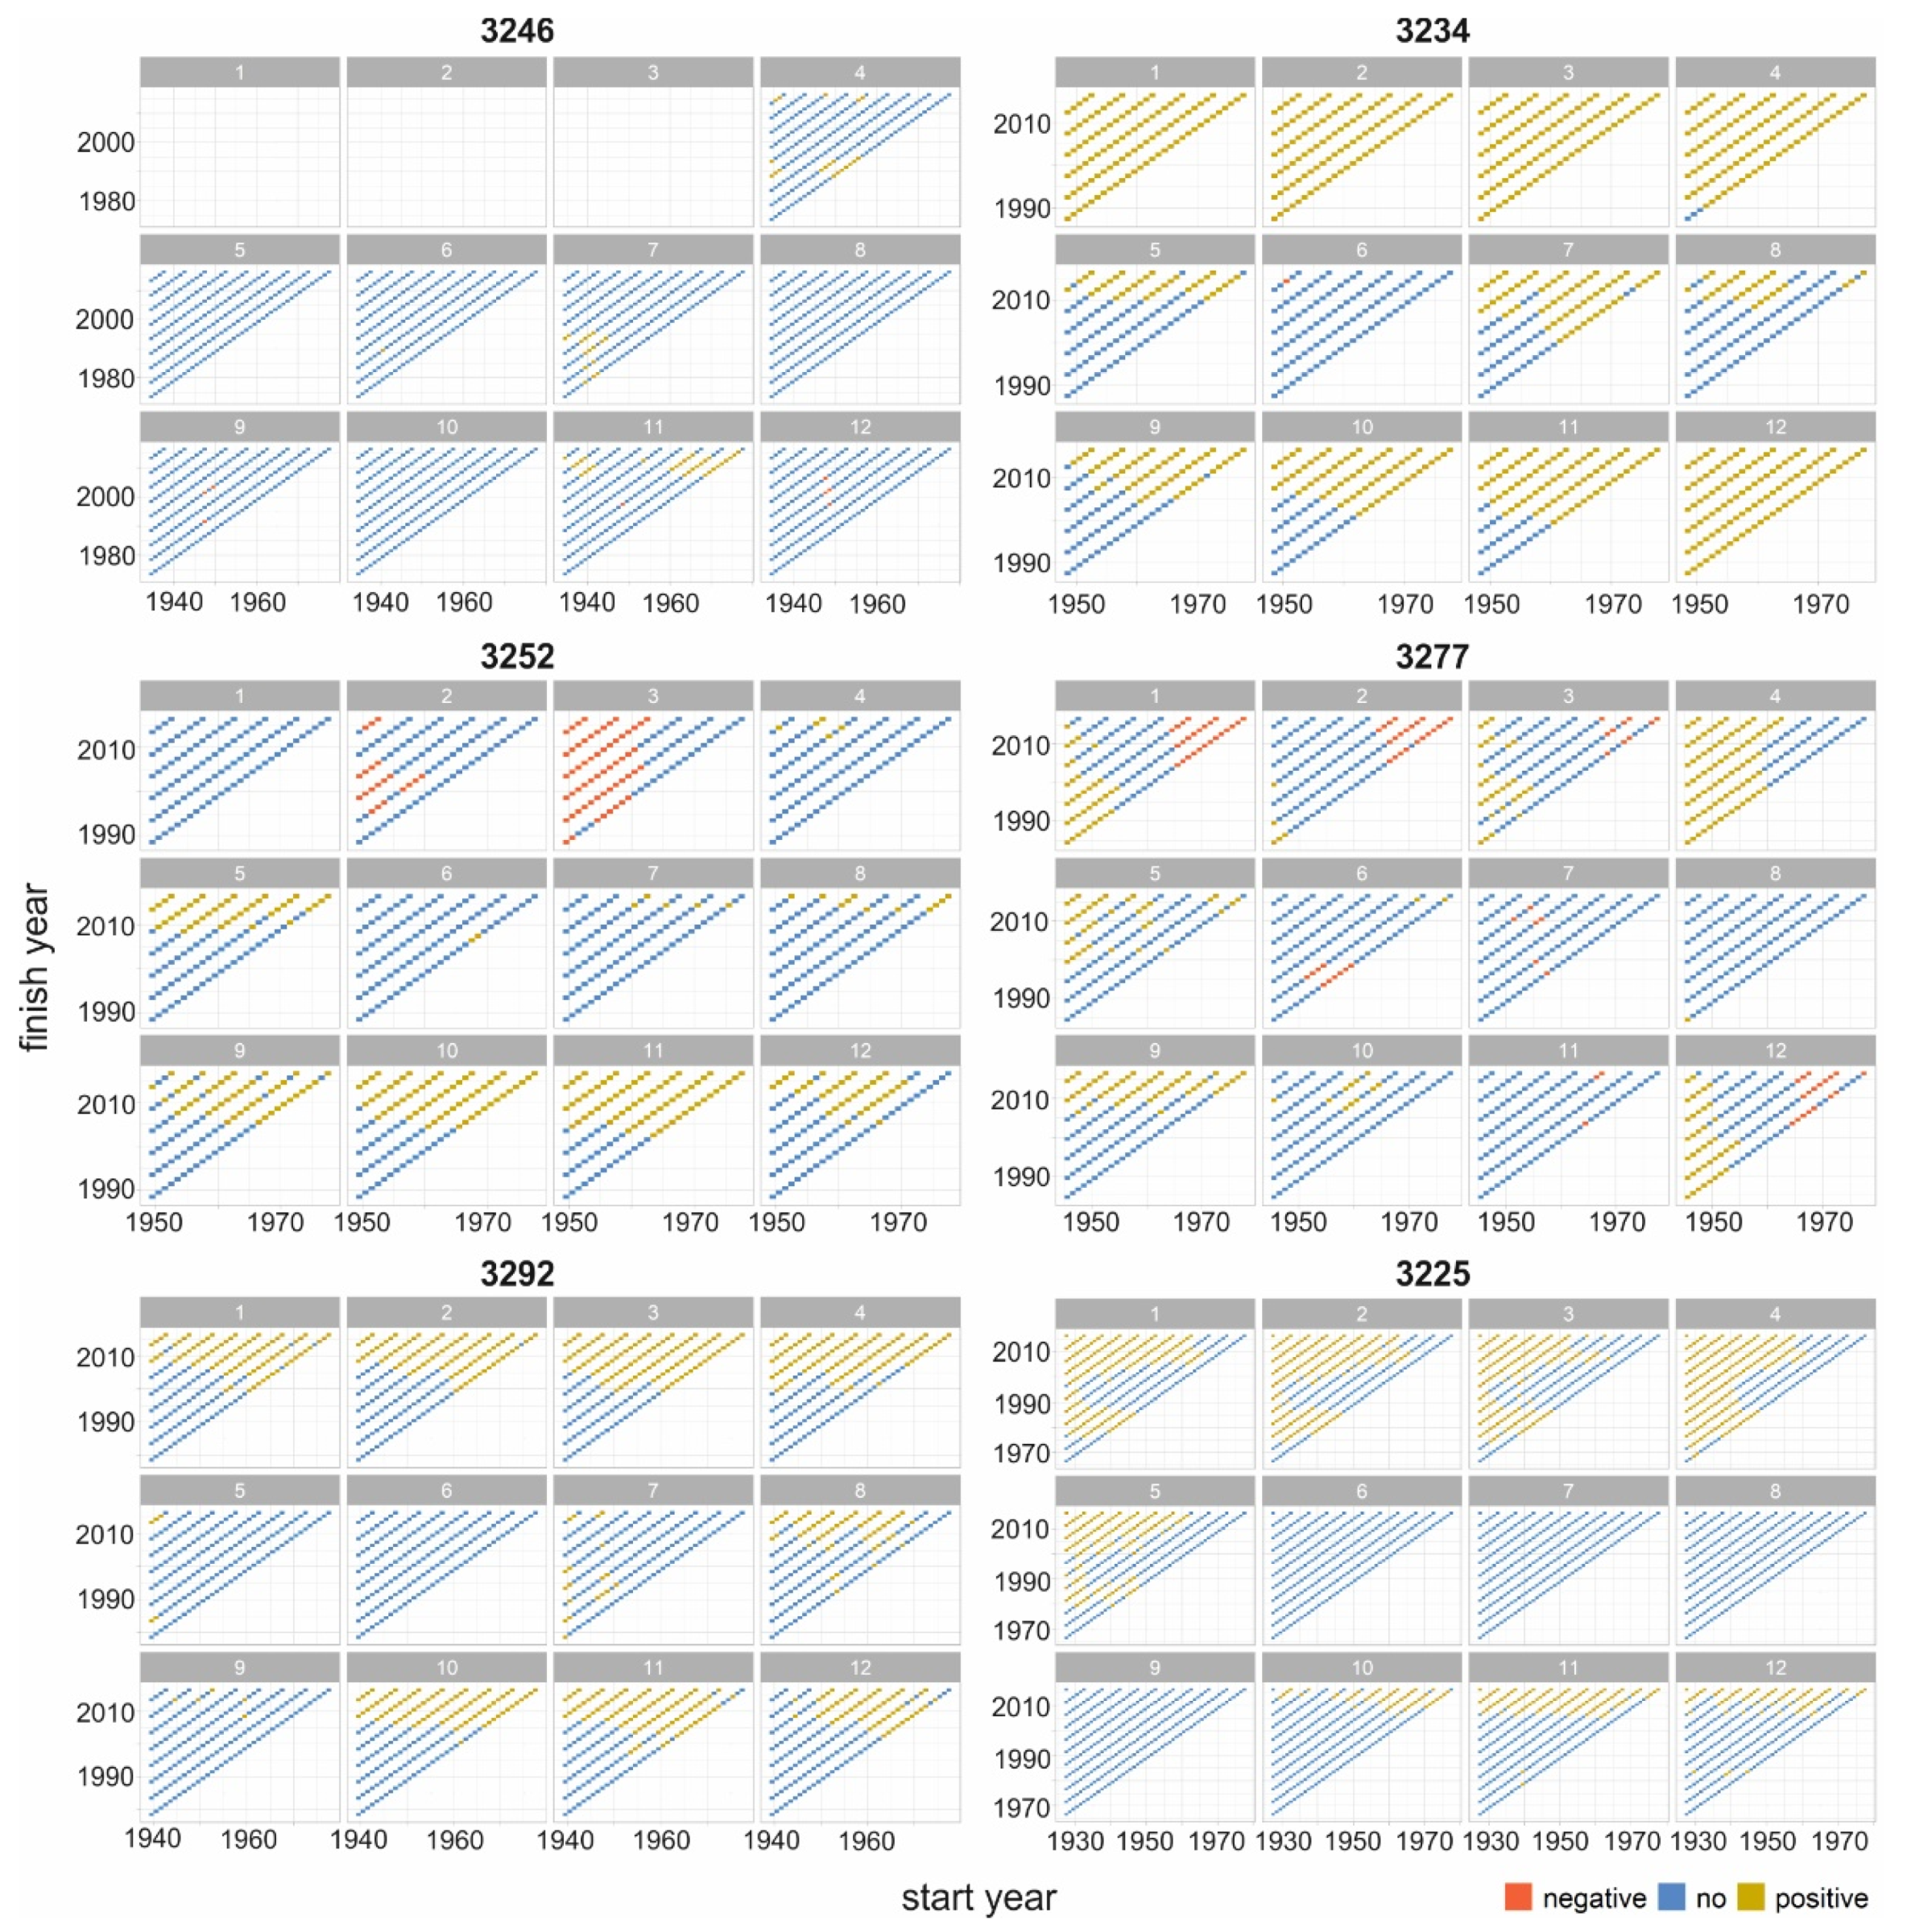
3.2. Trends at the Separate Gauges
4. Discussion
5. Conclusions
Author Contributions
Funding
Institutional Review Board Statement
Informed Consent Statement
Data Availability Statement
Conflicts of Interest
References
- Yang, D.; Shi, X.; Marsh, P. Variability and extreme of Mackenzie River daily discharge during 1973–2011. Quatern. Int. 2015, 380–381, 159–168. [Google Scholar] [CrossRef]
- Bawden, A.; Linton, H.; Burn, D.; Prowse, T. A spatiotemporal analysis of hydrological trends and variability in the Athabasca River region, Canada. J. Hydrol. 2014, 509, 333–342. [Google Scholar] [CrossRef]
- St. Jacques, J.-M.; Sauchyn, D.J. Increasing winter baseflow and mean annual streamflow from possible permafrost thawing in the Northwest Territories, Canada. Geophys. Res. Lett. 2009, 36, L01401. [Google Scholar] [CrossRef]
- Déry, S.J.; Wood, E.F. Decreasing river discharge in northern Canada. Geophys. Res. Lett. 2005, 32, L10401. [Google Scholar] [CrossRef] [Green Version]
- Déry, S.J.; Stadnyk, T.A.; MacDonald, M.K.; Gauli-Sharma, B. Recent trends and variability in river discharge across northern Canada. Hydrol. Earth Syst. Sci. 2016, 20, 4801–4818. [Google Scholar] [CrossRef] [Green Version]
- Khaliq, M.N.; Ouarda, T.B.M.J.; Gachon, P.; Sushama, L.; St-Hilaire, A. Identification of hydrological trends in the presence of serial and cross correlations: A review of selected methods and their application to annual flow regimes of Canadian rivers. J. Hydrol. 2009, 368, 117–130. [Google Scholar] [CrossRef]
- Peterson, B.J.; Holmes, R.M.; McClelland, J.W.; Vörösmarty, C.J.; Lammers, R.B.; Shiklomanov, A.I.; Shiklomanov, I.A.; Rahmstorf, C. Increasing river discharge to the Arctic Ocean. Science 2002, 298, 2171–2173. [Google Scholar] [CrossRef] [Green Version]
- Shiklomanov, A.I.; Yakovleva, T.I.; Lammers, R.B.; Karasev, I.P.; Vorosmarty, C.J.; Linder, E. Cold region river discharge uncertainty—estimates from large Russian rivers. J. Hydrol. 2006, 326, 231–256. [Google Scholar] [CrossRef]
- Adam, J.C.; Lettenmaier, D.P. Application of New Precipitation and Reconstructed Streamflow Products to Streamflow Trend Attribution in Northern Eurasia. J. Clim. 2008, 21, 1807–1828. [Google Scholar] [CrossRef]
- Frolova, N.L.; Magritskiy, D.V.; Kireyeva, M.B.; Agafonova, S.A.; Povalishnikova, Y.S. Antropogennyye i klimaticheski obuslovlennyye izmeneniya stoka vody i ledovykh yavleniy rek rossiyskoy Arktiki [Runoff and ice phenomena dynamics on the rivers of Russian Arctic due to anthropogenic and climate changes]. Voprosy geografii 2018, 145, 233–251. [Google Scholar]
- Georgievskii, V.Y.; Ezhov, A.V.; Shalygin, A.L.; Shiklomanov, I.A.; Shiklomanov, A.I. Assessment of the effect of possible climate changes on hydrological regime and water resources of rivers in the former USSR. Russ. Meteorol. Hydrol. 1996, 11, 89–99. [Google Scholar]
- Yang, D.; Ye, B.; Shiklomanov, A. Discharge characteristics and changes over the Ob River watershed in Siberia. J. Hydrometeorol. 2004, 5, 595–610. [Google Scholar] [CrossRef] [Green Version]
- Yang, D.; Ye, B.; Kane, D.L. Streamflow changes over Siberian Yenisei River Basin. J. Hydrol. 2004, 296, 59–80. [Google Scholar] [CrossRef]
- Yang, D.; Kane, D.L.; Hinzman, L.D.; Zhang, X.; Zhang, T.; Ye, H. Siberian Lena River hydrologic regime and recent change. J. Geophys. Res. 2002, 107, 4694. [Google Scholar] [CrossRef]
- Ahmed, R.; Prowse, T.; Dibike, Y.; Bonsal, B.; O’Neil, H. Recent Trends in Freshwater Influx to the Arctic Ocean from Four Major Arctic-Draining Rivers. Water 2020, 12, 1189. [Google Scholar] [CrossRef] [Green Version]
- Smith, L.C.; Pavelsky, T.M.; McDonald, G.M.; Shiklomanov, A.I.; Lammers, R.B. Rising minimum daily flows in northern Eurasian rivers: A growing influence of groundwater in the high–latitude hydrologic cycle. J. Geophys. Res. 2007, 112, G04S47. [Google Scholar] [CrossRef] [Green Version]
- Rawlins, M.A.; Ye, H.; Yang, D.; Shiklomanov, A.; McDonald, K.C. Divergence in seasonal hydrology across northern Eurasia: Emerging trends and water cycle linkages. J. Geophys. Res. 2009, 114, D18119. [Google Scholar] [CrossRef] [Green Version]
- Rennermalm, A.K.; Wood, E.F.; Troy, T.J. Observed changes in pan-arctic cold-season minimum monthly river discharge. Clim Dyn 2010, 35, 923–939. [Google Scholar] [CrossRef]
- Makarieva, O.; Nesterova, N.; Post, D.A.; Sherstyukov, A.; Lebedeva, L. Warming temperatures are impacting the hydrometeorological regime of Russian rivers in the zone of continuous permafrost. Cryosphere 2019, 13, 1635–1659. [Google Scholar] [CrossRef] [Green Version]
- Shiklomanov, A.I.; Lammers, R.B.; Lettenmaier, D.P.; Polischuk, Y.M.; Savichev, O.G.; Smith, L.C.; Chernokulsky, A.V. Hydrological Changes: Historical Analysis, Contemporary Status, and Future Projections. In Regional Environmental Changes in Siberia and Their Global Consequences; Groisman, P.Y., Gutman, G., Eds.; Springer Science+Business Media: Dordrecht, The Netherlands, 2013; pp. 111–154. [Google Scholar] [CrossRef]
- Ye, B.; Yang, D.; Zhang, Z.; Kane, D.L. Variation of hydrological regime with permafrost coverage over Lena Basin in Siberia. J. Geophys. Res. 2009, 114, D07102. [Google Scholar] [CrossRef] [Green Version]
- Berezovskaya, S.; Yang, D.; Hinzman, L. Long–term annual water balance of the Lena River. Glob. Planet. Chang. 2005, 48, 84–95. [Google Scholar] [CrossRef]
- Ye, B.; Yang, D.; Kane, D. Changes in Lena River streamflow hydrology: Human impacts versus natural variations. Water Resour. Res. 2003, 39, 1200. [Google Scholar] [CrossRef]
- Tananaev, N.I.; Makarieva, O.M.; Lebedeva, L.S. Trends in annual and extreme flows in the Lena River basin, Northern Eurasia. Geophys. Res. Lett. 2016, 43, 764–772. [Google Scholar] [CrossRef]
- Shiklomanov, A.I.; Lammers, R.B. Record Russian river discharge in 2007 and the limits of analysis. Environ. Res. Lett. 2009, 4, 045015. [Google Scholar] [CrossRef]
- Yumina, N.M.; Tereshina, M.A. Mnogoletniye izmeneniya stoka rek basseyna Vilyuya [Estimating long-term changes of river runoff in the Viluy river basin]. Vestnik Moskovskogo Universiteta Seriya 5 Geografiya 2017, 6, 62–70. [Google Scholar]
- Arrieta-Castro, M.; Donado-Rodríguez, A.; Acuña, G.J.; Canales, F.A.; Teegavarapu, R.S.V.; Kaźmierczak, B. Analysis of Streamflow Variability and Trends in the Meta River, Colombia. Water 2020, 12, 1451. [Google Scholar] [CrossRef]
- Georgiadi, A.G.; Kashutina, Y.A. Mnogoletniye izmeneniya godovogo i sezonnogo stoka rek basseyna Leny [The features of long-term annual and seasonal runoff changes for Lena basin rivers]. Izvestiya Rossiiskoi Akademii Nauk Seriya Geograficheskaya 2014, 2, 71–83. [Google Scholar]
- Shiklomanov, A.I.; Lammers, R.B.; Rawlins, M.A.; Smith, L.C.; Pavelsky, T.M. Temporal and spatial variations in maximum river discharge from a new Russian dataset. J. Geophys. Res. 2007, 112, G04S53. [Google Scholar] [CrossRef]
- Rumyantseva, Y.V.; Shestakova, Y.N.; Muzhdaba, O.V. Dinamika vodnykh resursov rek Arkticheskoy zony Zapadnoy Sibiri [Dynamics of water resources of the rivers of the Arctic zone of Western Siberia]. Nauchnyy Vestnik Yamalo-Nenetskogo Avtonomnogo Okruga 2017, 3, 53–61. [Google Scholar]
- Anisimov, O.A.; Zhil’tsova, E.L.; Shapovalova, K.O.; Ershova, A.A. Analysis of Climate Change Indicators. Part 1. Eastern Siberia. Russ. Meteorol. Hydrol. 2019, 44, 810–817. [Google Scholar] [CrossRef]
- Mann, H.B. Nonparametric tests against trend. Econometrica 1945, 13, 245–259. [Google Scholar] [CrossRef]
- Kendall, M. Rank Correlation Measures; Charles Griffin: London, UK, 1975. [Google Scholar]
- Lehmann, E.L. Nonparametrics, Statistical Methods Based on Ranks; Holden-Day, Inc.: San Francisco, CA, USA, 1975. [Google Scholar]
- Yue, S.; Pilon, P.; Cavadias, G. Power of the Mann–Kendall and Spearman’s rho tests for detecting monotonic trends in hydrological series. J. Hydrol. 2002, 259, 254–271. [Google Scholar] [CrossRef]
- Burn, D.; Abdul Aziz, O.; Pietroniro, A. A Comparison of Trends in Hydrological Variables for Two Watersheds in the Mackenzie River Basin. Can. Water Resour. J./Rev. Can. Ressour. Hydr. 2004, 29, 283–298. [Google Scholar] [CrossRef] [Green Version]
- Semmens, K.A.; Ramage, J.M. Recent changes in spring snowmelt timing in the Yukon River basin detected by passive microwave satellite data. Cryosphere 2013, 7, 905–916. [Google Scholar] [CrossRef] [Green Version]
- Zhang, Z.; Dehoff, A.D.; Pody, R.D. New approach to identify trend pattern of streamflows. J. Hydrol. Engin. 2010, 15, 244–248. [Google Scholar] [CrossRef]
- A Report on Climate Features on the Territory of the Russian Federation in 2020; Roshydromet: Moscow, Russia, 2021; 104p.
- Li, S.; Liu, M.; Adam, J.C.; Pi, H.; Su, F.; Li, D.; Liu, Z.; Yao, Z. Contribution of Snow-Melt Water to the Streamflow over the Three-River Headwater Region, China. Remote Sens. 2021, 13, 1585. [Google Scholar] [CrossRef]
- Shiklomanov, I.A. (Ed.) Water Resources of Russia and Their Use; Nauka: St. Petersburg, Russia, 2008. (In Russian) [Google Scholar]
- Tan, A.; Adam, J.C.; Lettenmaier, D.P. Change in spring snowmelt timing in Eurasian Arctic rivers. J. Geophys. Res. 2011, 116, D03101. [Google Scholar] [CrossRef] [Green Version]
- Ghaderpour, E.; Vujadinovic, T.; Hassan, Q.A. Application of the Least-Squares Wavelet software in hydrology: Athabasca River Basin. J. Hydrol. Reg. Stud. 2021, 36C, 100847. [Google Scholar] [CrossRef]


| ID | River-Gauge | Basin Area, sq.km | Data Period | Mean Annual D, m3/s | Mean Annual R, mm | Max Month D, m3/s, Month | Min Month D, m3/s, Month | No of Samples |
|---|---|---|---|---|---|---|---|---|
| 3219 | Aldan at Tommot | 49,500 | 88 | 536 | 342 | 1849, May | 71.1, March | 3180 |
| 3222 | Aldan at Ust’-Mil’ | 269,000 | 84 | 2852 | 334 | 8956, June | 203, March | 2484 |
| 3225 | Aldan at Okhotsky Perevoz | 514,000 | 92 | 4362 | 268 | 15,132, June | 296, March | 3432 |
| 3229 | Aldan at Verhoyansky Perevoz | 696,000 | 76 | 5408 | 245 | 18,976, June | 351, April | 1776 |
| 3234 | Ulakhan-Nymnyr at Bolshoy Nimnyr | 1900 | 70 | 26.9 | 447 | 95.2, May | 3.3, February | 1260 |
| 3246 | Timpton at Nagorny | 613 | 84 | 9.3 | 477 | 23.7, June | 0, Dec.–Mar. | 2592 |
| 3252 | Chulman at Chulman | 3840 | 69 | 53.8 | 442 | 156, May | 0, March | 1188 |
| 3277 | Allakh-Yun’ at Allakh | 24,200 | 73 | 18 | 243 | 585, June | 0.7, March | 1512 |
| 3291 | Amga at Buyaga | 23,900 | 81 | 128 | 169 | 645, May | 16.1, March | 2268 |
| 3292 | Amga at Amga | 56,800 | 79 | 199 | 111 | 1009, May | 20.6, March | 2064 |
| 3293 | Amga at Teryut’ | 65,400 | 78 | 210 | 101 | 980, May | 24.3, March | 1968 |
Publisher’s Note: MDPI stays neutral with regard to jurisdictional claims in published maps and institutional affiliations. |
© 2021 by the authors. Licensee MDPI, Basel, Switzerland. This article is an open access article distributed under the terms and conditions of the Creative Commons Attribution (CC BY) license (https://creativecommons.org/licenses/by/4.0/).
Share and Cite
Lebedeva, L.; Gustafsson, D. Streamflow Changes of Small and Large Rivers in the Aldan River Basin, Eastern Siberia. Water 2021, 13, 2747. https://doi.org/10.3390/w13192747
Lebedeva L, Gustafsson D. Streamflow Changes of Small and Large Rivers in the Aldan River Basin, Eastern Siberia. Water. 2021; 13(19):2747. https://doi.org/10.3390/w13192747
Chicago/Turabian StyleLebedeva, Liudmila, and David Gustafsson. 2021. "Streamflow Changes of Small and Large Rivers in the Aldan River Basin, Eastern Siberia" Water 13, no. 19: 2747. https://doi.org/10.3390/w13192747
APA StyleLebedeva, L., & Gustafsson, D. (2021). Streamflow Changes of Small and Large Rivers in the Aldan River Basin, Eastern Siberia. Water, 13(19), 2747. https://doi.org/10.3390/w13192747