Cyanide Removal and Recovery by Electrochemical Crystallization Process


Abstract
:1. Introduction
2. Materials and Methods
2.1. Cyanide-Containing Water
2.2. Experimental Setup
2.3. Analytical Methods
3. Results and Discussion
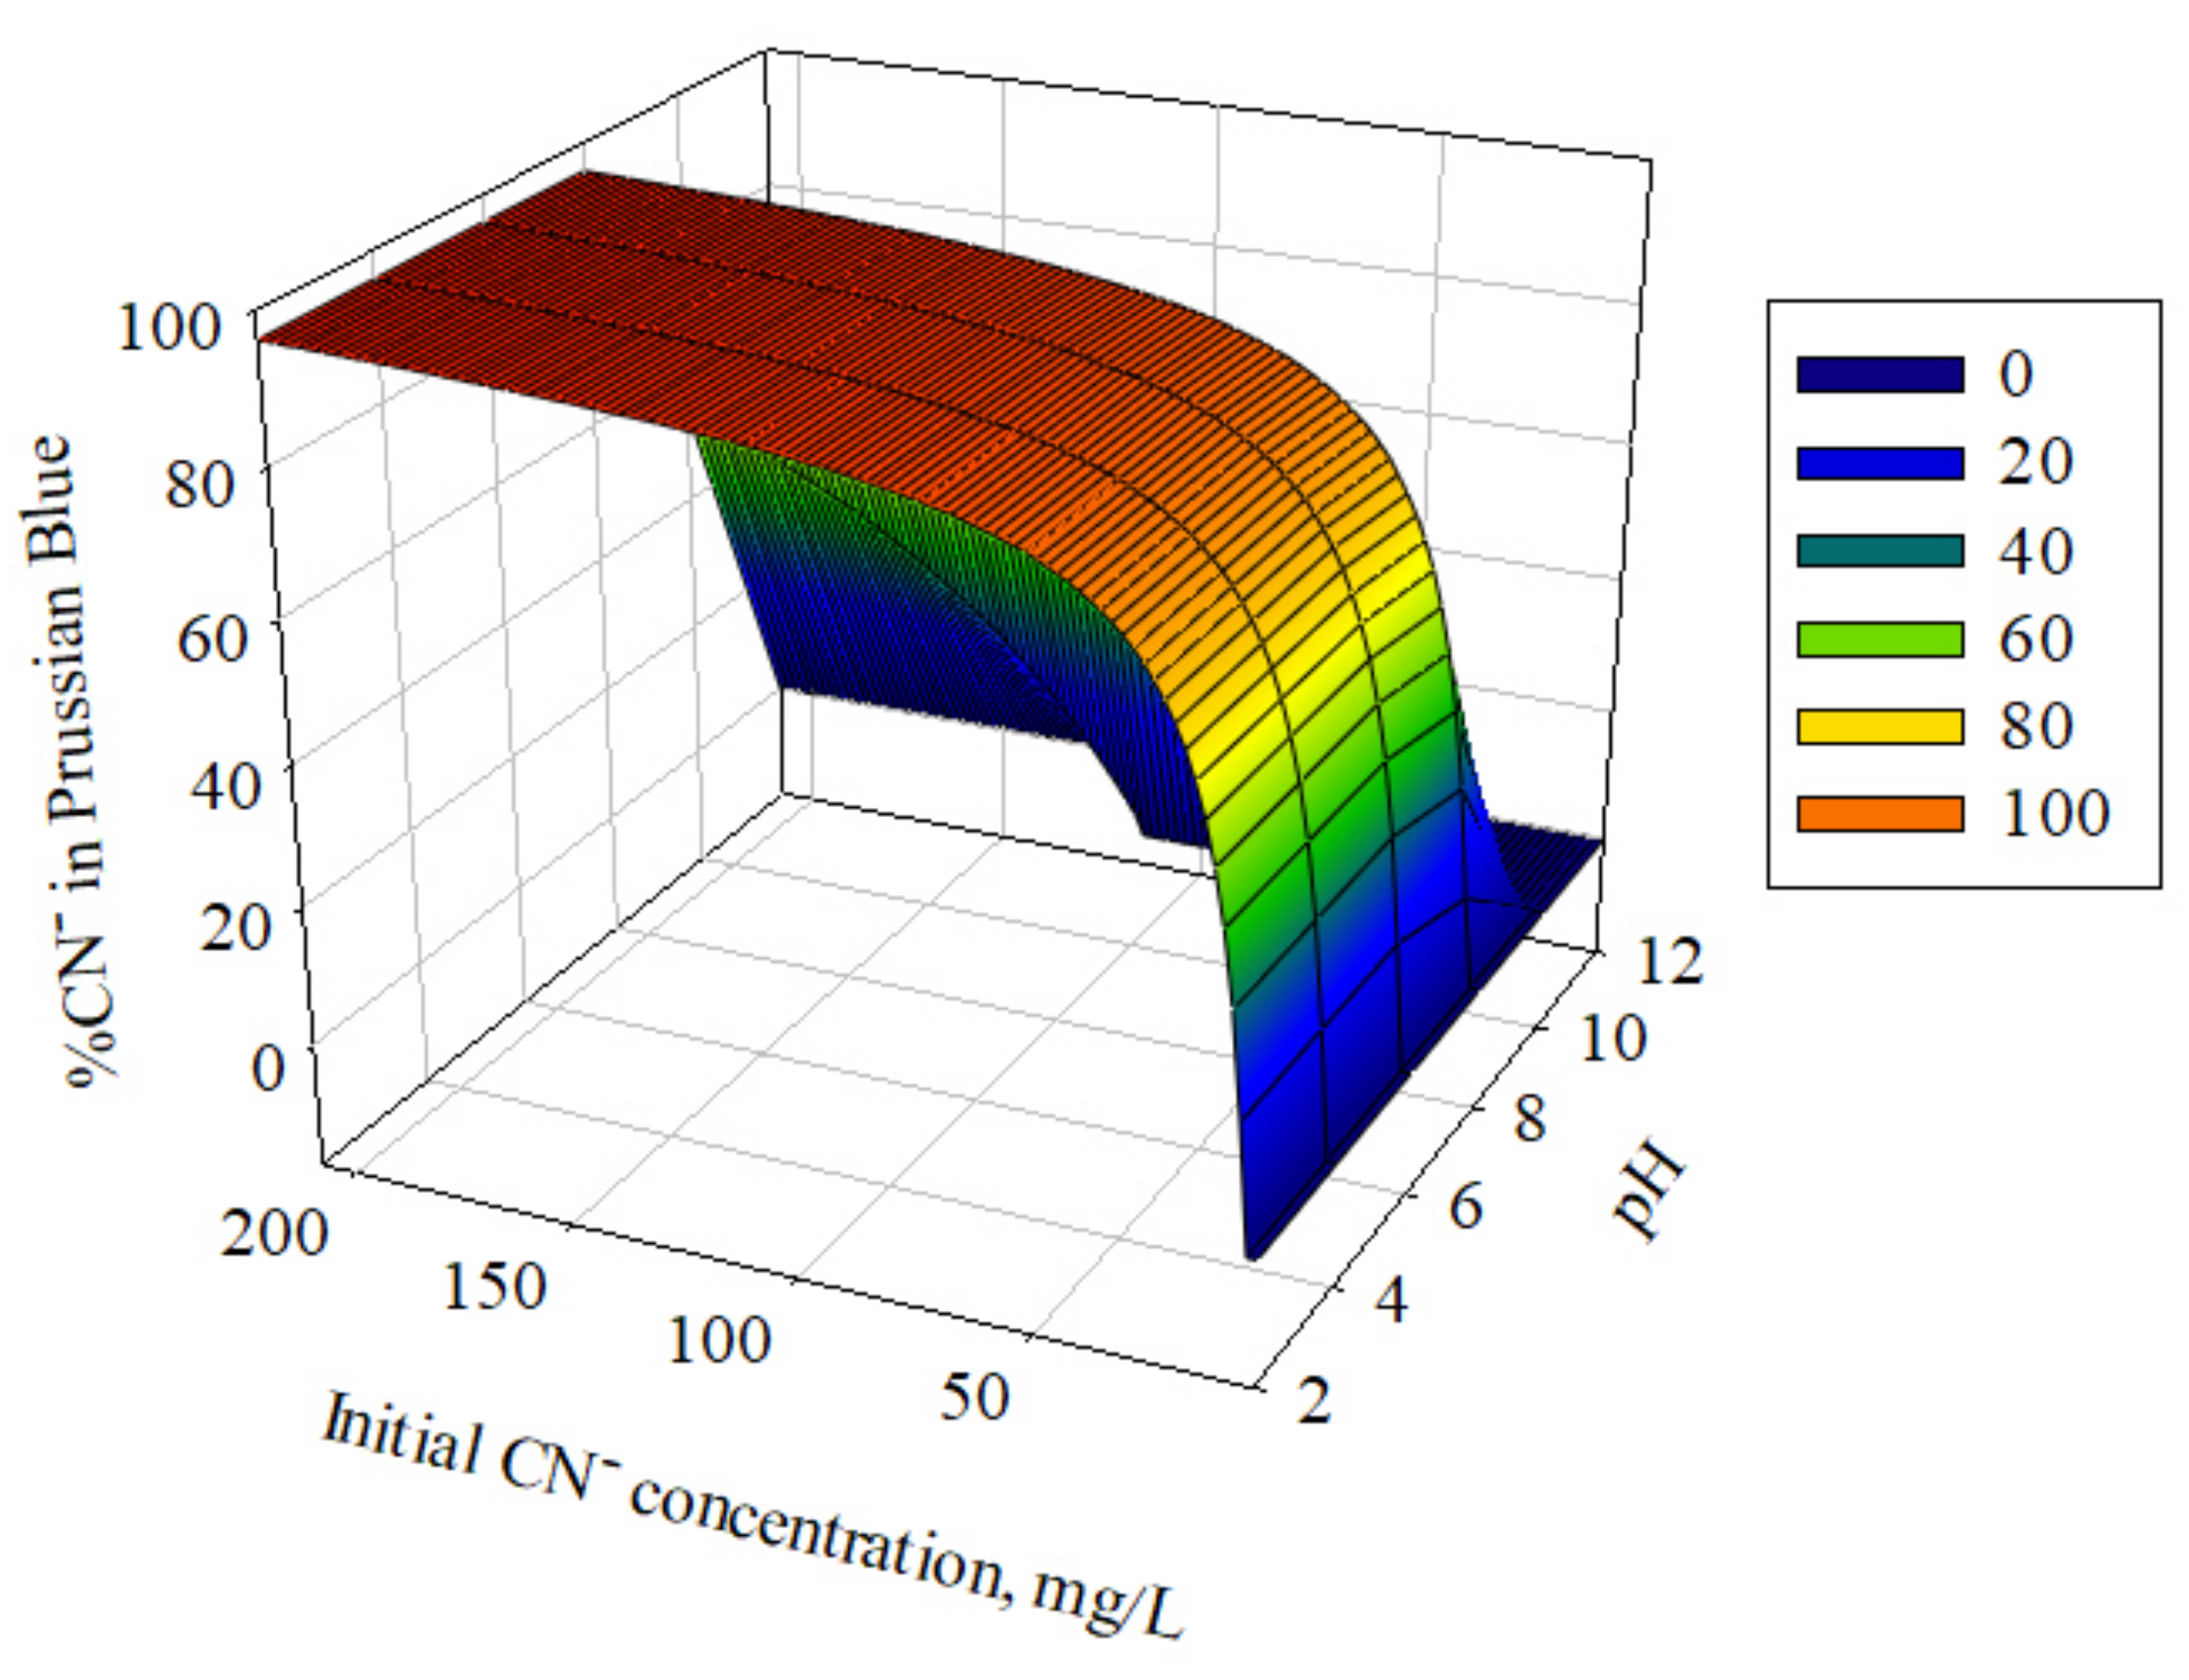
3.1. Chemical Equilibrium Modeling
3.2. Effects of pH on HCN Vaporization
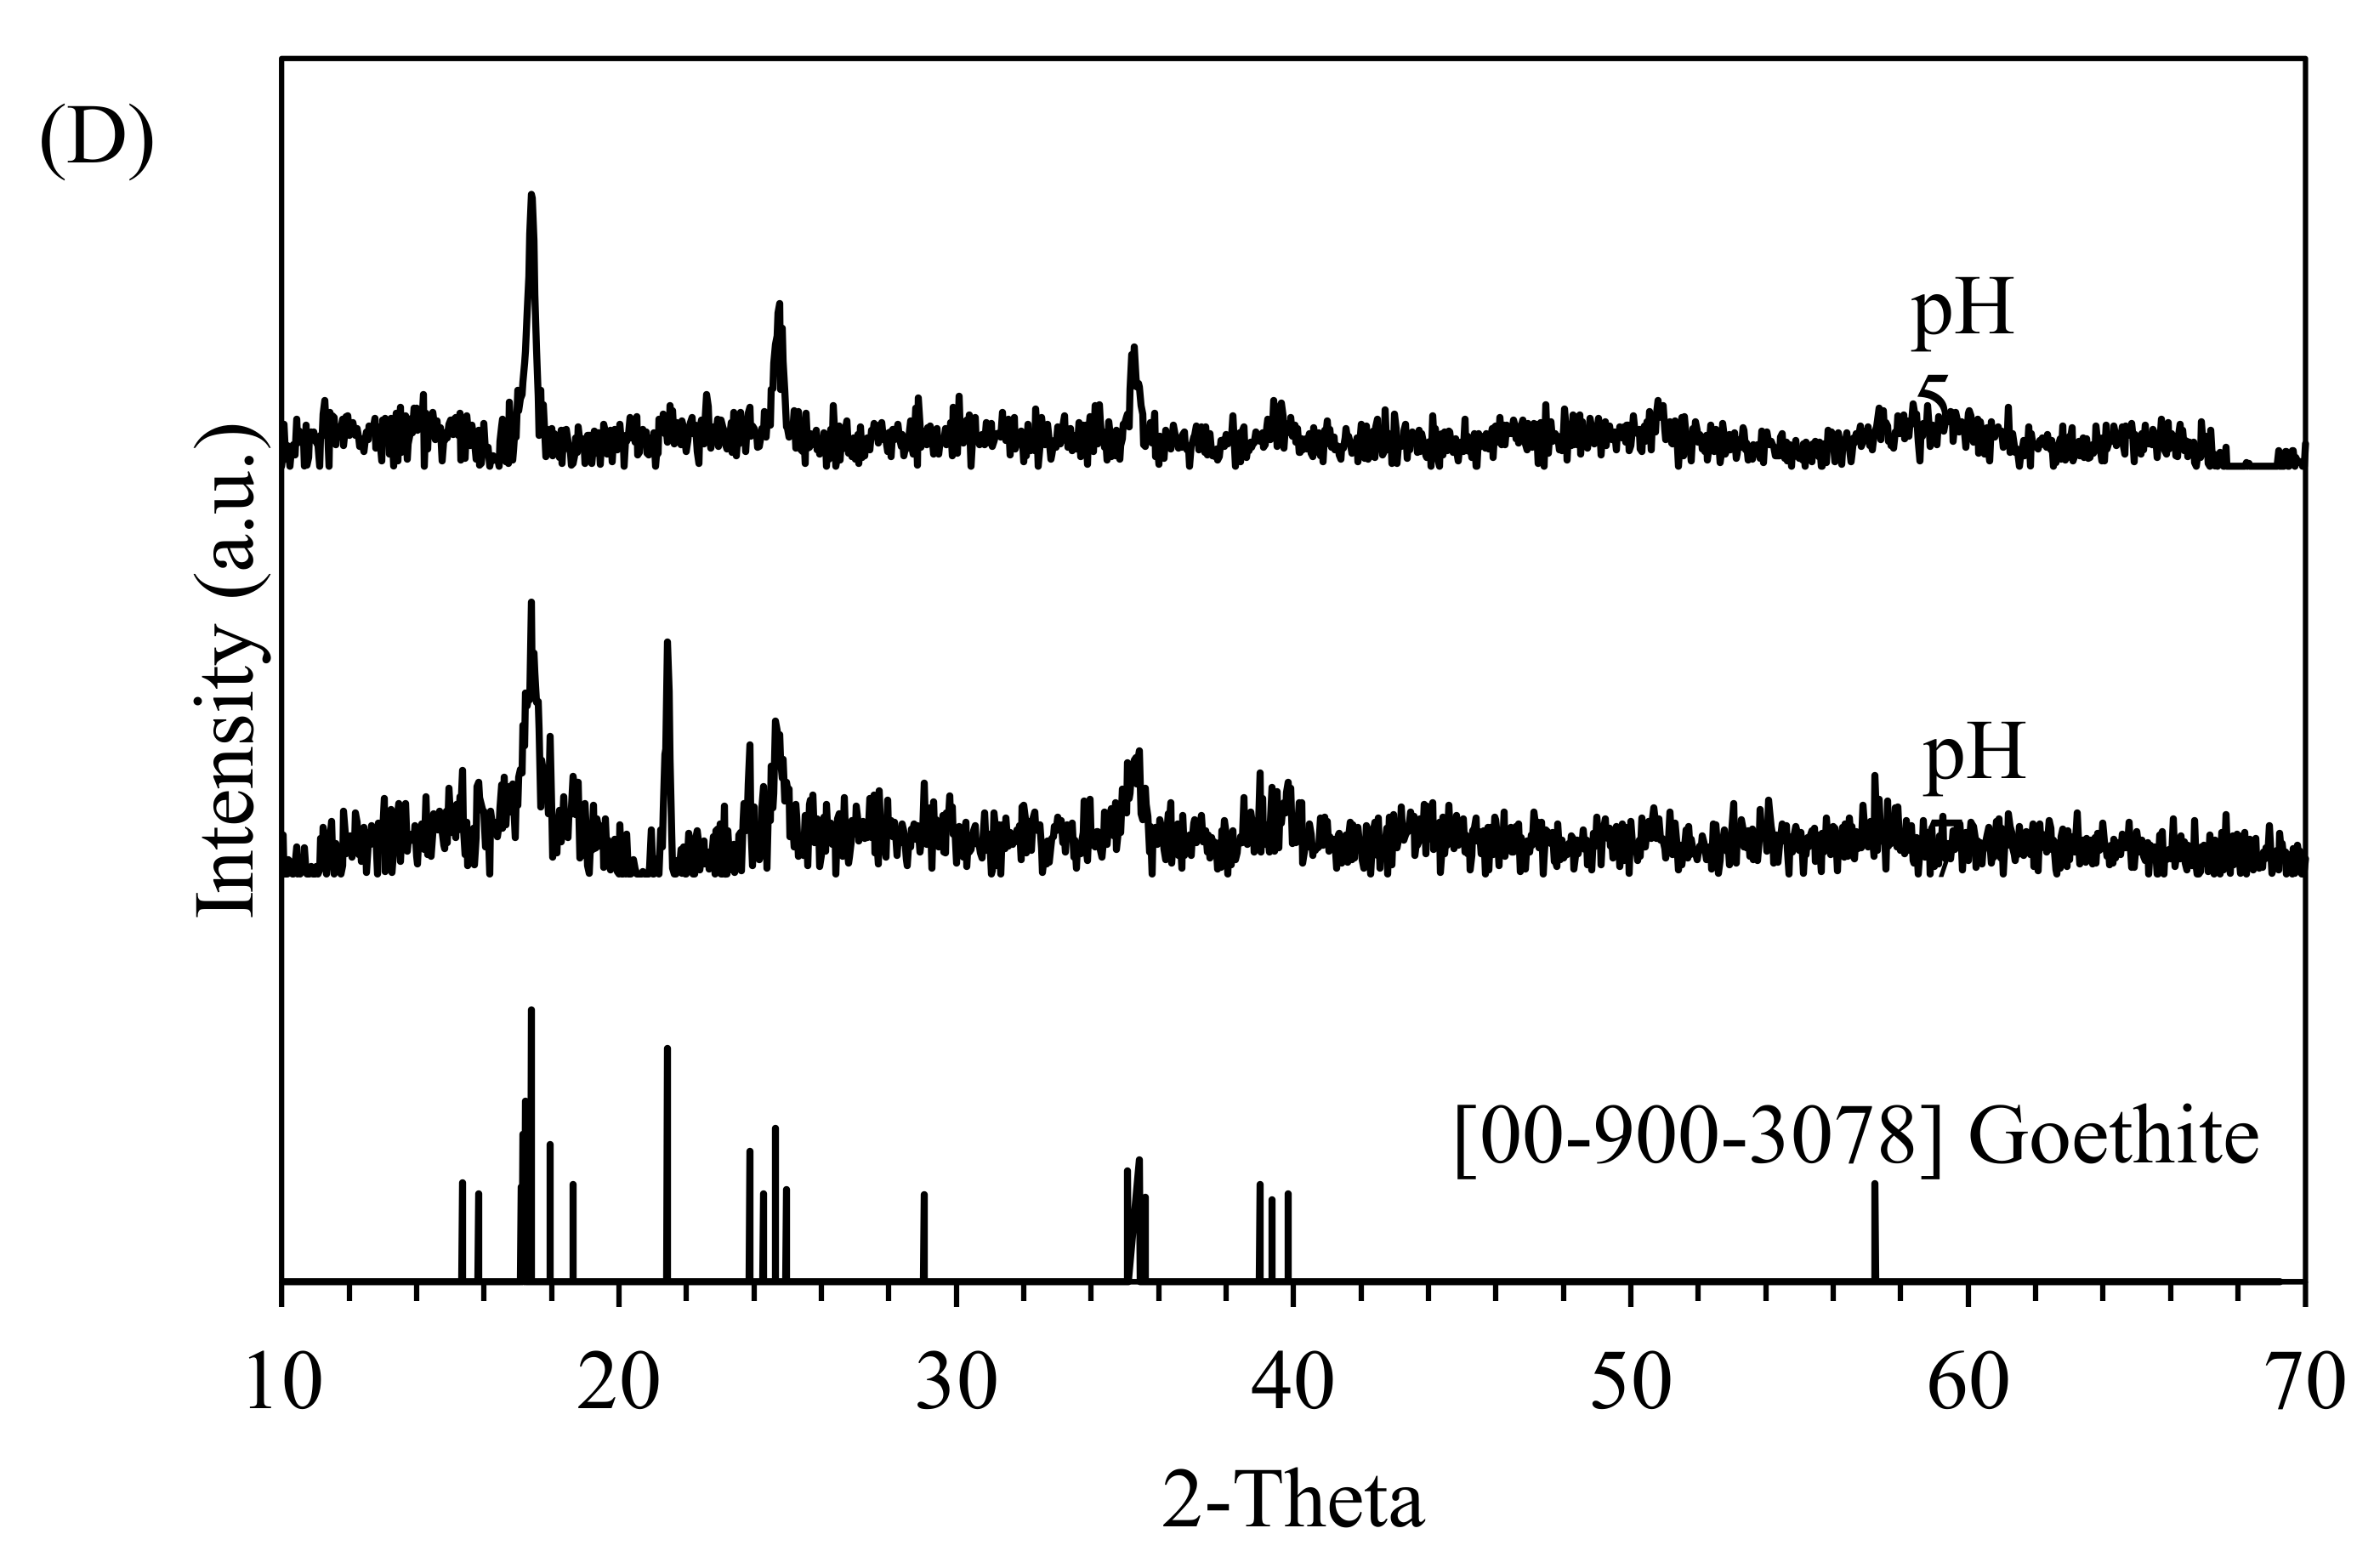
3.3. Effects of pH
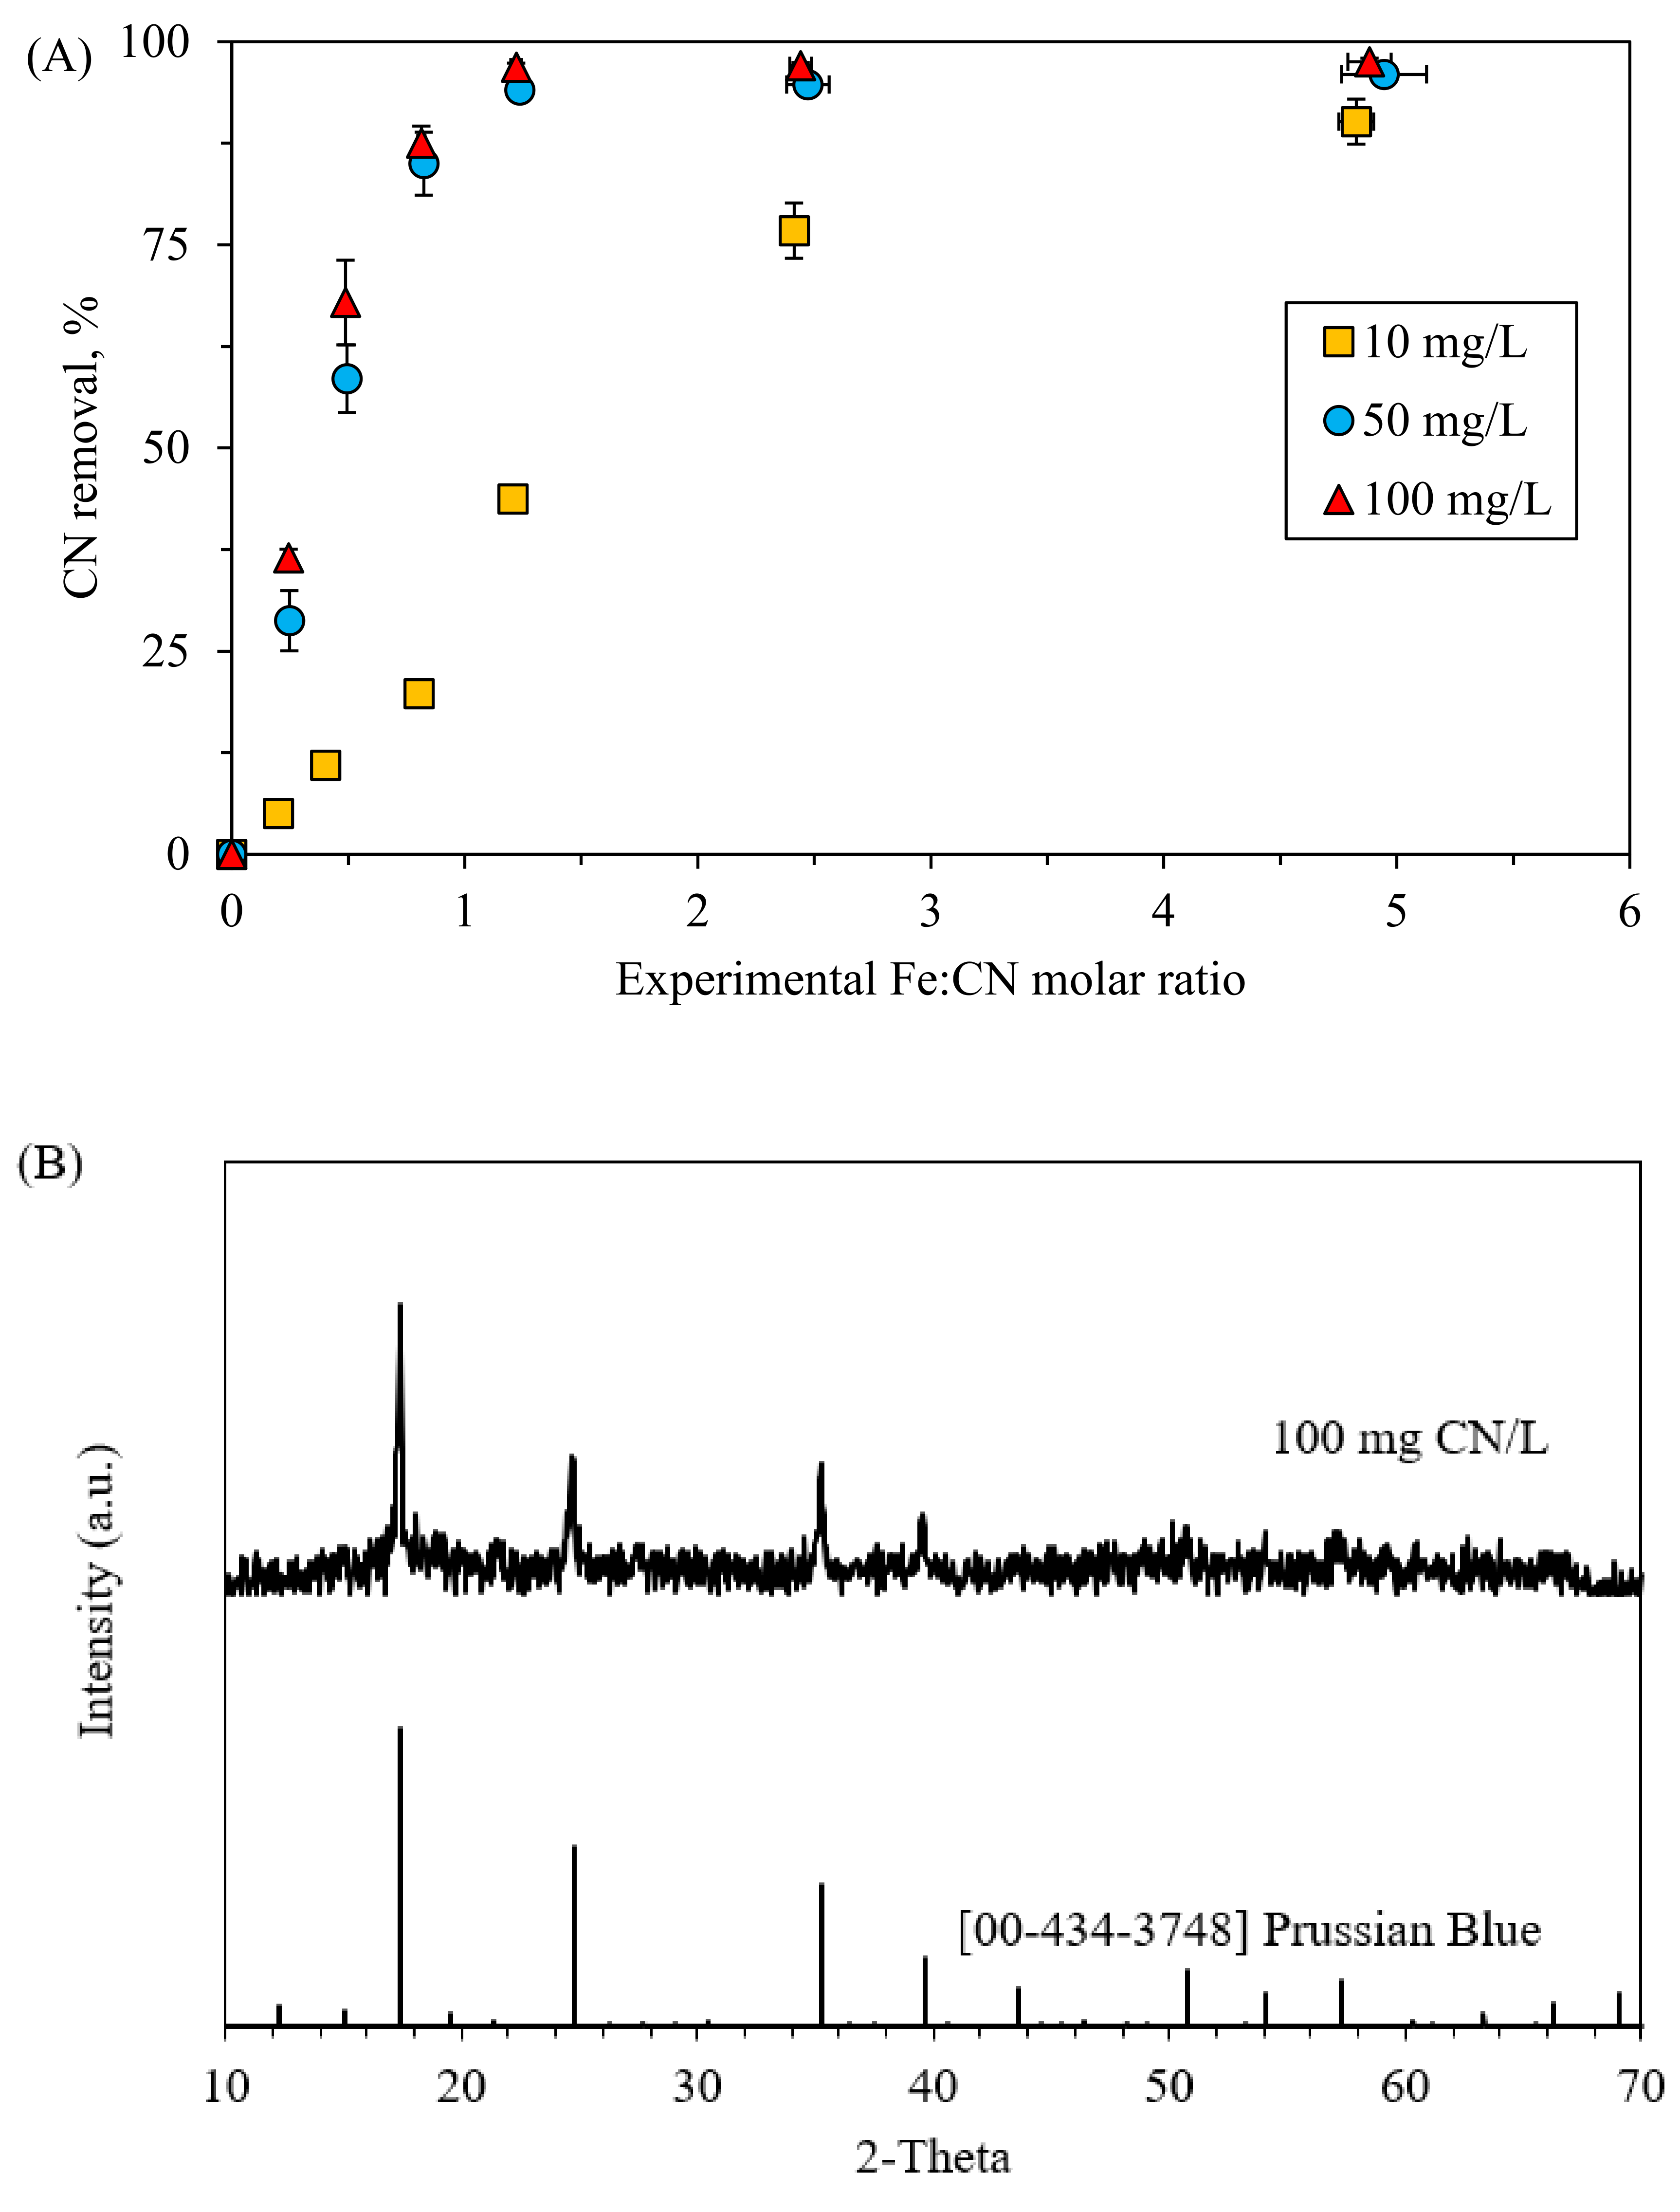
3.4. Effects of Initial CN− Concentrations
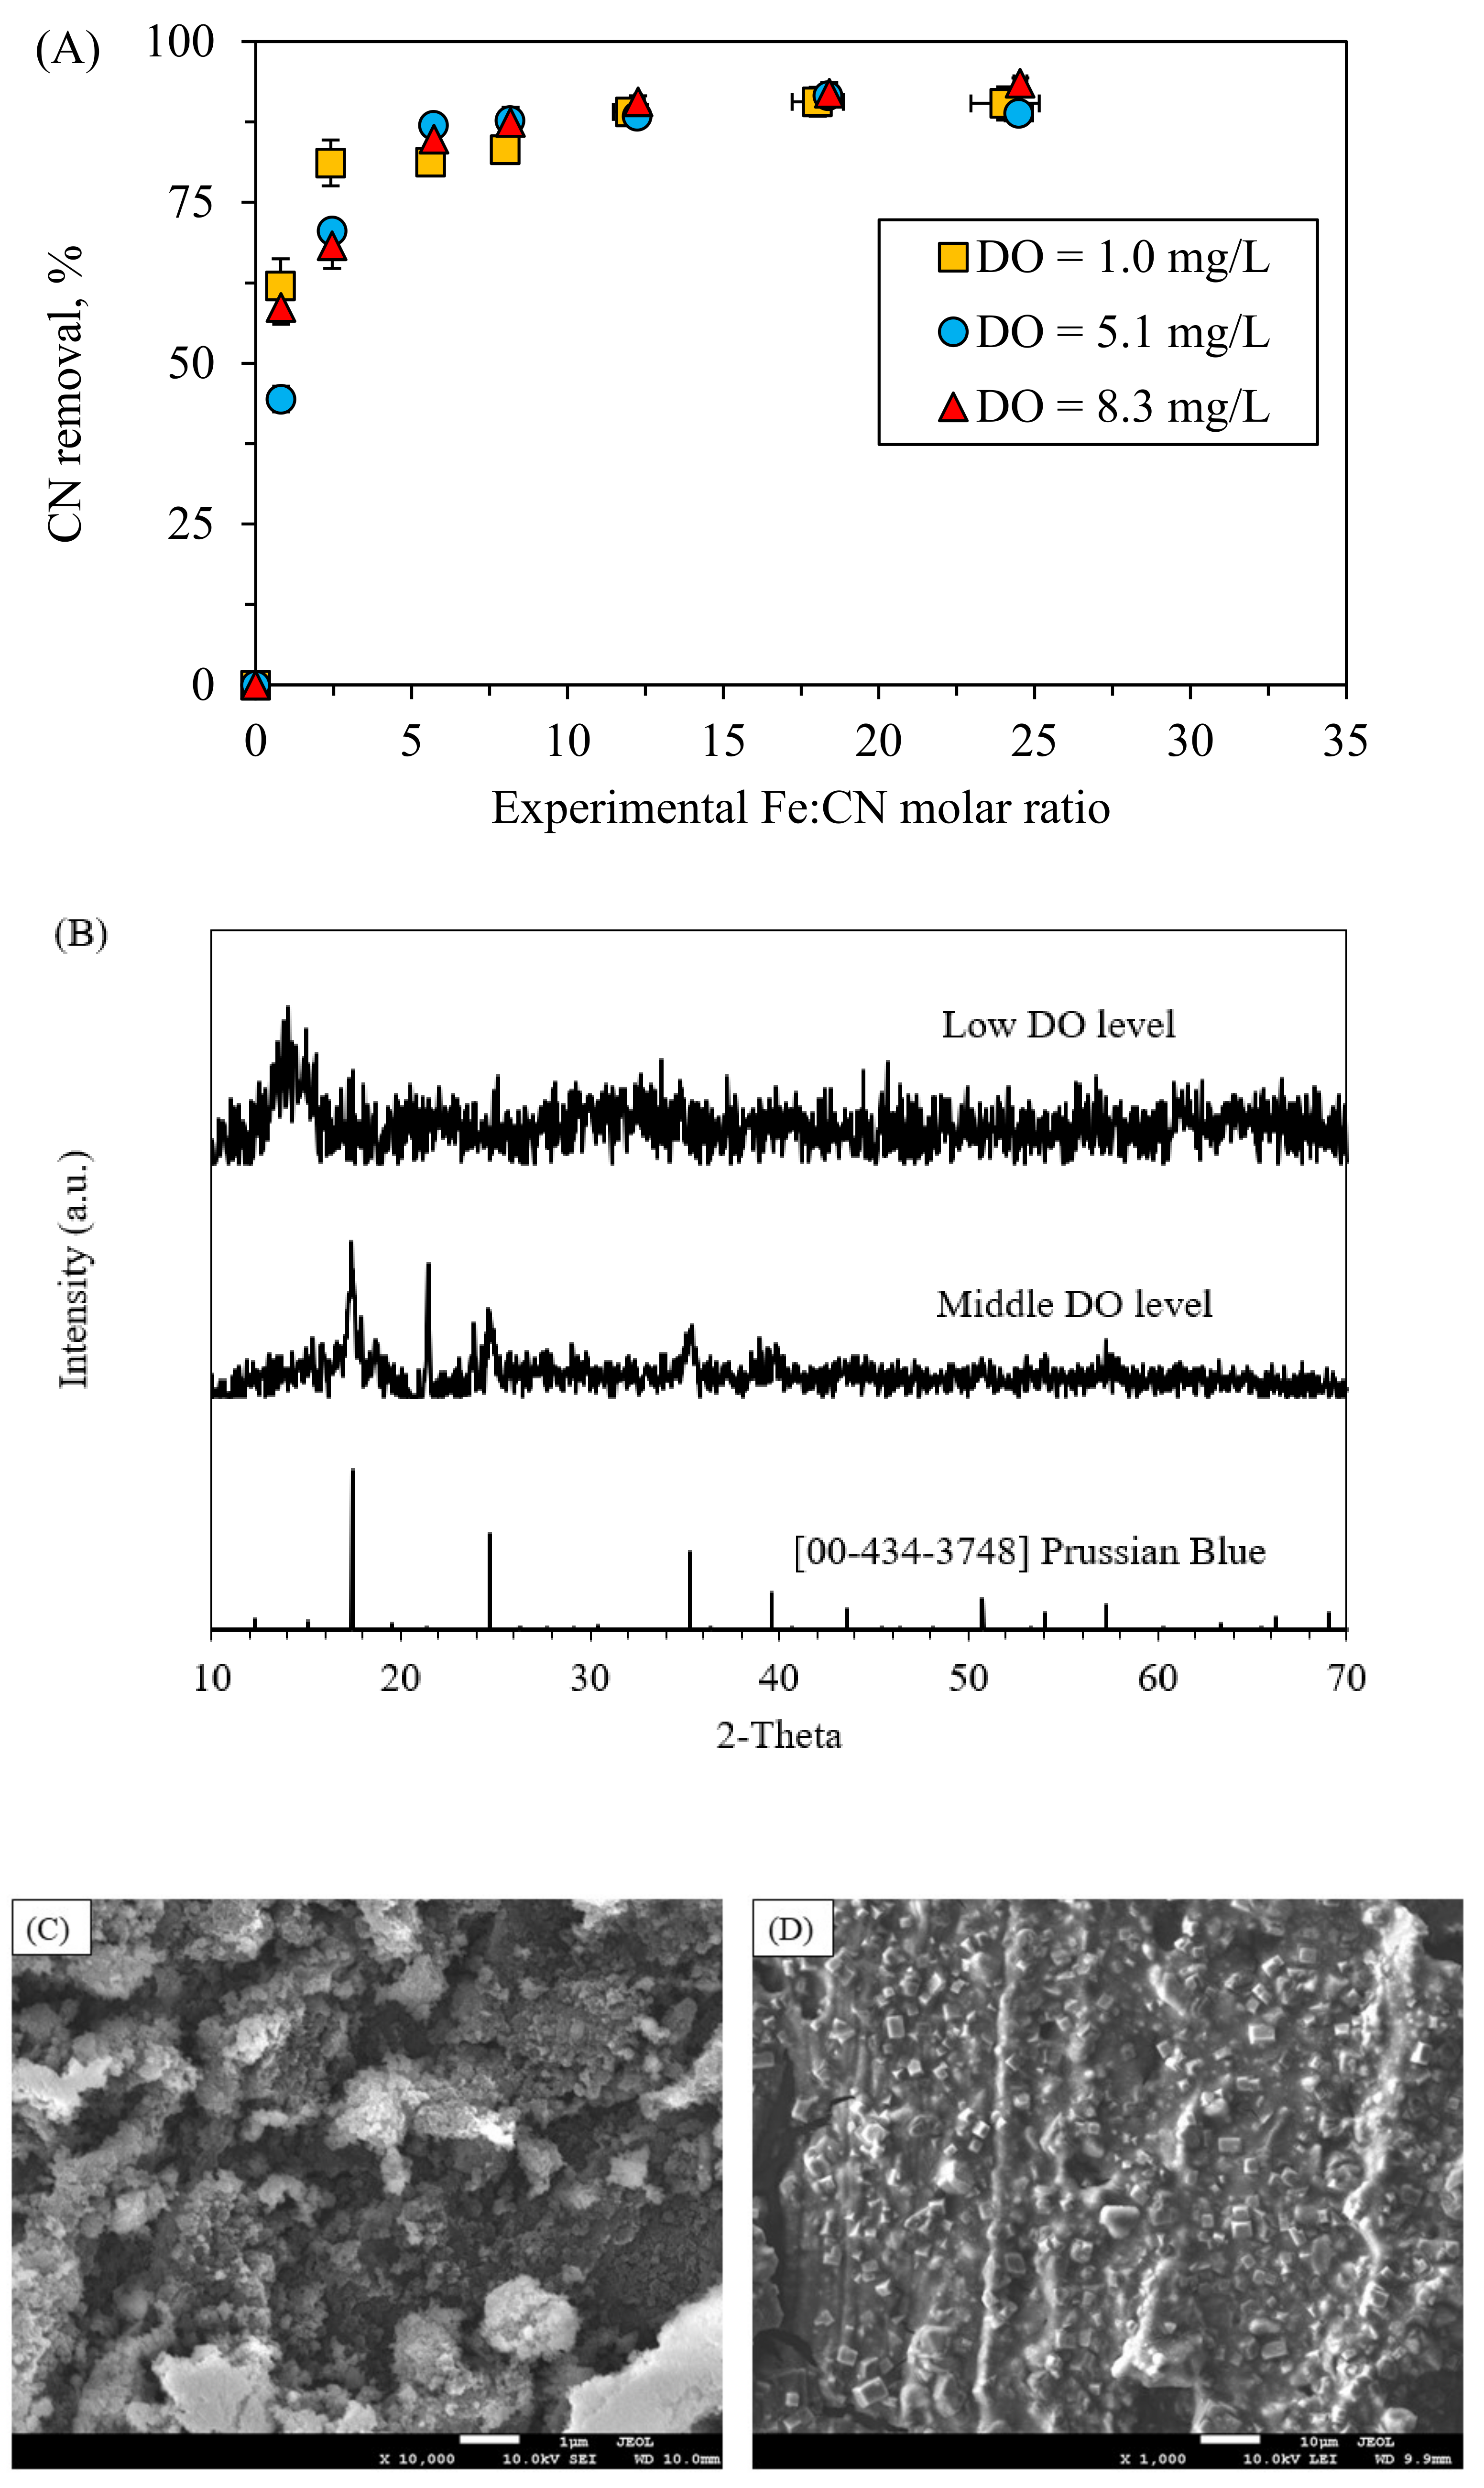
3.5. Effects of DO
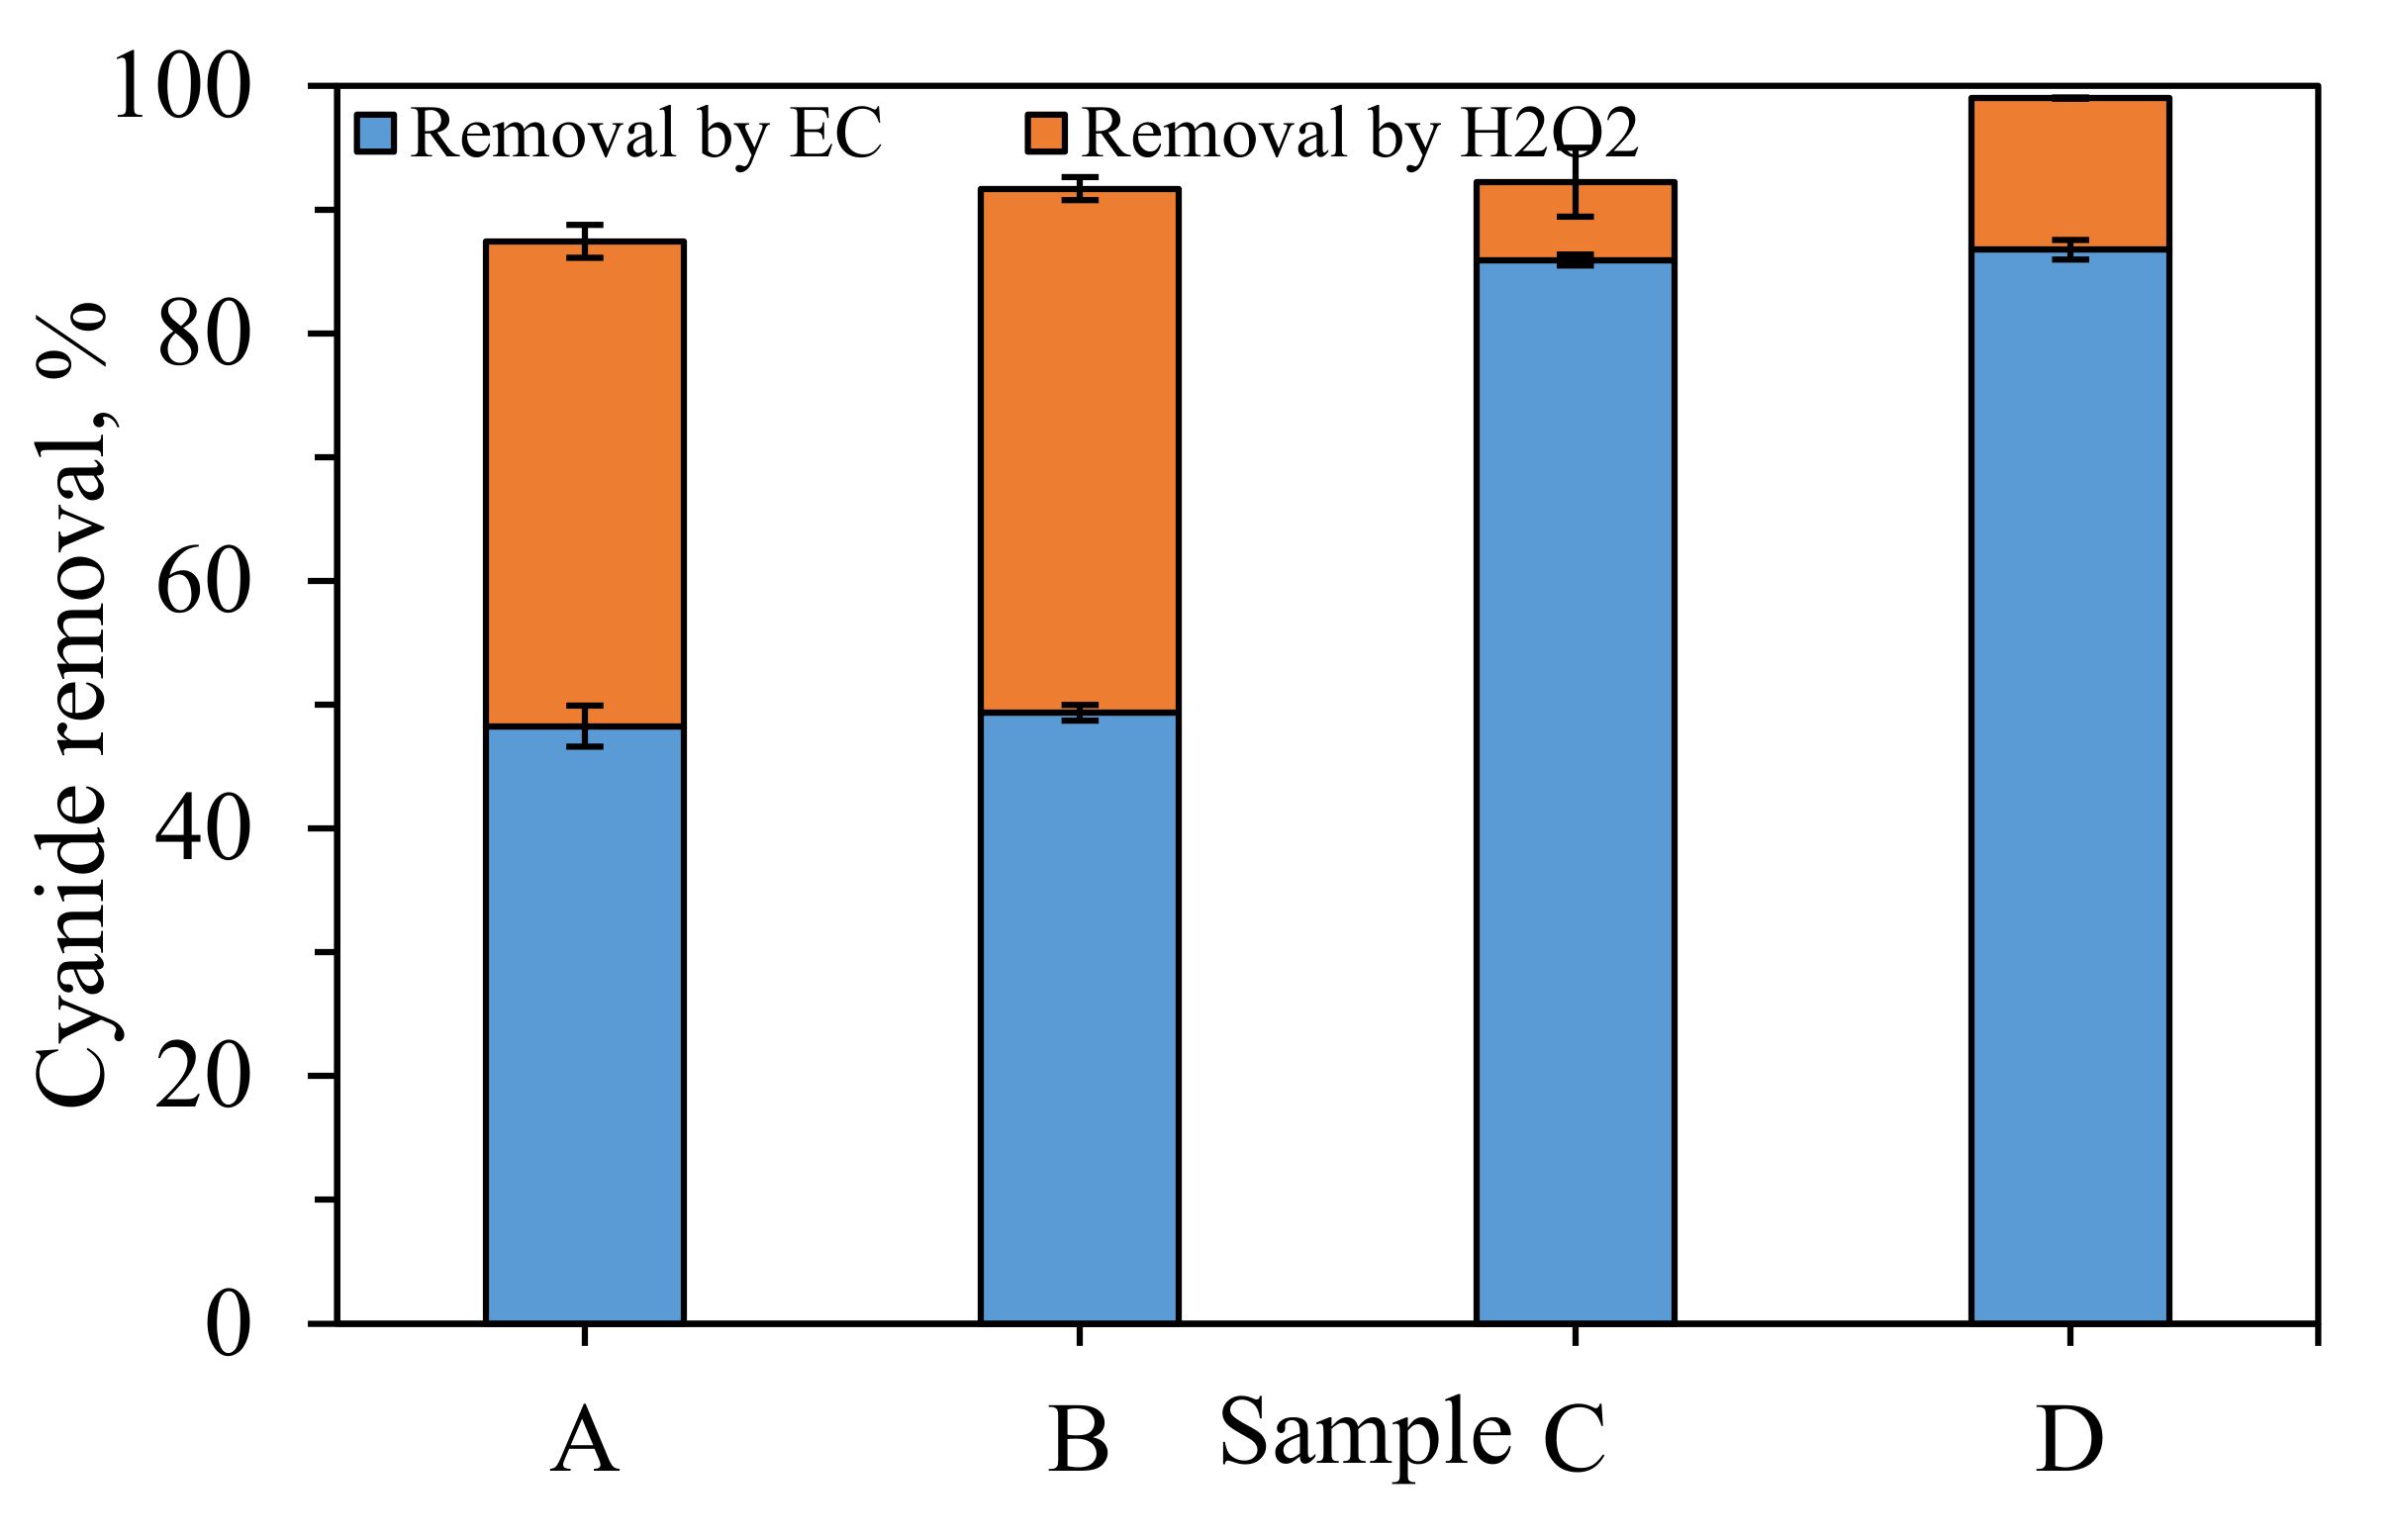
3.6. Post Treatment to Achieve the Discharge Limit Requirement
4. Conclusions
- Through the chemical equilibrium modeling, the optimal pH and Fe: CN− molar ratio were obtained. Prussian Blue was best formed at the pH ≤ 7 and the Fe:CN− molar ratio ≤ 1.5. The recovery rate of Prussian Blue should increase with increasing initial CN− concentration.
- The complexation of cyanide and iron prevented the vaporization of HCN at pH < 9.2. In contrast to alkaline chlorination, electrochemical crystallization process for CN− removal does not require high chemical costs for alkaline pH control.
- Cyanide was removed up to 45% at the Fe:CN− molar ratio of 0.8, pH of 7 and under middle DO level for the initial CN− concentration of 10 mg/L. Solid analysis showed the production of Prussian Blue in the pH range of 5–7.
- CN− removal increased with increasing initial CN− concentration. Where 88% of removal was achieved for an initial CN− concentration of 100 mg/L, only 20% of CN− was removed at initial CN− concentration of 10 mg/L for the same condition. Moreover, solid analysis revealed higher Prussian Blue quality with increasing initial CN− concentration.
- DO levels did not affect the cyanide removal. However, solid analysis showed a better quality of the recovery product under middle DO conditions.
- Polishing treatment by H2O2 oxidation was necessary to reach the discharge limit of 1 mg CN−/L with the H2O2:CN− molar ratio of 1.5. The cost of the total process was accessed as 1.9 USD/kg CN− treated for electrochemical process and 1.14 USD/kg CN− treated for post treatment.
- This process might be interesting for cyanide removal and recovery on rich cyanide electroplating wastewater, containing high concentrations of cyanide and heavy metals. However, other pollutants might interfere in the reaction between cyanide and iron. Further investigation might be done on industrial wastewater.
Supplementary Materials
Author Contributions
Funding
Institutional Review Board Statement
Informed Consent Statement
Data Availability Statement
Acknowledgments
Conflicts of Interest
References
- Lin, M.; Gu, Q.; Cui, X.; Liu, X. Cyanide Containing Wastewater Treatment by Ozone Enhanced Catalytic Oxidation over Diatomite Catalysts. MATEC Web Conf. 2018, 142, 1003. [Google Scholar] [CrossRef]
- Malinovic, B.N.N.; Djuricic, T.; Vucanovic, A. Influence of hydraulic retention time on cyanide removal by electrocoagulation process. J. Environ. Prot. Ecol. 2018, 19, 628–637. [Google Scholar]
- Botz, M.M. Overview of cyanide treatment methods. Gold Inst. 1999, 11, 28–30. [Google Scholar]
- Kuyucak, N.; Akcil, A. Cyanide and removal options from effluents in gold mining and metallurgical processes. Miner. Eng. 2013, 50–51, 13–29. [Google Scholar] [CrossRef]
- Ghosh, R.S.; Dzombak, D.A.; Luthy, R.G. Equilibrium precipitation and dissolution of iron cyanide solids in water. Environ. Eng. Sci. 1999, 16, 293–313. [Google Scholar] [CrossRef]
- Adams, M.D. The removal of cyanide from aqueous solution by the use of ferrous sulphate. J. S. Afr. Inst. Min. Metall. 1992, 92, 17–25. [Google Scholar]
- Yu, X.; Xu, R.; Wei, C.; Wu, H. Removal of cyanide compounds from coking wastewater by ferrous sulfate: Improvement of biodegradability. J. Hazard. Mater. 2016, 302, 468–474. [Google Scholar] [CrossRef] [PubMed]
- Chiang, Y.H. Research and Application of Prussian Blue in Modern Science. IOP Conf. Ser. Earth Environ. Sci. 2019, 384, 012005. [Google Scholar] [CrossRef]
- Mamelkina, M.A.; Herraiz-Carboné, M.; Cotillas, S.; Lacasa, E.; Sáez, C.; Tuunila, R.; Sillanpää, M.; Häkkinen, A.; Rodrigo, M.A. Treatment of mining wastewater polluted with cyanide by coagulation processes: A mechanistic study. Sep. Purif. Technol. 2020, 237, 116345. [Google Scholar] [CrossRef]
- Stumm, W. Chemistry of the Solid-Water Interface: Processes at the Mineral-Water and Particle-Water Interface in Natural Systems; Wiley-Interscience: New York, NY, USA, 1992. [Google Scholar]
- Lakshmanan, D.; Clifford, D.A.; Samanta, G. Ferrous and Ferric Ion Generation During Iron Electrocoagulation. Environ. Sci. Technol. 2009, 43, 3853–3859. [Google Scholar] [CrossRef] [PubMed]
- Meunier, N.; Drogui, P.; Montané, C.; Hausler, R.; Mercier, G.; Blais, J.F. Comparison between electrocoagulation and chemical precipitation for metals removal from acidic soil leachate. J. Hazard. Mater. 2006, 137, 581–590. [Google Scholar] [CrossRef] [PubMed]
- Moussavi, G.; Majidi, F.; Farzadkia, M. The influence of operational parameters on elimination of cyanide from wastewater using the electrocoagulation process. Desalination 2011, 280, 127–133. [Google Scholar] [CrossRef]
- Zhao, X.; Wang, H.; Chen, F.; Mao, R.; Liu, H.; Qu, J. Efficient treatment of an electroplating wastewater containing heavy metal ions, cyanide, and organics by H2O2 oxidation followed by the anodic Fenton process. Water Sci. Technol. 2013, 68, 1329–1335. [Google Scholar] [CrossRef] [PubMed]
- Merzouk, B.; Gourich, B.; Sekki, A.; Madani, K.; Vial, C.; Barkaoui, M. Studies on the decolorization of textile dye wastewater by continuous electrocoagulation process. Chem. Eng. J. 2009, 149, 207–214. [Google Scholar] [CrossRef]
- Elsahwi, E.S.; Hopp, C.E.; Dawson, F.P.; Ruda, H.E.; Kirk, D.W. Principles and Economic Considerations of Electrochemical Treatment of Cyanide-Laden Wastewater. IEEE Trans. Ind. Appl. 2019, 55, 3274–3286. [Google Scholar] [CrossRef]
- APHA. Standard Methods for the Examination of Water and Waste Water, 21st ed.; American Public Health Association: Washington, DC, USA, 2005; ISBN 0875530478. [Google Scholar]
- Gražulis, S.; Daškevič, A.; Merkys, A.; Chateigner, D.; Lutterotti, L.; Quirós, M.; Serebryanaya, N.R.; Moeck, P.; Downs, R.T.; Le Bail, A. Crystallography Open Database (COD): An open-access collection of crystal structures and platform for world-wide collaboration. Nucleic Acids Res. 2012, 40, 420–427. [Google Scholar] [CrossRef]
- Chuang, S.-M.; Ya, V.; Feng, C.-L.; Lee, S.-J.; Choo, K.-H.; Li, C.-W. Electrochemical Cr(VI) reduction using a sacrificial Fe anode: Impacts of solution chemistry and stoichiometry. Sep. Purif. Technol. 2018, 191, 167–172. [Google Scholar] [CrossRef]
- Sarla, M.; Pandit, M.; Tyagi, D.K.; Kapoor, J.C. Oxidation of cyanide in aqueous solution by chemical and photochemical process. J. Hazard. Mater. 2004, 116, 49–56. [Google Scholar] [CrossRef] [PubMed]
- Martin, N.; Ya, V.; Leewiboonsilp, N.; Choo, K.-H.; Noophan, P.; Li, C.-W. Electrochemical crystallization for phosphate recovery from an electronic industry wastewater effluent using sacrificial iron anodes. J. Clean. Prod. 2020, 276, 124234. [Google Scholar] [CrossRef]


| Authors | Process | Ci–Cf, mg/L | Fe:CN− Molar Ratio | pH | R, % |
|---|---|---|---|---|---|
| Yu et al. [7] | CP | 53.6–16.1 | 1.0 | 9 | 70 |
| Adams et al. [6] | CP | 265–2.6 | 0.5 | 5.5–6.5 | 99 |
| Mamelkina et al. [9] | CC | 100–85 | 46 | 12 | 15 |
| EC | 100–0.8 | 0.9 | 12 | 92 | |
| Zhao et al. [14] | EC | 75–39.9 | 1.7 | 4 | 47 |
| Moussavi et al. [13] | EC | 300–39 | 5.2 | 11.5 | 87 |
Publisher’s Note: MDPI stays neutral with regard to jurisdictional claims in published maps and institutional affiliations. |
© 2021 by the authors. Licensee MDPI, Basel, Switzerland. This article is an open access article distributed under the terms and conditions of the Creative Commons Attribution (CC BY) license (https://creativecommons.org/licenses/by/4.0/).
Share and Cite
Martin, N.; Ya, V.; Naddeo, V.; Choo, K.-H.; Li, C.-W. Cyanide Removal and Recovery by Electrochemical Crystallization Process. Water 2021, 13, 2704. https://doi.org/10.3390/w13192704
Martin N, Ya V, Naddeo V, Choo K-H, Li C-W. Cyanide Removal and Recovery by Electrochemical Crystallization Process. Water. 2021; 13(19):2704. https://doi.org/10.3390/w13192704
Chicago/Turabian StyleMartin, Natacha, Vinh Ya, Vincenzo Naddeo, Kwang-Ho Choo, and Chi-Wang Li. 2021. "Cyanide Removal and Recovery by Electrochemical Crystallization Process" Water 13, no. 19: 2704. https://doi.org/10.3390/w13192704