Abstract
Denitrification processes are crucial in aquaculture as they convert the undesirable nitrate to safer forms of nitrogen. Conventionally, plastic media are used for the biofiltration of wastewater. However, alternative media may be as effective/better than plastic and enhance the sustainability of the system. This study evaluated biochar and zeolite as alternatives for the denitrification of aquaculture effluents. Triplicates of laboratory-scale bioreactors were fabricated to compare the denitrification efficiencies of biochar and zeolite to that of plastic. The bioreactors were fed synthetic aquaculture wastewater having nitrate loading rates of 50, 125, and 150 mg/L. Zeolite exhibited highest values of surface roughness in terms of arithmetic mean height (0.89 µm), maximum height (6.52 µm), and root-mean-square height (1.17 µm), as corroborated by surface profilometry and scanning electron microscopy. The results revealed that under pseudo-steady-state conditions, zeolite displayed the highest nitrate removal efficiency (maximum 95.02 ± 0.01%), which was followed by biochar and plastic (maximum 92.91 ± 0.01% and 92.57 ± 0.02%, respectively) due to its extraordinary surface roughness that provided better adhesion to the bacteria. However, by the end of the study, all the media exhibited comparable rates. Thus, both zeolite and biochar are sustainable alternatives of biomedia for nitrate removal. However, time and labor constraints must be accounted for to scale-up such bioreactors.
1. Introduction
Aquatic food production has transitioned from capture fisheries to aquaculture in order to provide protein to an ever-increasing world population. By 2014, the contribution of cultured fish for human consumption was at par with wild-caught fish. Thus, the 2030 Agenda for Sustainable Development of the United Nations recognizes the contribution of aquaculture and fisheries in ensuring food security and nutrition for posterity with simultaneous overall sustainable development [1,2,3]. The advancement of humankind is conditional on the steady supply of food and energy. The domain of energy has been explored by numerous researchers worldwide [4,5,6,7,8]. To meet the growing protein demand and to supply fish for human consumption, aquaculture has shifted toward intensive practices with a recirculating aquaculture system (RAS). The uneaten protein-rich fish feed, fish excreta, and other nutrients can augment the nitrate–nitrogen level in aquaculture effluents to as high as 100 mg/L [9,10,11,12,13]. Without optimal treatment, such nutrient-rich effluents can lead to eutrophication and algal bloom in receiving water bodies, endanger aquatic organisms, and cause methemoglobinemia in infants [14,15,16]. Thus, biofiltration systems with biofilter media as its core composition are an integral component of RAS for bringing about denitrification [17,18,19].
The denitrification process of converting nitrate to nitrogen gas follows the reaction [20]:
where CH2O represents an organic compound. Conventionally, plastic materials are used as biofilter media in RAS. Although plastic media possess good denitrification potential, they require high maintenance, need to be managed, and must be disposed of after being used up. The decommissioning phase of the plastic media also contributes to the environmental footprint. The high cost of plastic media is a key constraint in the application of media-based biofiltration for the denitrification of water.
5CH2O + 4NO3− → 2N2 + 5CO2 + 3H2O + 4OH
Many researchers have studied alternative organic media for the remediation of wastewater from different sources. Soares and Abeliovich [21] employed wheat straw as biofilter media and as a carbon source to remediate drinking water. Similarly, Kim et al. [22] and Robertson et al. [23] have also used wood chips and wood by-products for treating stormwater runoff and septic tank effluents. Knapik and Stopa [24] used sunflower pith as media to examine the sorption and filtration properties of sunflower fibers in a raw state for treating oily wastewater. For the treatment of aquaculture effluents, Saliling et al. [25] investigated the feasibility of two low-cost agricultural by-products viz. wheat straw and wood chips as biofilter media in denitrification reactors. However, wheat straw has a relatively short life span, which poses a hindrance in its widespread application.
Biochar and zeolite are two other biomaterials that can be used for nitrate removal in denitrifying bioreactors due to their high porosity and high specific surface area that is conducive for the adhesion of bacterial colonies. Bock et al. [26,27] had used biochar in denitrifying bioreactors treating agricultural drainage wastewater for enhanced nitrate as well as phosphate removal compared to wood chips. The potential of biochar has also been harnessed for the removal of mixed contaminants from urban stormwater runoff [28]. Li et al. [29] had further packed biochar chips from porous palm residues in a two-phase trickling biofilter for treating simulated wastewater with high concentration levels of nitrogen and phosphorous. Sidibe [30] had also explored biochar (generated from Salix leaves) along with pine bark and activated charcoal as filter materials for the treatment of greywater for subsequent reuse in agriculture. Likewise, zeolite has also been used as biofilter media in many studies for nitrate removal from surface water [31], ammonia and suspended solids removal using aerated filter from textile wastewater [32], nitrogen removal from high-strength wastewater generated from fertilizer and tannery industries [33], and for denitrification in an anoxic activated sludge [34]. Thus, both biochar and zeolite have been explored for the removal of diverse contaminants from various types of wastewater. Yet, there is a research gap on the use of these materials as biofilter media/physical support for bacterial growth for the treatment of aquaculture wastewater specifically for the process of denitrification. Hence, the use of these materials as potential biofilter media for the denitrification of aquaculture wastewater is yet to be adequately explored. Consequently, the focus of this study is to investigate the potential of pine-derived biochar and natural zeolite as alternative biofilter media for the denitrification of aquaculture wastewater having low, intermediate, and high nitrate levels. The performance of these alternative media was compared to that of commercially available plastic media (control). Furthermore, the physical characteristics of the media types were also analyzed to further the understanding of the role of these biomaterials in bacterial growth.
2. Materials and Methods
2.1. Experimental Design
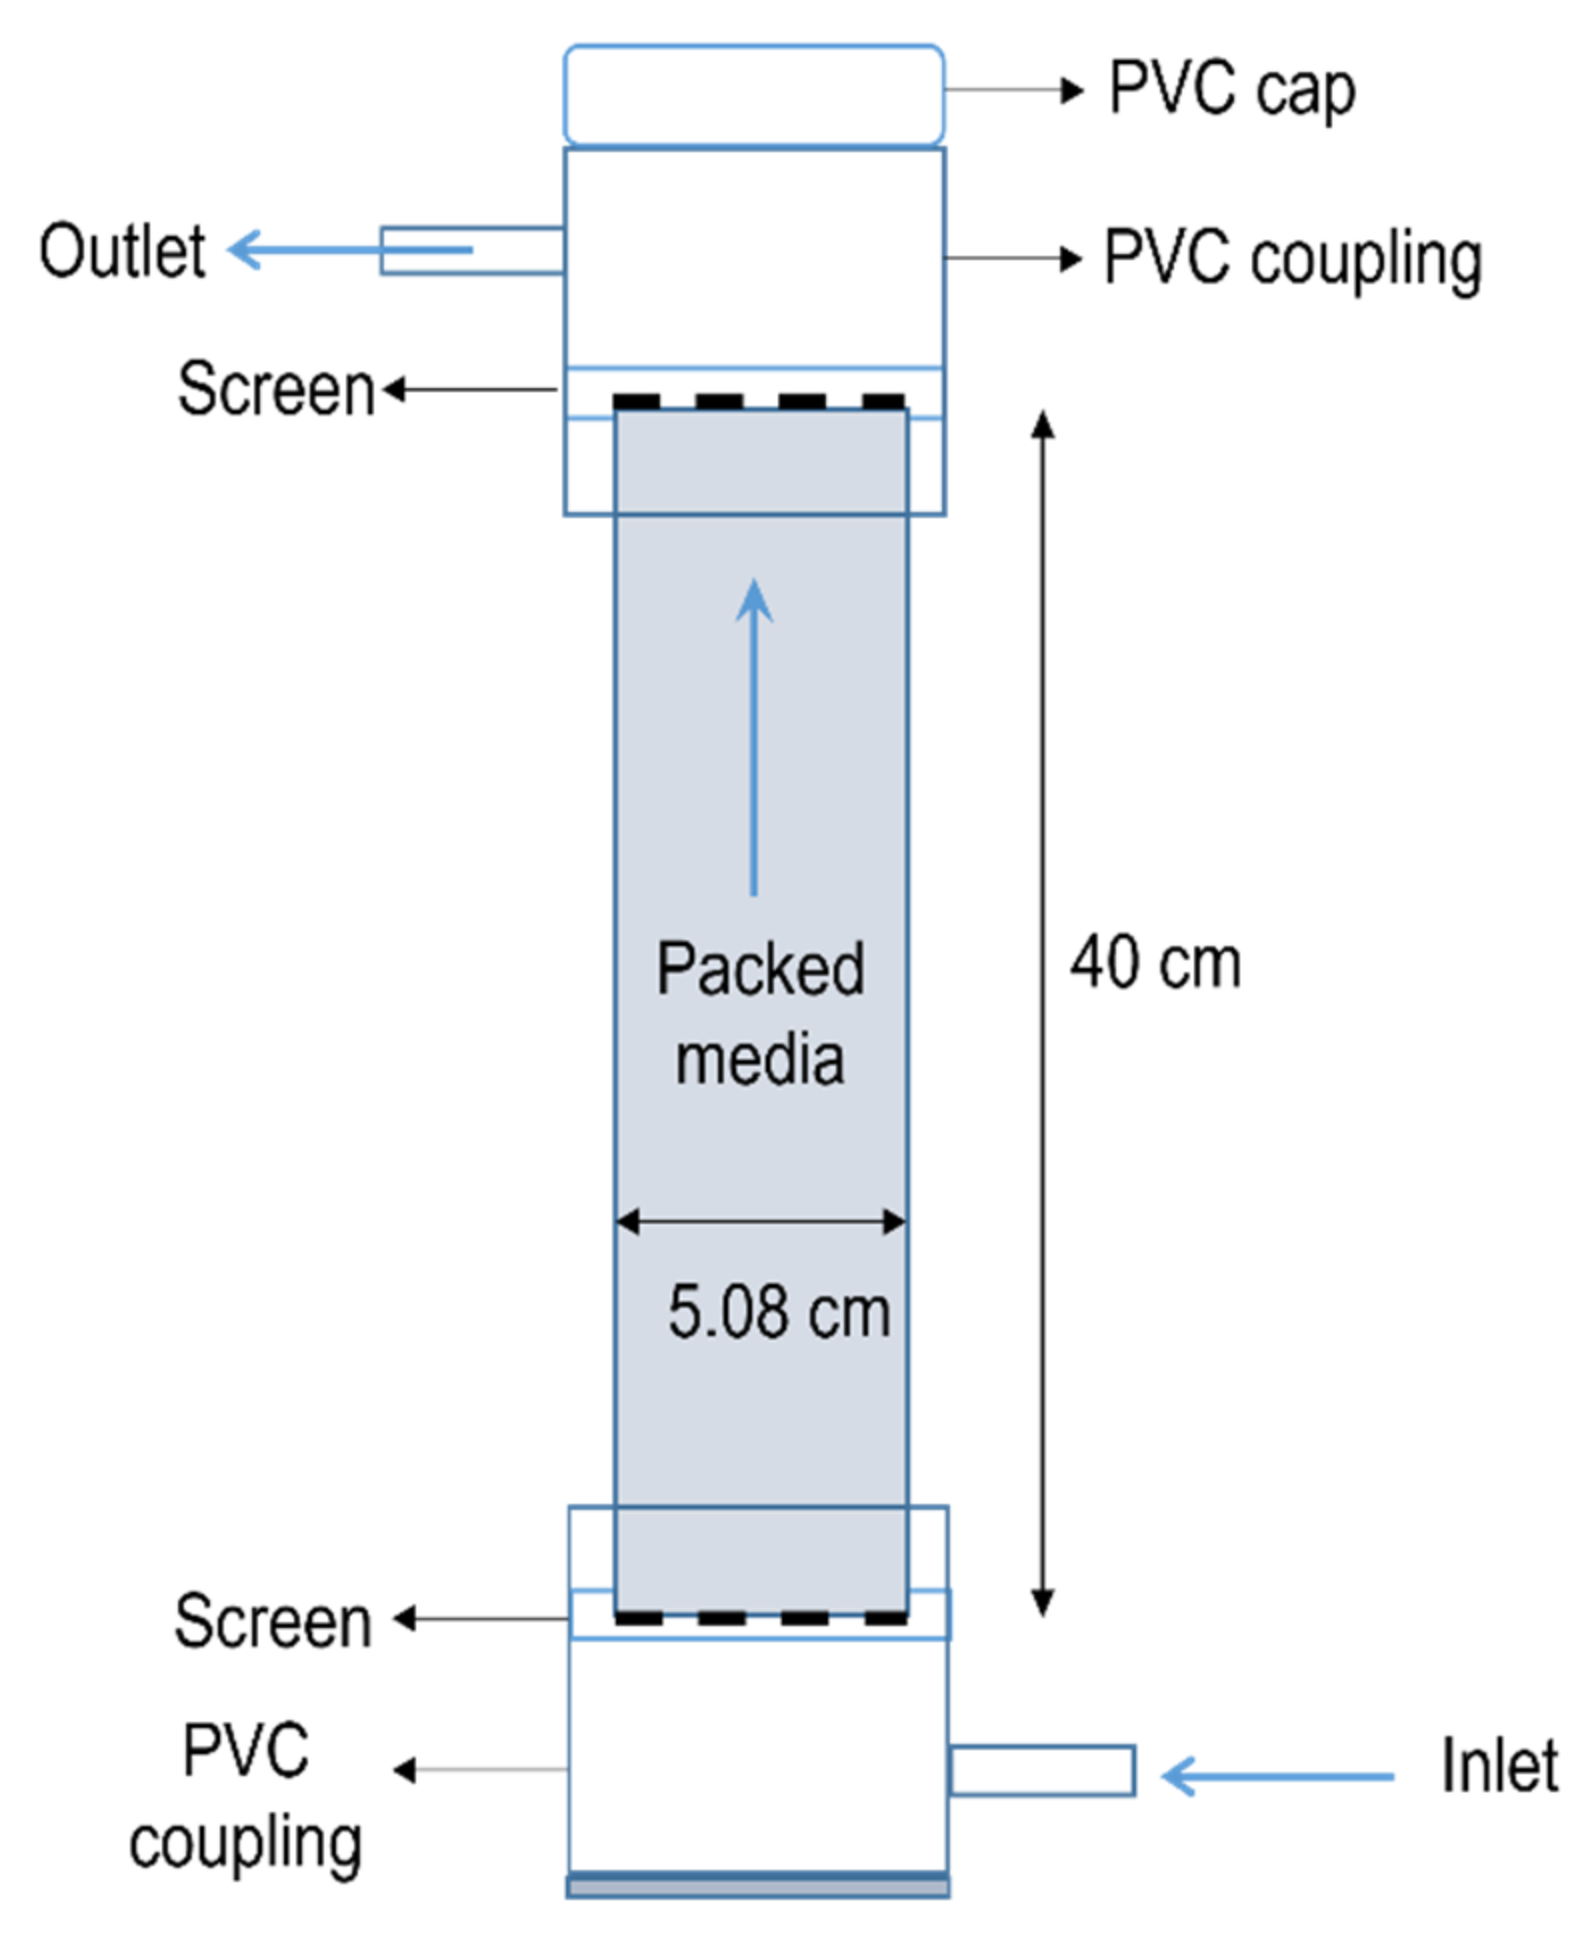
Nine 0.8 L laboratory-scale bioreactors (Figure 1) were fabricated using 5.08 cm (2-inch internal diameter) diameter PVC pipes. These bioreactors were fed synthetic aquaculture wastewater whose composition has been described by Saliling et al. [25]. Each bioreactor was 40 cm in length and its ends were covered with plastic mesh in order to hold the biofilter media inside the bioreactor. The top of the PVC pipe was fitted with PVC coupling and cap (5.08 cm diameter each), and the bottom was fitted to another PVC coupling and fixed on a base. Holes were bored in the PVC couplings and fitted with NPT adapters (0.635 cm and barbed) to serve as inlet and outlet. Clear vinyl tubing (0.635 cm) was attached to the inlets and outlets of the bioreactors for the delivery of wastewater.

Figure 1.
The design of the upflow denitrification bioreactor employed in this study.
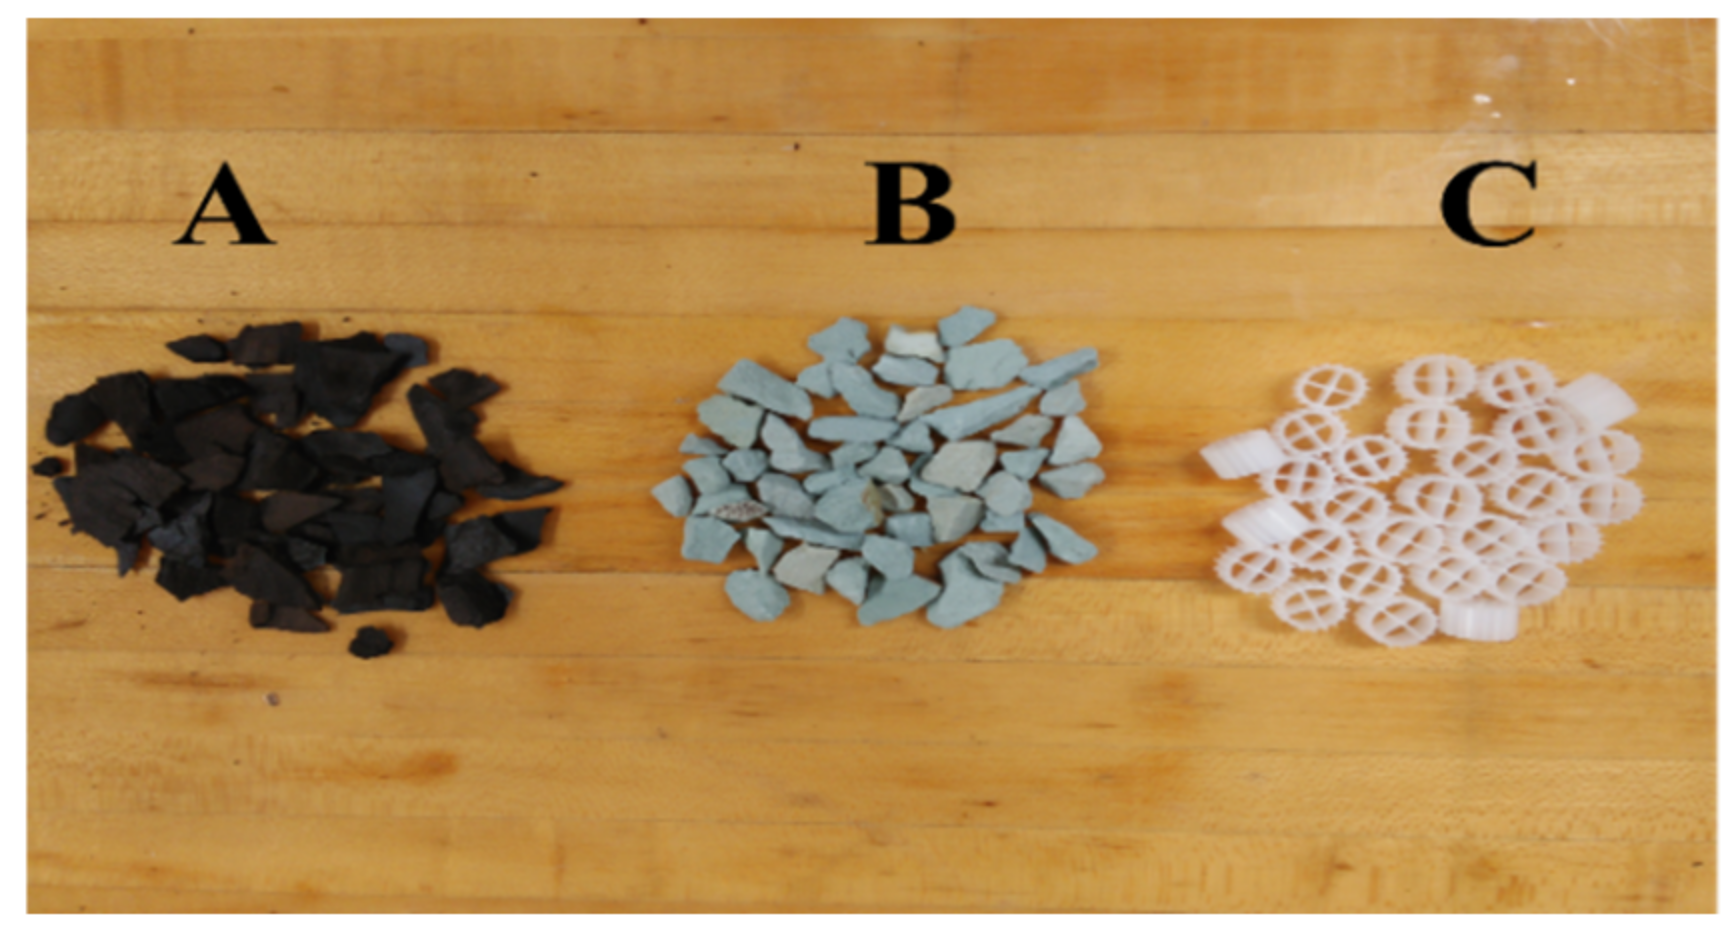
Three types of media have been packed in these bioreactors: pine-derived biochar, zeolite (Zeoderizer, Glacial Rivers), and plastic media (Sweetwater SWX bio-media, Pentair) as presented in Figure 2. The choice of porous media was based on properties such as chemical inertness and excellent surface area scalability [35,36,37]. The plastic media are made from 100% high-density polyethylene with a diameter of 1 cm and a height of 0.7 cm. Pine nuggets (obtained locally) were pretreated, which included washing and air drying. Then, the nuggets were pyrolyzed in an electric kiln at 350 °C for 4 h with a continuous flow of nitrogen gas. The obtained biochar nuggets were chipped so that the particles were in the range of 0.9–2 cm in length and 0.3–0.6 cm in thickness. The zeolite rocks were approximately 0.8–1.5 cm in length and 0.6–1.2 cm in height. Each type of filter media was randomly assigned to three bioreactors.
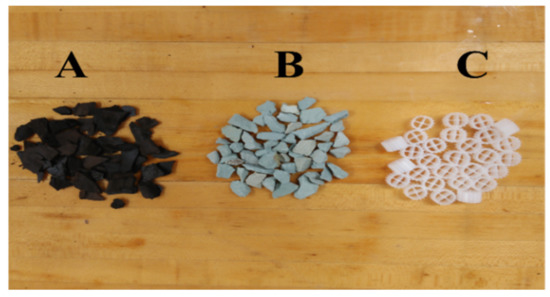
Figure 2.
The three different biofiltration media used in this study: (A) biochar, (B) zeolite, and (C) plastic.
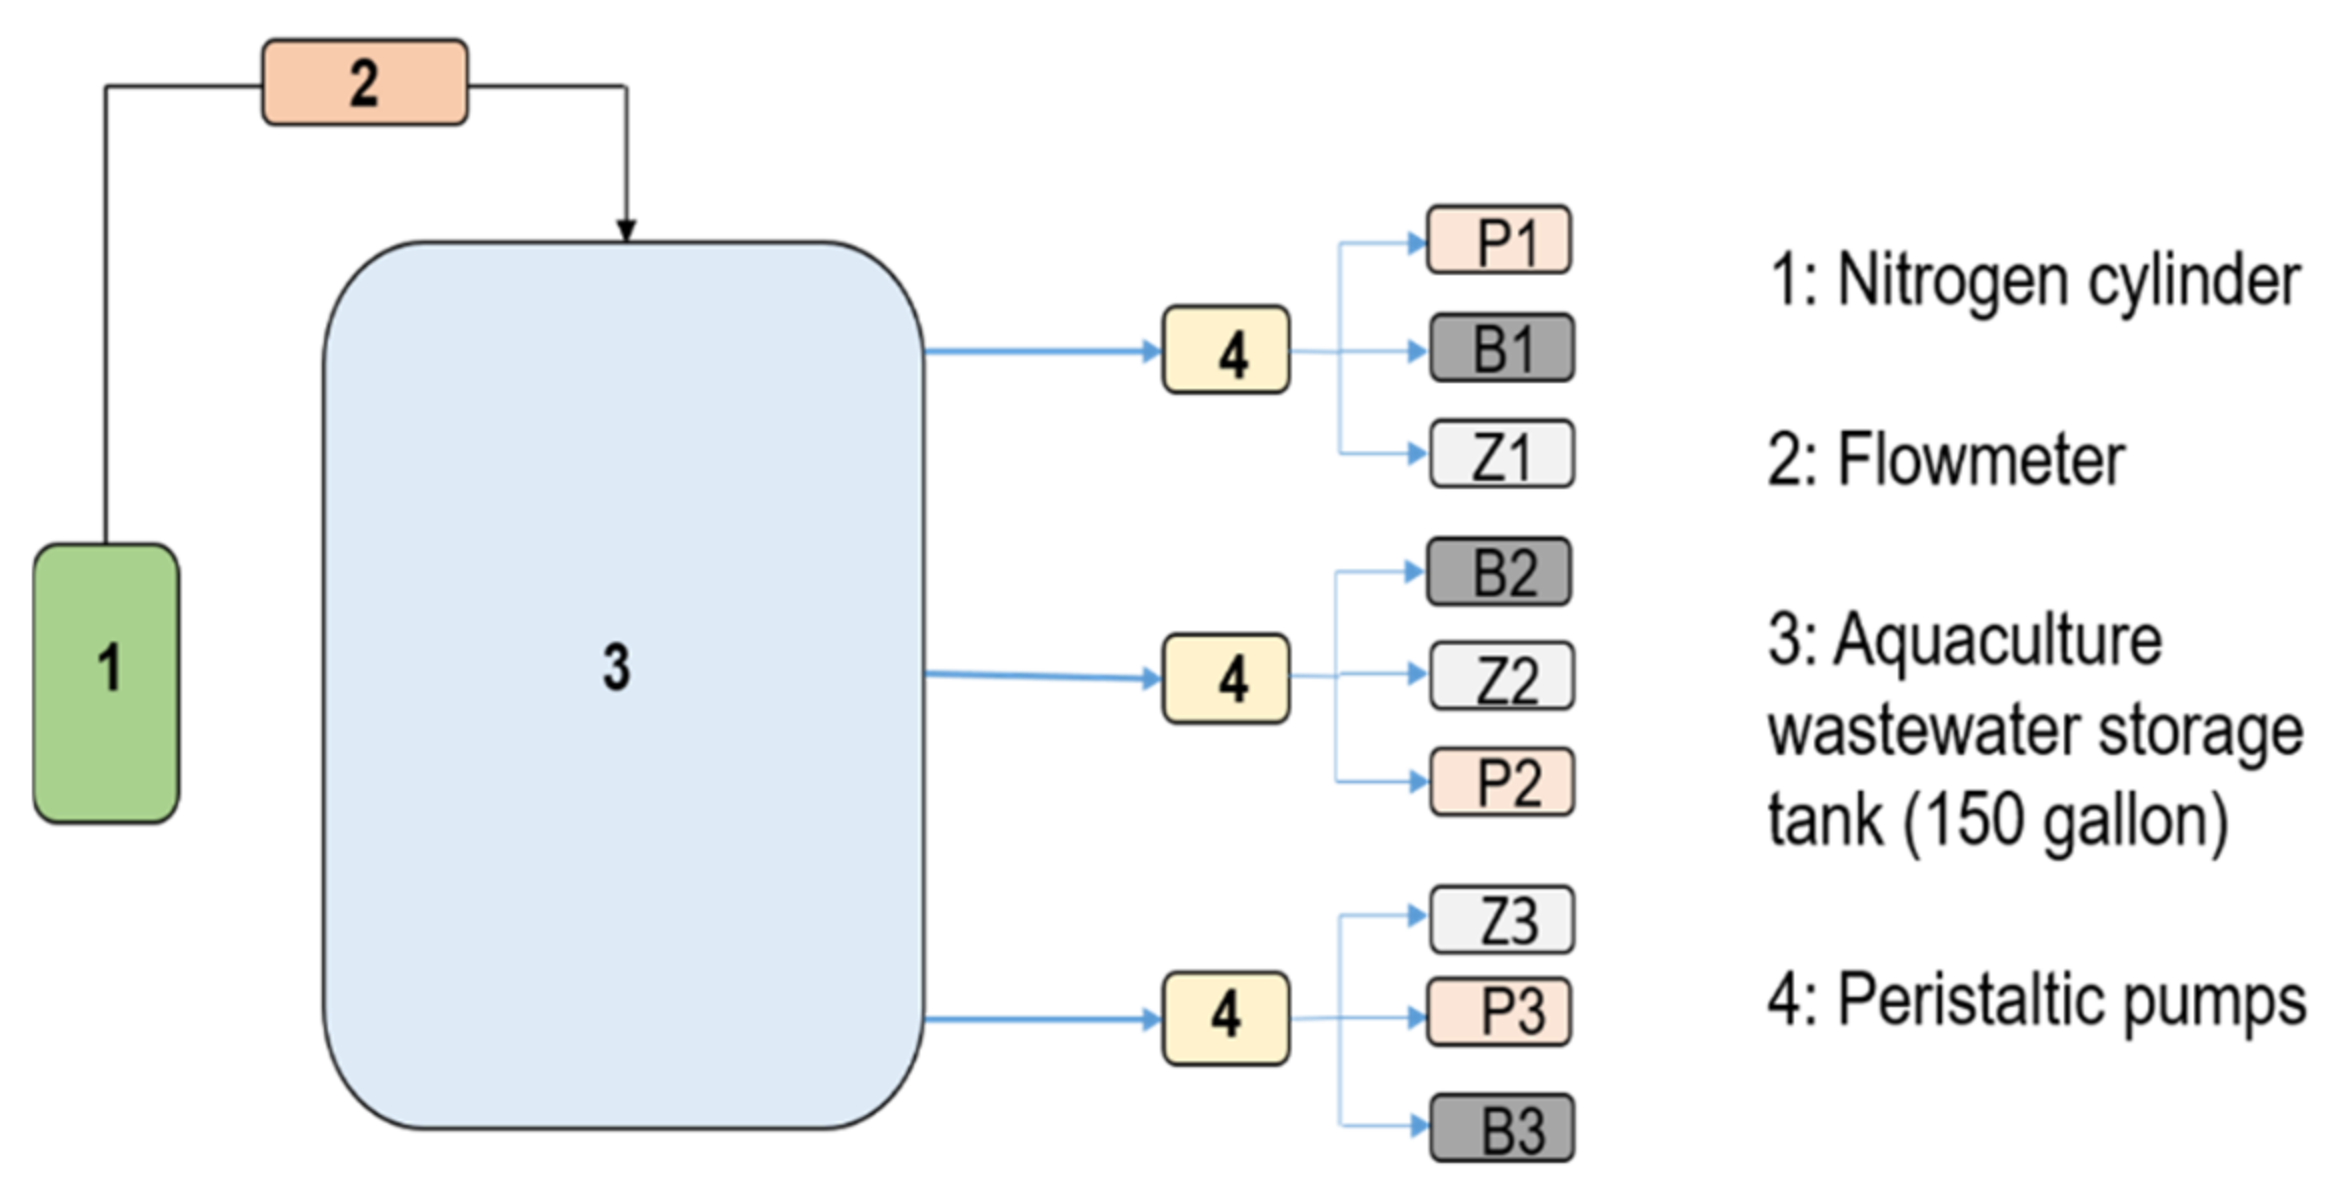
The experimental setup also consisted of a 567.8 L (150 gallons) wastewater storage tank. Once filled, this tank had the capacity for a continuous supply of aquaculture wastewater to the nine bioreactors for a week. Nitrogen gas was bubbled by diffuser stones at the bottom of the storage tank to retain low levels of dissolved oxygen (DO) inside it. The inlet line of nitrogen was connected to a flowmeter for monitoring purposes. The inlet and outlets of the storage tank were sealed with silicone to diminish the passage of air inside the tank and avoid the passive oxygenation of the wastewater. Wastewater from the storage tank was supplied to the packed upflow bioreactors using three identical peristaltic pumps (Intllab). Each pump fed wastewater to three bioreactors having each type of media (tests were run in triplicate). The influent flow rate of wastewater to each bioreactor was 8 mL/min. The schematic of the layout of the experimental setup is presented in Figure 3.

Figure 3.
The layout of the different components of the experimental set-up.
These nine bioreactors were initially filled with the supernatant collected from the tilapia tanks in the Grinnells Laboratory of the university. This supernatant served as an inoculum for the bioreactors and is expected to have denitrifiers for nitrate reduction. The reactors were run in a batch mode for 10 days, during which period the nitrate concentration was monitored. After observing a reduction in nitrate concentration, the reactors were operated in a continuous mode flow-through mode with synthetic aquaculture wastewater. This synthetic aquaculture wastewater had three different loading rates of nitrate–nitrogen: 50, 125, and 150 mg/L. The reactors were fed synthetic wastewater for approximately 9 cycles (of 3 days each) per concentration level. This increasing trend of loading rate of nitrate–nitrogen was used to simulate the increase in nitrate concentration in aquaculture water along with the growth of fish and the increased feeding regime. The source of nitrate in this synthetic aquaculture wastewater was fertilizer-grade sodium nitrate and methanol (MeOH) was used as the source of carbon. A MeOH/nitrate–nitrogen ratio of 2.5 was used in the study in accordance with the findings of Saliling et al. [25].
2.2. Water Quality Analysis
The effluent and influent water samples were collected and analyzed for nitrate–nitrogen (Hach DR3900; TNT835 and TNT836). The effluent samples were also monitored for nitrite (Hach-TNT839), ammonia (Hach-TNT830), pH (Extech-pH100), water temperature, alkalinity (Hach-TNT870), DO (Extech-407510), oxidation-reduction potential (ORP; Extech RE300), and chemical oxygen demand (COD; Hach-TNT821). The nitrate–nitrogen concentration and DO was measured once every 3 days, while other parameters were measured once a week. The denitrification rate was calculated by the following equation:
where Q is the flow rate (mL/min), Vm is the bulk volume of media (cm3), and (NO3-N)i and (NO3-N)e are the influent and effluent nitrate–nitrogen concentrations, respectively.
2.3. Characterization of Biofilter Media
The surface morphology of biochar, zeolite, and plastic media was studied by scanning electron microscopy (SEM; Hitachi S3200N) in their pristine conditions as well as after being retrieved from the denitrification bioreactors when bacterial development had been initiated. The samples having bacterial development were first fixed with 3% glutaraldehyde and washed with graded alcohol before SEM analysis. To enhance the imaging quality for SEM, the samples were coated with Au-Pd (total thickness of 70 nm) for 10 min. The surface profilometry of biochar, zeolite, and plastic media was examined by employing a confocal laser scanning microscope (CLSM, Keyence VKx1100). The CLSM generated 3D optical images and a measure of the surface roughness of the three media by coupling optical microscopy with laser profilometry with subsequent analysis by the multifile software. The laser used in this technique comprises violet and white light excitation sources of 404 nm. The surface roughness of each media has been presented in terms of Sa (arithmetic mean height), Sz (maximum height), and Sq (root mean square height). Further information about the acidity of biofilter media was obtained by determining the pH at the point of zero charge (pHPZC) by pH drift method as outlined by Paul et al. [38] and Kolar and Jin [39].
2.4. Statistical Analysis
Statistical analyses were carried out using R to check if the type of media used had a statistically significant effect on the effluent nitrate–nitrogen concentration. Furthermore, a regression model (Equation (3)) was employed to compare the nitrate–nitrogen removal efficiency by time for each media type. This was conducted by splitting the influent nitrate–nitrogen concentration into three blocks corresponding to 50, 125, and 150 mg/L.
where media is a three-level factor variable (biochar, zeolite, and plastic), and € represents errors that are independent and identically distributed.
log(effluent) = day + media + (day x media) + €
Finally, Tukey’s HSD was employed to check whether there is a difference in effluent nitrate–nitrogen concentration among the three types of media on a particular sample collection day. This method compared the mean effluent nitrate–nitrogen concentration among the three media. Here, bootstrapping was used to re-sample and obtain a large number of samples to fulfill the Central Limit Theorem for normality. The statistical codes are available in the Supplementary Material S1.
3. Results
3.1. Performance of Bioreactors
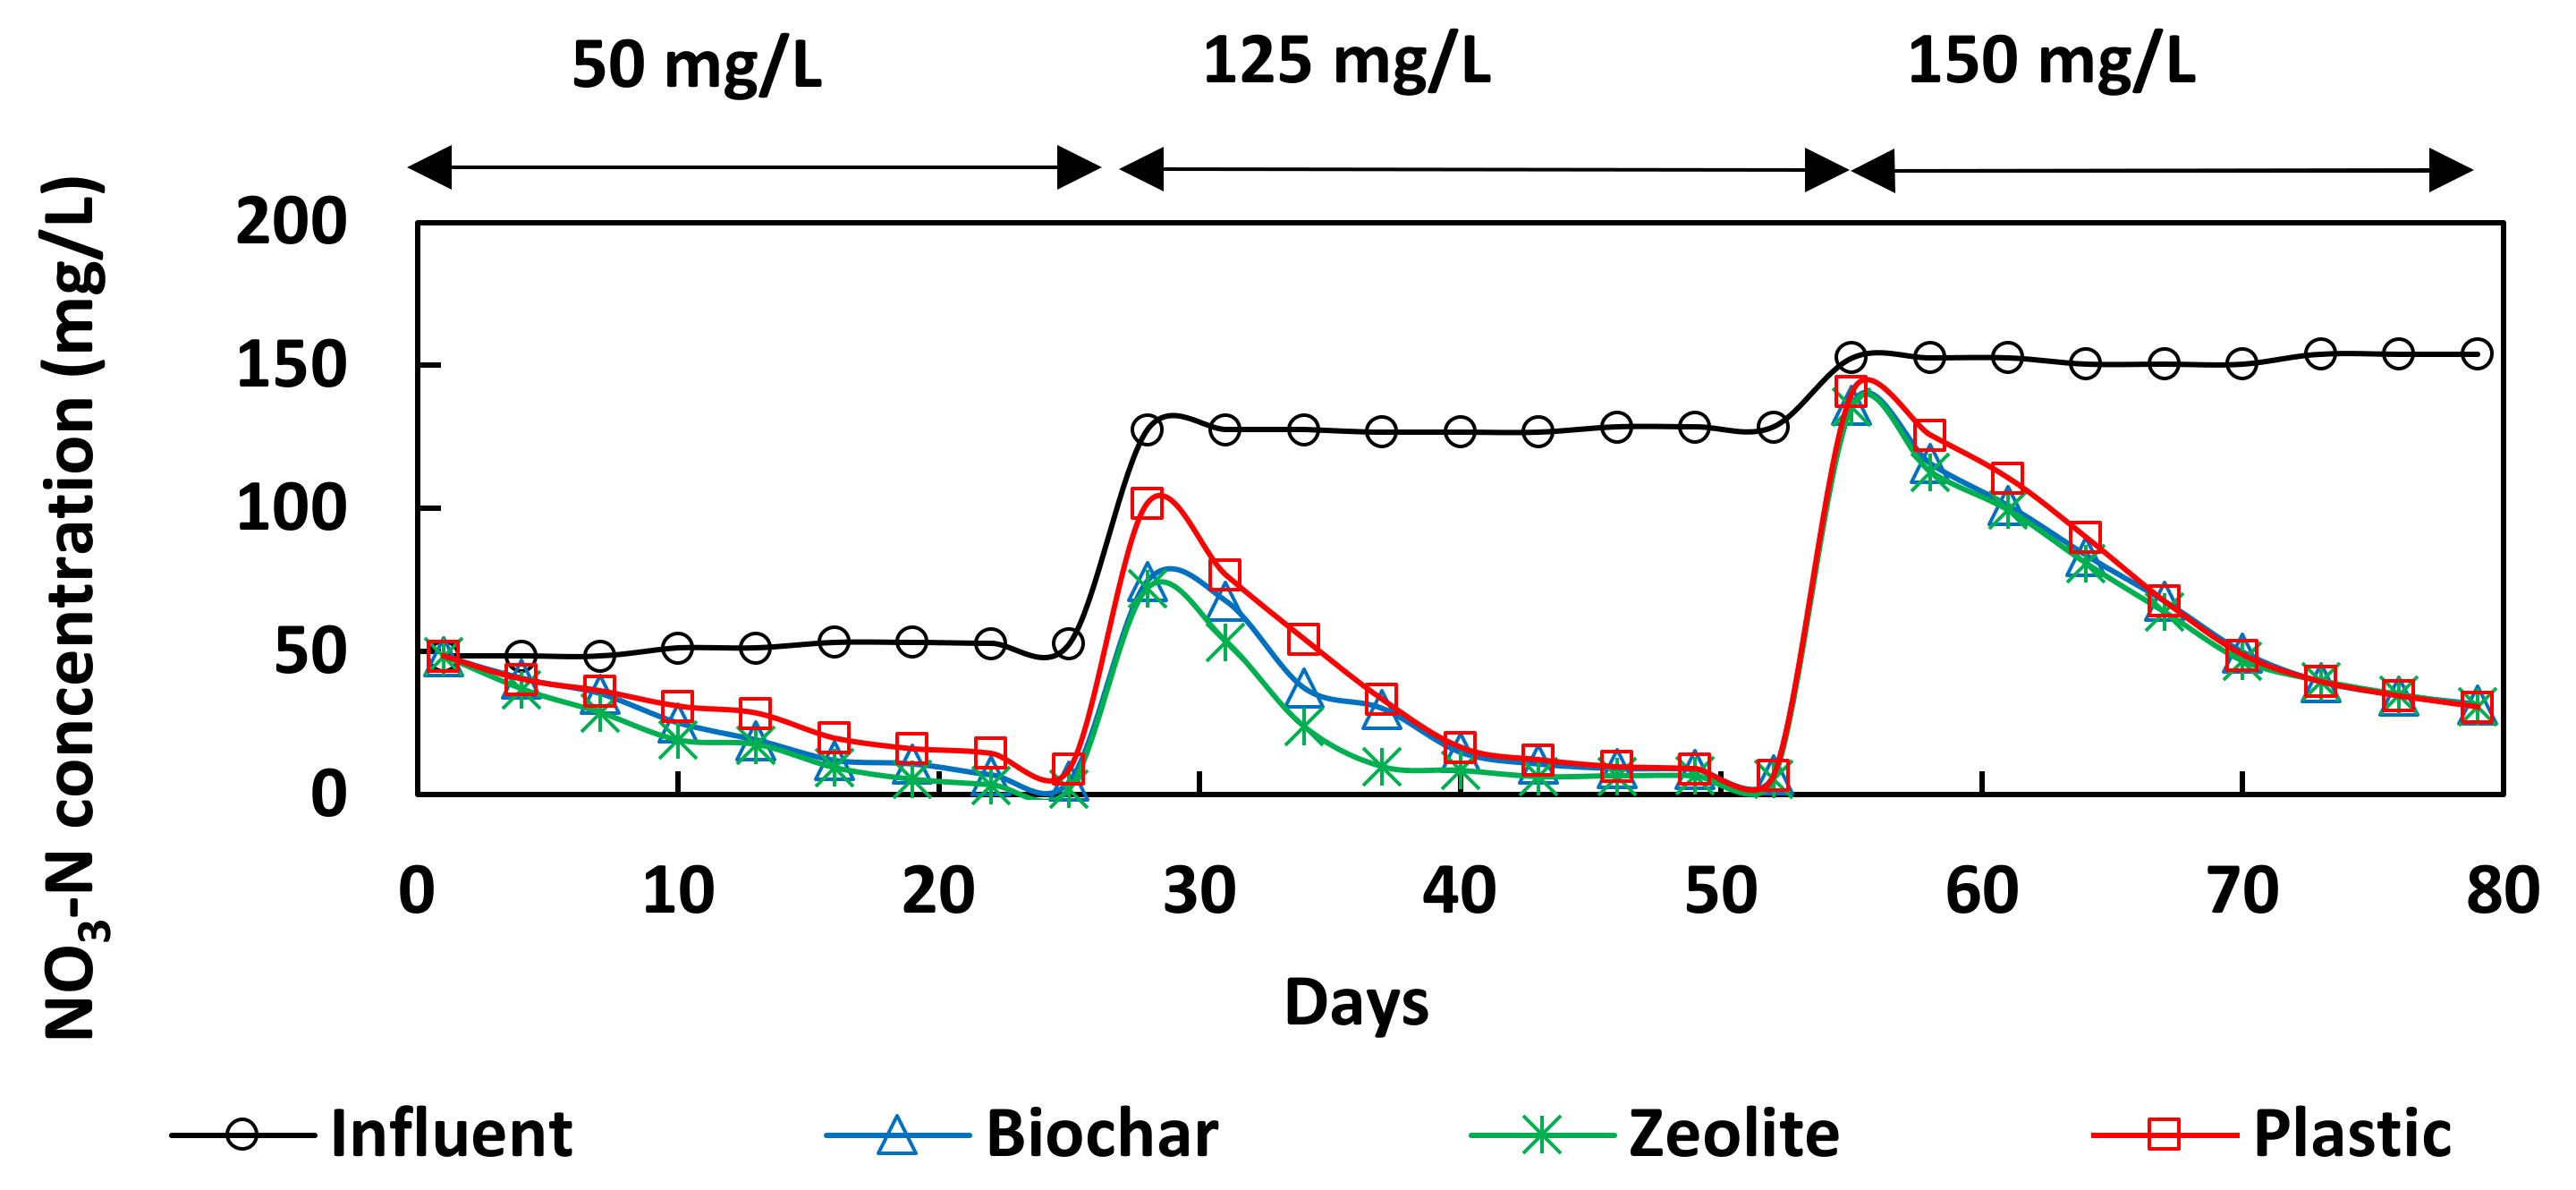
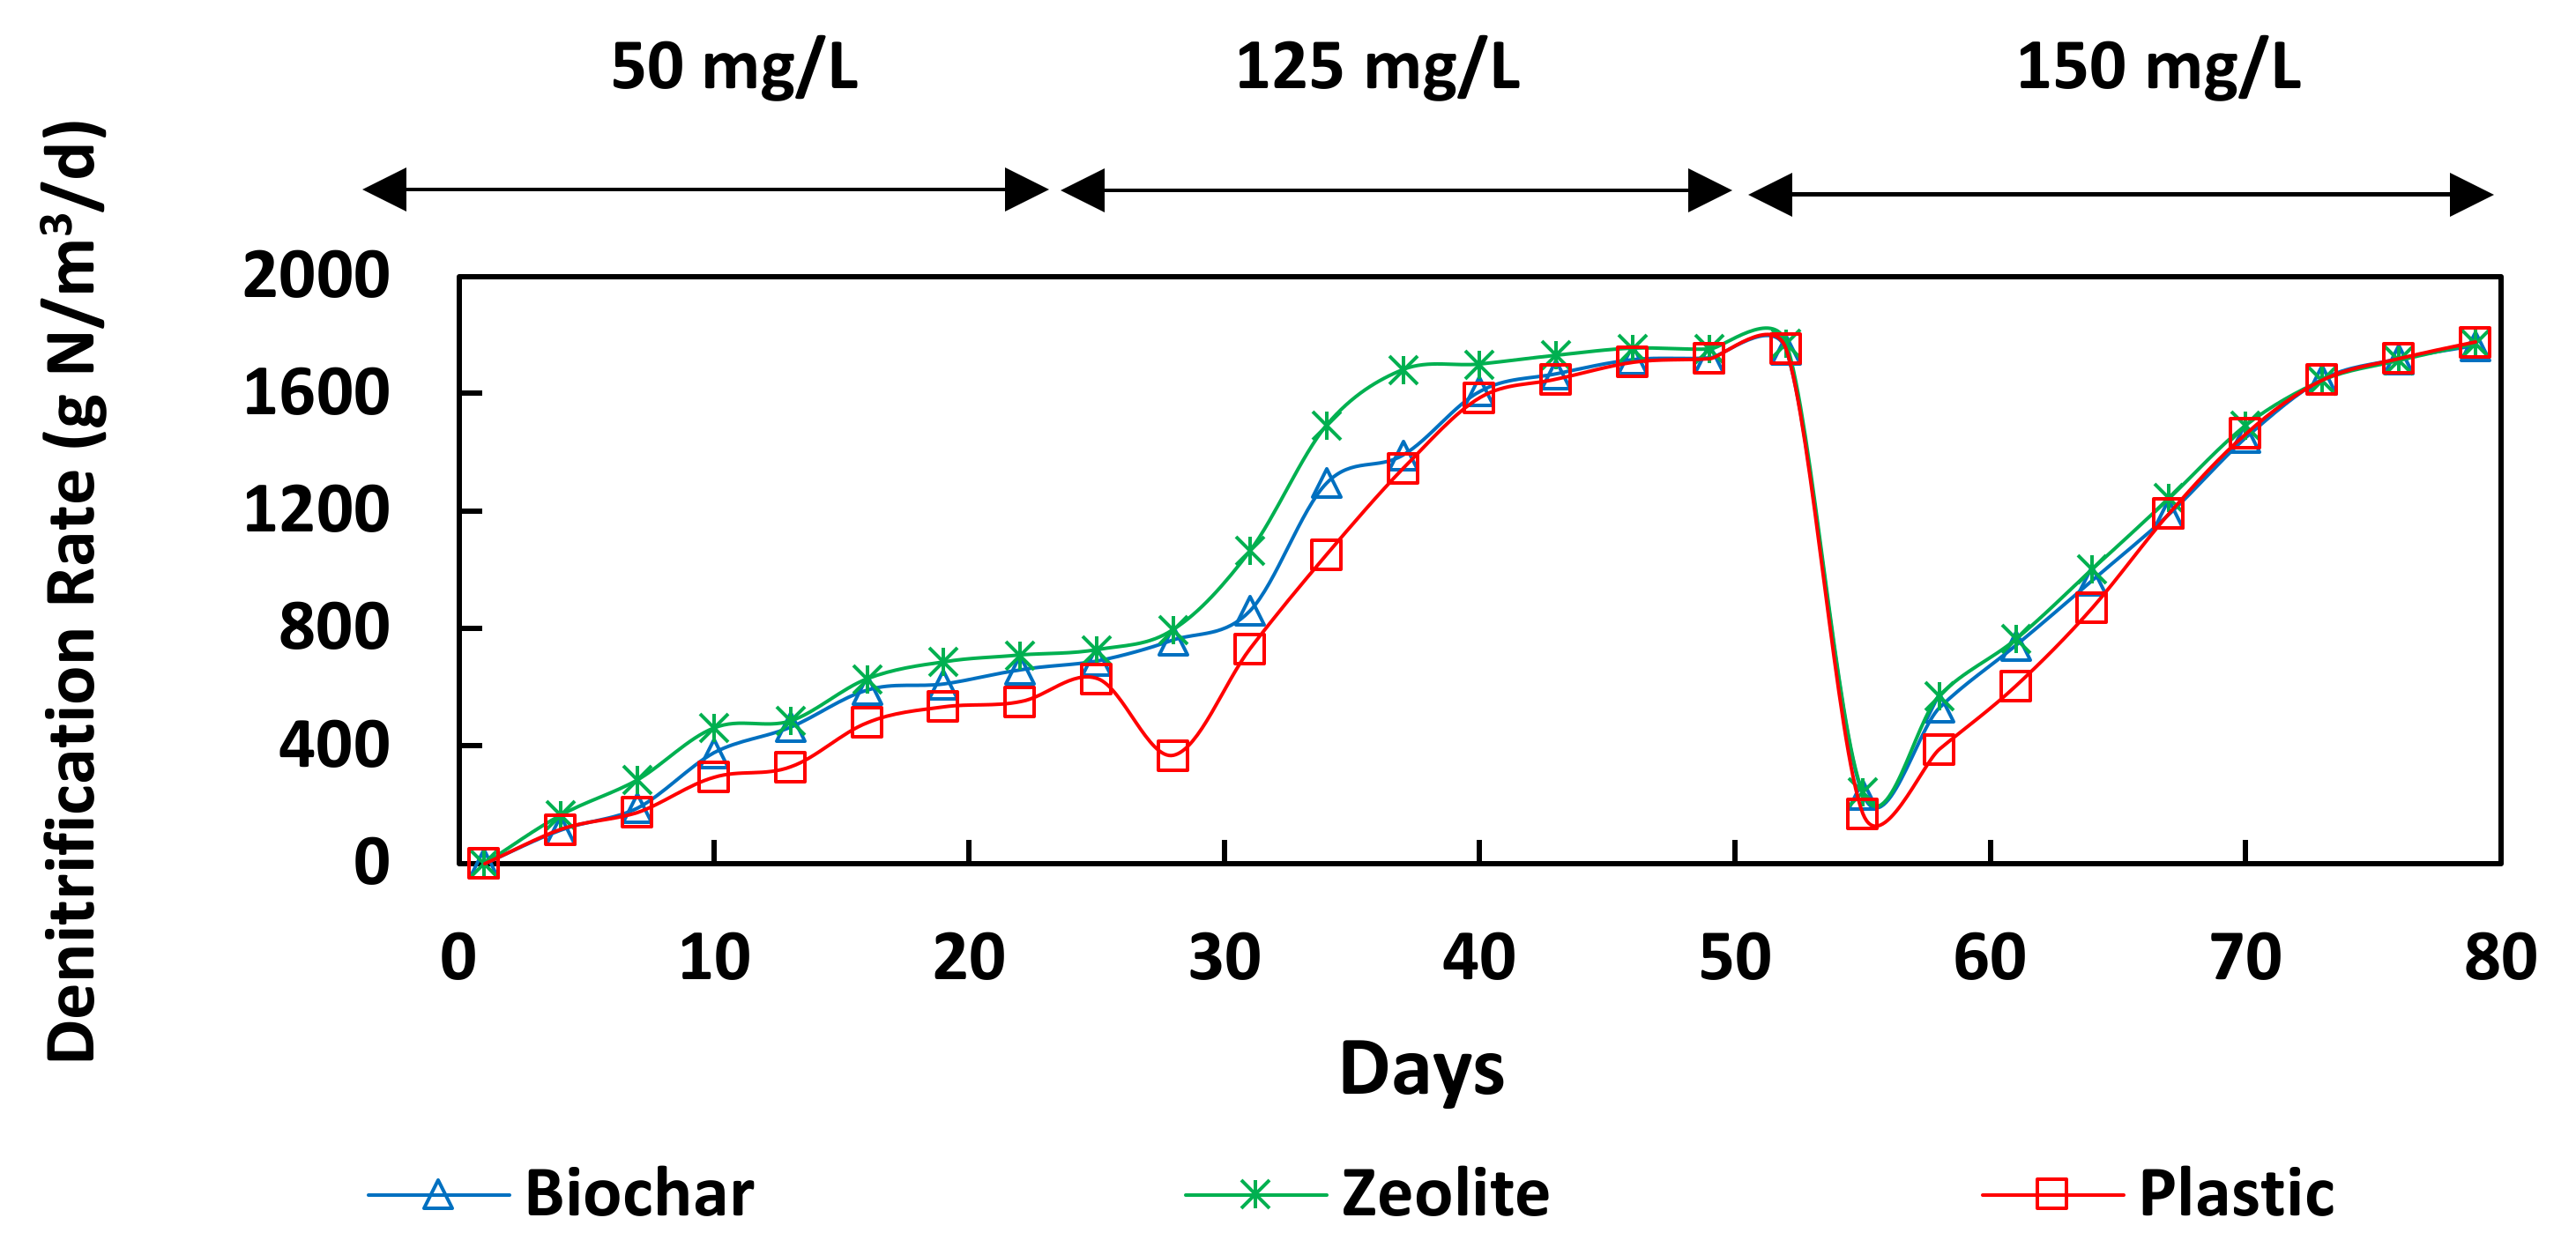
During a major part of the experimental period, the bioreactors with zeolite as filter media exhibited the lowest values of NO3-N, which was followed by bioreactors with biochar and plastic. Figure 4 presents the influent and effluent nitrate concentration at loading rates 50 mg/L, 125 mg/L, and 150 mg/L for the three media types. Initially, the NO3-N concentration in the plastic bioreactor was higher than that of biochar and zeolite. Biomass appeared to develop slowly on plastic media, but once it commenced, the nitrate removal exhibited by plastic media was similar to the others. Plastic media also appeared to react slowly to an increase in NO3-N concentration especially during transition periods when the loading rate was increased to 2.5 times (for 125 mg/L) and 3 times (for 150 mg/L) the initial nitrate concentration. The denitrification rates (DNR) exhibited by the three types of media during the study period have been presented in Figure 5. The DNR for all bioreactors increased with the rise in nitrate-loading rate and reached a maximum value of 1776.48 g N/m3/d by the end of the study period. It was observed that the denitrification rates approached pseudo-steady-state conditions (the last three to four successive observations when denitrification rates had a variability of <10%) at each loading rate after around two weeks of operation. In general, the plastic media were observed to be slow in adapting to new loads and at startups but were comparable at pseudo-steady-state stages.
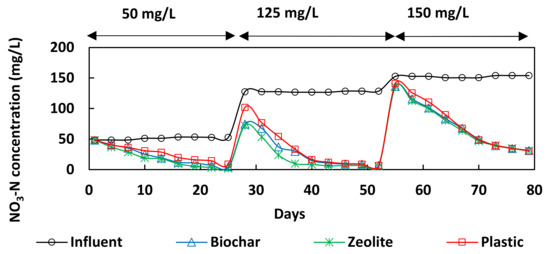
Figure 4.
The NO3-N concentration of the influent wastewater as well as the change in NO3-N concentrations for the three types of media used.
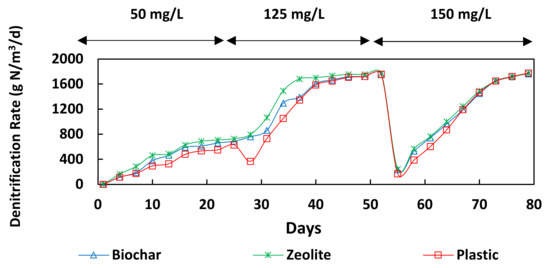
Figure 5.
The denitrification rates of the three types of media for the three concentration levels of NO3-N.
At the nitrate loading rate of 50 mg/L, statistically significant differences were observed in the effluent nitrate concentrations of the combination of two media using Tukey’s method for comparing a family of three estimates. Both biochar and zeolite bioreactors had higher efficiency in nitrate removal compared to plastic (p-values of biochar–plastic, biochar–zeolite, and plastic–zeolite <0.0001) with zeolite exhibiting even higher nitrate removal efficiency than biochar. Under the pseudo-steady state, the highest removal of NO3-N was exhibited by the zeolite bioreactors (90.15 ± 0.06%), followed by biochar (83.59 ± 0.06%) and plastic (71.82 ± 0.08%).
During the 125 mg/L loading rate, the NO3-N removal efficiency of zeolite was highest (95.02 ± 0.01%), while both biochar and plastic exhibited comparable values (92.91 ± 0.01% vs. 92.57 ± 0.02%). These NO3-N removal efficiencies were not observed to have statistically significant differences (p-values of biochar–plastic, biochar–zeolite, and plastic–zeolite > 0.05) for a combination of two media using Tukey’s HSD. Thus, during the first and second nitrate loading rates, the highest efficiency in nitrate removal was observed in the zeolite bioreactors. This might be attributed to the extremely high surface roughness of zeolite, which can support better bacterial growth, leading to less biomass detachment (further discussed in Section 3.3).
During the last concentration level, the NO3-N removal efficiencies (77.09 ± 0.0%, 77.09 ± 0.03%, and 77.28 ± 0.03%) as well as DNR values (1710.80 ± 56.98, 1710.70 ± 63.04, and 1714.98 ± 64.07 g-N/m3/d) were comparable for biochar, zeolite, and plastic, respectively, and no significant differences were observed among the media (p-values of biochar–plastic, biochar–zeolite, and plastic–zeolite >0.05). This could be due to the fact that with time, sufficient biomass had developed in all the bioreactors, irrespective of media, and thus, they exhibited similar DNRs. Using Tukey’s HSD, it was observed that on most days, the mean nitrate concentration was lowest for zeolite bioreactors, which was followed by biochar and plastic. It is to be noted that among the three loading rates, the performance of the bioreactors was least efficient (approximately 77%) at the highest nitrate level (150 mg/L) for all media types. This might be attributed to the possibility that the biomass developed was not adequate for the reduction of nitrate at such high concentration but was efficient at the initial and intermediate nitrate levels. Additionally, the relatively sluggish adjustment of the bacteria on plastic media with respect to the transitions in nitrate concentrations compared to biochar and zeolite might be because the high surface roughness had rendered biochar and zeolite more conducive to bacterial adhesion.
The performance of the bioreactors under pseudo-steady-state conditions is summarized in Table 1, and Table 2 presents the DNR rates exhibited by numerous other media from the literature. A comparative analysis of the DNR values of the media under consideration in this study from the literature suggests that the DNR rates of biochar and zeolite are high enough to ensure an efficient denitrification process in the system.

Table 1.
Denitrification performance summary of the bioreactors under pseudo-steady-state conditions.
Table 2.
The DNR of different media used in the treatment of aquaculture wastewater.
3.2. Quality of the Effluents
The pH of the effluent wastewater from the bioreactors ranged between 7.4 and 8.9 throughout the study period and DO was maintained below 2 mg/L for adequate anoxic conditions. The initial concentration of ammonia in the influent synthetic aquaculture wastewater was very low, and thus, the ensuing concentrations of ammonia in the effluents were also very low. The effluent concentrations of NH3-N and NO2-N for all the three media types were in the range of 0.02 ± 0.03 mg/L to 0.05 ± 0.07 mg/L and 0.62 ± 0.31 mg/L to 1.02 ± 0.02 mg/L, respectively (Table 3).
Table 3.
The quality of various effluent parameters of the bioreactors.
Since methanol was used as an exogenous source of carbon in this study, hence, the residual concentration of COD was also analyzed in the effluent samples collected from the bioreactors. The addition of carbon in denitrification experiments is crucial, as carbon limitation can lead to low nitrate removal efficiency with high nitrite concentrations [42,43,44]. On the other hand, the presence of surplus carbon in the wastewater feed may cause dissimilatory nitrate reduction to ammonia with an added challenge of the formation of hydrogen sulfide, which is highly detrimental to aquatic life [45,46,47]. In this experiment, for the initial nitrate loading rate of 50 mg/L, the residual COD concentration in the effluents of all the bioreactors was in the range of 34.02 ± 0.5 mg/L to 35.08 ± 0.68 mg/L. However, for 125 mg/L of influent nitrate concentration, this increased to the range of 40.36 ± 0.82 mg/L to 41.92 ± 0.26 mg/L and further augmented to the range of 49.16 ± 0.85 mg/L to 50.22 ± 1.13 mg/L for 150 mg/L (as mentioned in Table 3) of nitrate concentration. Thus, the residual COD in the effluent of the bioreactors at the highest influent nitrate might necessitate a mild treatment to further decrease the COD concentrations if needed.
The concentration of alkalinity in the effluent of the bioreactors increased along with the level of influent nitrate concentrations. Irrespective of media types, the alkalinity concentration was approximately 186.99 ± 2.21 mg/L as CaCO3 (for 50 mg/L of influent nitrate), 441.63 ± 4.14 mg/L of CaCO3 (for 125 mg/L of influent nitrate), and 514.69 ± 4.89 mg/L of CaCO3 (for 150 mg/L of influent nitrate). Thus, alkalinity was generated at approximately 3.5 mg/mg of nitrate reduced, which agrees with the results reported by Li and Irvin [48]. The ORP of the effluent water from the bioreactors was always in the range between −120 and −50 mV, which is well within the standard ORP range for optimum denitrification [25,49,50].
3.3. Characteristics of Biofilter Media
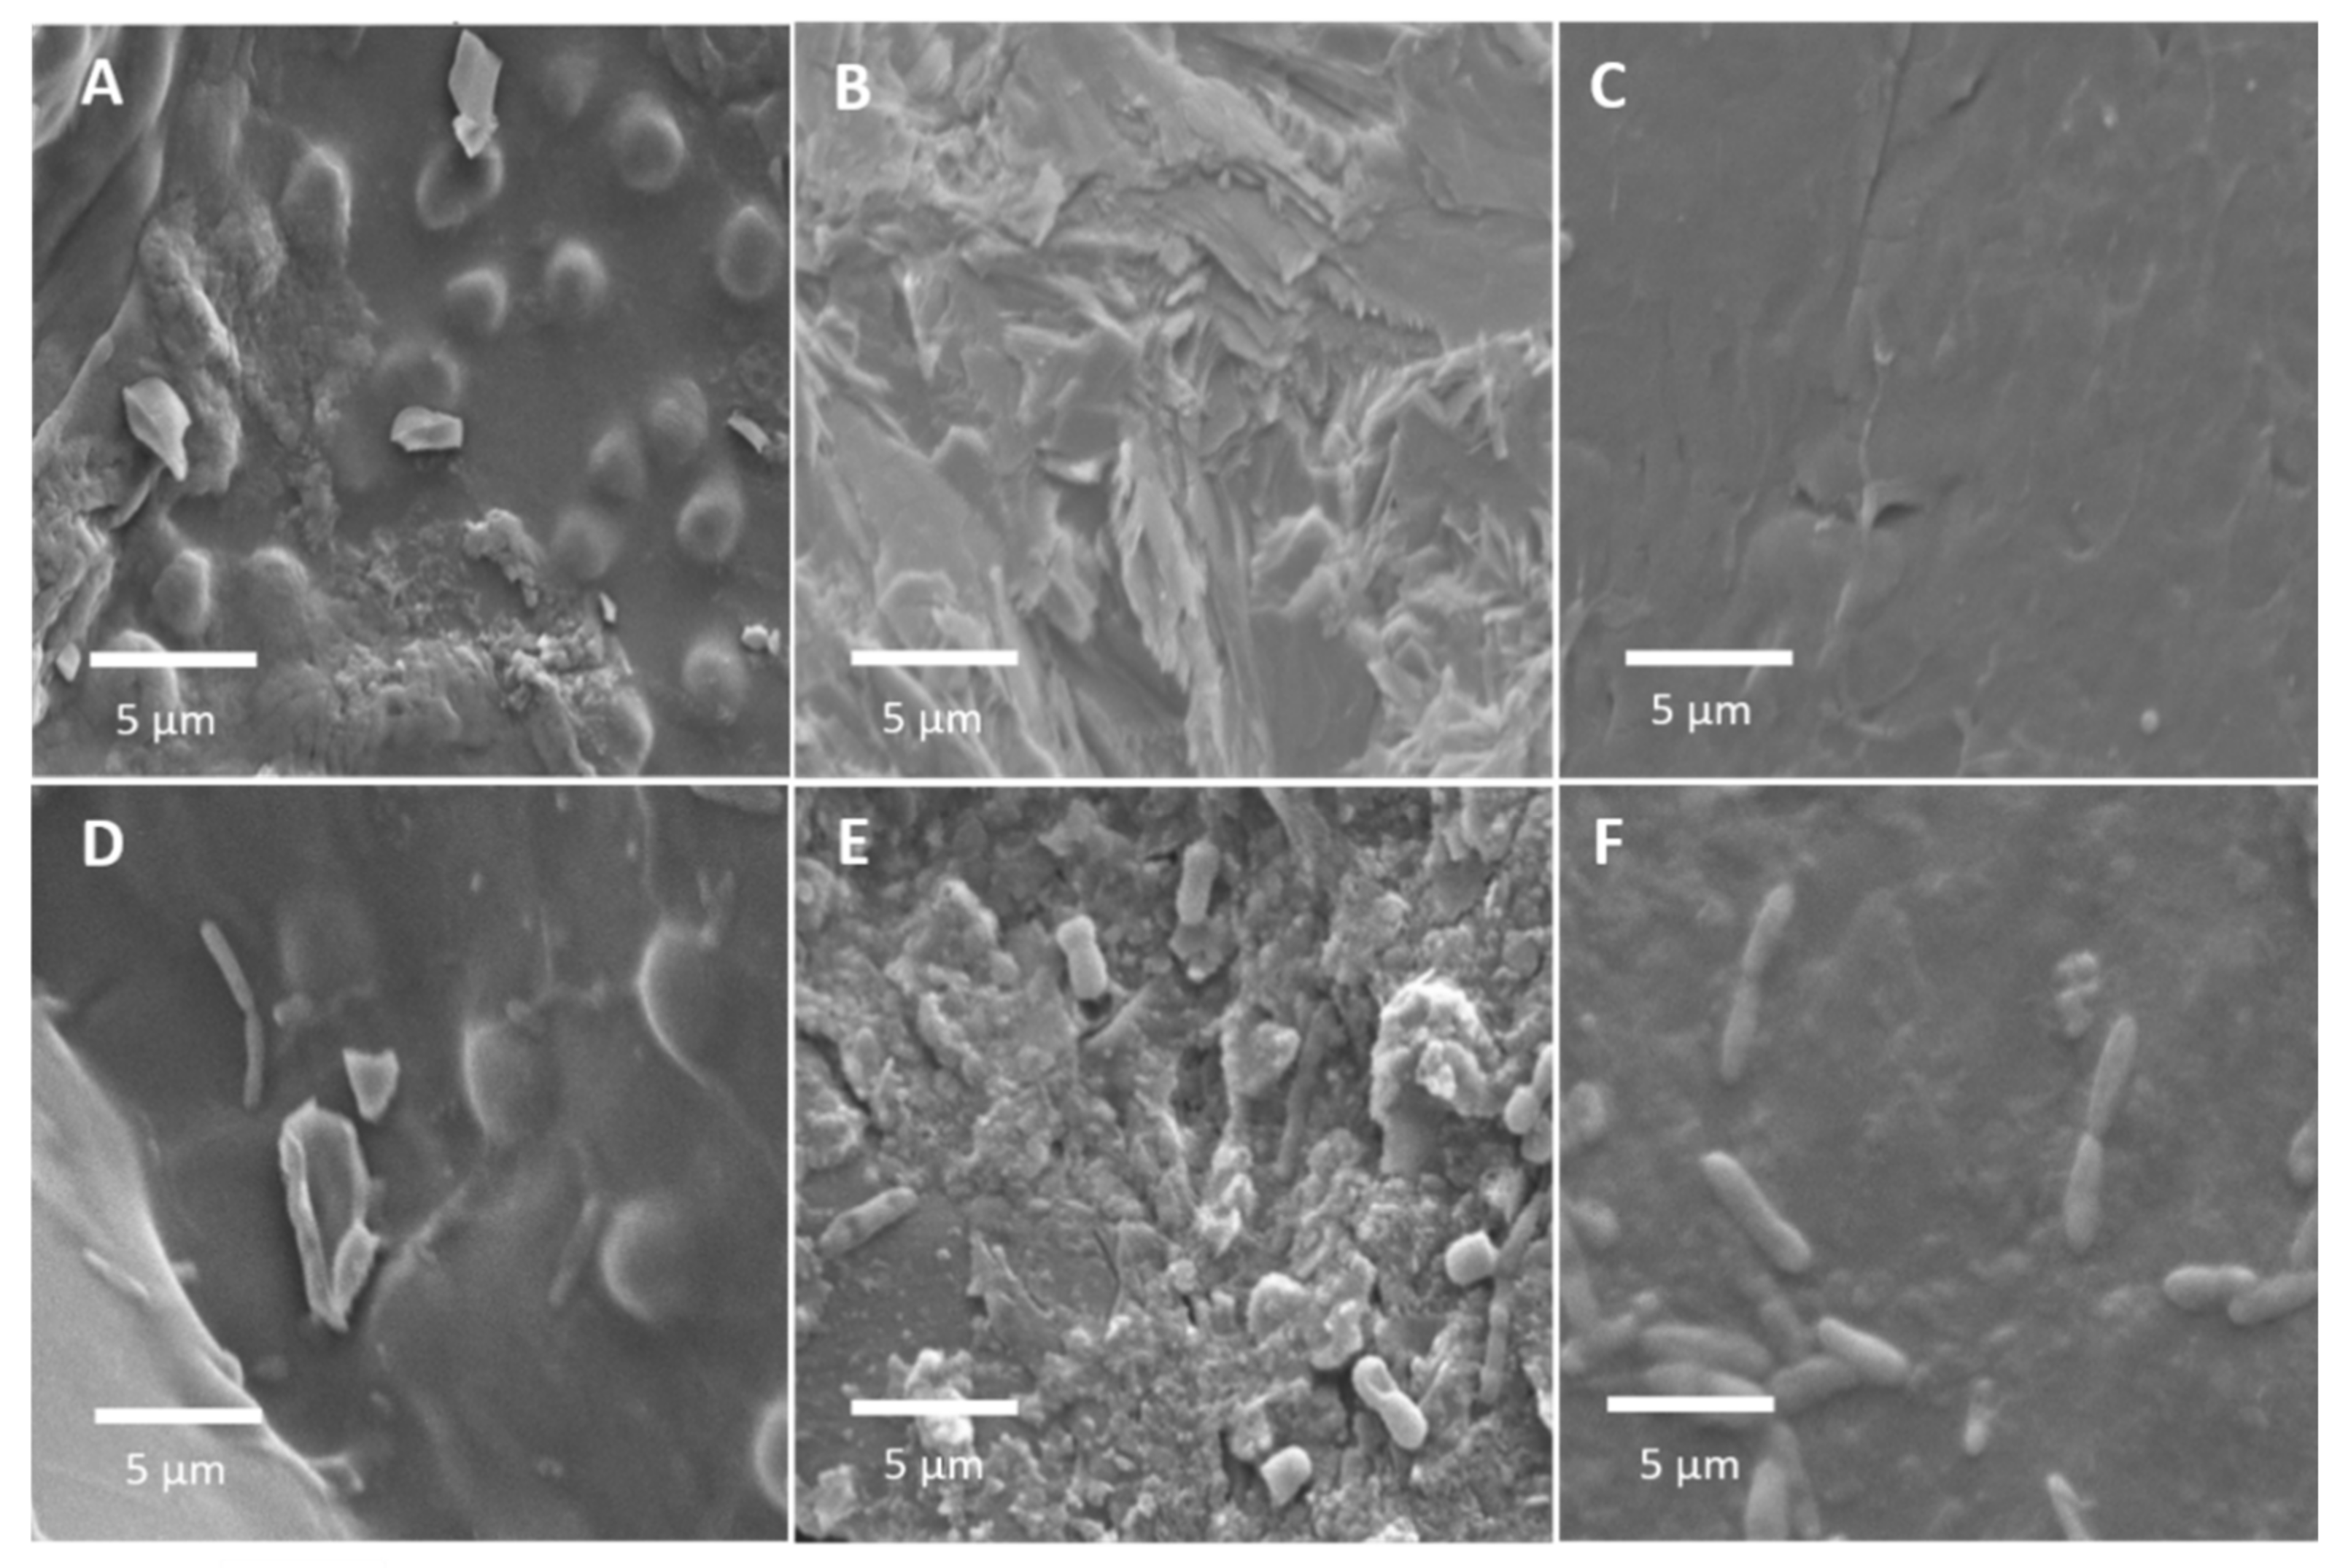
The surface morphology of the three biofilter media was studied by SEM in their pristine form (Figure 6A–C) as well as after being retrieved from the bioreactors when bacterial development had started (Figure 6D–F). These micrographs validate the development of bacteria on the surface of the media after the denitrification process had started. Furthermore, the pictorial data from SEM of the media also provide information on the surface roughness of the biofilter media: zeolite appeared to have the roughest surface morphology followed by biochar, whereas plastic media appeared to exhibit minimal surface roughness.
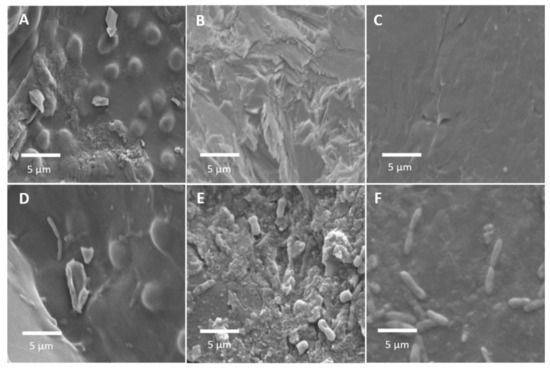
Figure 6.
The SEM micrographs of the biofilter media in their pristine form as well as after the development of bacteria: biochar (A,D), zeolite (B,E), and plastic (C,F).
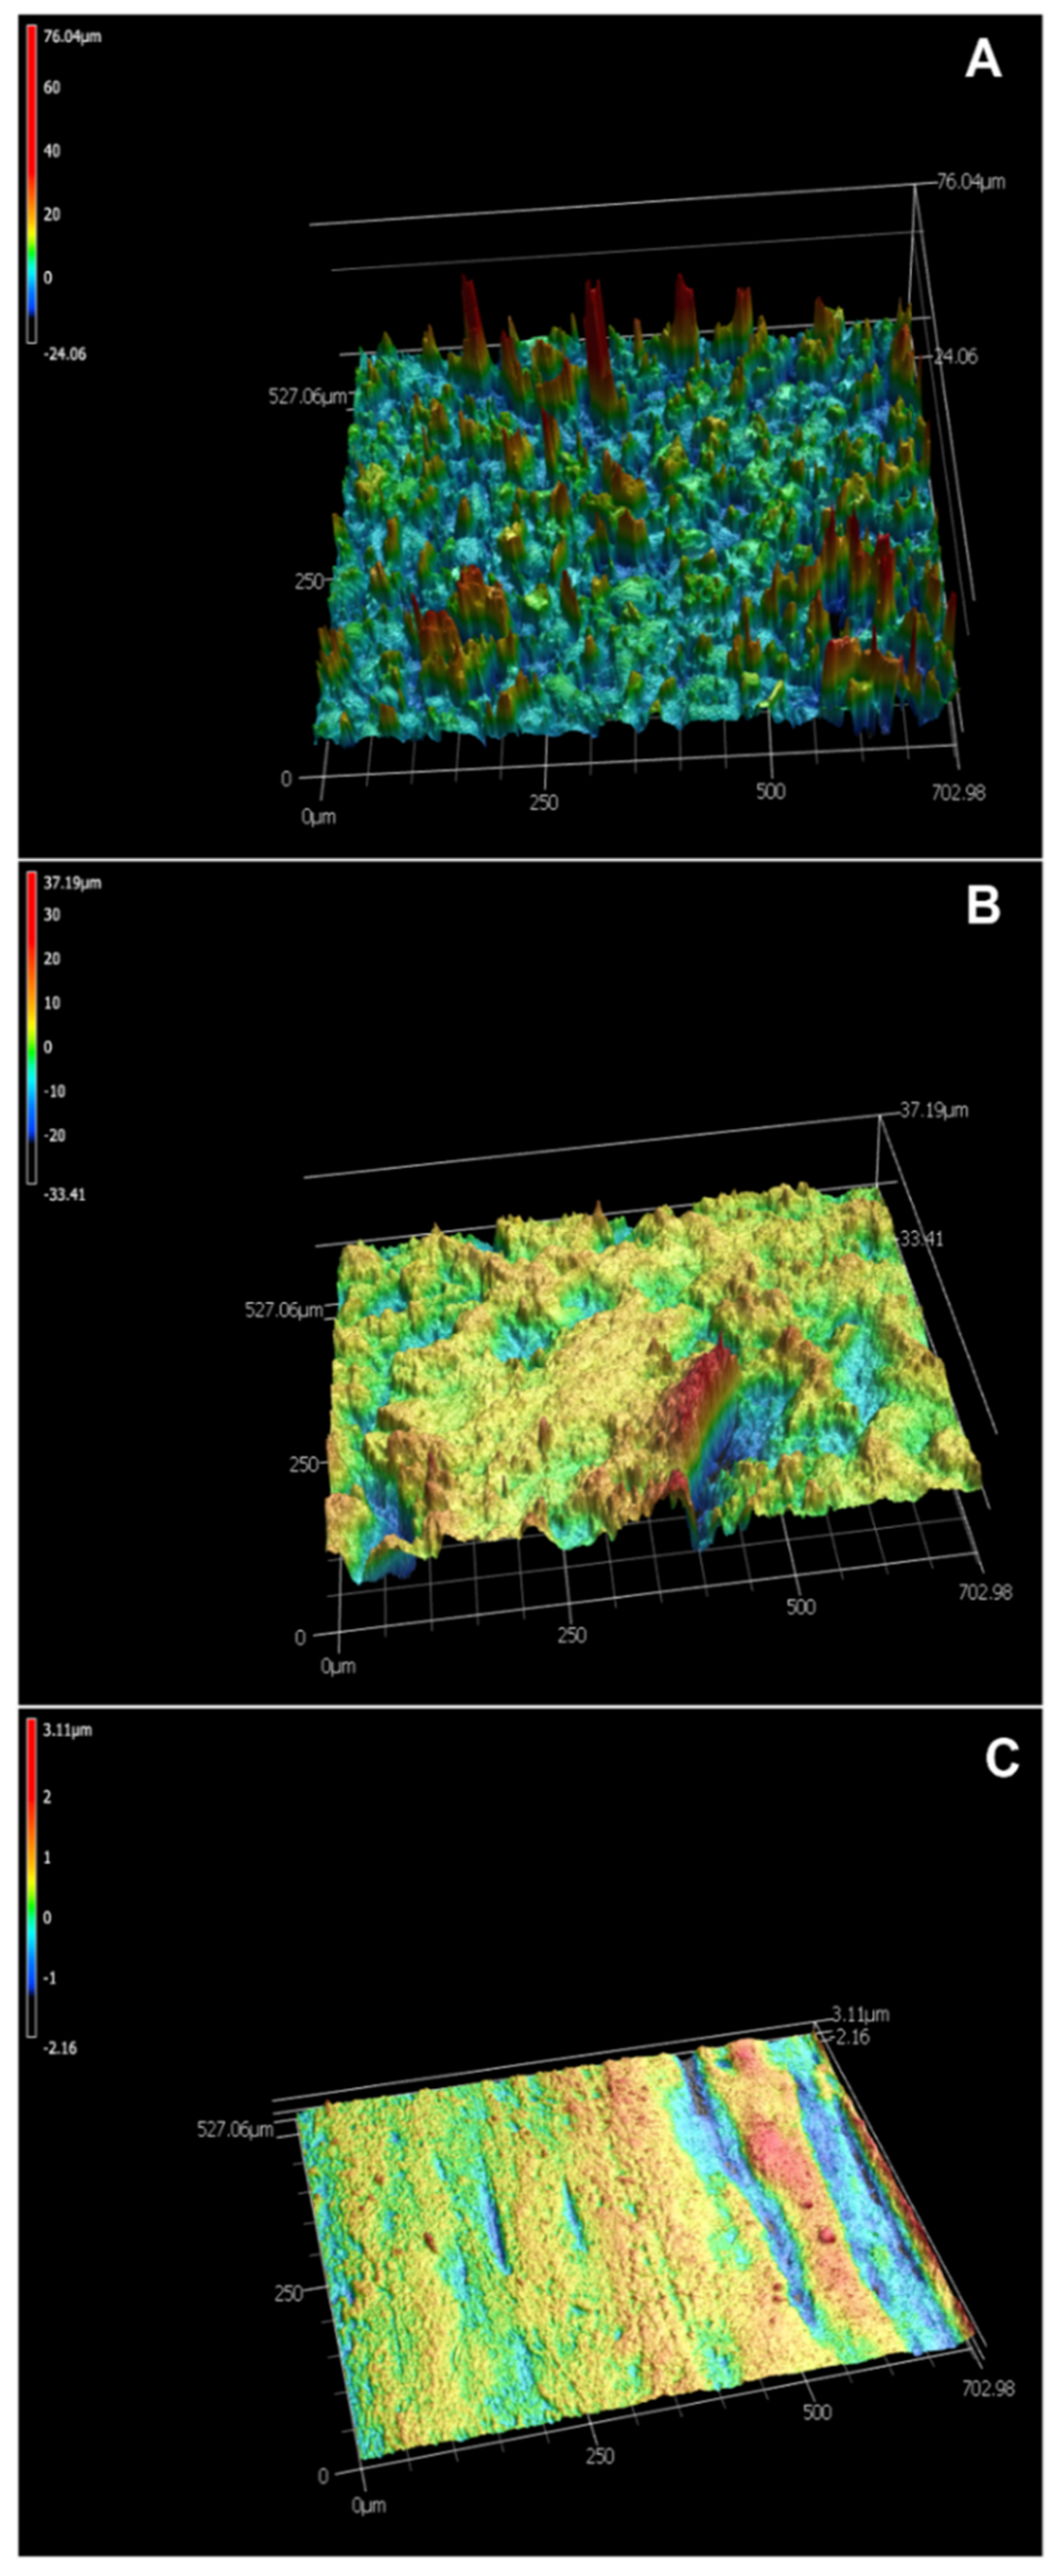
The SEM micrographs were further corroborated by the values and 3D pictorial representations (Figure 7A–C) of surface roughness obtained by surface profilometry. As outlined in Table 4, zeolite exhibited the highest surface roughness: it was more than 2.5 times rougher than biochar in terms of Sa (0.89 µm vs. 0.36 µm), Sz (6.52 vs. 2.22 µm), and Sq (1.17 µm vs. 0.44 µm). When compared to plastic, zeolite was more than seven times rougher in terms of Sa (0.89 µm vs. 0.13 µm), Sz (6.52 µm vs. 0.67 µm), and Sq (1.17 µm vs. 0.16 µm). Surface profilometry results comparable to this order have also been reported by Paul et al. in a previous study [38]. It is widely reported in the literature [51,52,53] that the higher surface roughness of the biofilter media leads to the better bacterial attachment on the surface and consequently increased biofilm thickness. Hence, zeolite would provide a better grip to the formation of bacterial colonies on its surface than biochar and plastic. Thus, the media characterization data support the experimental denitrification results obtained that suggest that zeolite exhibited the highest nitrate removal rates followed by biochar and plastic.
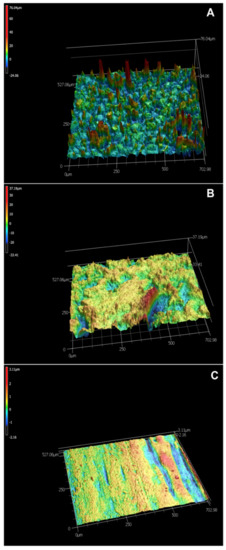
Figure 7.
The 3D surface profilometry of (A) biochar and (B) zeolite, and (C) plastic media used in this study.
Table 4.
The values of surface roughness for the three types of media.
The pHPZC of a material is the pH at which the net positive and negative charges on the surface of the material are equal. The pHPZC for the biochar and zeolite samples of this study were observed to be 5.82 and 6.74, respectively and have been reported elsewhere [38]. The pHPZC of the plastic media was not observed to be significant, as it is composed of a chemically inert material with respect to aqueous solutions. The pH of the synthetic aquaculture wastewater used in this study was approximately 8.02 ± 0.52. Thus, the solution pH was greater than the pHPZC of both biochar and zeolite. Consequently, both biochar and zeolite would be negatively charged with respect to the aquaculture wastewater. This implies that the adsorption of the nitrate ions from the wastewater onto the media due to adsorption can be ruled out, and the nitrate removal in this study can be associated with denitrification only.
3.4. Cost of Media
On the economic side, the cost of 1 m3 of commercially available plastic media is about $1450 with a life span of around 10 years [25,54]. Pine nuggets can be obtained from the market at $62.5/m3. Considering an industrial electricity rate at 6.64¢/kWh in North Carolina, USA and use of electric kiln (7200 W), the electricity cost for charring the biochar in a couple of batches is approximately $10. Thus, the cost of biochar can be estimated to be $72.5/m3. If biochar has to be reloaded once a year, the total 10-year cost would be $725, which is half the price of plastic media. Natural zeolite is widely available and can be priced between $350 and $600/m3. Zeolite is less susceptible to physical degradation with time than biochar. Hence, if zeolite needs reloading once every 5 years, the 10-year cost will be between $700 and $1200. This cost analysis (Table 5) excludes the labor charge for reloading media. Thus, the use of biochar and zeolite as alternatives to plastic substantially reduces the cost of biofilter media used in the denitrification process.
Table 5.
Cost analysis of the three types of biofilter media.
4. Conclusions
This study revealed that both pine-derived biochar and zeolite were better than plastic initially but eventually exhibited comparable values overall for the growth and development of denitrifying bacteria treating aquaculture wastewater. Moreover, the surface morphology and 3D profilometry analysis of the media disclosed the extremely high surface roughness exhibited by zeolite and biochar compared to plastic that might also play a role in increased bacterial adhesion. Additionally, the high value to cost and sustainable attributes of biochar and zeolite that aid in diminishing pervasive plastic pollution are additional points to consider them as alternatives to plastic biofilter media. Nonetheless, further investigation is necessary about the longevity of these alternatives and their reload when used in larger-scale projects.
Supplementary Materials
The supplementary material related to statistical analysis is available in S1 at https://www.mdpi.com/article/10.3390/w13192703/s1.
Author Contributions
Conceptualization, methodology, data acquisition and analysis, writing, editing, D.P. Conceptualization, funding acquisition, methodology, supervision, editing, writing, S.G.H. All authors have read and agreed to the published version of the manuscript.
Funding
The funding received from the North Carolina State University Department of Biological and Agricultural Engineering, William White Endowment of the North Carolina Agricultural Foundation, and the College of Agriculture and Life Sciences, North Carolina State University for this project are duly acknowledged.
Institutional Review Board Statement
Not applicable.
Informed Consent Statement
Not applicable.
Data Availability Statement
Not applicable.
Acknowledgments
The authors would like to thank Chuck Mooney and Philip Strader for the help with SEM and surface profilometry, respectively. The help received from John Davis for experimental set-up fabrication as well as from Kan Luo and Tianle Sun for statistical analysis is duly acknowledged.
Conflicts of Interest
The authors declare no conflict of interest.
References
- Hall, S.G.; Campbell, M.; Geddie, A.; Thomas, M.; Paul, D.; Wilcox, D.; Smith, R.; Eddy, N.; Frinsko, M.; Wilder, S.; et al. Engineering challenges in marine aquaculture. In Proceedings of the 2018 ASABE Annual International Meeting, Detroit, MI, USA, 29 July–1 August 2018; American Society of Agricultural and Biological Engineers: St. Joseph, MI, USA, 2018. [Google Scholar] [CrossRef]
- Paul, D. Biological and Adsorptive Removal of Nitrogenous Species from Aquaculture Wastewater. Ph.D. Thesis, North Carolina State University, Raleigh, NC, USA, 2021. Available online: https://www.lib.ncsu.edu/resolver/1840.20/39013 (accessed on 27 September 2021).
- FAO. The State of World Fisheries and Aquaculture 2016; Contributing to Food Security and Nutrition for all; FAO: Rome, Italy, 2016. [Google Scholar]
- Banerjee, A. Performance and flow analysis of an elliptic bladed Savonius-style wind turbine. J. Renew. Sustain. Energy 2019, 11, 033307. [Google Scholar] [CrossRef]
- Banerjee, A. High Temperature Heat Extraction from Heat Recirculating Porous Burner. Ph.D. Thesis, North Carolina State University, Raleigh, NC, USA, 2019. Available online: http://www.lib.ncsu.edu/resolver/1840.20/36624 (accessed on 27 September 2021).
- Banerjee, A.; Saveliev, A.V. Emission characteristics of heat recirculating porous burners with high temperature energy extraction. Front. Chem. 2020, 8. [Google Scholar] [CrossRef] [PubMed] [Green Version]
- Banerjee, A.; Saveliev, A.V. Effect of heat extraction on flame position in counterflow porous burner. In ASTFE Digital Library; Begell House Inc.: Danbury, CT, USA, 2019; pp. 113–122. [Google Scholar]
- Banerjee, A.; Saveliev, A.V. High temperature heat extraction from counterflow porous burner. Int. J. Heat Mass Transf. 2018, 127, 436–443. [Google Scholar] [CrossRef]
- Chen, S. Recirculating systems effluents, and treatment. In Aquaculture and the Environment in the United States; World Aquaculture Society: Sorrento, LA, USA, 2002; pp. 119–140. [Google Scholar]
- Paul, D.; Noori, M.T.; Rajesh, P.P.; Ghangrekar, M.M.; Mitra, A. Modification of carbon felt anode with graphene oxide-zeolite composite for enhancing the performance of microbial fuel cell. Sustain. Energy Technol. Assess. 2018, 26, 77–82. [Google Scholar] [CrossRef]
- Noori, M.T.; Paul, D.; Ghangrekar, M.M.; Mukherjee, C.K. Enhancing the performance of sediment microbial fuel cell using graphene oxide–zeolite modified anode and V2O5 catalyzed cathode. J. Clean Energy Technol. 2018, 6, 150–154. [Google Scholar] [CrossRef]
- Song, X.; Yang, X.; Hallerman, E.; Jiang, Y.; Huang, Z. Effects of hydraulic retention time and influent nitrate-n concentration on nitrogen removal and the microbial community of an aerobic denitrification reactor treating recirculating marine aquaculture system effluent. Water 2020, 12, 650. [Google Scholar] [CrossRef] [Green Version]
- Gong, W.; Gao, S.; Zhu, Y.; Wang, G.; Zhang, K.; Li, Z.; Yu, E.; Tian, J.; Xia, Y.; Xie, J.; et al. Effect of the aerobic denitrifying bacterium Pseudomonas furukawaii ZS1 on microbiota compositions in grass carp culture water. Water 2021, 13, 1329. [Google Scholar] [CrossRef]
- Xu, W.; Xu, Y.; Su, H.; Xu, H.; Yang, K.; Wen, G.; Cao, Y. Characteristics of ammonia removal and nitrifying microbial communities in a hybrid biofloc-ras for intensive Litopenaeus vannamei culture: A pilot-scale study. Water 2020, 12, 3000. [Google Scholar] [CrossRef]
- Cheng, X.; Zhu, D.; Wang, X.; Yu, D.; Xie, J. Effects of nonaerated circulation water velocity on nutrient release from aquaculture pond sediments. Water 2017, 9, 6. [Google Scholar] [CrossRef] [Green Version]
- You, G.; Xu, B.; Su, H.; Zhang, S.; Pan, J.; Hou, X.; Li, J.; Ding, R. Evaluation of aquaculture water quality based on improved fuzzy comprehensive evaluation method. Water 2021, 13, 1019. [Google Scholar] [CrossRef]
- Sang, C.G.; Fu, Y.W.; Guo, S.Q.; Luo, J.J.; Zhang, Q.Z. Isolation and characterization of an aerobic denitrifier Bacillus sp. SC16 from an intensive aquaculture pond. Water 2020, 12, 3559. [Google Scholar] [CrossRef]
- Gichana, Z.; Meulenbroek, P.; Ogello, E.; Drexler, S.; Zollitsch, W.; Liti, D.; Akoll, P.; Waidbacher, H. Growth and nutrient removal efficiency of sweet wormwood (Artemisia annua) in a recirculating aquaculture system for Nile tilapia (Oreochromis niloticus). Water 2019, 11, 923. [Google Scholar] [CrossRef] [Green Version]
- Gołaś, I.; Szmyt, M.; Potorski, J.; Łopata, M.; Gotkowska-Płachta, A.; Glinska-Lewczuk, K. Distribution of Pseudomonas fluorescens and Aeromonas hydrophila bacteria in a recirculating aquaculture system during farming of European grayling (Thymallus thymallus L.) broodstock. Water 2019, 11, 376. [Google Scholar] [CrossRef] [Green Version]
- Delwiche, C. Denitrification, nitrification and atmospheric nitrous oxide. In The Nitrogen Cycle and Nitrous Oxide; Wiley & Sons: Hoboken, NJ, USA, 1981. [Google Scholar]
- Soares MInês, M.; Abeliovich, A. Wheat straw as substrate for water denitrification. Water Res. 1998, 32, 3790–3794. [Google Scholar] [CrossRef]
- Hunho, K.; Seagren, E.A.; Davis, A.P. Engineered bioretention for removal of nitrate from stormwater runoff. Water Environ. Res. 2003, 75, 355–367. [Google Scholar] [CrossRef]
- Robertson, W.D.; Ford, G.I.; Lombardo, P.S. Wood–based filter for nitrate removal in septic systems. Trans. ASAE 2005, 48, 121–128. [Google Scholar] [CrossRef]
- Knapik, E.; Stopa, J. Fibrous deep-bed filtration for oil/water separation using sunflower pith as filter media. Ecol. Eng. 2018, 121, 44–52. [Google Scholar] [CrossRef]
- Saliling, W.J.B.; Westerman, P.W.; Losordo, T.M. Wood chips and wheat straw as alternative biofilter media for denitrification reactors treating aquaculture and other wastewaters with high nitrate concentrations. Aquac. Eng. 2007, 37, 222–233. [Google Scholar] [CrossRef]
- Bock, E.M.; Coleman, B.; Easton, Z.M. Effect of biochar on nitrate removal in a pilot-scale denitrifying bioreactor. J. Environ. Qual. 2016, 45, 762–771. [Google Scholar] [CrossRef] [PubMed]
- Bock, E.; Smith, N.; Rogers, M.; Coleman, B.; Reiter, M.; Benham, B.; Easton, Z.M. Enhanced nitrate and phosphate removal in a denitrifying bioreactor with biochar. J. Environ. Qual. 2015, 44, 605–613. [Google Scholar] [CrossRef]
- Reddy, K.R.; Xie, T.; Dastgheibi, S. Evaluation of biochar as a potential filter media for the removal of mixed contaminants from urban storm water runoff. J. Environ. Eng. 2014, 140, 04014043. [Google Scholar] [CrossRef] [Green Version]
- Li, W.; Loyola-Licea, C.; Crowley, D.E.; Ahmad, Z. Performance of a two-phase biotrickling filter packed with biochar chips for treatment of wastewater containing high niutrogen and phosphorous concentrations. Process Saf. Environ. Prot. 2016, 102, 150–158. [Google Scholar] [CrossRef]
- Sidibe, M. Comparative Study of Bark, Bio-Char, Activated Charcoal Filters for Upgrading Greywater: From a Hygiene Aspect. Master’s Thesis, Swedish University of Agricultural Sciences, Uppsala, Sweden, 2014. Available online: https://core.ac.uk/download/pdf/42951469.pdf (accessed on 27 September 2021).
- Foglar, L.; Gašparac, D. Continuous-flow biological denitrification with zeolite as support for bacterial growth. Desalin. Water Treat. 2013, 51, 37–39. [Google Scholar] [CrossRef]
- Chang, W.C.; Hong, S.W.; Park, J. Effect of zeolite media for the treatment of textile wastewater in biological aerated filter. Process Biochem. 2002, 37, 693–698. [Google Scholar] [CrossRef]
- Chung, Y.C.; Son, D.H.; Ahn, D.H. Nitrogen and organics removal from industrial wastewater using natural zeolite media. Water Sci. Technol. 2000, 42, 127–134. [Google Scholar] [CrossRef]
- Park, S.J.; Kim, C.G.; Yoon, T.I.; Kim, D.W. Evaluation of increased denitrification in an anoxic activated sludge using zeolite. Korean J. Chem. Eng. 2003, 20, 492–495. [Google Scholar] [CrossRef]
- Banerjee, A.; Roy, S.; Mukherjee, P.; Saha, U.K. Unsteady flow analysis around an elliptic-bladed savonius-style wind turbine. In Proceedings of the Gas Turbine India Conference, New Delhi, India, 15–17 December 2014; American Society of Mechanical Engineers: New York, NY, USA, 2014; Volume 49644I, p. V001T05A001. [Google Scholar] [CrossRef]
- Banerjee, A.; Paul, D. Developments and applications of porous medium combustion: A recent review. Energy 2021, 119868. [Google Scholar] [CrossRef]
- Banerjee, A.; Kundu, P.; Gnatenko, V.; Zelepouga, S.; Wagner, J.; Chudnovsky, Y.; Saveliev, A. NOx minimization in staged combustion using rich premixed flame in porous media. Combust. Sci. Technol. 2019, 19. [Google Scholar] [CrossRef]
- Paul, D.; Kasera, N.; Kolar, P.; Hall, S.G. Physicochemical characterization data of pine-derived biochar and natural zeolite as precursors to catalysts. Chem. Data Collect. 2020, 30, 100573. [Google Scholar] [CrossRef]
- Kolar, P.; Jin, H. Baseline characterization data for raw rice husk. Data Brief 2019, 25, 104219. [Google Scholar] [CrossRef]
- Greensword, M.A. Rice Hull Bioreactor for Recirculating Aquaculture. Ph.D. Thesis, Lousiana State University, Baton Rouge, LA, USA, 2017. [Google Scholar]
- Volokita, M.; Belkin, S.; Abeliovich, A.; Soares, M.I.M. Biological denitrification of drinking water using newspaper. Water Res. 1996, 30, 965–971. [Google Scholar] [CrossRef]
- Mohseni-Bandpi, A.; Elliott, D.J.; Zazouli, M.A. Biological nitrate removal processes from drinking water supply-a review. J. Environ. Health Sci. Eng. 2013, 11, 35. [Google Scholar] [CrossRef] [PubMed]
- Wu, L.; Wei, W.; Xu, J.; Chen, X.; Liu, Y.; Peng, L.; Wang, D.; Ni, B.J. Denitrifying biofilm processes for wastewater treatment: Developments and perspectives. Environ. Sci. Water Res. Technol. 2021, 7, 40–67. [Google Scholar] [CrossRef]
- Chen, R.; Deng, M.; He, X.; Hou, J. Enhancing nitrate removal from freshwater pond by regulating carbon/nitrogen ratio. Front. Microbiol. 2017, 8, 1712. [Google Scholar] [CrossRef] [Green Version]
- Kamp, A.; Høgslund, S.; Risgaard-Petersen, N.; Stief, P. Nitrate storage and dissimilatory nitrate reduction by eukaryotic microbes. Front. Microbiol. 2015, 6, 1492. [Google Scholar] [CrossRef] [Green Version]
- Jones, Z.L.; Jasper, J.T.; Sedlak, D.L.; Sharp, J.O. Sulfide-induced dissimilatory nitrate reduction to ammonium supports anaerobic ammonium oxidation (anammox) in an open-water unit process wetland. Appl. Environ. Microbiol. 2017, 83, e00782-17. [Google Scholar] [CrossRef] [Green Version]
- Carlson, H.K.; Lui, L.M.; Price, M.N.; Kazakov, A.E.; Carr, A.V.; Kuehl, J.V.; Owens, T.K.; Nielsen, T.; Arkin, A.P.; Deutschbauer, A.M. Selective carbon sources influence the end products of microbial nitrate respiration. ISME J. 2020, 14, 2034–2045. [Google Scholar] [CrossRef]
- Li, B.; Irvin, S. The comparison of alkalinity and ORP as indicators for nitrification and denitrification in a sequencing batch reactor (SBR). Biochem. Eng. J. 2007, 34, 248–255. [Google Scholar] [CrossRef]
- Lepine, C.; Christianson, L.; Sharrer, K.; Summerfelt, S. Optimizing hydraulic retention times in denitrifying woodchip bioreactors treating recirculating aquaculture system wastewater. J. Environ. Qual. 2016, 45, 813–821. [Google Scholar] [CrossRef]
- Peng, Y.; Hou, H.; Wang, S.; Cui, Y.; Yuan, Z. Nitrogen and phosphorus removal in pilot-scale anaerobic-anoxic oxidation ditch system. J. Environ. Sci. 2008, 20, 398–403. [Google Scholar] [CrossRef]
- Zhang, T.C.; Bishop, P.L. Density, porosity, and pore structure of biofilms. Water Res. 1994, 28, 2267–2277. [Google Scholar] [CrossRef]
- Lazarova, V.; Manem, J. Biofilm characterization and activity analysis in water and wastewater treatment. Water Res. 1995, 25, 2227–2245. [Google Scholar] [CrossRef]
- Arnáiz Franco, C.; Gutierrez, J.C.; Lebrato Martínez, J. Support material selection for anaerobic fluidized bed reactors by phospholipid analysis. Biochem. Eng. J. 2006, 27, 240–245. [Google Scholar] [CrossRef] [Green Version]
- Pentair. Sweetwater Bio-Media. Available online: https://pentairaes.com/sweetwater-swx-bio-media.html (accessed on 9 August 2021).
Publisher’s Note: MDPI stays neutral with regard to jurisdictional claims in published maps and institutional affiliations. |
© 2021 by the authors. Licensee MDPI, Basel, Switzerland. This article is an open access article distributed under the terms and conditions of the Creative Commons Attribution (CC BY) license (https://creativecommons.org/licenses/by/4.0/).