1. Introduction
A healthy river is a logical consequence of scientific principles, legal mandates and changing social values [
1]. Nevertheless, this concept can be treated differently according to the type of water user. From an ecological perspective, a healthy river can sustain its functions and structure despite the anthropogenic influence [
2]. Therefore, it is reasonable to think that even if not all of the system variables are identified, the conservation of a sustainable flow regime is enough of a guarantee of a good ecological condition, assuming that there are adequate physicochemical water parameters.
The population necessity for freshwater has led to an increasing number of dams around the world, thus affecting natural flows. The inclusion of the environmental flow concept has encouraged more ecologically informed water management [
3]. A well-defined environmental flow must consider numerous variables to establish the river flow regimes. Flow velocities, flooding and scarcity periods characterize the riverine and freshwater ecosystems. The hierarchy of the flow regimes has been properly established in the formulation of the natural flow regime paradigm [
4].
The need to measure the flow regime has led to produce more than 200 methods grouped into four main categories: hydrological rules, hydraulic rating methods, habitat simulation methods and holistic methodologies [
5]. The indicators of hydrological alteration (IHA) are among the most widely used metrics to estimate the hydrological alteration in river reaches [
6,
7]. This methodology considers the definition of a series of relevant hydrological attributes that characterize the intra-annual water conditions variations, and then performs an analysis of the interannual variation of these attributes as the basis of a comparison of a natural regime against a system altered by human activities. The results establish a representative set of multiple parameters, which determine the degree of hydrological alteration of the system. The IHA are usually used in river sections in which the information available prior to the implementation of hydraulic infrastructure corresponds to the natural regime, and the subsequent data refer to the altered regime.
The methodology proposed by Richter [
6] considers 33 different indicators categorized into five groups of hydrological features. The IHA have been used to quantify the impacts of dam constructions in the Jiulong River basin in southeast China [
8], determine the influence of dams in the São Francisco River basin in Brazil [
9] and examine the flow alteration in the Wabash River in the USA [
10], among other applications. Nevertheless, daily series are necessary for most metrics, resulting in a limitation when such information is not available or when using water allocation models that rely on monthly data.
Similar alternatives to the IHA have emerged in recent years. For instance, [
11], in compliance with the European Water Framework Directive, the Indicators of Hydrologic Alteration in Rivers (IAHRIS) were developed. This methodology reduces the number of parameters to 21 and utilizes monthly and daily data. The indicators are categorized into three groups (ordinary, flood and drought flow indicators) and are combined to provide three global alteration indices.
Despite the development of new and less expensive river gauging techniques [
12], in numerous rivers there are not enough data to perform adequate assessments of hydrological alterations. In these cases, the use of appropriate hydrological models is a common practice to determine the natural and altered regime scenarios, and thus assess the human-induced alterations in the flow regime. The adoption of coarser timescales (e.g., monthly) for the hydrological indicators allows for using simpler models [
13].
Once this information is generated, it needs to be processed for interpretation and handling. To achieve this purpose, water allocation models for integrated water resources management (IWRM) can be used. IWRM is based on three fundamental pillars: economic efficiency, equity and environmental sustainability, with the purpose of reaching a balance between water for livelihood and water as a resource [
14].
The water allocation models appeared as tools intended to support decision makers to solve specific issues regarding IWRM, allowing the use of models and databases in an easy and interactive way. These models can be combined in a mixed optimization–simulation approach to anticipate the occurrence of hydrological scenarios [
15], such as the occurrence of droughts or phenomena derived from the effects of climate change. There are many models that are used as part of water planning strategies, such as AQUATOOL [
16], MODSIM [
17], RIBASIM [
18], WARGI-SIM [
19] and WEAP [
20], among others.
The objective of this paper is to present a methodology to analyze the hydrological alteration of highly regulated systems at the basin scale for different management alternatives of environmental flows. The methodology is based on the combination of a water allocation model and the assessment of a set of IHA, which are weighted and grouped to provide a single global indicator of the hydrological alteration of the basin. The methodology is applied to a highly regulated system: the Duero River basin (in the Iberian Peninsula). Two key issues differentiate the approach of this paper from previous works: the use of monthly data, and the definition, modelling and analysis of management scenarios to support the decision-making process. While in numerous studies the natural regime and the altered regime are defined according to the appearance of some type of infrastructure (e.g., reservoirs) [
2,
8,
21], in this work a hydrological model simulates the natural regime, and a water allocation model is used to reproduce the altered regimes for the different management scenarios.
2. Materials and Methods
The analysis of water resource systems comprises all the necessary elements needed to describe a river basin [
22]. IWRM requires a conscious study of the water resources of the river basin to help decision makers classify and select the best management strategy.
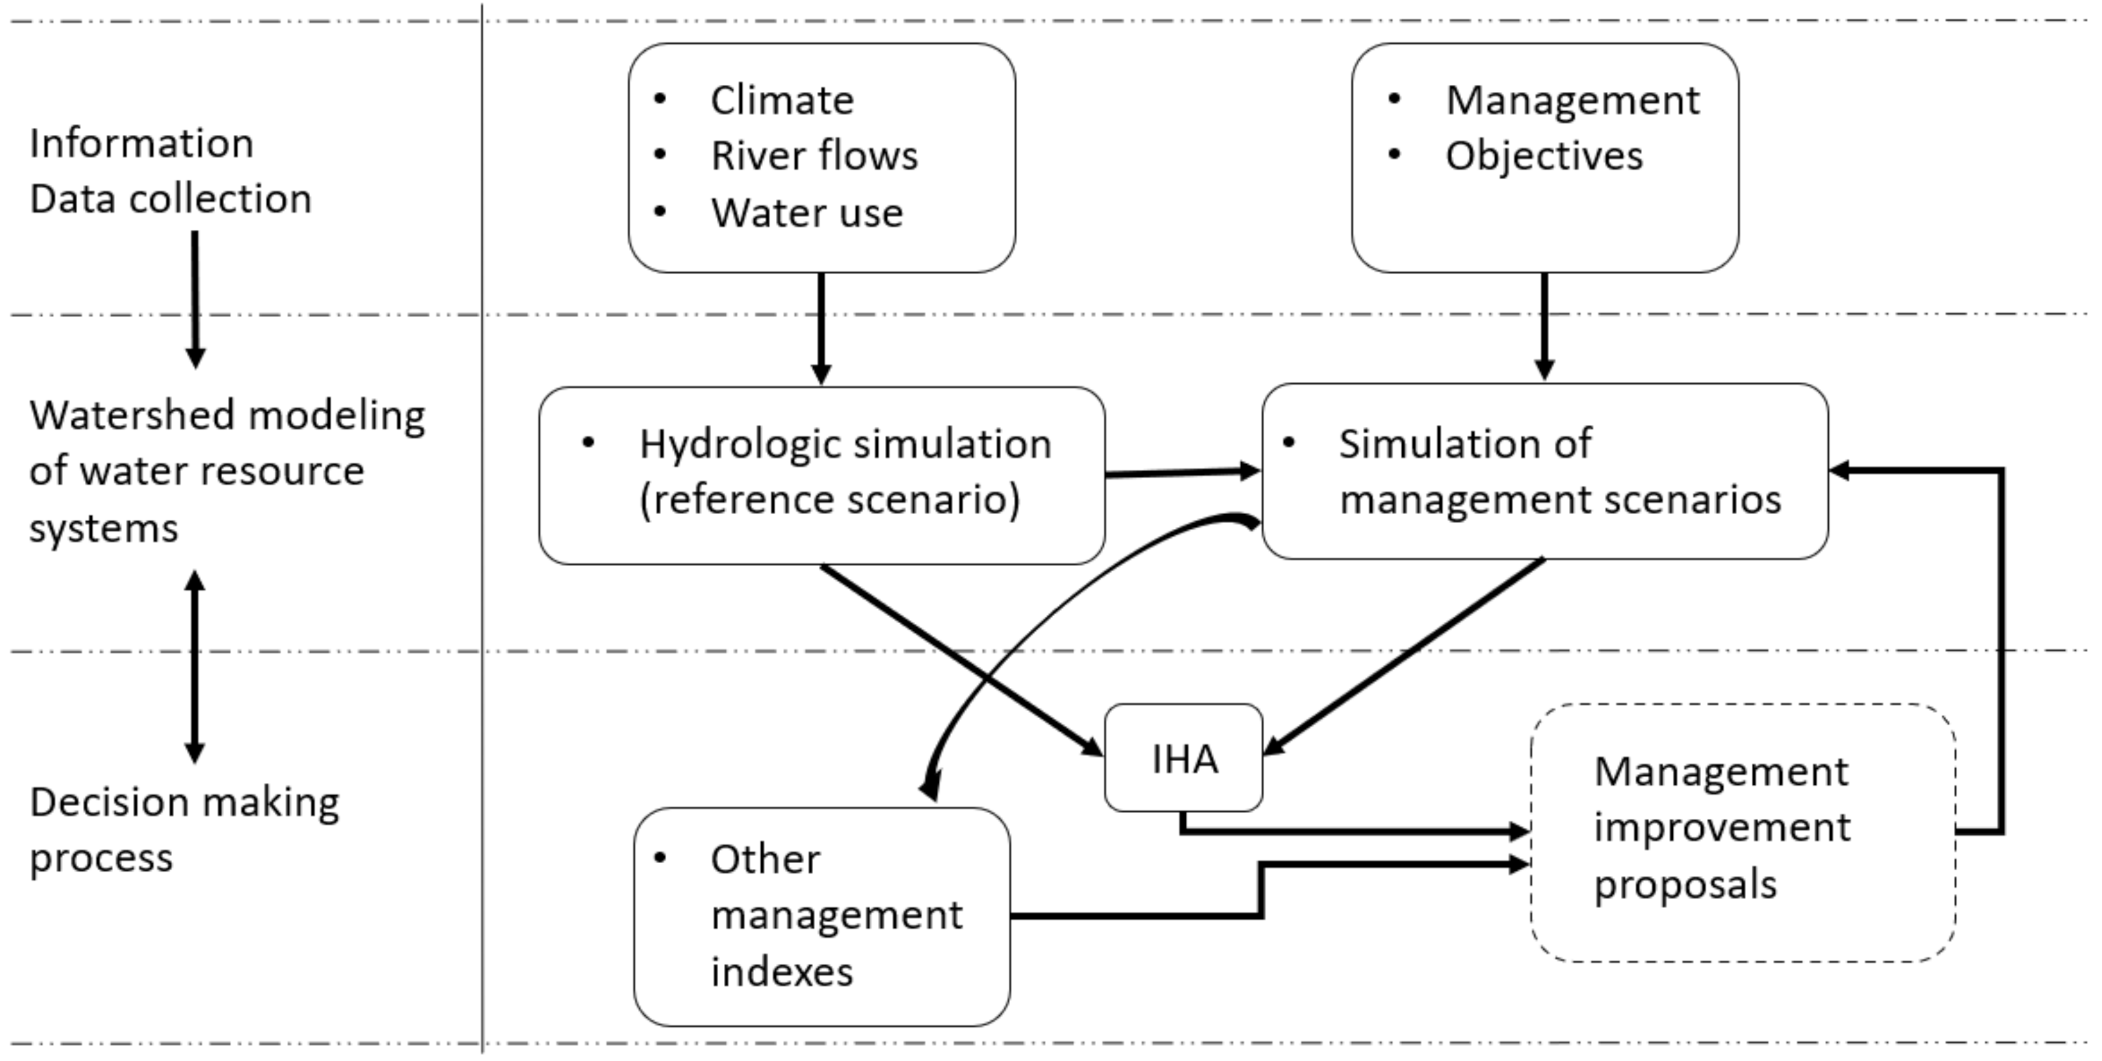
The IHA were assessed through the joint application of two models: a hydrological model and a water allocation model. The hydrological model was used to estimate a reference scenario equivalent to the natural regime, whereas the water allocation model was applied to represent the regulated (altered) regime.
The resulting data of both regimes allowed for the calculation of the IHA for the system evaluation. Furthermore, the water allocation model was also used to simulate various regulation scenarios, which are helpful for the decision-making process. In the case study, different environmental flows were analyzed, evaluating their impact on both the hydrological alteration and the demand guarantees.
Figure 1 shows the general outline of the methodology.
2.1. Rainfall–Runoff Model
Hydrological models have been widely developed across the world to replicate the dominant hydrological processes that are involved in the basin functioning and find out the impact of several factors (such as climate and soil properties) on hydrology and water resources. These models enable the investigation on many practical and pressing issues that arise during the planning, design, operation and management of water resources systems [
23]. Rainfall, air temperature, soil characteristics, topography, vegetation and hydrogeology are some of the inputs that are required by different models, which can be applied in overly complex and large basins. Some examples of these models are the Hydrologiska Byråns Vattenbalansavdelning (HBV) [
24], Sacramento Soil Moisture Accounting (SAC-SMA) [
25], Génie rural à 4 paramètres journalier (GR4)J [
26], topography-based probability distributed model (TOPDM) [
27] and Soil and Water Assessment Tool (SWAT) [
28,
29].
As stated above, the determination of the hydrological alteration in a river system requires a comparison between natural and altered regimes. The natural regime generated through a hydrological model is a basic input for the proper application of the water allocation model that, along with information of the water demands and guarantees, generates the results for the altered regime, which are then used for the calculation of the hydrological alteration of the system.
For this study, the SIMPA model [
30] was used. It is a conceptual quasi-distributed model that replicates the essential components of the natural hydrological cycle on a monthly scale, with the implementation, in a distributed way, of a classic lumped soil moisture balance model [
31]. Over 100 control points along the Spanish territory were used to calibrate the model, including river gauging stations in natural river sections [
32].
The inputs for the model consist of hydrological parameters (i.e., maximum soil storage, maximum infiltration capacity), historical flow data of the testing points and raster layers with precipitation and temperature information at a monthly time step. The spatial resolution of the layers is 1 km2 and they are used to define potential evapotranspiration by combining the Thornthwaite and Penman–Monteith methods.
The model obtains data layers of the different storages, soil moisture, aquifer volume, evapotranspiration and total runoff. The latter is obtained as the sum of the surface and underground runoff. Monthly flows, in each time step, are obtained by integrating the total runoff in the catchments to the simulation points.
SIMPA has been previously used for the elaboration of relevant documents at a national level in Spain, such as the White Paper Book of Waters in Spain and the National Water Master Plans [
33,
34], as well as in numerous research works [
35,
36,
37,
38].
2.2. Water Allocation Model
Water allocation models provide information and insights that can help improve the management and planning of water resource systems [
39]. They offer the opportunity to replicate source–demand interactions in critical conditions (e.g., droughts) and project rule modifications to establish adequate mitigation measures. The assessment of different scenarios allows these measures to be effective and efficient.
These models are used to emulate and establish the current condition of a water system, which provides a snapshot of actual water demands, resources and supplies for the system. Different management scenarios can be defined based on different arrangements of future trends that rely on policies and factors that could affect demands, supplies and/or hydrological variables. These scenarios are later evaluated with reference to the suitability of water resources, costs, benefits and environmental impacts.
There is a wide range of simulation models which have been used in different systems around the world. Each model has its own characteristics in relation to the requirements for which it was created. For instance, models like MODSIM [
17] and water evaluation and planning system (WEAP) [
20] apply optimization methods to generate results that are used to perform the simulation of water allocation in the system, while other models, such as RIBASIM [
18] and WARGI-SIM [
19], perform only simulation processes based on a more conventional if–then approach.
In this study, the SIMGES model [
40] was used to estimate the hydrological alteration degree of the basin in the current situation, and to analyze different alternatives (scenarios) of minimum environmental flows. SIMGES is a water resources management simulation model that is part of the decision support system (DSS) AQUATOOL [
16]. AQUATOOL was designed as a user-friendly interface for the operational management and planning stages for decision makers in complex basins under different scenarios. The SIMGES model has been used in most Spanish river basin districts to help develop the river basin plans [
34]. It has also been used for several purposes across the Spanish territory, such as improving water management in basins with high evaporation [
41], managing water quality [
42,
43] and analyzing the effects of climate change in water resource management [
44,
45].
SIMGES performs a monthly scale analysis based on the modeling of a conservative flow network, considering different types of elements that need to be differentiated between natural elements in the river basin and anthropogenic elements that produce alterations in river flows. The natural elements considered are streamflows, aquifers and their interactions. The SIMGES model uses the information obtained with the rainfall–runoff model to simulate the natural streamflows, which characterize the flows of a particular area of the basin corresponding to its drain point and represent the flows available to be managed [
46]. The simulation of anthropogenic elements or infrastructures (e.g., reservoirs, pumping wells and channels) allows decision makers to perform more informed operation and management of the available water resources.
Water balances or continuity equations are calculated to define the surface subsystems. The interaction between surface elements and aquifers can be simulated using simple unicellular models, multicellular models or distributed linear flow models. The simulation of the water resources management is achieved with the support of operation rules. These rules, which are provided by the user, intend to maintain a similar filling level in reservoirs of the basin that represent their real level. Environmental flows and water use priorities are also considered in the model. The model also allows the user to define a minimum flow in each streamflow, which would correspond to the environmental flow.
2.3. Indicators of Hydrological Alternation (IHA)
The determination of the degree of hydrological alteration in water systems depends on the treatment of the interannual statistical information between the natural and altered flow regimes. The indicators used in this work are adapted from the methodology developed by [
11]. Due to the nature of the available data, it is not possible to use all the original parameters, so it is necessary to use those that are adaptable to a monthly scale. The author of [
47] adapted a set of 12 indicators estimated from their mean values for an entire time series. These indicators, which are detailed in
Appendix A, are classified into normal values (IHA1-IHA6), maximum extreme values (IHA7-IHA9) and minimum extreme values (IHA10-IHA12). In addition, for each of these types, three aspects are selected as those of the greatest environmental significance:
Magnitude (IHA1, IHA2, IHA7 and IHA10), as it determines the general availability of water in the ecosystem.
Frequency of occurrence of an event in each interval of time (IHA3, IHA4, IHA8 and IHA11), which is indicative of the variability in the flow regime, affecting the geomorphological and ecological dynamics and, as a result, the ecological diversity.
Seasonality or the regularity with which an event occurs at a certain time of the year (IHA5, IHA6, IHA9 and IHA12), which is an aspect intricately linked to the species life cycles.
The twelve IHA analyzed in this work, which are obtained on a monthly scale, are determined for the natural and altered regimes in all of the river sections that are considered for the system management. Then, a weighted mean of the parameter is obtained as a function of the runoff in each river section, thus defining the indicator value for the entire basin. The indicators adopt values between 0 and 1, where 0 is the total alteration and 1 is the unaltered state. If the value of the indicator is greater than 1, it shall be replaced by its inverse value.
Table 1 shows the level of alteration as a function of the IHA value. While level 1 corresponds with an exceptionally good state, level 5 indicates a poor state.
Finally, a global indicator of hydrological alteration (
) was obtained as the mean of the twelve indicators described:
where
is the indicator of hydrological alteration
.
Following the assessment of the indicators in the current situation, different basin management scenarios were defined with the aim of improving the indicator values, and therefore reduced the hydrologic alteration in the basin through the increment of the environmental flows. The water allocation model allows for determining to what extent it is possible to increase the minimum flows and improve the indicators without altering the supply guarantees to the different water demands.
3. Case Study
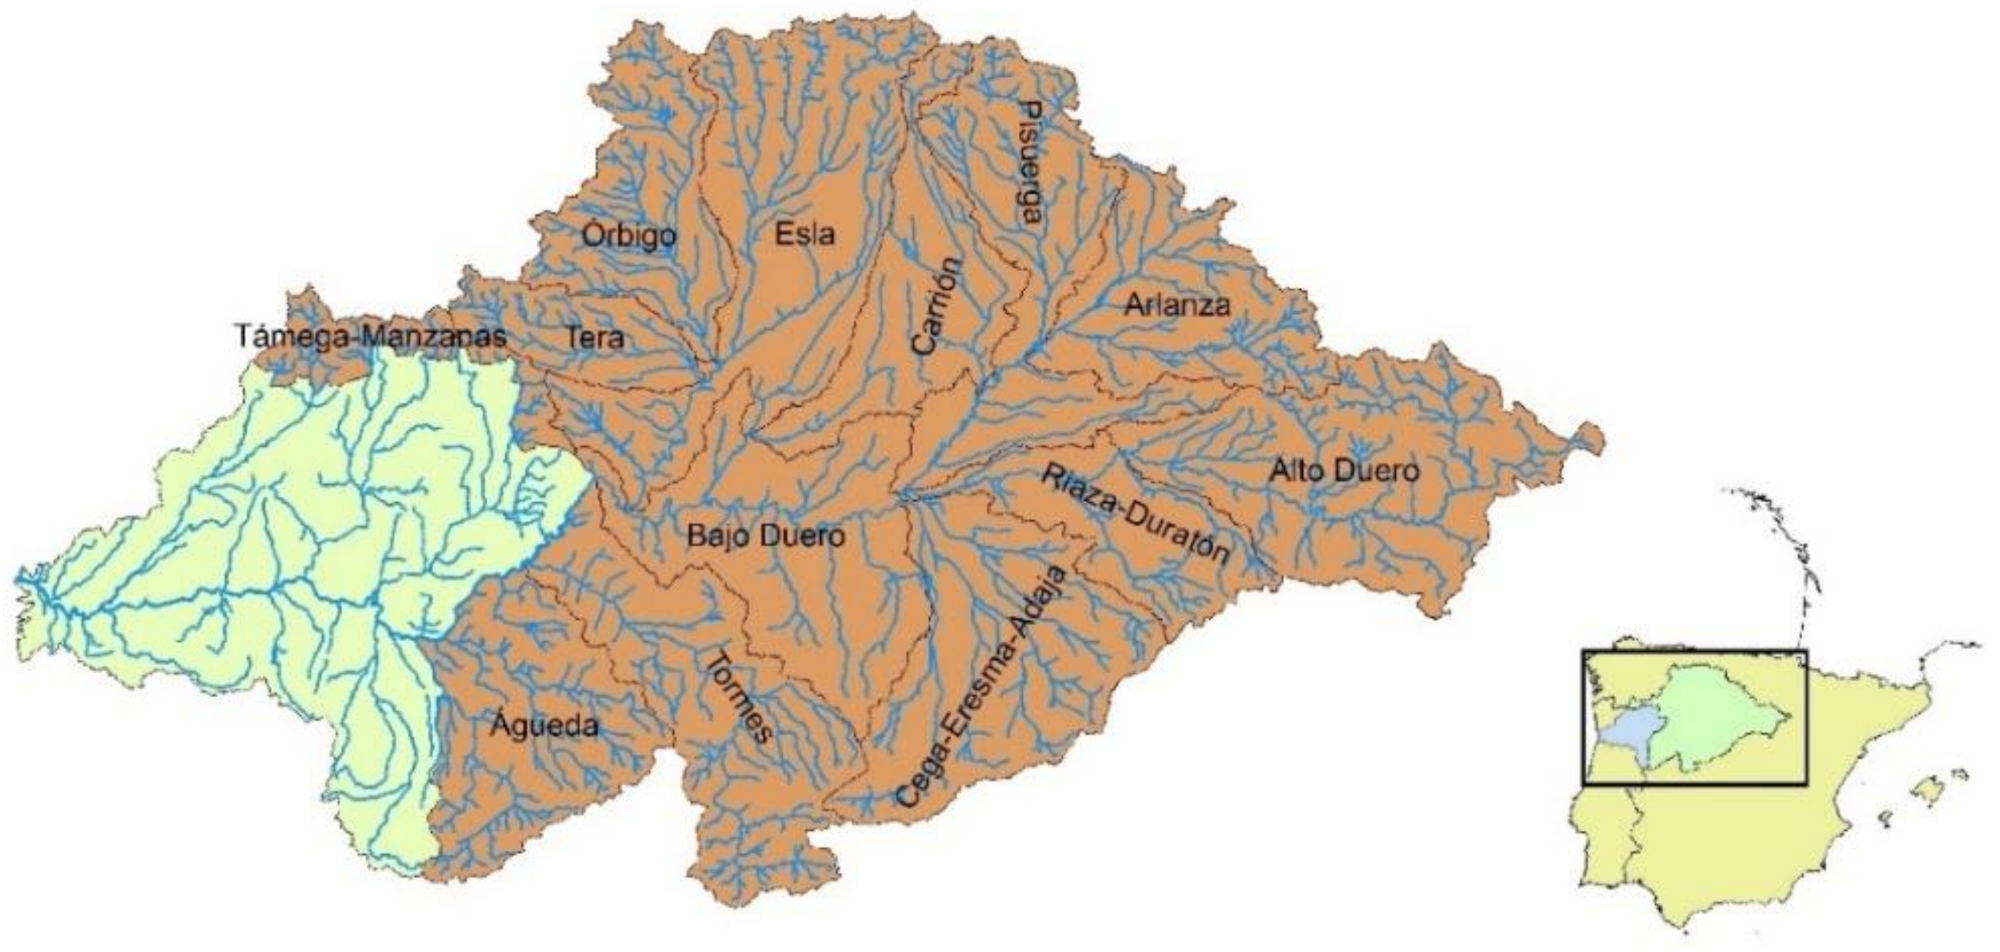
The Duero River basin covers a total area of 98,073 km
2 (
Figure 2) and is the largest basin of the Iberian Peninsula. The basin comprises territories of Spain (78,859 km
2) and Portugal (19,214 km
2). The 400 km border between the two countries is crossed by several rivers, among which the Duero River stands out. The focus of this study is the Spanish part of the basin, which represents 15.6% of the total Spanish territory. The population of the basin is about 2.2 million unequally distributed. Villages with a population lower than 1000 inhabitants predominate, while there are few urban areas (47% of the total population) with more than 50,000 people.
The climate is continental with a strong Mediterranean character. The mean annual precipitation is 612 mm and the climatic variation within the river basin is significant. The average rainfall fluctuates from 1800 mm in the upstream mountains to less than 400 mm in the inner territory. The precipitation is seasonally dependent; the dry period coincides with warmer temperatures. The water system has 75 large reservoirs with a total storage capacity of 7500 million m
3. This capacity allows for achieving the objectives of supplying demands and producing hydropower energy. The Duero River Basin Authority (CHD by its Spanish acronym) manages the water resources in the basin. CHD divided the watershed into 5 management units (zones) and 13 exploitation subsystems or subzones (
Table 2).
For this work, a time series of inflows from 1980 to 2004 was obtained with the SIMPA hydrological model, which is the same time series that was used to elaborate the Duero Hydrological Plan (DHP) [
34]. The results are presented as raster layers that correspond to the inflow values in millimeters. Using geographical information system (GIS) software, the cells included in each of the water bodies were identified, thus obtaining the runoff generated by each of them. The process is then repeated for the entire time series, obtaining a runoff value for each month and each water body. The runoff information generated by this model corresponds to the natural regime. Once the time series for each water mass are obtained, the SIMGES water allocation model uses the water mass data as inflow elements. The simulation showed that the mean annual inflows in the entire basin and in the Spanish part of the basin during the study period were 138,884 hm
3 and 12,723 hm
3, respectively. To develop the water allocation model, the topology of the Duero basin was defined. The Portuguese portion of the basin was also incorporated into the model to properly establish the conductions of the entire system.
Figure 3 shows one of the Duero River basin subsystems in the water allocation model.
The water demands in the Duero basin are predominantly for agricultural purposes, leading to an annual volume of 2145 hm3, which represents 73.44% of the total annual demand volume (2922 hm3). To perform the simulation, the demands considered in the Duero basin model for the year 2021 were obtained from the DHP. The model also considers how the system interacts with the “Terciario detrítico central del Duero” aquifer, which is exploited in the areas of Arlanzón, Bajo Duero and Pisuerga.
The hydrological plan establishes minimum monthly values of flow that must circulate through water bodies to achieve environmental objectives. These objectives aim to maintain the functionality and structure of aquatic ecosystems and the associated terrestrial ecosystems in a sustainable manner, contributing to the achievement of a good ecological status or potential in rivers and transitional waters. The Duero water allocation model incorporates the values of the minimum flows considered by the DHP, following a selection criterion based on the capacity of the reservoir, where the minimum annual volume is greater than 1 hm3. Overall, the model features 48 river segments with environmental flow data.
4. Results and Discussion
4.1. Hydrological Alteration in the Current Situation
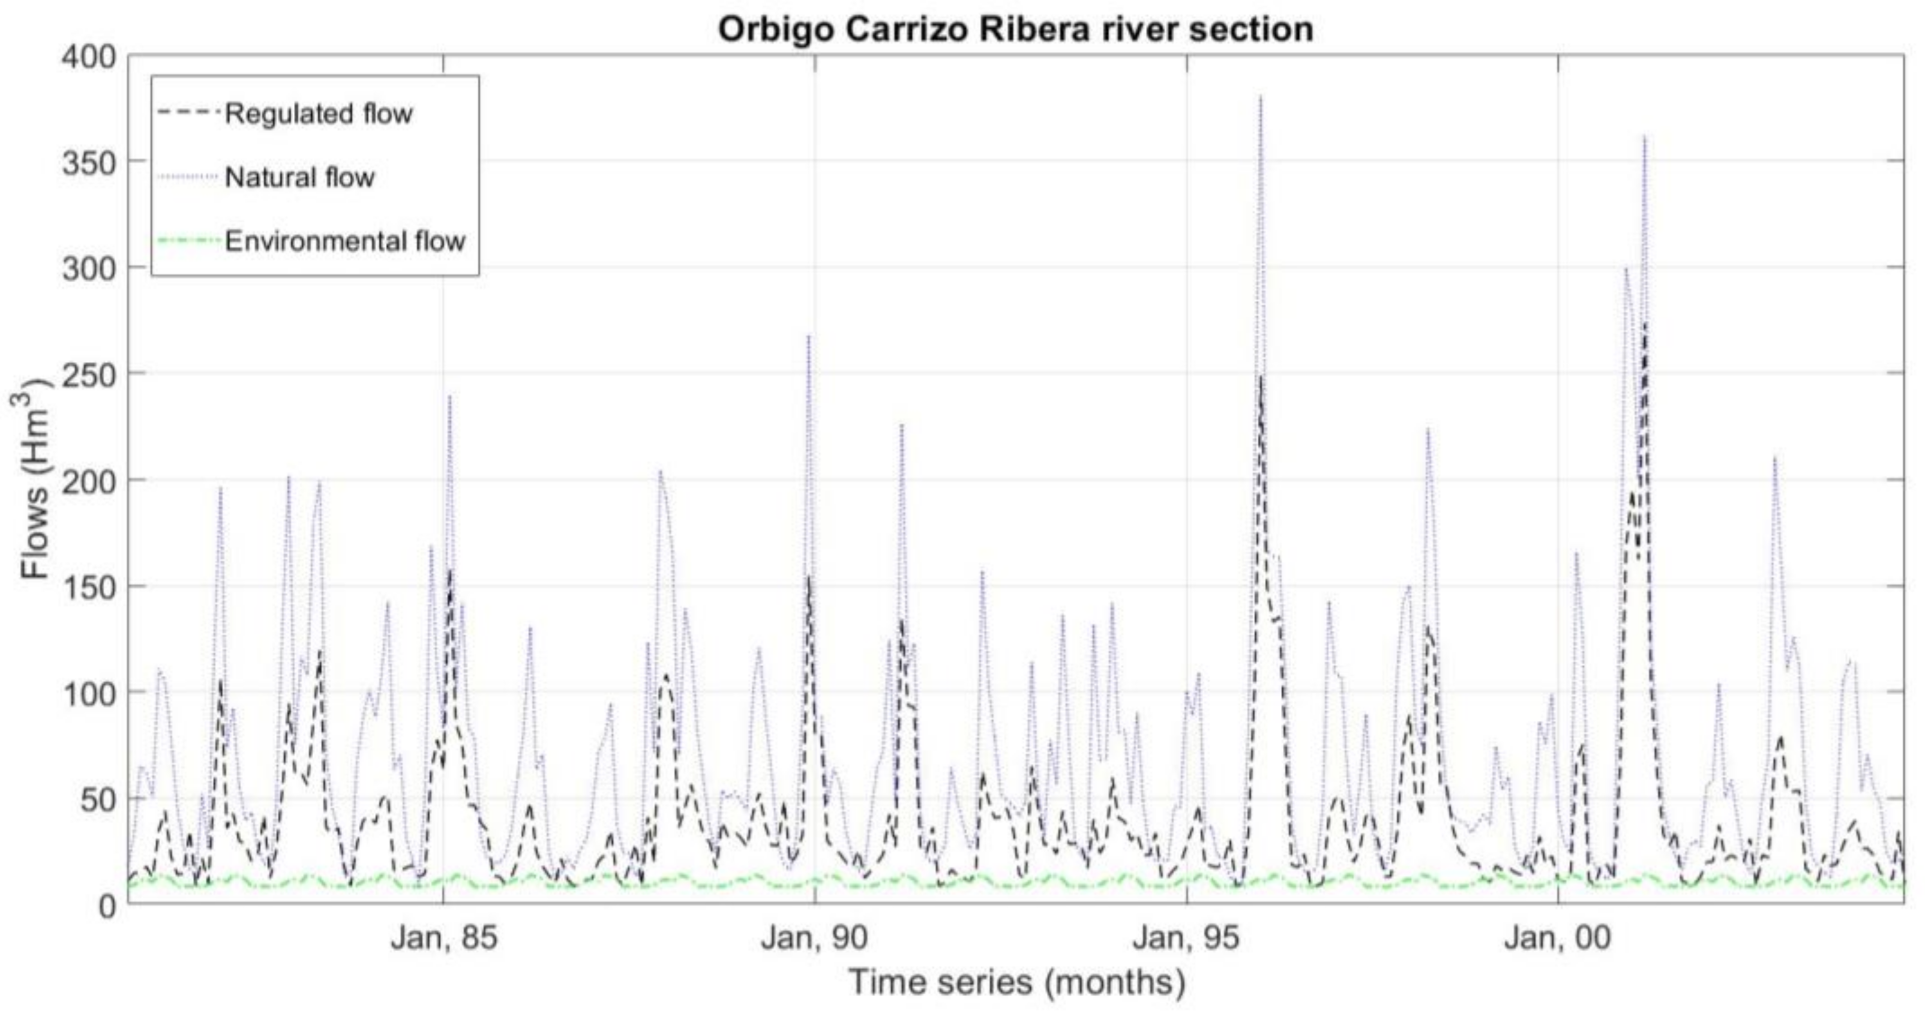
To perform the calculation of the indicators of hydrological alteration, the input data of the natural and altered regimes must be comparable. For this purpose, with the support of the water allocation model defined in SIMGES, a simulation was carried out considering only the hydrological model inputs and disregarding any additional information that would represent anthropogenic interaction with the system, thus representing the natural regime in the model. The simulations generated flows in each of the river sections included in the management model.
Figure 4 shows the result of the simulations performed for natural and altered regimes in one of the river segments defined in the model. The figure also depicts the environmental flow regime that was provided for this river section.
The IHA were calculated by evaluating each river segment within the management model of the Duero River basin. For each of these segments, the elements required for the calculation of each indicator (average monthly flow, average annual flow, maximum flow, minimum flow, percentiles) were determined for the two types of regimes (natural and regulated) over the 24-year simulation period (1980–2004). The results obtained with the hydrological model constitute the natural regime, while the results of the water allocation model in the same segments represent the regulated (altered) regime.
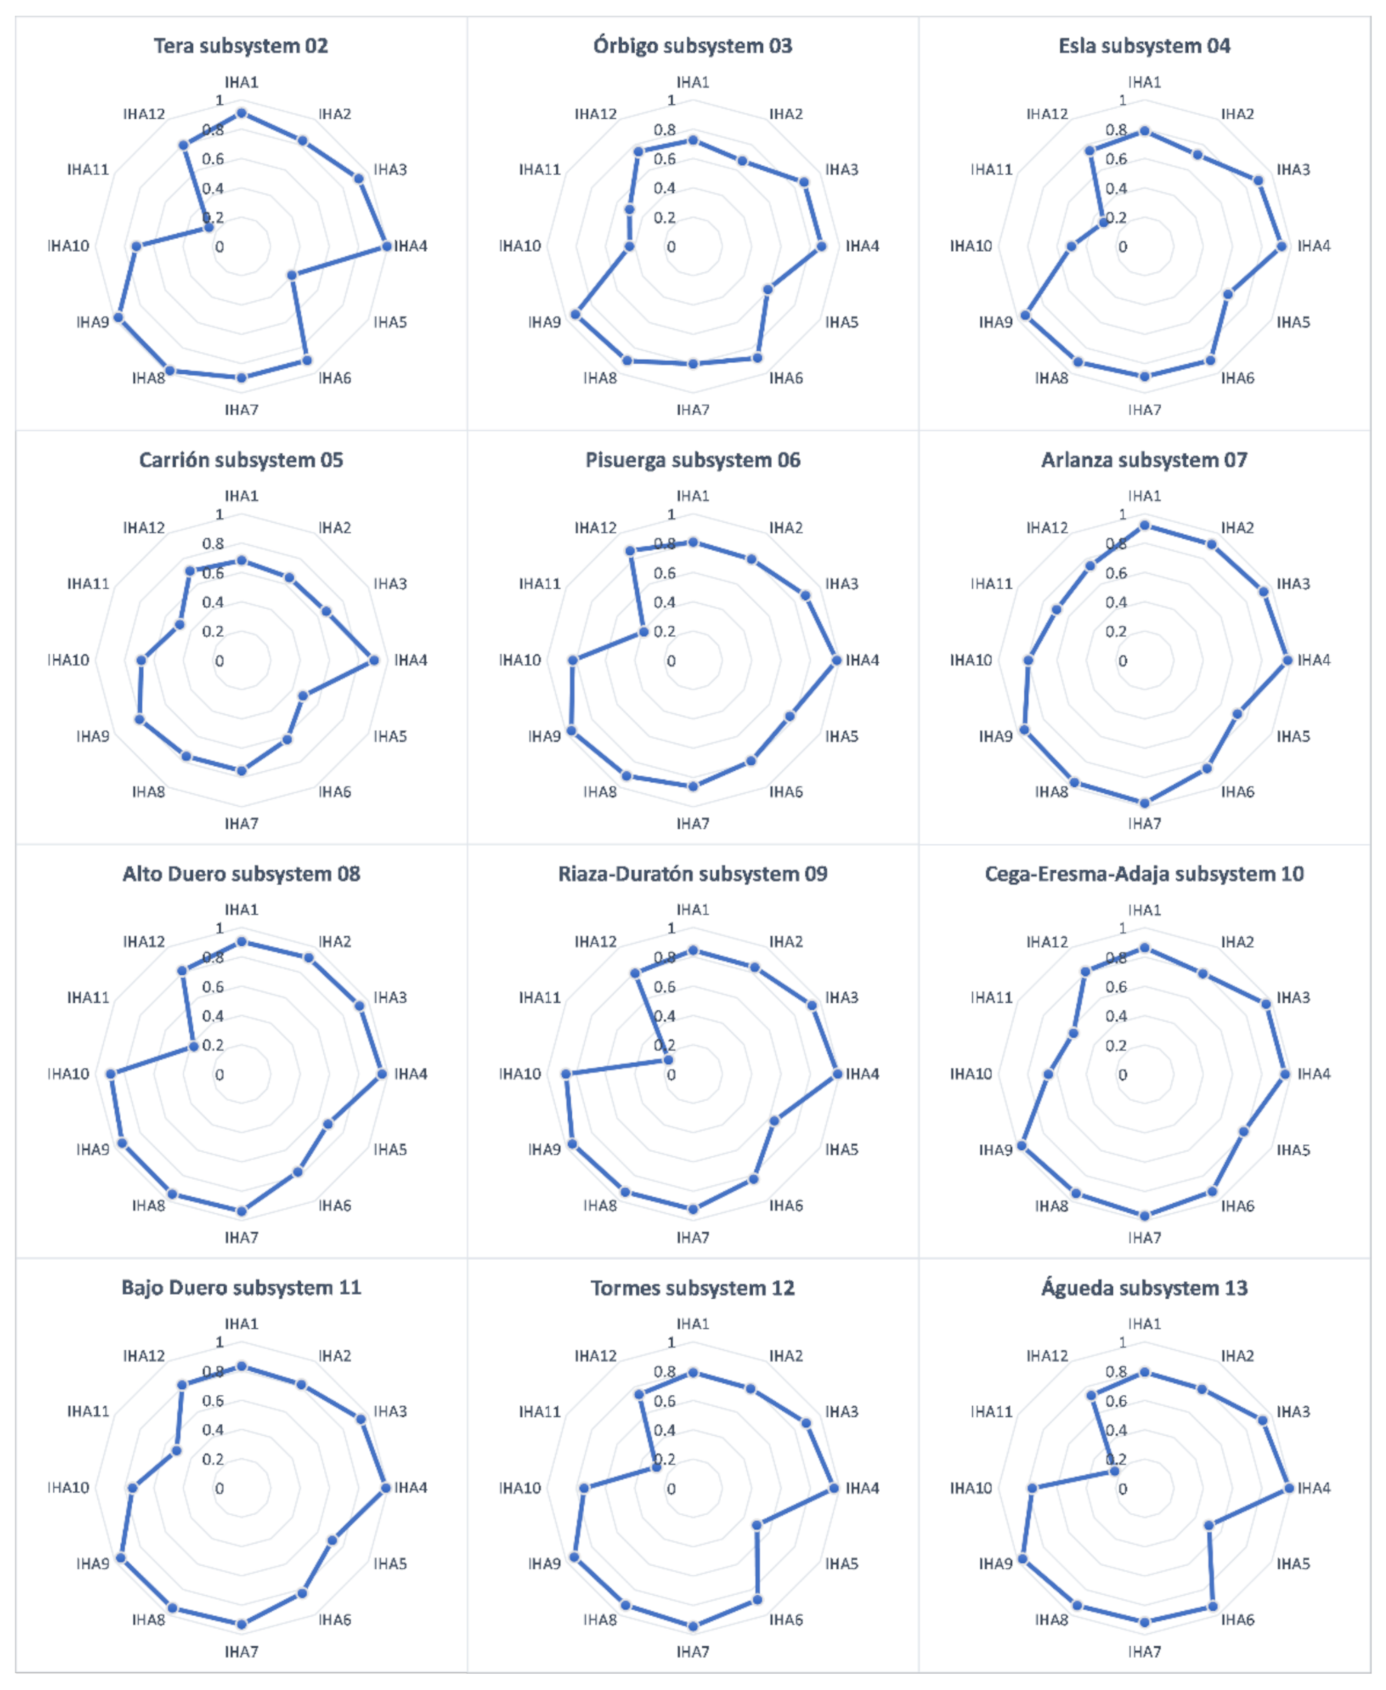
Once the indicators were obtained for all the river segments, the next step consisted of grouping them by subsystems for a better understanding on a basin scale. The process consisted of calculating the weighted mean of the indicators for the river segments belonging to the same subsystem. The weight of each river section was based on its corresponding mean annual flows. The results of the IHA in the twelve subsystems that are fully within the Spanish part of the Duero River basin are shown in
Figure 5.
As for indicators associated with normal values, the IHA5 indicator presents a significant alteration in most of the subsystems, which is associated with the high regulation in the basin. This leads to a time gap between the maximum flows of the regulated and natural regimes, thus altering the seasonality. The values of the other normal indicators are categorized as acceptable. The indicator IHA4 reveals that the variability associated with extreme flow values remains unchanged between the two regimes in all the subsystems.
On the other hand, the indicators associated with maximum extreme events (IHA7, IHA8 and IHA9) exhibit the least alteration in all the subsystems, indicating that the system regulation does not significantly affect flooding events in the basin. Finally, the indicators associated with minimum extreme events (IHA10, IHA11 and IHA12) reveal a significant alteration in the basin, which is due to both the frequent drought events in the study zone and the high regulation in the entire system. The existing operating rules guarantee the water supply to the different demands of the basin.
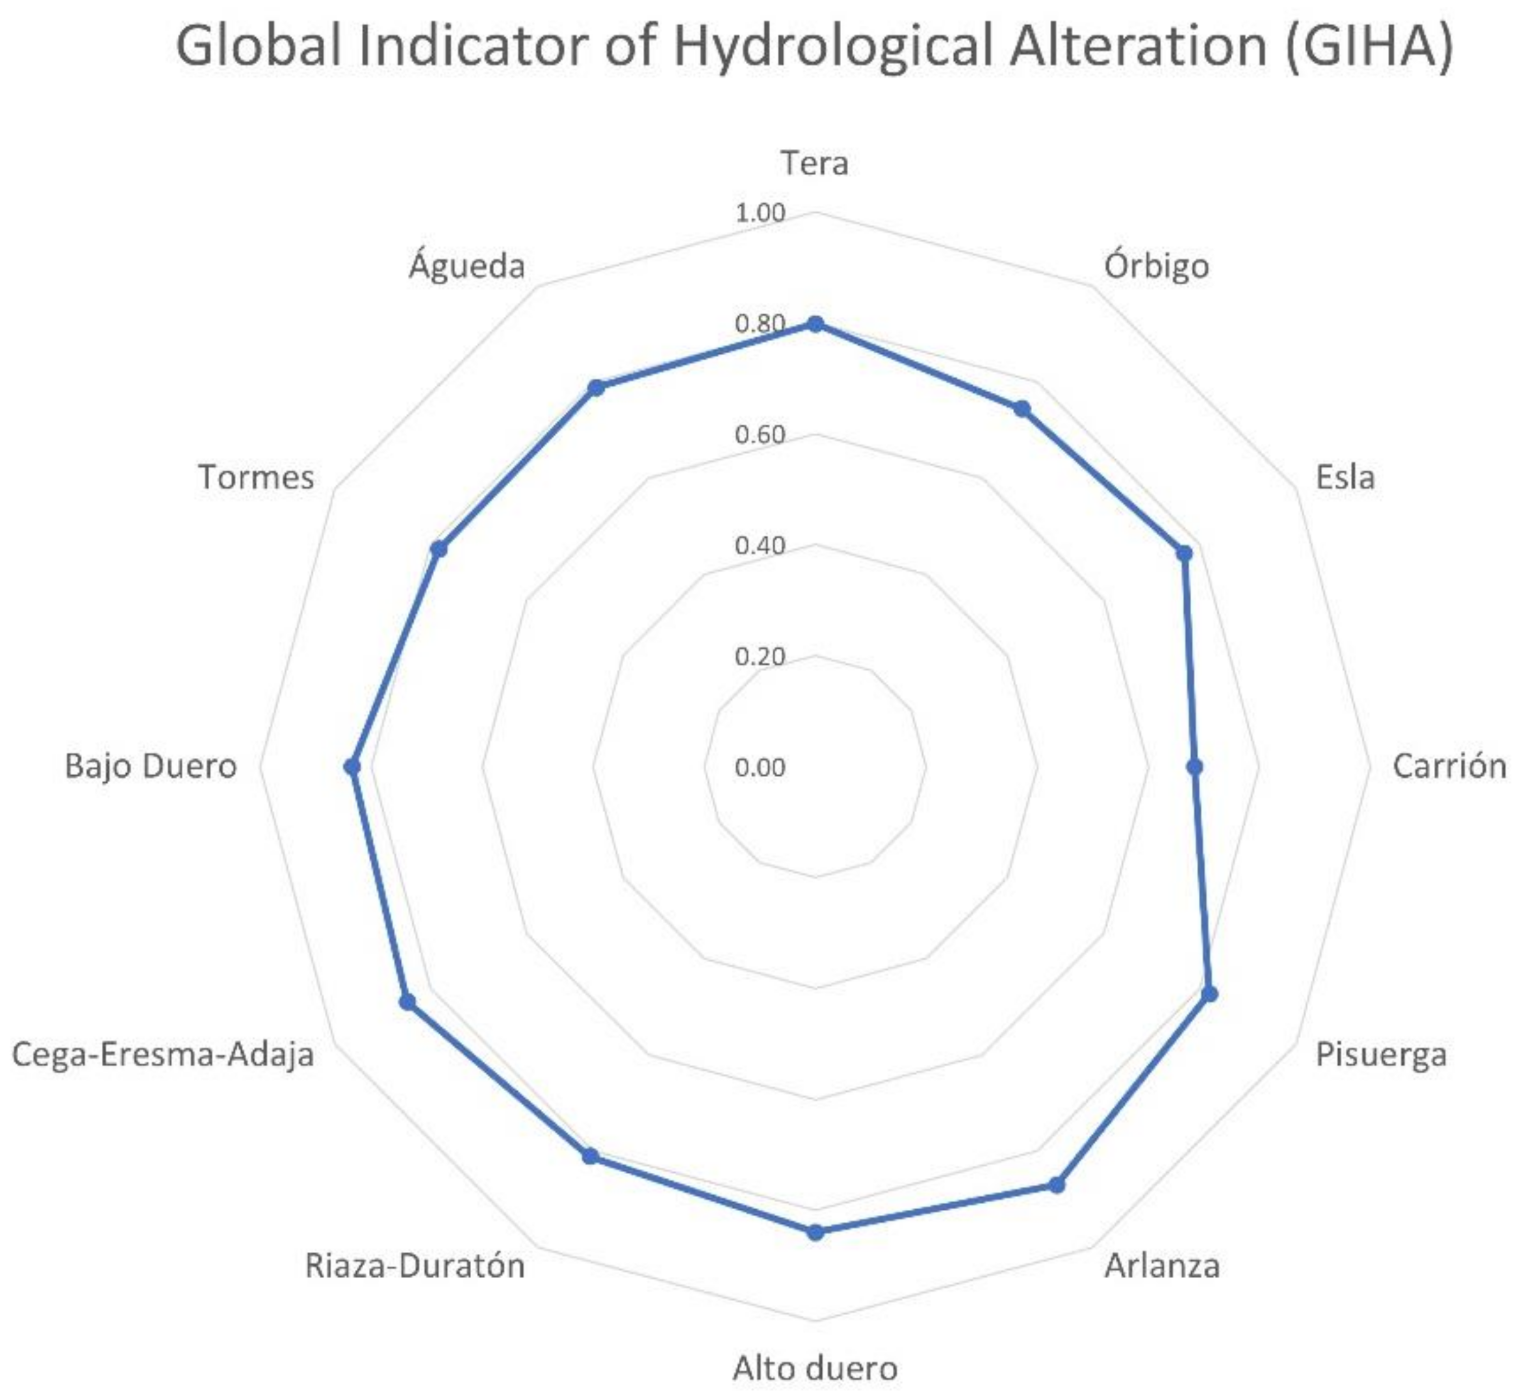
The global indicator of hydrological alteration was also calculated for each subsystem, obtaining values that fluctuate between 0.68 and 0.87 (
Figure 6). These results indicate that, overall, the hydrological status of the system is good. However, based on the specific information provided by the other indicators (
Figure 5), the current hydrological status of the basin can be improved.
4.2. Hydrological Alteration for Different Minimum Flow Scenarios
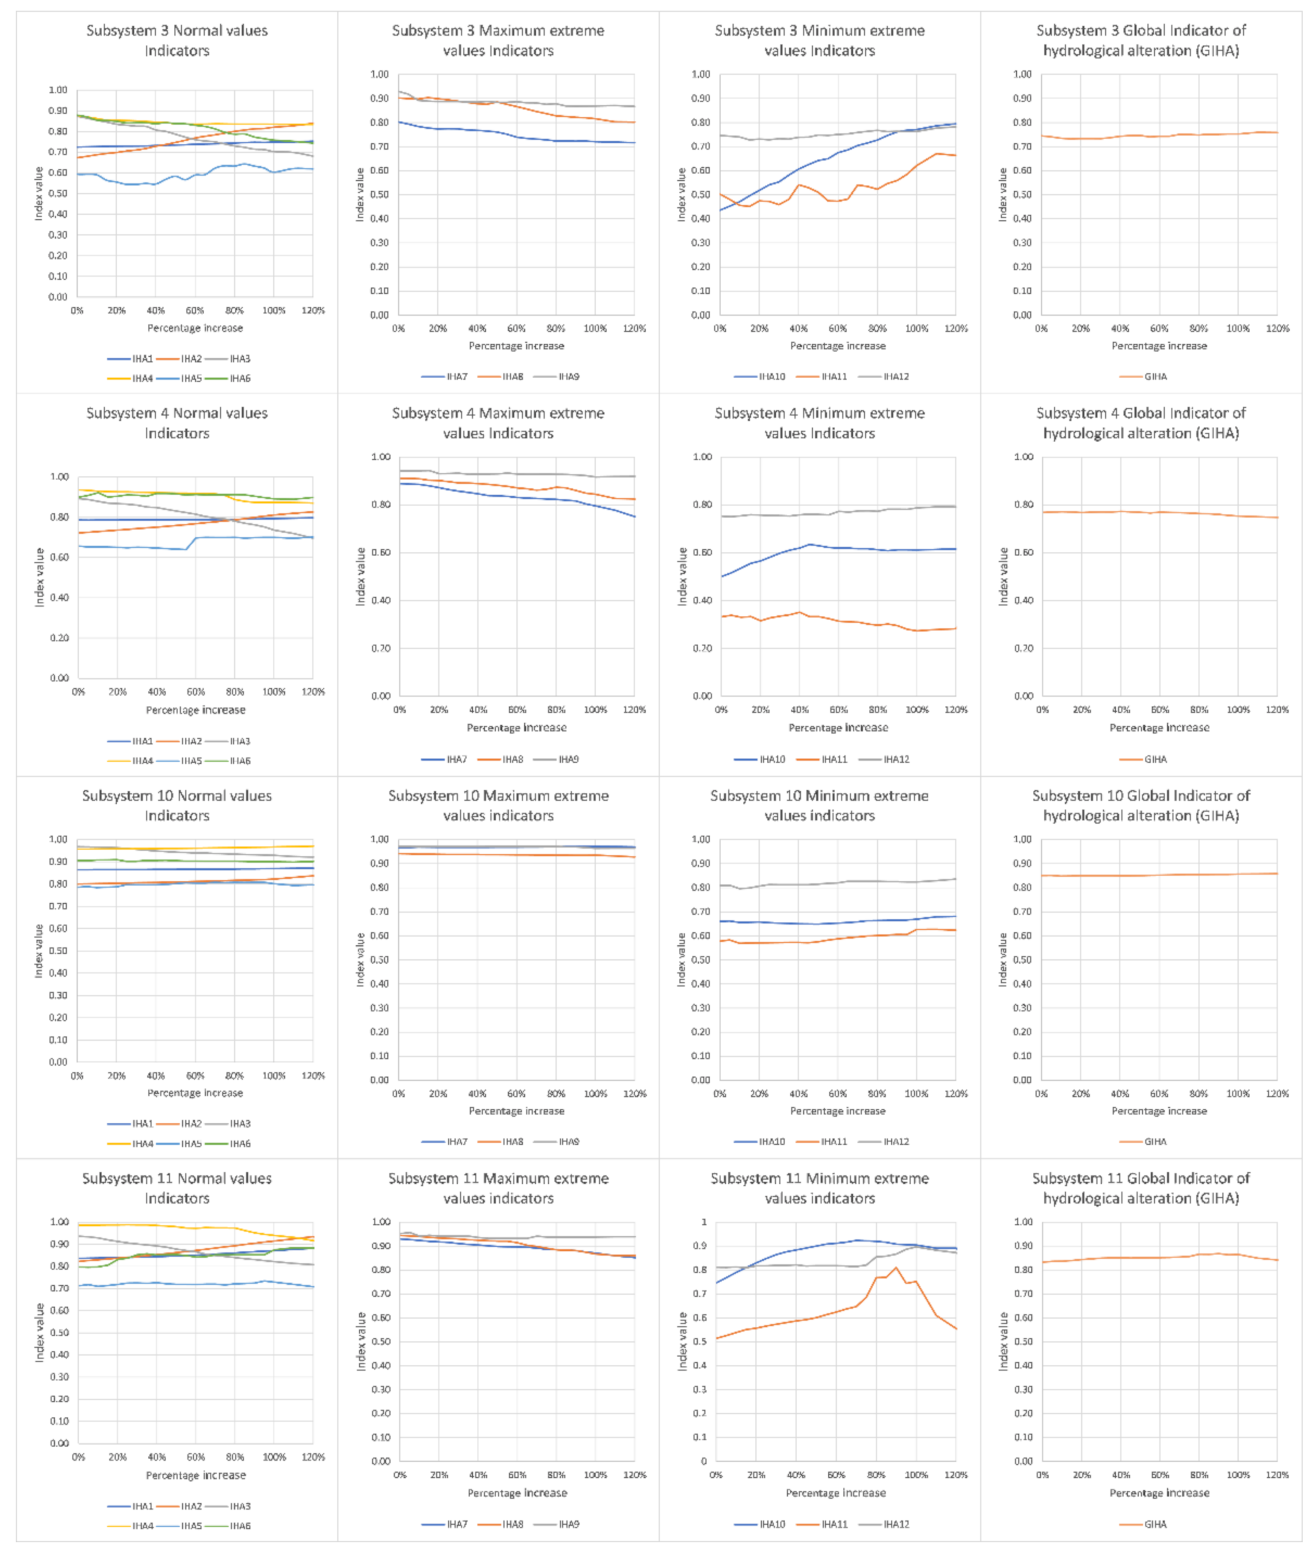
Once the current hydrological status of the basin was known, new management scenarios in the water allocation model were tested to improve the IHA. The management scenarios consisted of increasing the minimum flow values established in the hydrological plan by 5% up to 120%. To facilitate the interpretation and comparison of the results, they were classified into normal values (IHA1 to IHA6), maximum extreme values (IHA7 to IHA9), minimum extreme values (IHA10 to IHA12) and global values (GIHA).
Figure 7 shows the results obtained in four subsystems of the Duero River basin.
As for the IHA related to normal values, the indicator related to the annual magnitude (IHA1) remains generally constant as the minimum flows are increased. The indicator related to the monthly magnitude (IHA2) shows an improvement in most of the subsystems since it is more sensitive to change due to the time scale. The variability indicator (IHA3) presents a downward trend for increasing minimum flow values, while the extreme variability indicator (IHA4) remains stable, thus indicating that the increment in minimum flows does not significantly affect this alteration metric. The increment in minimum flows in a homogeneous way subtly inhibits the river flow variability in the subsystems, as it is illustrated by IHA5 and IHA6.
In the case of the indicators associated with flood extreme values, the metrics related to magnitude (IHA7) and variability (IHA8) present a downward trend. This implies that by requiring the model to circulate more flow throughout the basin, the peak flows are reduced, resulting in a greater difference with the flow series of the natural regime. The increase in minimum flows does not improve the seasonality indicator (IHA9), which remains almost constant. This is induced by the elevated level of regulation that already exists in the entire basin, which avoids the reduction of the seasonality gap between natural and altered regimes.
Regarding the IHA associated to the minimum extreme values, the indicators related to magnitude (IHA10) and variability (IHA11) generally show positive trends in most of the subsystems, indicating an improvement in the extreme minimum flows. However, the elevated level of regulation in the Duero basin results in only a slight improvement in the seasonality indicator (IHA12) in all of the cases. Finally, the GIHA has little or no variation with increasing values of the minimum flows.
Figure 8 shows the evolution of four indicators (IHA2, IHA6, IHA8 and IHA10) as the minimum flows are varied in the twelve subsystems analyzed in this work. Reductions in the minimum flows up to 30% below their original values in the hydrological plan were also modeled to analyze how the indicators vary under more restrictive minimum flow conditions.
The indicators associated with normal values of magnitude (like IHA2) show a positive tendency in most of the subsystems for increasing values of the environmental flows. Exceptions occur in some subsystems where the value decreases (e.g., subsystems 2 and 8), which may be caused, for instance, by the size of the subsystem or the number of reservoirs within the subsystem. The indicators associated with seasonality (e.g., IHA6) and variability (e.g., IHA8) do not show a significant improvement since the variations in minimum flows do not significantly ameliorate the difference between the natural and altered regimes. In the case of the indicators related to extreme values, those related to droughts (e.g., IHA10) are more likely to vary significantly due to the existing conditions in the area, whereas the values associated with floods (e.g., IHA8) remain similar.
4.3. Effects of Minimum Flow Variations on Urban and Agricultural Demands
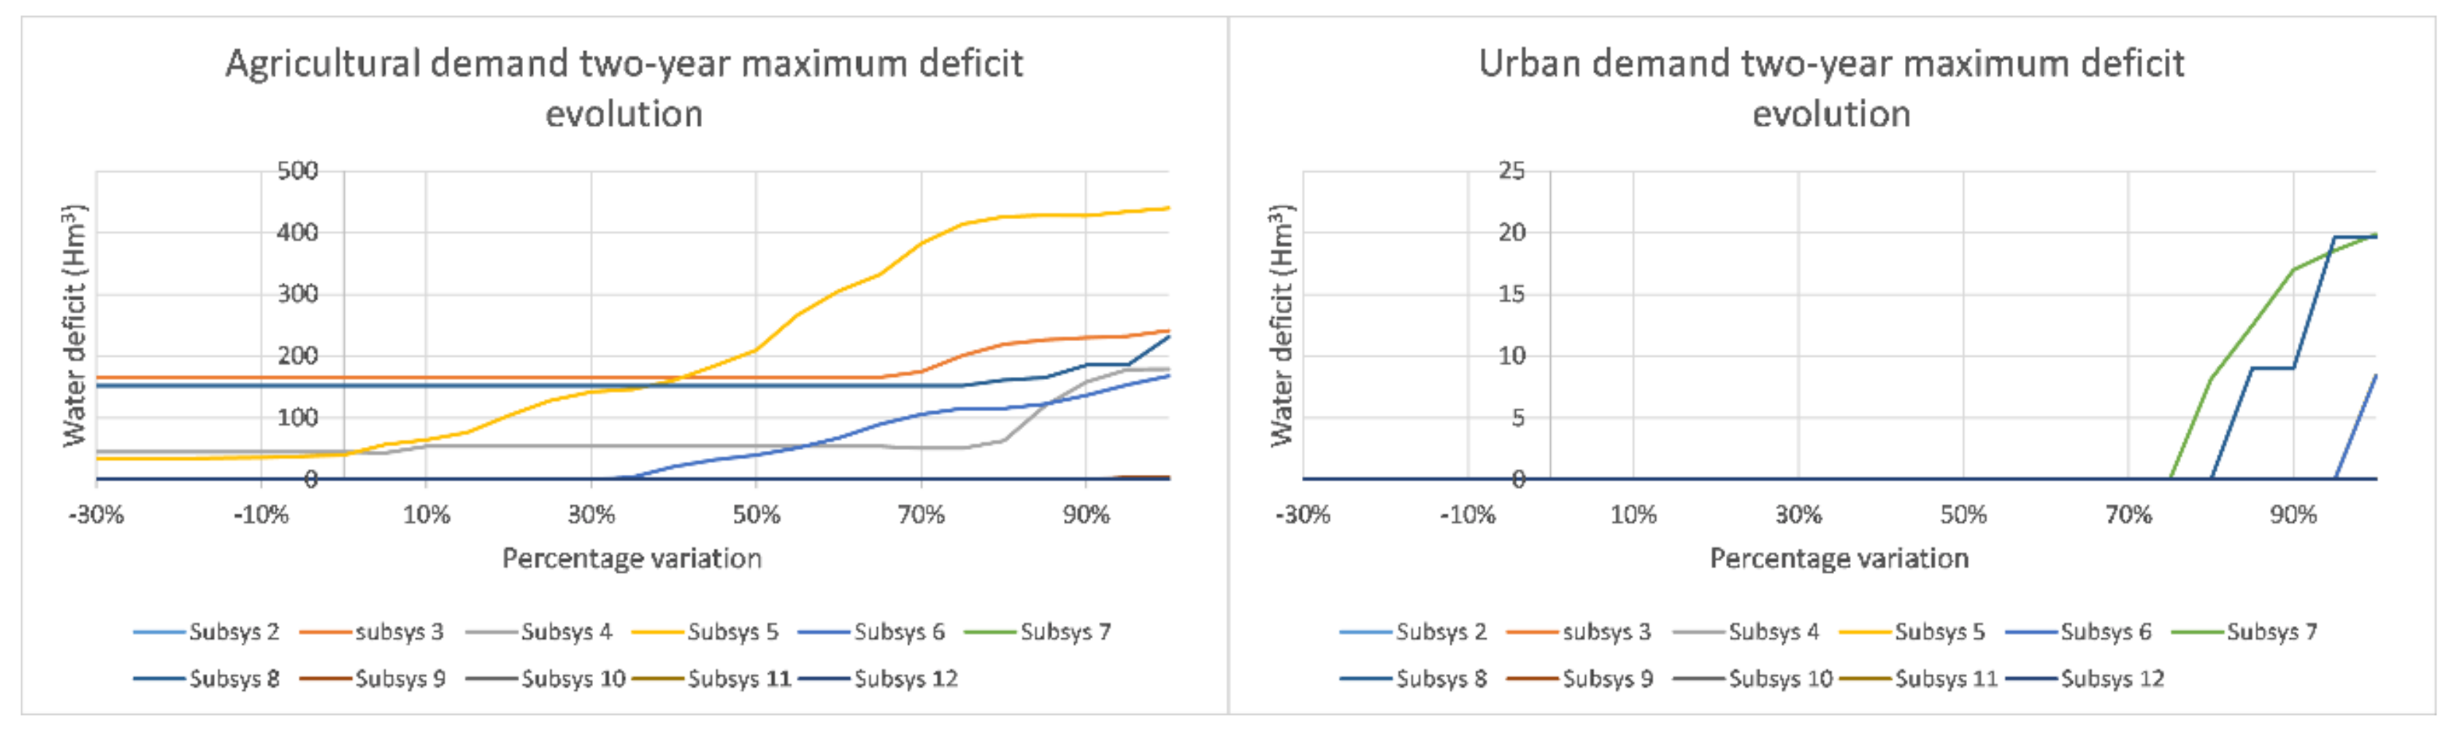
To analyze how the demand guarantees in the basin are affected by the variation in minimum flow values, the maximum short-term deficits (two years) of each subsystem for urban and agricultural demands were assessed.
Figure 9 shows the evolution of these deficits for the urban and agricultural demands as the minimum flows are varied in the water allocation model.
In the current condition established by the hydrological plan, four subsystems already show failures in their water supply guarantees for agricultural demands, whereas for urban demands, no subsystem exhibits supply failures in the current conditions. As expected, by increasing the minimum flow values, the water supply guarantee is affected, mainly the agriculture demand. The subsystems 3, 4, 5, 6 and 8 experiences greater failures in agricultural demands than those they already had for percentage flow increases around 70%, 80%, 5%, 35% and 75%, respectively. In the case of the supply guarantee to urban demand, subsystems 6, 7 and 8 begin to experience failures in urban demands for minimum flow increases from 100%, 85% and 80%, respectively.
The maximum short-term deficits obtained suggests the possibility of increasing the environmental flow values up to 30% without affecting the water demand supply in all of the subsystems except in the subsystem 5, in which the current minimum flow should be maintained.
5. Conclusions
This study presents a methodology that integrates the assessment and improvement of indicators of hydrological alteration (IHA) in conjunction with the analysis of multiple water management scenarios with a water allocation model. The improved IHA proposed in this work are useful indicators to verify the hydrological status at the basin scale (rather than only at the scale of river sections), thus providing a comprehensive vision of the status of a highly regulated water resources system.
In the case study, the results obtained for the different simulations analyzed reveal that the indicator related to the annual magnitude remains generally constant as minimum flows are increased, the indicator related to the monthly magnitude shows an improvement in most of the subsystems, the variability indicator presents a downward trend for increasing minimum flow values, while the extreme variability, maximum seasonality and minimum seasonality indicators remain comparatively stable. Regarding the indicators associated with magnitude and variability of flood extreme values, they experience a downward trend with increasing minimum flow values. Finally, the indicators associated to magnitude and variability of minimum extreme values generally show positive trends in most of the subsystems.
Thus, the values of some indicators are improved while increasing the minimum flows. Nevertheless, all of the indicators and subsystems do not react in the same way to these minimum flow variations, thus suggesting that in some cases it is necessary to propose other measures. A possible strategy to improve the IHA could be the modification of minimum flow values for each subsystem independently. Thus, the corresponding simulations would allow assessing if there is an improvement in the hydrological status throughout the entire system, ensuring that the water demands in the basin are not affected by any shortage in water supply.
The methodology presented and applied in this work constitutes an advance in the analysis of water management systems, which allows a more informed decision-making process in hydrologic planning at the basin scale. The methodology, which is extensible to other highly regulated systems across the world, allows for the simulation of multiple water management alternatives to find an optimum strategy that helps preserve or improve river basin ecosystems without affecting the water user demands.


 ,
, 


