
Hygroscopic Water Retention and Physio-Chemical Properties of Three In-House Produced Biochars from Different Feedstock Types: Implications on Substrate Amendment in Green Infrastructure


Abstract
:1. Introduction
2. Materials and Methods
2.1. Collection of Biochar Feedstock
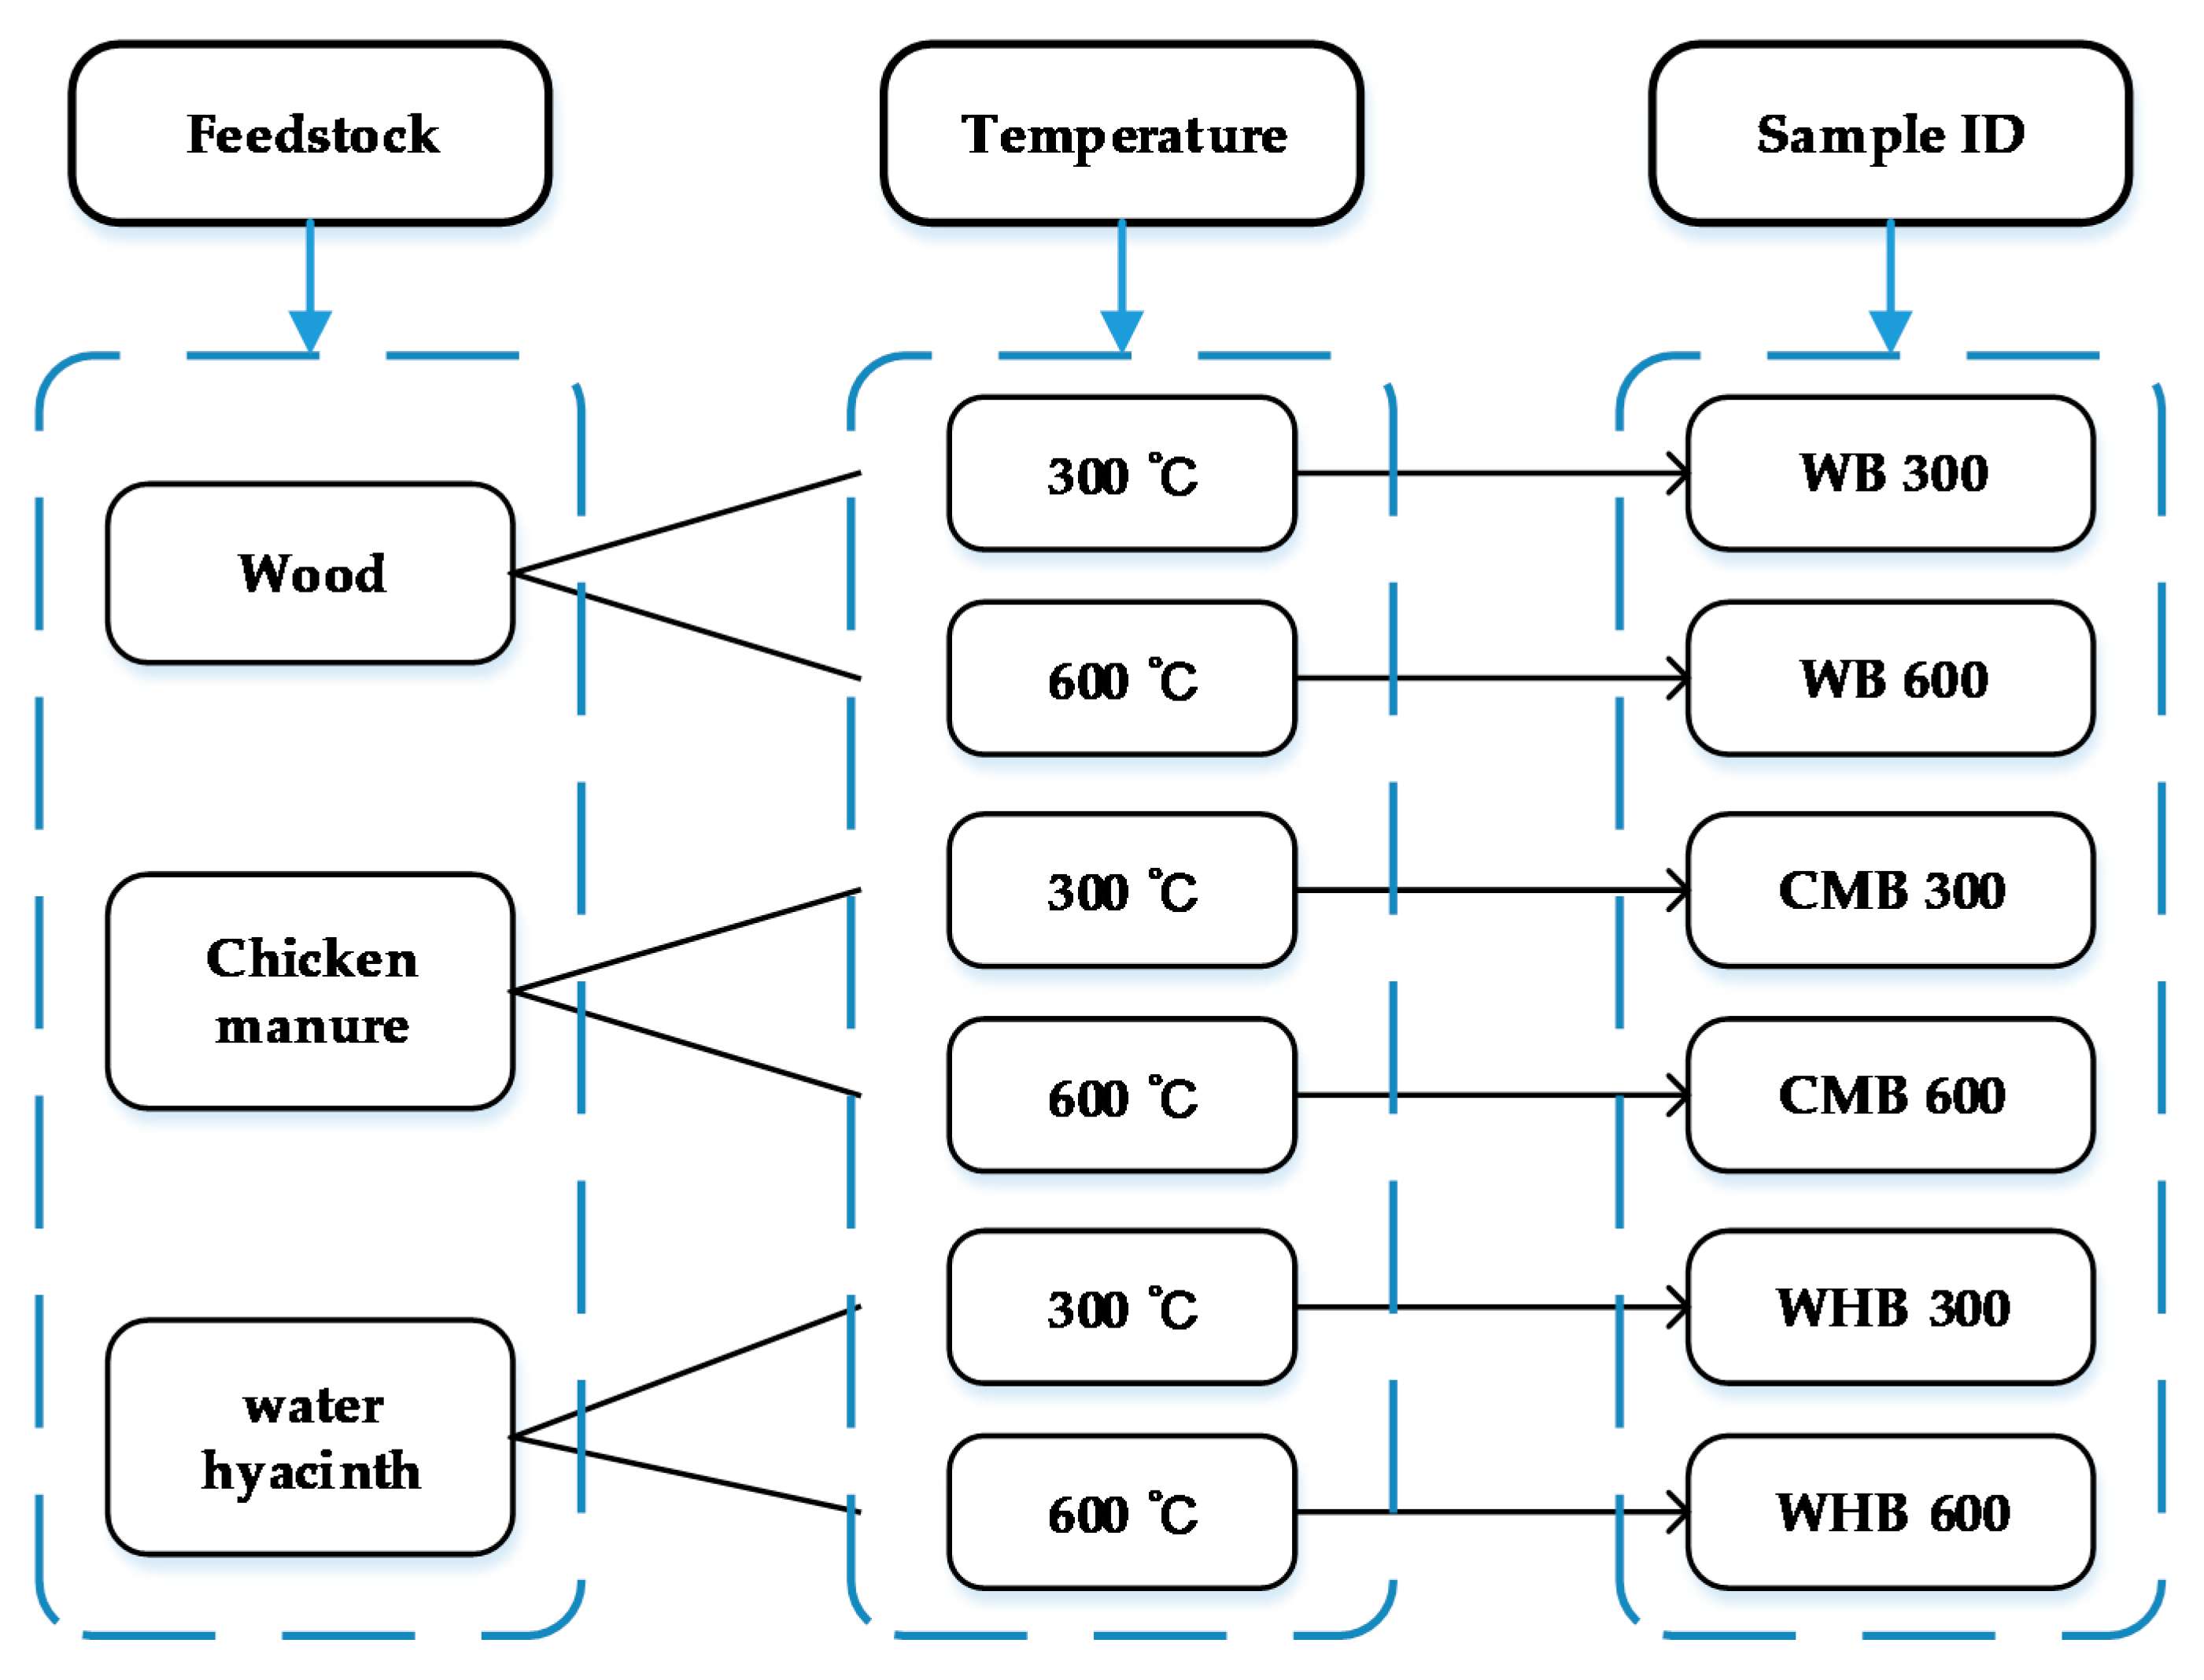
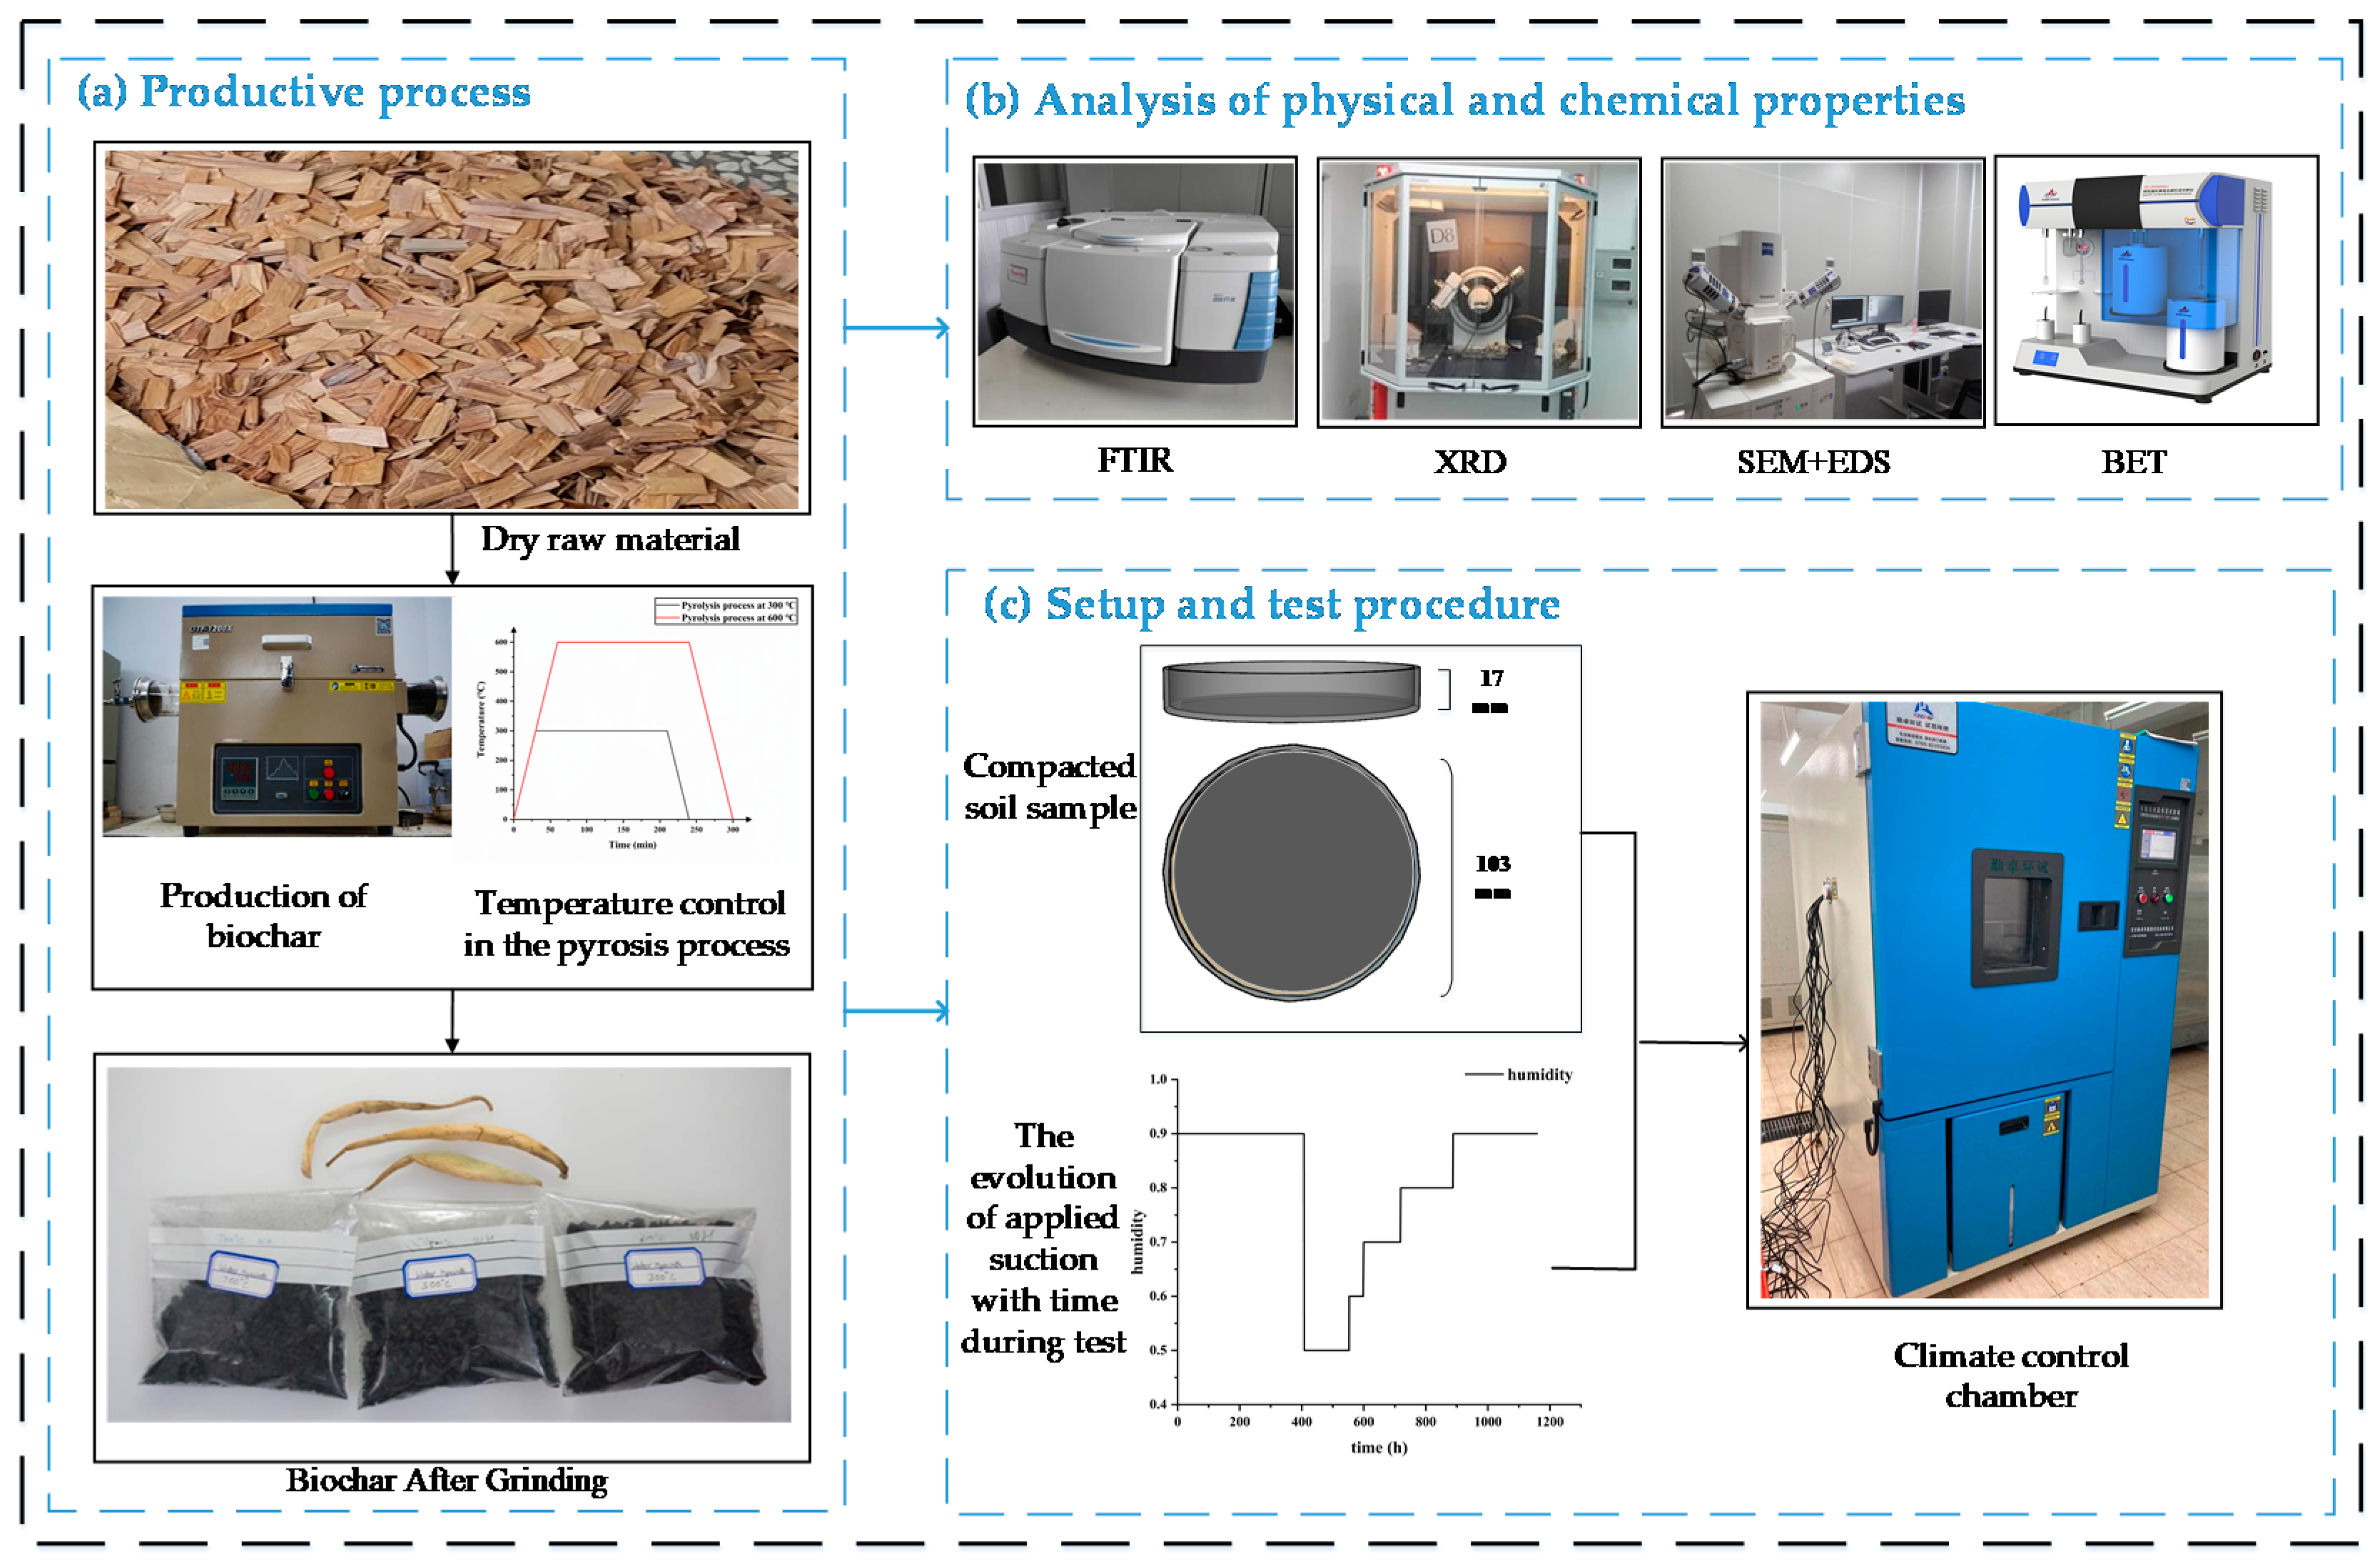
2.2. Preparation of Biochar Samples
2.3. Biochar Characterization
2.3.1. Physical and Chemical Structure
2.3.2. Quantitative Phase Analysis (XRD)
2.3.3. Brunner Emmet Teller (BET)
2.3.4. Hygroscopicity of Biochar at Different Feedstock and Pyrolysis Temperatures
3. Results
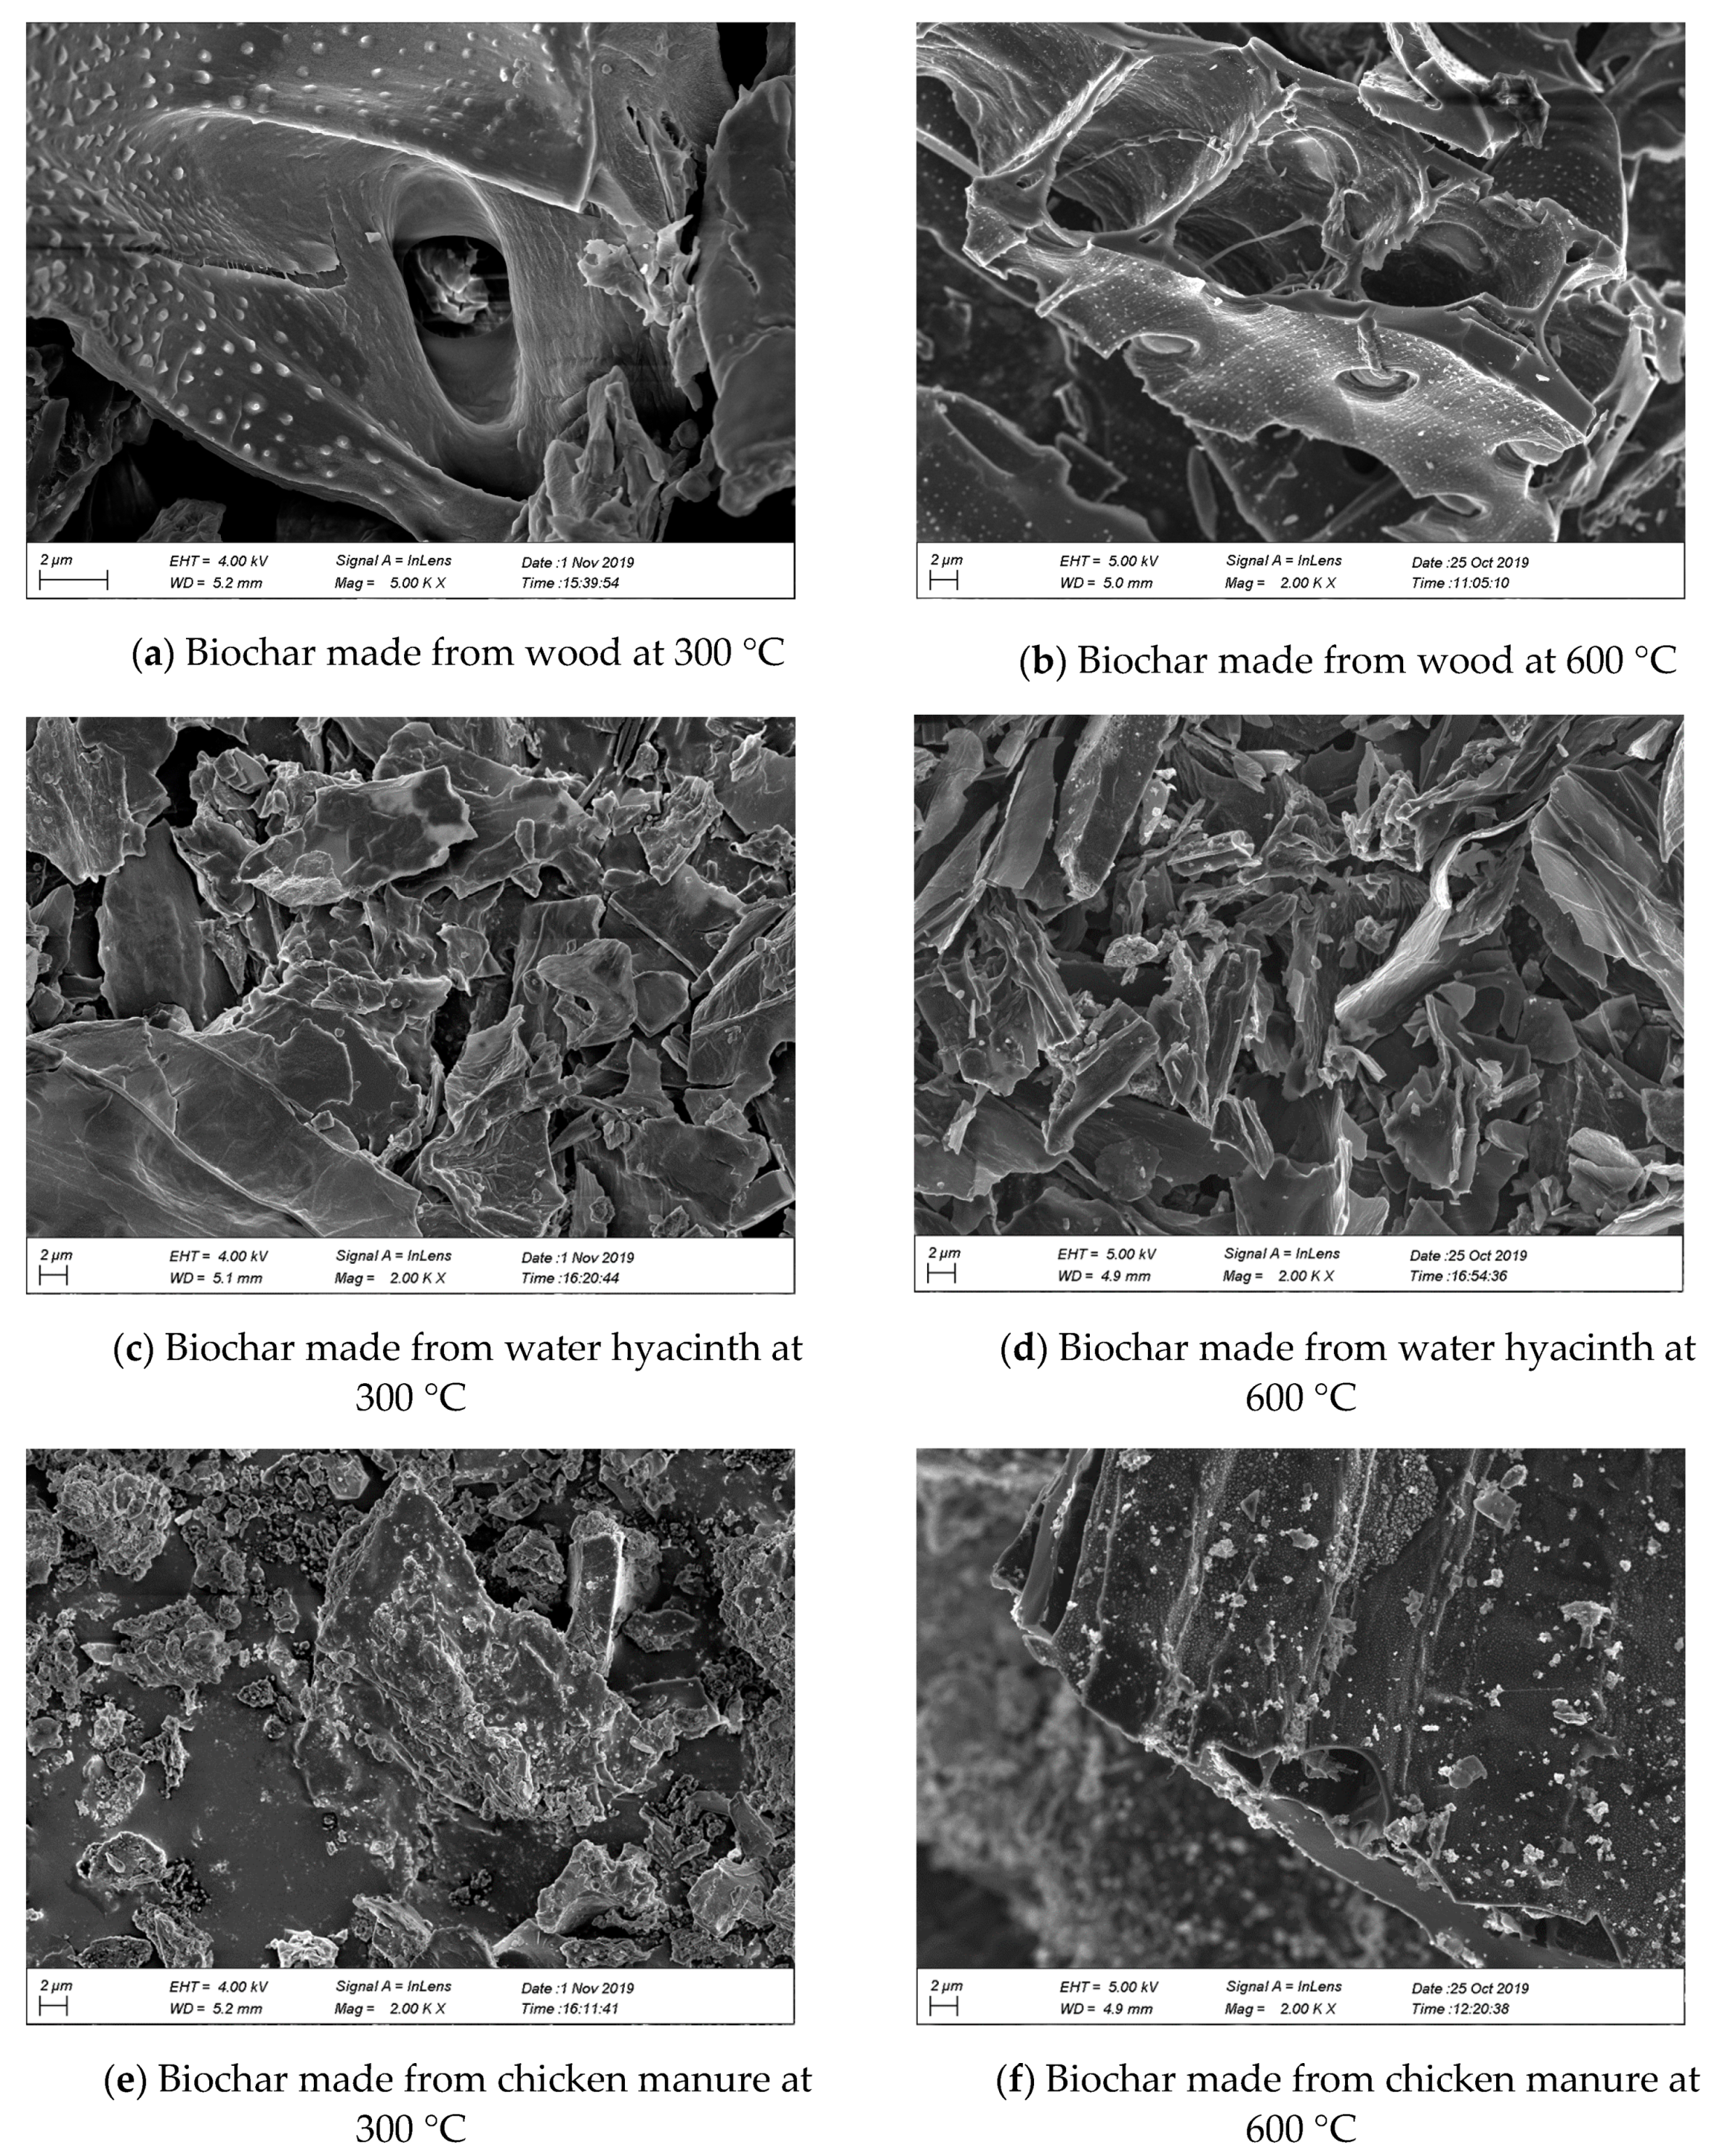
3.1. SEM + EDS
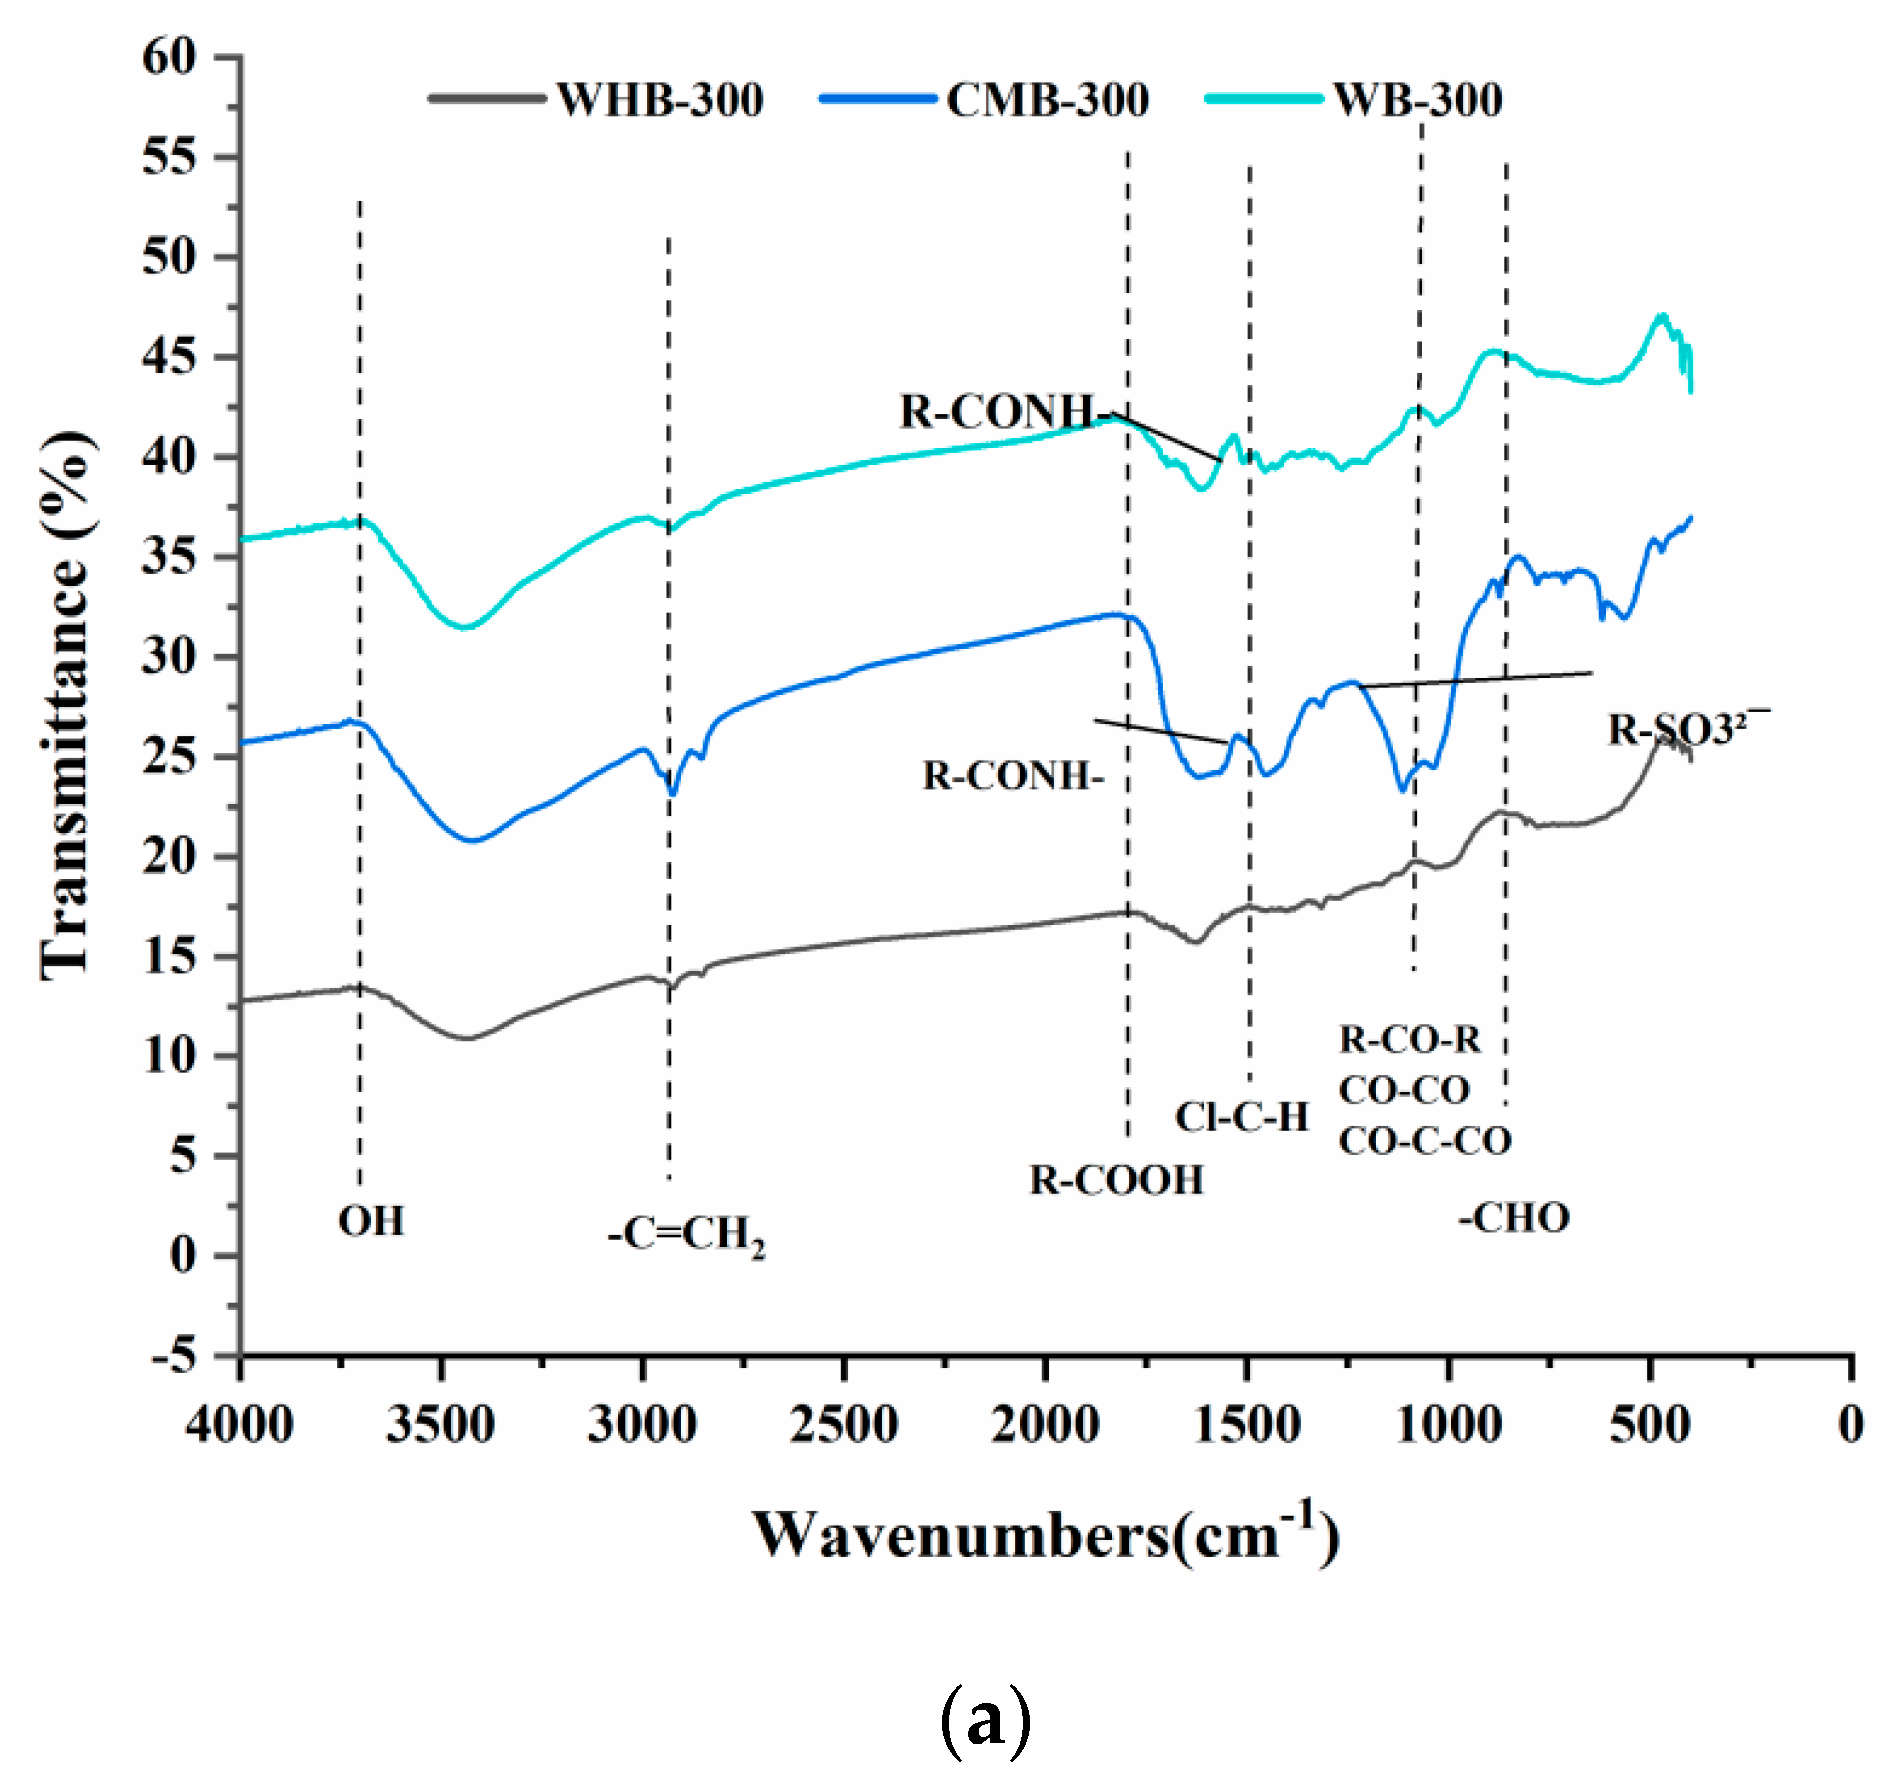
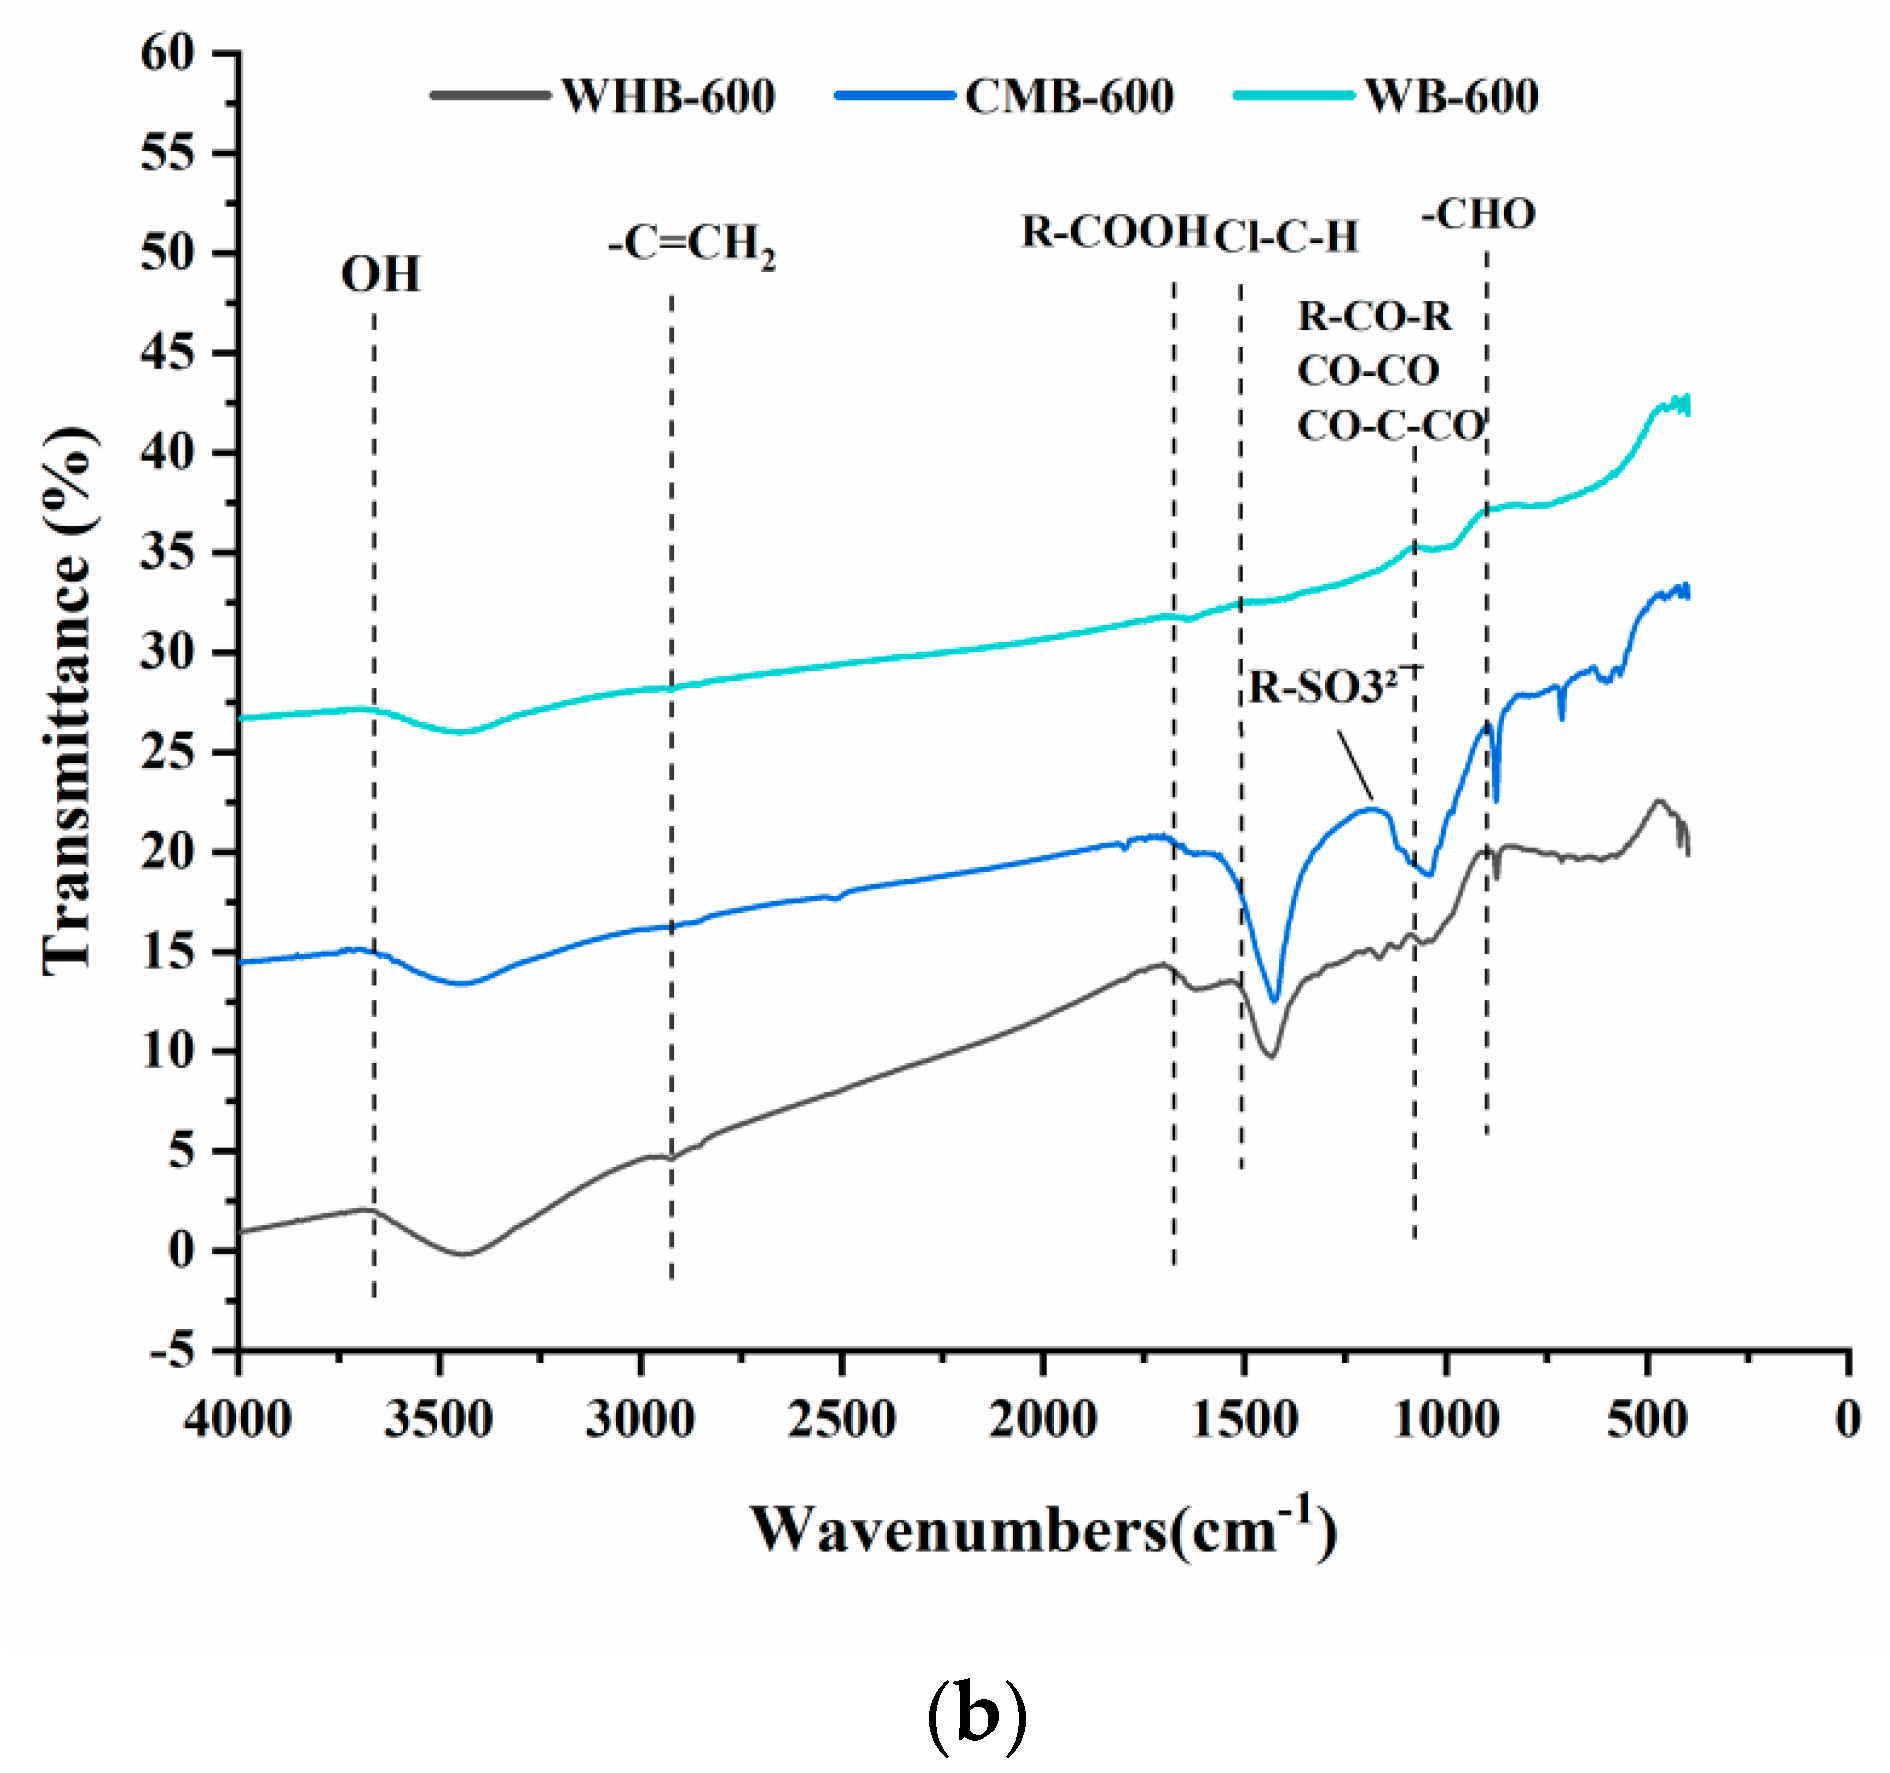
3.2. FTIR
3.3. BET
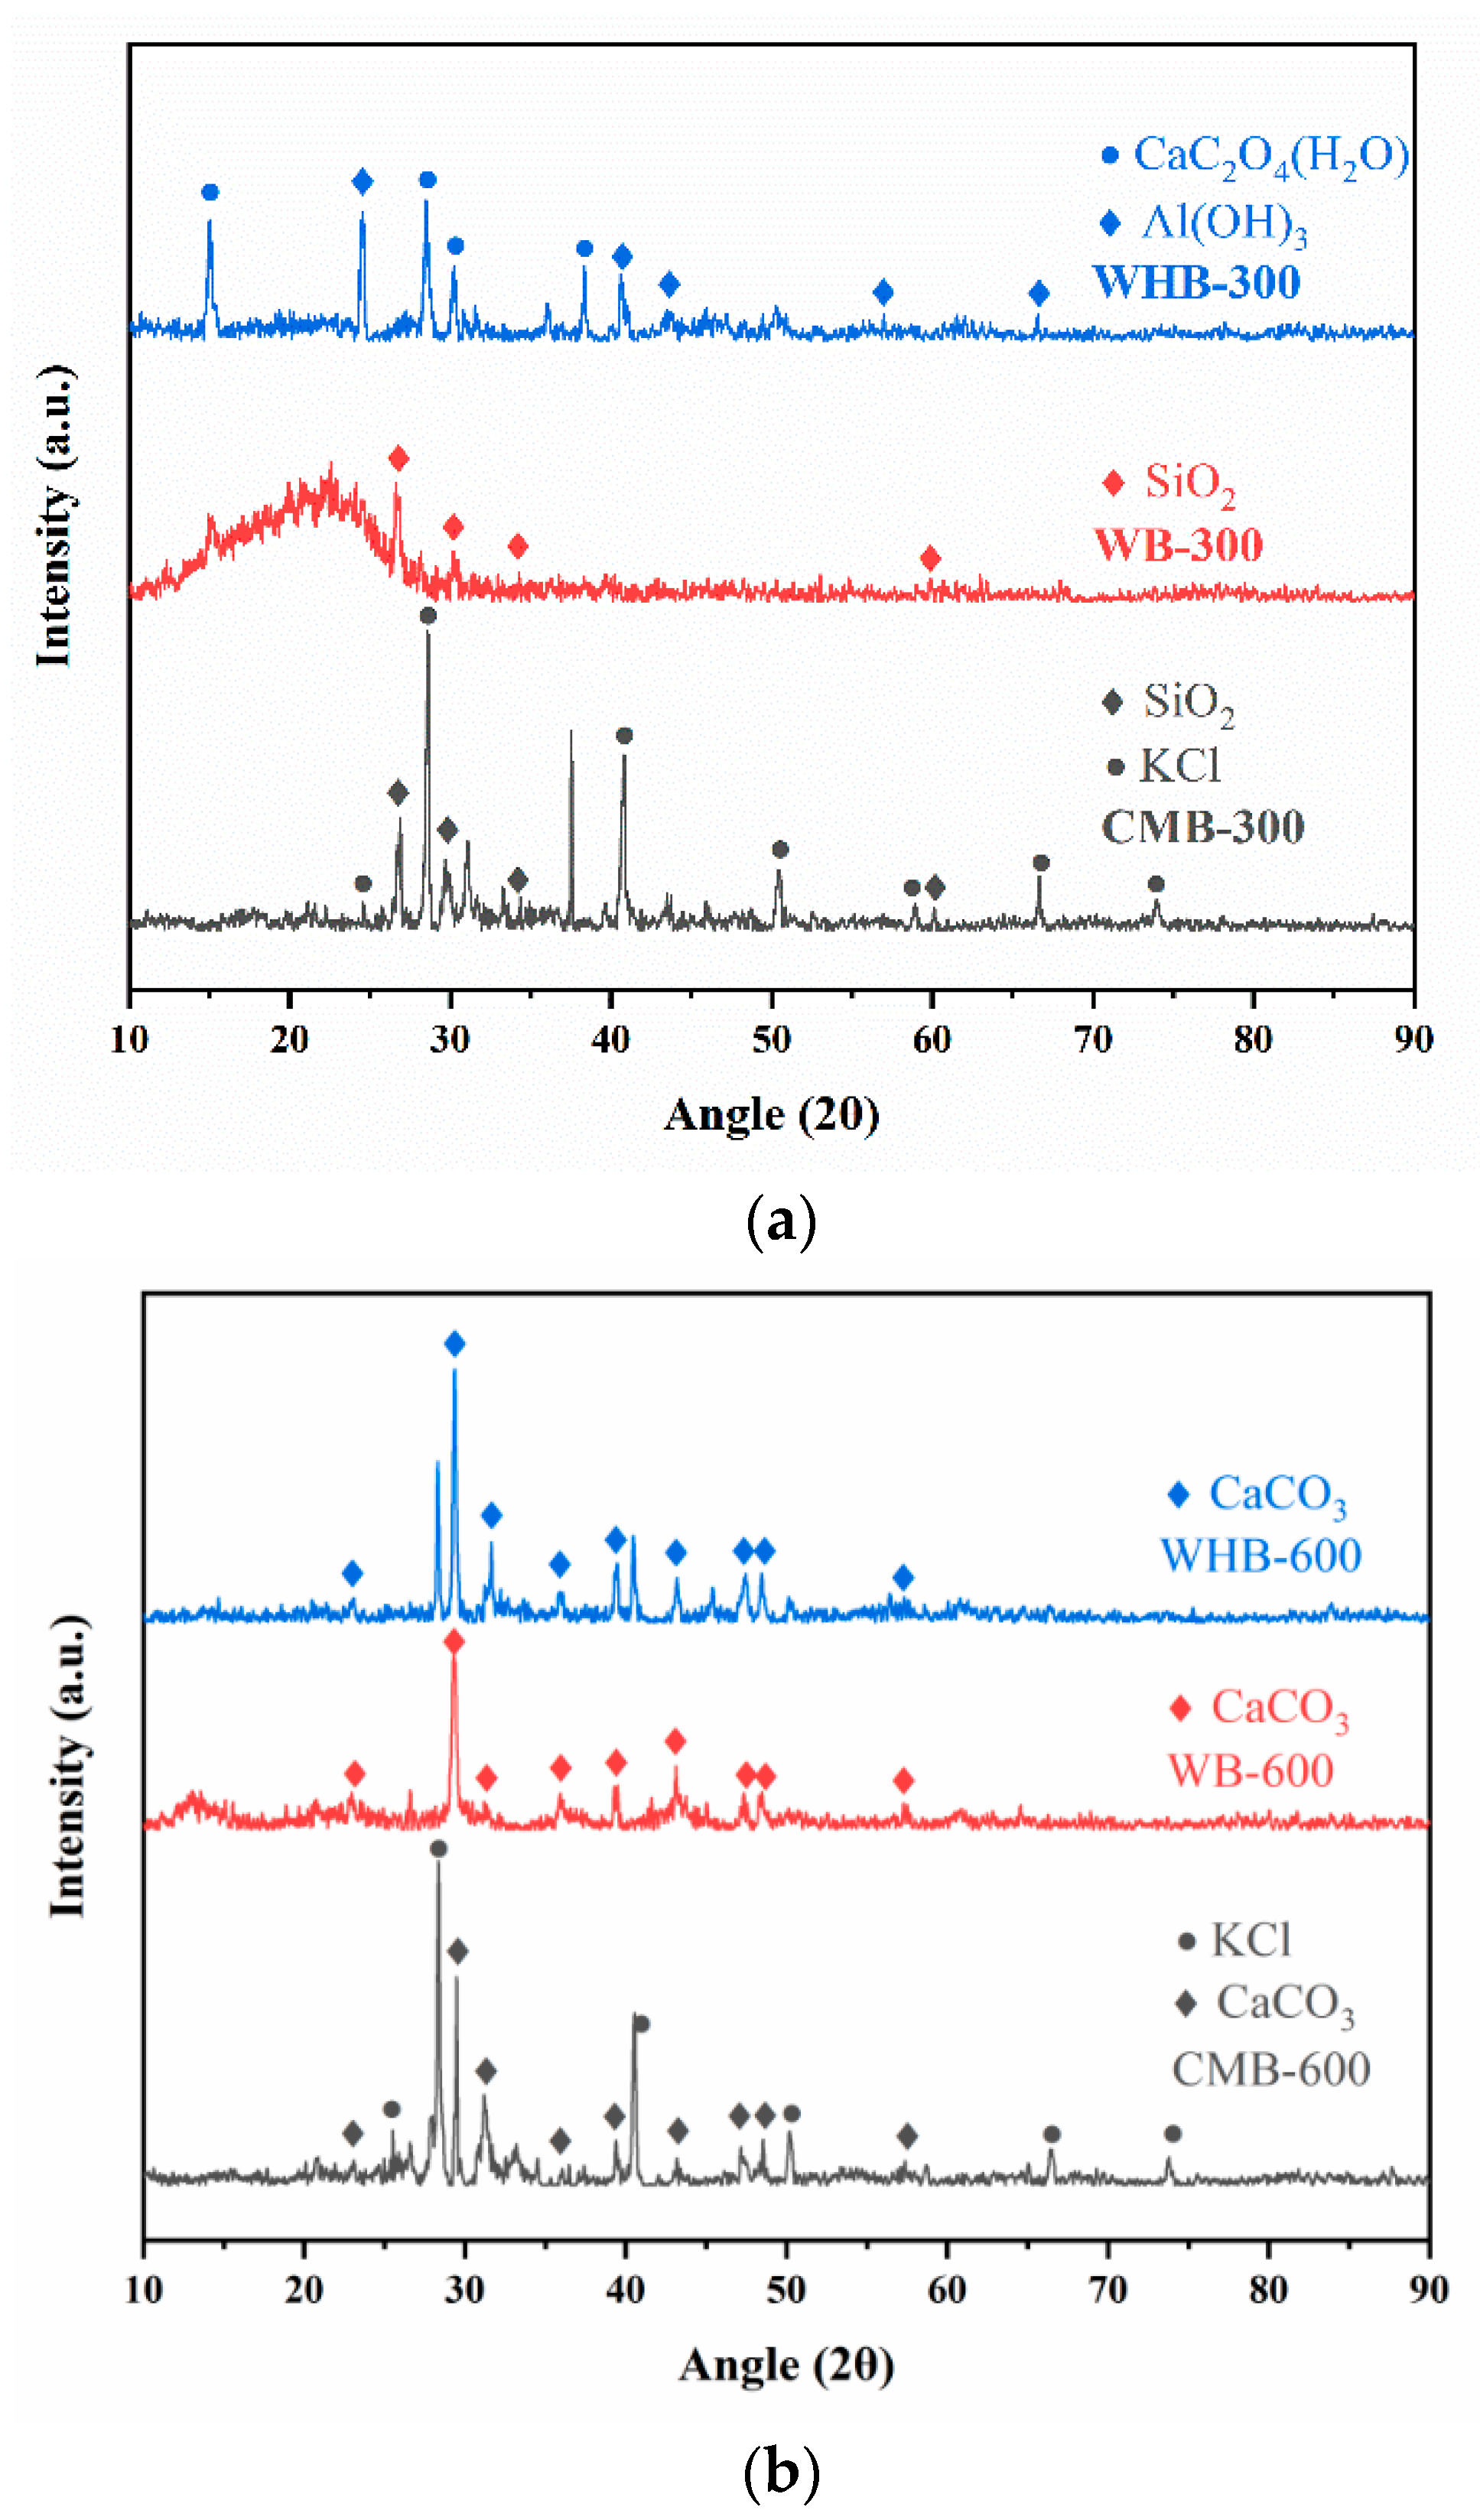
3.4. XRD
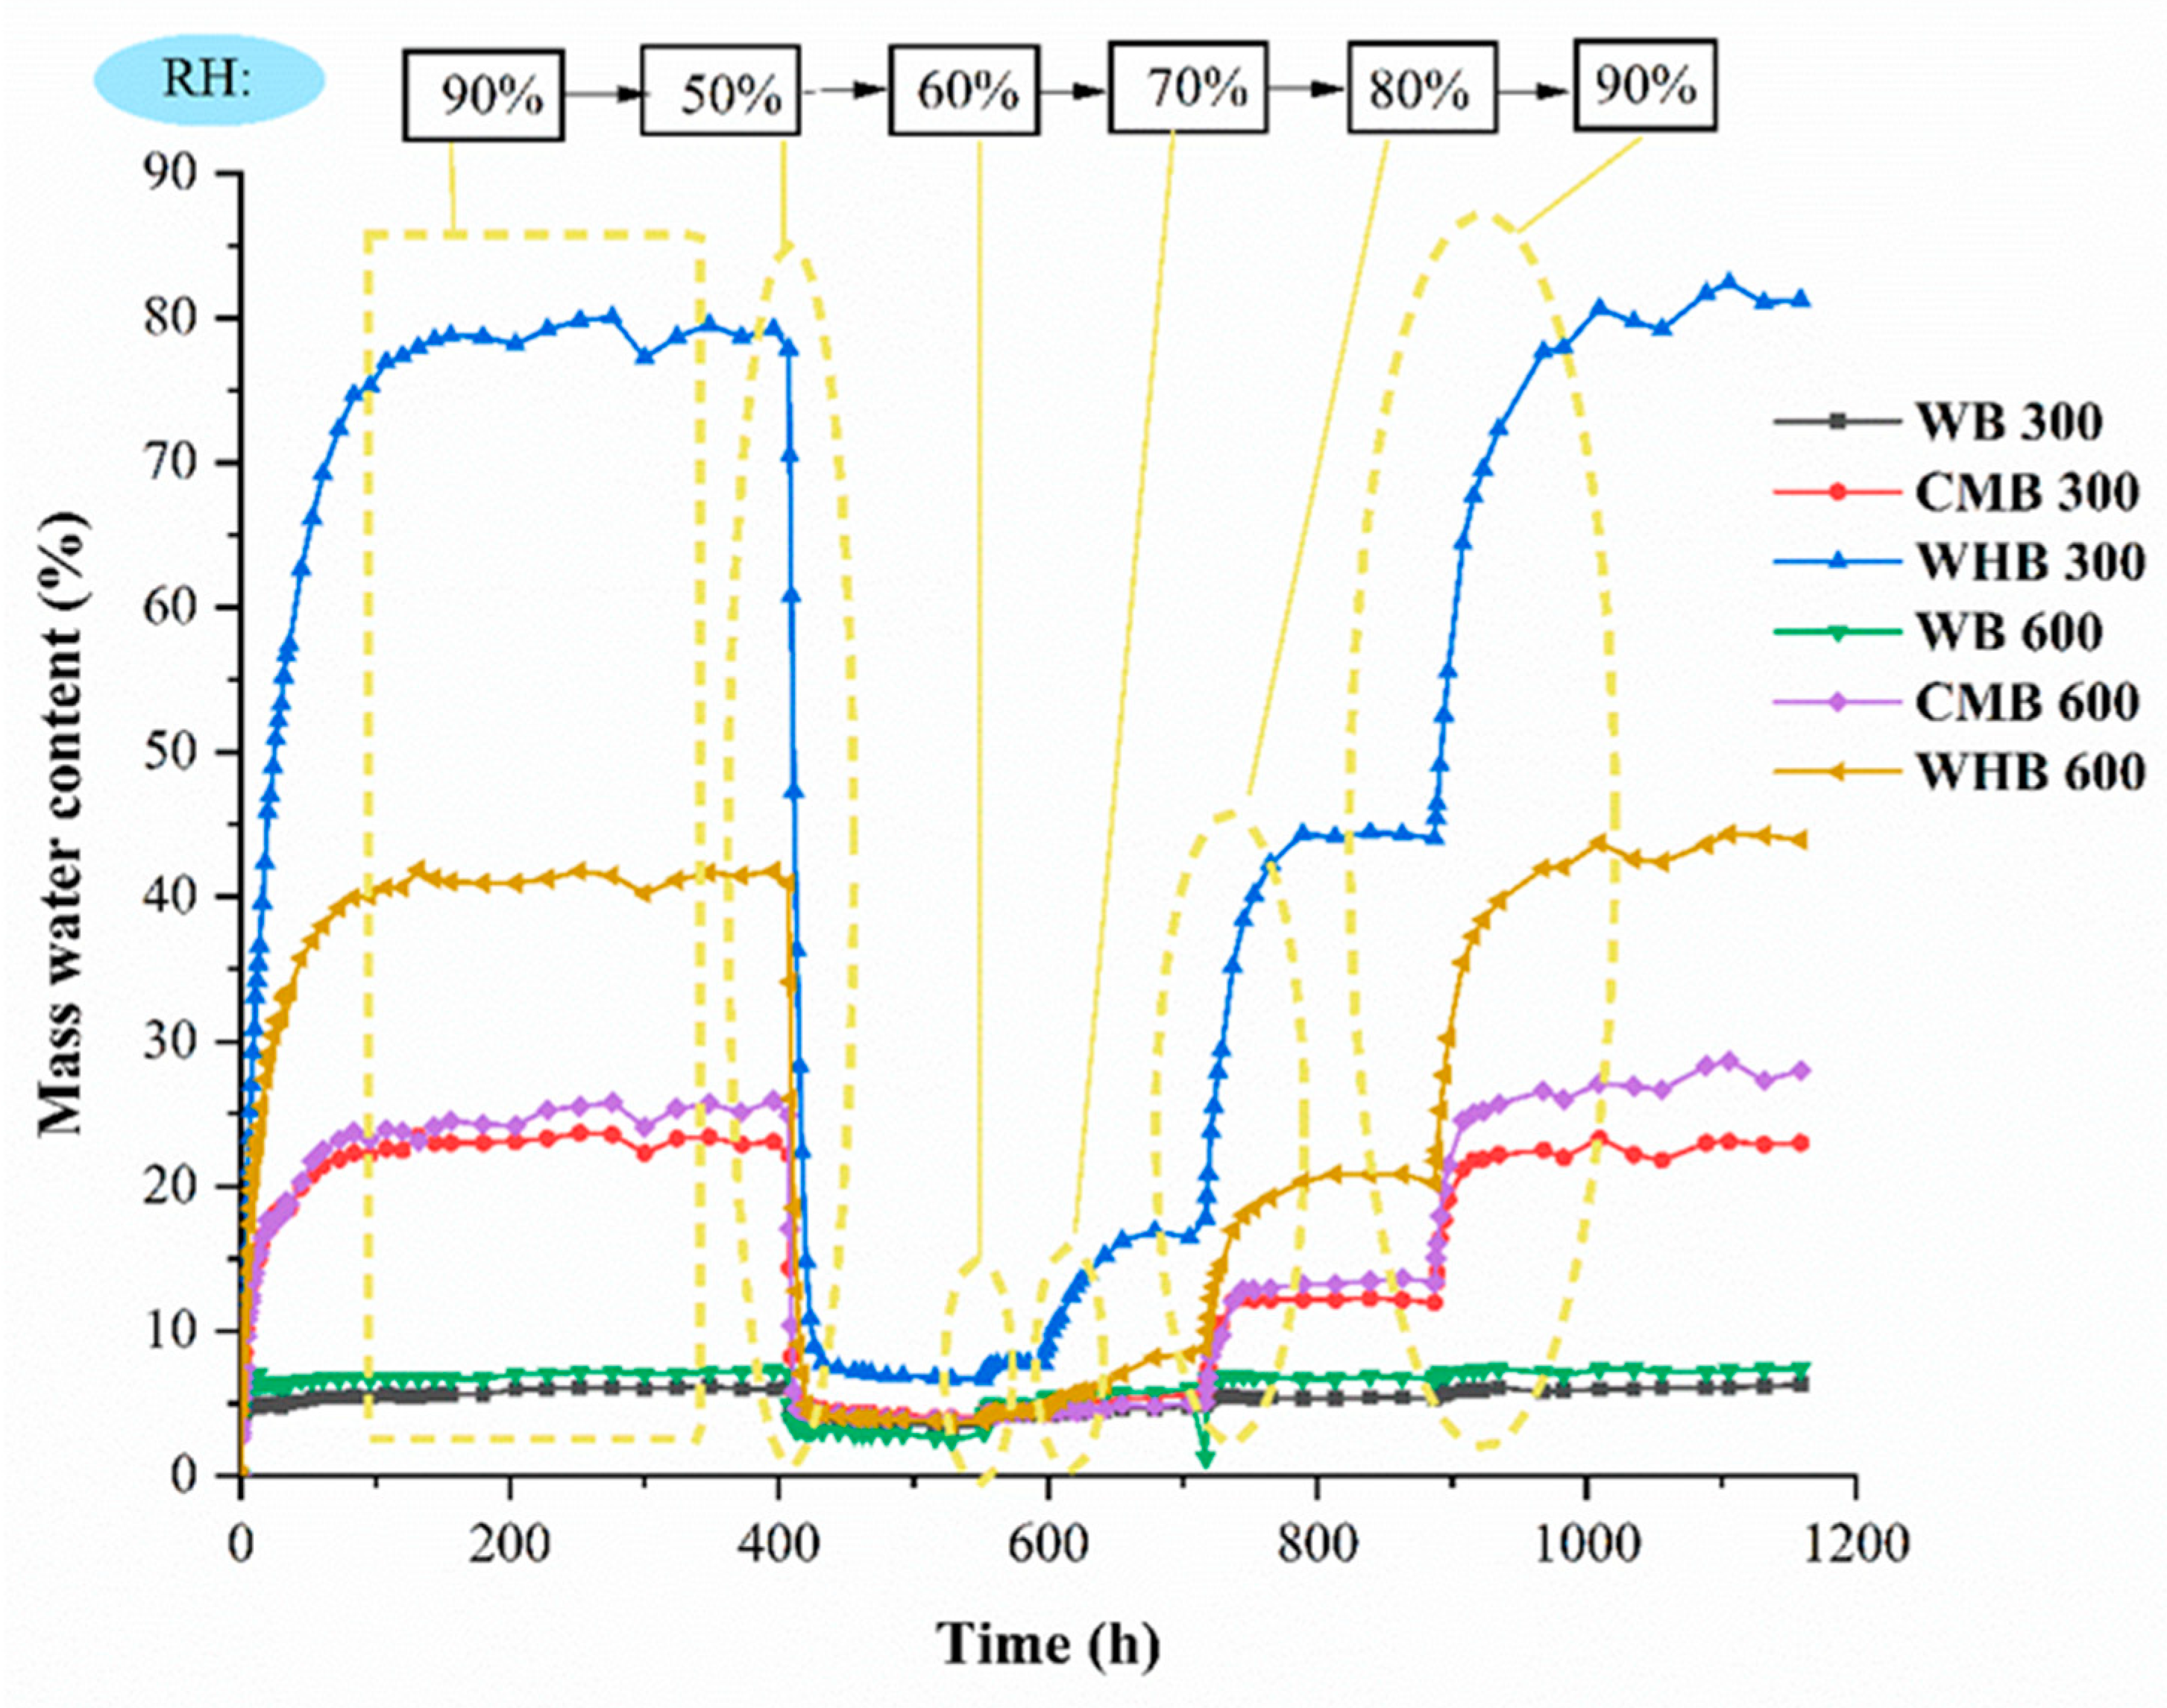
3.5. The Hygroscopicity of Biochar
4. Conclusions
Author Contributions
Funding
Institutional Review Board Statement
Informed Consent Statement
Data Availability Statement
Conflicts of Interest
References
- Lehmann, J.; Joseph, S. Biochar for environmental management: Science, technology and implementation. Sci. Technol. 2015, 25, 15801–15811. [Google Scholar]
- Downie, A.; Crosky, A.; Munroe, P. Physical properties of biochar. In Biochar for Environmental Management; Routledge: London, UK, 2012; pp. 45–64. [Google Scholar]
- Liu, W.-J.; Jiang, H.; Yu, H.-Q. Development of Biochar-Based Functional Materials: Toward a Sustainable Platform Carbon Material. Chem. Rev. 2015, 115, 12251–12285. [Google Scholar] [CrossRef] [PubMed]
- Kookana, R.S. The role of biochar in modifying the environmental fate, bioavailability, and efficacy of pesticides in soils: A review. Soil Res. 2010, 48, 627–637. [Google Scholar] [CrossRef]
- Wang, J.; Wang, S. Preparation, modification and environmental application of biochar: A review. J. Clean. Prod. 2019, 227, 1002–1022. [Google Scholar] [CrossRef]
- Wang, Y.; Kang, J.; Jiang, S.; Li, H.; Ren, Z.; Xu, Q.; Jiang, Q.; Liu, W.; Li, R.; Zhang, Y. A composite of Ni–Fe–Zn layered double hydroxides/biochar for atrazine removal from aqueous solution. Biochar 2020, 2, 455–464. [Google Scholar] [CrossRef]
- Wang, H.; Zhang, K.; Gan, L.; Liu, J.; Mei, G. Expansive soil-biochar-root-water-bacteria interaction: Investigation on crack development, water management and plant growth in green infrastructure. Int. J. Damage Mech. 2021, 30, 595–617. [Google Scholar] [CrossRef]
- Huang, S.; Huang, D.; Garg, A.; Jiang, M.; Mei, G.; Pekkat, S. Stormwater management of biochar-amended green roofs: Peak flow and hydraulic parameters using combined experimental and numerical investigation. Biomass Convers. Biorefinery 2020, 1–12. [Google Scholar] [CrossRef]
- Zhang, M.; Gao, B.; Yao, Y.; Inyang, M. Phosphate removal ability of biochar/MgAl-LDH ultra-fine composites prepared by liquid-phase deposition. Chemosphere 2013, 92, 1042–1047. [Google Scholar] [CrossRef]
- Ni, J.; Chen, X.W.; Ng, C.W.W.; Guo, H.W. Effects of biochar on water retention and matric suction of vegetated soil. Géotecnique Lett. 2018, 8, 124–129. [Google Scholar] [CrossRef]
- Lim, T.; Spokas, K.; Feyereisen, G.; Novak, J. Predicting the impact of biochar additions on soil hydraulic properties. Chemosphere 2016, 142, 136–144. [Google Scholar] [CrossRef] [PubMed]
- Razzaghi, F.; Obour, P.B.; Arthur, E. Does biochar improve soil water retention? A systematic review and meta-analysis. Goderma 2020, 361, 114055. [Google Scholar] [CrossRef]
- Purakayastha, T.; Bera, T.; Bhaduri, D.; Sarkar, B.; Mandal, S.; Wade, P.; Kumari, S.; Biswas, S.; Menon, M.; Pathak, H.; et al. A review on biochar modulated soil condition improvements and nutrient dynamics concerning crop yields: Pathways to climate change mitigation and global food security. Chemosphere 2019, 227, 345–365. [Google Scholar] [CrossRef] [PubMed]
- Matos, T.T.; Fornari, M.R.; Mangrich, A.S.; Schultz, J.; Batista, E.M.C.; Ribeiro, R.O.; Romão, L.P.; Yamamoto, C.I.; Grasel, F.S.; Bayer, C.; et al. Low temperature production of biochars from different biomasses: Effect of static and rotary lab reactors and application as soil conditioners. J. Environ. Chem. Eng. 2021, 9, 105472. [Google Scholar] [CrossRef]
- Inyang, M.; Gao, B.; Yao, Y.; Xue, Y.; Zimmerman, A.; Pullammanappallil, P.; Cao, X. Removal of heavy metals from aqueous solution by biochars derived from anaerobically digested biomass. Bioresour. Technol. 2012, 110, 50–56. [Google Scholar] [CrossRef] [PubMed]
- Tsai, W.-T.; Liu, S.-C.; Chen, H.-R.; Chang, Y.-M.; Tsai, Y.-L. Textural and chemical properties of swine-manure-derived biochar pertinent to its potential use as a soil amendment. Chemosphere 2012, 89, 198–203. [Google Scholar] [CrossRef] [PubMed]
- Yao, Y.; Gao, B.; Inyang, M.; Zimmerman, A.; Cao, X.; Pullammanappallil, P.; Yang, L. Removal of phosphate from aqueous solution by biochar derived from anaerobically digested sugar beet tailings. J. Hazard. Mater. 2011, 190, 501–507. [Google Scholar] [CrossRef] [PubMed]
- Gaskin, J.W.; Steiner, C.; Harris, K.; Das, K.C.; Bibens, B. Effect of Low-Temperature Pyrolysis Conditions on Biochar for Agricultural Use. Trans. ASABE 2008, 51, 2061–2069. [Google Scholar] [CrossRef]
- Van Zwieten, L.; Kimber, S.; Morris, S.; Chan, K.Y.; Downie, A.; Rust, J.; Cowie, A. Effects of biochar from slow pyrolysis of papermill waste on agronomic performance and soil fertility. Plant Soil 2010, 327, 235–246. [Google Scholar] [CrossRef]
- Doan, T.T.; Henry-Des-Tureaux, T.; Rumpel, C.; Janeau, J.-L.; Jouquet, P. Impact of compost, vermicompost and biochar on soil fertility, maize yield and soil erosion in Northern Vietnam: A three year mesocosm experiment. Sci. Total Environ. 2015, 514, 147–154. [Google Scholar] [CrossRef]
- Ahmad, M.; Rajapaksha, A.U.; Lim, J.E.; Zhang, M.; Bolan, N.; Mohan, D.; Withanage, M.; Lee, S.S.; Ok, Y.S. Biochar as a sorbent for contaminant management in soil and water: A review. Chemosphere 2014, 99, 19–33. [Google Scholar] [CrossRef] [PubMed]
- Zhao, L.; Cao, X.; Mašek, O.; Zimmerman, A. Heterogeneity of biochar properties as a function of feedstock sources and production temperatures. J. Hazard. Mater. 2013, 256–257, 1–9. [Google Scholar] [CrossRef] [Green Version]
- Jefery, S.; Meinders, M.B.; Stoof, C.R.; Bezemer, T.M.; van de Voorde, T.F.J.; Mommer, L.; van Groenigen, J.W. Biochar application does not improve the soil hydrological function of a sandy soil. Geoderma 2015, 251, 47–54. [Google Scholar] [CrossRef]
- Atkinson, C.J.; Fitzgerald, J.D.; Hipps, N.A. Potential mechanisms for achieving agricultural benefits from biochar application to temperate soils: A review. Plant Soil 2010, 337, 1–18. [Google Scholar] [CrossRef]
- Tomczyk, A.; Sokołowska, Z.; Boguta, P. Biochar physicochemical properties: Pyrolysis temperature and feedstock kind effects. Rev. Environ. Sci. Biotechnol. 2020, 19, 191–215. [Google Scholar] [CrossRef] [Green Version]
- Cantrell, K.B.; Hunt, P.G.; Uchimiya, M.; Novak, J.M.; Ro, K.S. Impact of pyrolysis temperature and manure source on physico-chemical characteristics of biochar. Bioresour. Technol. 2012, 107, 419–428. [Google Scholar] [CrossRef]
- Pariyar, P.; Kumari, K.; Jain, M.K.; Jadhao, P.S. Evaluation of change in biochar properties derived from different feedstock and pyrolysis temperature for environmental and agricultural application. Sci. Total Environ. 2020, 713, 136433. [Google Scholar] [CrossRef]
- Manyà, J.J. Pyrolysis for Biochar Purposes: A Review to Establish Current Knowledge Gaps and Research Needs. Environ. Sci. Technol. 2012, 46, 7939–7954. [Google Scholar] [CrossRef]
- Gaunt, J.L.; Lehmann, J. Energy balance and emissions associated with biochar sequestration and pyrolysis bioen-ergy production. Environ. Sci. Technol. 2008, 42, 4152–4158. [Google Scholar] [CrossRef]
- Sohi, S.; Lopez-Capel, E.; Krull, E.; Bol, R. Biochar, climate change and soil: A review to guide future research. CSIRO Land Water Sci. Rep. 2009, 5, 17–31. [Google Scholar]
- Antal, M.J.; Grønli, M.G. The Art, Science, and Technology of Charcoal Production. Ind. Eng. Chem. Res. 2003, 42, 1619–1640. [Google Scholar] [CrossRef]
- Inguanzo, M.; Domínguez, A.; Menéndez, J.; Blanco, C.; Pis, J. On the pyrolysis of sewage sludge: The influence of pyrolysis conditions on solid, liquid and gas fractions. J. Anal. Appl. Pyrolysis 2002, 63, 209–222. [Google Scholar] [CrossRef]
- Lu, H.; Zhang, W.; Wang, S.; Zhuang, L.; Yang, Y.; Qiu, R. Characterization of sewage sludge-derived biochars from different feedstocks and pyrolysis temperatures. J. Anal. Appl. Pyrolysis 2013, 102, 137–143. [Google Scholar] [CrossRef]
- Park, J.; Lee, Y.; Ryu, C.; Park, Y.-K. Slow pyrolysis of rice straw: Analysis of products properties, carbon and energy yields. Bioresour. Technol. 2014, 155, 63–70. [Google Scholar] [CrossRef] [PubMed]
- Schenkel, Y.; Bertaux, P.; Vanwijnbserghe, S.; Carre, J. An evaluation of the mound kiln carbonization technique. Biomass Bioenergy 1998, 14, 505–516. [Google Scholar] [CrossRef]
- Shao, A.; Chen, H.; Yan, R.; Wang, X.; Yang, H.; Zhang, S. Study on Effect of Pyrolysis Temperature on Yield and Characteristics of Sludge Pyrolysis Semi-coke. Renew. Energy 2008, 26, 31–34. [Google Scholar]
- Mackay, D.; Roberts, P. The influence of pyrolysis conditions on yield and microporosity of lignocellulosic chars. Carbon 1982, 20, 95–104. [Google Scholar] [CrossRef]
- Dai, X.; Antal, M.J. Synthesis of a High-Yield Activated Carbon by Air Gasification of Macadamia Nut Shell Charcoal. Ind. Eng. Chem. Res. 1999, 38, 3386–3395. [Google Scholar] [CrossRef]
- Culliney, T.W. Benefits of Classical Biological Control for Managing Invasive Plants. Crit. Rev. Plant. Sci. 2005, 24, 131–150. [Google Scholar] [CrossRef]
- Witt, A. Impacts of invasive plants and their sustainable management in agro-ecosystems in Africa: A. review. CABI Afr. NRB 2010, 1102–1109. [Google Scholar]
- Lu, J.; Wu, J.; Fu, Z.; Zhu, L. Water Hyacinth in China: A Sustainability Science-Based Management Framework. Environ. Manag. 2007, 40, 823–830. [Google Scholar] [CrossRef]
- Gao, L.; Li, B.; Jin, L. Can water hyacinth (Eichhornia crassipes) be controlled by reducing nitrogen and phosphorus pollution of water bodies? Appl. Ecol. Environ. Res. 2016, 14, 77–91. [Google Scholar] [CrossRef]
- Lian, W.; Yang, L.; Joseph, S.; Shi, W.; Bian, R.; Zheng, J.; Li, L.; Shan, S.; Pan, G. Utilization of biochar produced from invasive plant species to efficiently adsorb Cd (II) and Pb (II). Bioresour. Technol. 2020, 317, 124011. [Google Scholar] [CrossRef]
- Ahmed, M.B.; Zhou, J.L.; Ngo, H.H.; Guo, W. Insight into biochar properties and its cost analysis. Biomass Bioenergy 2016, 84, 76–86. [Google Scholar] [CrossRef]
- Al-Wabel, M.I.; Hussain, Q.; Usman, A.R.; Ahmad, M.; Abduljabbar, A.; Sallam, A.S.; Ok, Y.S. Impact of biochar prop-erties on soil conditions and agricultural sustainability: A review. Land Degrad. Dev. 2018, 29, 2124–2161. [Google Scholar] [CrossRef]
- Jiang, H.; Ye, Y.; Lu, P.; Zhao, M.; Xu, G.; Chen, D.; Song, T. Effects of torrefaction conditions on the hygroscopicity of biochars. J. Energy Inst. 2021, 96, 260–268. [Google Scholar] [CrossRef]
- Dias, D.D.S.; Faria, F.A.; Mattiolli, L.; Capela, M.V.; Capela, J.M.V.; Crespi, M.S.; Ribeiro, C.A. Moisture sorption of biochar from banana pseudostem fibers according to the pyrolysis temperature. J. Therm. Anal. Calorim. 2019, 138, 3825–3832. [Google Scholar] [CrossRef]
- Chen, H.; Lin, G.; Wang, X.; Chen, Y.; Liu, Y.; Yang, H. Physicochemical properties and hygroscopicity of tobacco stem biochar pyrolyzed at different temperatures. J. Renew. Sustain. Energy 2016, 8, 013112. [Google Scholar] [CrossRef]
- Huang, H.; Reddy, N.G.; Huang, X.; Chen, P.; Wang, P.; Zhang, Y.; Garg, A. Effects of pyrolysis temperature, feedstock type and compaction on water retention of biochar amended soil. Sci. Rep. 2021, 11, 7419. [Google Scholar] [CrossRef] [PubMed]
- Sohi, S.P.; Krull, E.; Lopez-Capel, E.; Bol, R. A review of biochar and its use and function in soil. In Advances in Agronomy; Elsevier: Amsterdam, The Netherlands, 2010; Volume 105, pp. 47–82. [Google Scholar]
- Batista, E.M.C.C.; Shultz, J.; Matos, T.T.S.; Fornari, M.R.; Ferreira, T.M.; Szpoganicz, B.; de Freitas, R.; Mangrich, A.S. Effect of surface and porosity of biochar on water holding capacity aiming indirectly at preservation of the Amazon biome. Sci. Rep. 2018, 8, 10688. [Google Scholar] [CrossRef] [PubMed]
- Kumar, H.; Cai, W.; Lai, J.; Chen, P.; Ganesan, S.P.; Bordoloi, S.; Liu, X.; Wen, Y.; Garg, A.; Mei, G. Influence of in-house produced biochars on cracks and retained water during drying-wetting cycles: Comparison between conventional plant, animal, and nano-biochars. J. Soils Sediments 2020, 20, 1983–1996. [Google Scholar] [CrossRef]
- Bordoloi, S.; Kumar, H.; Hussain, R.; Karangat, R.; Lin, P.; Sreedeep, S.; Zhu, H.-H. Assessment of hydro-mechanical properties of biochar-amended soil sourced from two contrasting feedstock. Biomass Convers. Biorefinery 2020, 1–16. [Google Scholar] [CrossRef]
- Verheijen, F.; Jeffery, S.; Bastos, A.C.; Van der Velde, M.; Diafas, I. Biochar application to soils. A critical scientific re-view of effects on soil properties, processes, and functions. EUR 2010, 24099, 162. [Google Scholar]
- Brewer, C.E.; Unger, R.; Schmidt-Rohr, K.; Brown, R.C. Criteria to select biochars for field studies based on biochar chemical properties. Bioenergy Res. 2011, 4, 312–323. [Google Scholar] [CrossRef]
- Das, D.D.; Schnitzer, M.I.; Monreal, C.M.; Mayer, P. Chemical composition of acid–base fractions separated from biooil derived by fast pyrolysis of chicken manure. Bioresour. Technol. 2009, 100, 6524–6532. [Google Scholar] [CrossRef] [PubMed]
- Colthup, N.B.; Daly, L.H.; Wiberley, S.E. Introduction to Infrared and Raman Spectroscopy; Elsevier BV: Amsterdam, The Netherlands, 1975. [Google Scholar]
- Shinogi, Y.; Yoshida, H.; Koizumi, T.; Yamaoka, M.; Saito, T. Basic characteristics of low-temperature carbon products from waste sludge. Adv. Environ. Res. 2002, 7, 661–665. [Google Scholar] [CrossRef]
- Zhang, H.; Voroney, R.; Price, G. Effects of temperature and processing conditions on biochar chemical properties and their influence on soil C and N transformations. Soil Biol. Biochem. 2015, 83, 19–28. [Google Scholar] [CrossRef]
- Weiler, M.; Naef, F. An experimental tracer study of the role of macropores in infiltration in grassland soils. Hydrol. Process. 2003, 17, 477–493. [Google Scholar] [CrossRef]
- Chia, C.H.; Downie, A.; Munroe, P. Characteristics of biochar: Physical and structural properties. In Biochar for Environmental Management; Routledge: London, UK, 2015; pp. 121–142. [Google Scholar]
- Abe, I.; Iwasaki, S.; Iwata, Y.; Kominami, H.; Kera, Y. Relationship between Production Method and Adsorption Prop-erty of Char. TANSO 1998, 185, 277–284. [Google Scholar] [CrossRef]
- Cao, X.; Harris, W. Properties of dairy-manure-derived biochar pertinent to its potential use in remediation. Bioresour. Technol. 2010, 101, 5222–5228. [Google Scholar] [CrossRef]
- Cameron, R.W.; Blanuša, T.; Taylor, J.E.; Salisbury, A.; Halstead, A.J.; Henricot, B.; Thompson, K. The domestic garden—Its contribution to urban green infrastructure. Urban For. Urban Green. 2012, 11, 129–137. [Google Scholar] [CrossRef]
- Yenisoy-Karakaş, S.; Aygün, A.; Güneş, M.; Tahtasakal, E. Physical and chemical characteristics of polymer-based spherical activated carbon and its ability to adsorb organics. Carbon 2004, 42, 477–484. [Google Scholar] [CrossRef]
- Yue, Z.H.A.O.; Baowei, Z.H.A.O.; Hui, L.I.U.; Liujun, L.I.; Xin, Z.H.A.N.G. Effect of pyrolysis temperature on physicochemical properties and hygroscopicity of biochar. Environ. Chem. 2020, 7, 2005–2012. [Google Scholar]
- Yang, W.; Shang, J.; Li, B.; Flury, M. Surface and colloid properties of biochar and implications for transport in porous media. Crit. Rev. Environ. Sci. Technol. 2020, 50, 2484–2522. [Google Scholar] [CrossRef]
- Lin, J.; Tong, S. Preparation and properties of biochar. Environ. Sci. Technol. 2015, 38, 54–58. [Google Scholar]
- Rao, X.; Fang, Z.; Wang, J.; Zhou, Z. Preparation, characterization and adsorption properties of peanut-shells-derived biochar. Environ. Sci. Technol. 2017, 40, 14–18. [Google Scholar]
- Chang, X.; Hu, X.; Jiang, Y.; Sun, H.; Mu, Z. Biochar made from wheat straw: Preparation and characterization. Environ. Sci. Technol. 2017, 40, 24–29. [Google Scholar]
- Gray, M.; Johnson, M.G.; Dragila, M.I.; Kleber, M. Water uptake in biochars: The roles of porosity and hydrophobicity. Biomass Bioenergy 2014, 61, 196–205. [Google Scholar] [CrossRef]
- Li, H.; Tan, Z. Preparation of high water-retaining biochar and its mechanism of alleviating drought stress in the soil and plant system. Biochar 2021, 1–12. [Google Scholar] [CrossRef]
- Pitman, S.D.; Daniels, C.; Ely, M.E. Green infrastructure as life support: Urban nature and climate change. Trans. R. Soc. South. Aust. 2015, 139, 97–112. [Google Scholar] [CrossRef]
- Nagase, A. Novel application and reused materials for extensive green roof substrates and drainage layers in Japan—Plant growth and moisture uptake implementation. Ecol. Eng. 2020, 153, 105898. [Google Scholar] [CrossRef]
- Bollman, M.A.; DeSantis, G.E.; DuChanois, R.M.; Etten-Bohm, M.; Olszyk, D.M.; Lambrinos, J.G.; Mayer, P.M. A framework for optimizing hydrologic performance of green roof media. Ecol. Eng. 2019, 140, 105589. [Google Scholar] [CrossRef] [PubMed]
- Graceson, A.; Hare, M.; Hall, N.; Monaghan, J. Use of inorganic substrates and composted green waste in growing media for green roofs. Biosyst. Eng. 2014, 124, 1–7. [Google Scholar] [CrossRef]

| Parameter | Value | Remark |
|---|---|---|
| c01 | 0 a/0 b | The initial temperature of the first stage (°C) |
| t01 | 30/60 | Operation time of the first stage (min) |
| c02 | 300/600 | The initial temperature of the second stage (°C) |
| t02 | 180/180 | Operation time of the second stage (min) |
| c03 | 300/600 | The initial temperature of the third stage (°C) |
| t03 | 30/60 | Operation time of the third stage (min) |
| c04 | 0/0 | The initial temperature of the fourth stage (°C) |
| t04 | −121/−121 | Ending order in the program |
| Element (wt.%) | WB 300 | WB 600 | CMB 300 | CMB 600 | WHB 300 | WHB 600 |
|---|---|---|---|---|---|---|
| C | 80.01 | 92.14 | 60.15 | 51.64 | 42.78 | 66.35 |
| O | 19.43 | 5.51 | 20.87 | 13.54 | 22.08 | 10.16 |
| Na | 0 | 0 | 1.08 | 2.79 | 3.43 | 0.39 |
| Mg | 0.11 | 0.07 | 0.77 | 0.30 | 3.97 | 0.67 |
| Al | 0.05 | 0.04 | 0.33 | 0.00 | 0.04 | 0.00 |
| Si | 0.00 | 0.07 | 0.71 | 1.33 | 0.15 | 0.14 |
| P | 0.00 | 0.02 | 4.44 | 1.67 | 2.65 | 1.07 |
| Cl | 0.00 | 0.00 | 0.59 | 11.27 | 7.87 | 6.09 |
| K | 0.00 | 0.56 | 4.85 | 15.21 | 3.82 | 6.22 |
| Ca | 0.45 | 1.58 | 5.39 | 1.65 | 6.28 | 8.29 |
| S | 0.00 | 0.00 | 0.53 | 0.52 | 0.09 | 0.14 |
| Rh | 0.00 | 0.00 | 0.00 | 0.00 | 0.33 | 0.13 |
| B | 0.00 | 0.00 | 0.00 | 0.00 | 3.44 | 0.00 |
| Te | 0.00 | 0.00 | 0.00 | 0.00 | 0.31 | 0.00 |
| Mn | 0.00 | 0.00 | 0.00 | 0.00 | 0.00 | 0.37 |
| Total | 100.05 | 99.99 | 99.71 | 99.92 | 97.24 | 100.02 |
| Functional Group | WB 300 (%) | WB 600 (%) | CMB 300 (%) | CMB 600 (%) | WHB 300 (%) | WHB 600 (%) |
|---|---|---|---|---|---|---|
| O–H | ✔ 3743.154 | ✔ 3451.955 | ✔ 3727.726 | ✔ 3727.726 | ✔ 3727.726 | ✔ 3687.228 |
| –C=CH2 | ✔ 2985.266 | ✔ 2996.837 | ✔ 2985.266 | ✔ 2948.626 | ||
| R–COOH | ✔ 1824.329 | ✔ 1820.043 | ✔ 1700.908 | ✔ 1793.474 | ✔ 1700.908 | |
| Cl–C–H | ✔ 1494.562 | |||||
| R–CONH- | ✔ 1535.059 | ✔ 1521.56 | ✔ 1535.059 | |||
| R–SO32¯ | ✔ 1234.219 | ✔ 1186.007 | ||||
| R–CO–R CO–CO CO–C–CO | ✔ 1072.227 | ✔ 1072.227 | ✔ 1083.798 | ✔ 1087.655 | ||
| –CHO | ✔ 885.166 | ✔ 879.381 | ✔ 869.738 | ✔ 848.525 |
| Sample | Surface Area (m2/g) | The Pore Volume (cm3/g) | Pore Size Distribution (nm) |
|---|---|---|---|
| WB300 | 19.81 | 0.03 | 6.15 |
| WB 600 | 73.12 | 0.15 | 10.88 |
| CMB 300 | 19.31 | 0.05 | 16.03 |
| CMB 600 | 75.33 | 0.15 | 10.88 |
| WHB 300 | 15.40 | 0.03 | 8.69 |
| WHB 600 | 62.93 | 0.20 | 13.81 |
| Sample | Similar Material | Main Ingredients |
|---|---|---|
| WHB 300 | Aluminum hydroxide | Al (OH)3 |
| WB 300 | Quartz | SiO2 |
| CMB 300 | Dolomite, quartz | Ca3Mg (CO3)2, SiO2 |
| WHB 600 | Calcite | CaCO3 |
| WB 600 | Calcite | CaCO3 |
| CMB 600 | Calcium aluminate, calcite | Ca3Al2O6, CaCO3 |
| Study | Feedstocks | Pyrolysis Temperature | The Maximum Water Content (%) | Remarks |
|---|---|---|---|---|
| Gray et al. [71] | hazelnut shells | 370 °C | 50.62 | Hygroscopicity increases with increasing temperature |
| 620 °C | 60.56 | |||
| Douglas fir chips | 370 °C | 66.18 | ||
| 620 °C | 73.32 | |||
| Chen et al. [48] | Tobacco stem | 250 °C | 16.38 | Hygroscopicity decrease with increasing temperature |
| 850 °C | 12.53 | |||
| Jiang et al. [46] | Cedar wood | 200 °C | 15.72 | Hygroscopicity decrease with increasing temperature |
| 225 °C | 14.58 | |||
| 250 °C | 13.03 | |||
| 275 °C | 10.20 | |||
| 300 °C | 7.79 | |||
| Polar wood | 200 °C | 11.15 | ||
| 225 °C | 9.64 | |||
| 250 °C | 8.33 | |||
| 275 °C | 7.53 | |||
| 300 °C | 7.37 | |||
| Corn stalk | 200 °C | 13.74 | ||
| 225 °C | 12.27 | |||
| 250 °C | 11.93 | |||
| 275 °C | 11.47 | |||
| 300 °C | 11.26 | |||
| Wheat straw | 200 °C | 17.29 | ||
| 225 °C | 15.97 | |||
| 250 °C | 13.97 | |||
| 275 °C | 12.38 | |||
| 300 °C | 12.18 | |||
| Present study | Water hyacinth | 300 °C | 79.07 | The hygroscopicity of water hyacinth decrease with increasing temperature |
| 600 °C | 41.29 | |||
| Wood | 300 °C | 6.82 | ||
| 600 °C | 7.36 | |||
| Chicken manure | 300 °C | 23.07 | ||
| 600 °C | 24.61 |
| Study | Materials | Water Holding Capacity (%) |
|---|---|---|
| Nagase, A. [74] | Cocopeat | 39 |
| Commercial green roof substrate | 37.5 | |
| Bollman, M. A. et al. [75] | Peat moss | 82.4 |
| Perlite | 57.9 | |
| Pumice | 52.5 | |
| Red cinder | 20.1 | |
| River sand | 44.1 | |
| Vermiculite | 41.6 | |
| Graceson et al. [76] | Crushed brick | 28.2 |
| Crushed tile | 32.5 | |
| Lytag | 30.0 | |
| Present study | Water hyacinth biochar (300 °C) | 79.07 |
| Water hyacinth biochar (600 °C) | 41.29 | |
| Wood biochar (300 °C) | 6.82 | |
| Wood biochar (600 °C) | 7.36 | |
| Chicken manure (300 °C) | 23.07 | |
| Chicken manure (600 °C) | 24.60 |
Publisher’s Note: MDPI stays neutral with regard to jurisdictional claims in published maps and institutional affiliations. |
© 2021 by the authors. Licensee MDPI, Basel, Switzerland. This article is an open access article distributed under the terms and conditions of the Creative Commons Attribution (CC BY) license (https://creativecommons.org/licenses/by/4.0/).
Share and Cite
Bao, X.; Li, M.; Niu, R.; Lu, J.; Panigrahi, S.; Garg, A.; Berretta, C. Hygroscopic Water Retention and Physio-Chemical Properties of Three In-House Produced Biochars from Different Feedstock Types: Implications on Substrate Amendment in Green Infrastructure. Water 2021, 13, 2613. https://doi.org/10.3390/w13192613
Bao X, Li M, Niu R, Lu J, Panigrahi S, Garg A, Berretta C. Hygroscopic Water Retention and Physio-Chemical Properties of Three In-House Produced Biochars from Different Feedstock Types: Implications on Substrate Amendment in Green Infrastructure. Water. 2021; 13(19):2613. https://doi.org/10.3390/w13192613
Chicago/Turabian StyleBao, Xia, Manqi Li, Renjie Niu, Jinling Lu, Sagarika Panigrahi, Ankit Garg, and Christian Berretta. 2021. "Hygroscopic Water Retention and Physio-Chemical Properties of Three In-House Produced Biochars from Different Feedstock Types: Implications on Substrate Amendment in Green Infrastructure" Water 13, no. 19: 2613. https://doi.org/10.3390/w13192613
APA StyleBao, X., Li, M., Niu, R., Lu, J., Panigrahi, S., Garg, A., & Berretta, C. (2021). Hygroscopic Water Retention and Physio-Chemical Properties of Three In-House Produced Biochars from Different Feedstock Types: Implications on Substrate Amendment in Green Infrastructure. Water, 13(19), 2613. https://doi.org/10.3390/w13192613