
Evaluation of Vegetation Indices and Phenological Metrics Using Time-Series MODIS Data for Monitoring Vegetation Change in Punjab, Pakistan

 , ,
, ,  , and
, and
Abstract
:1. Introduction
2. Materials and Methods
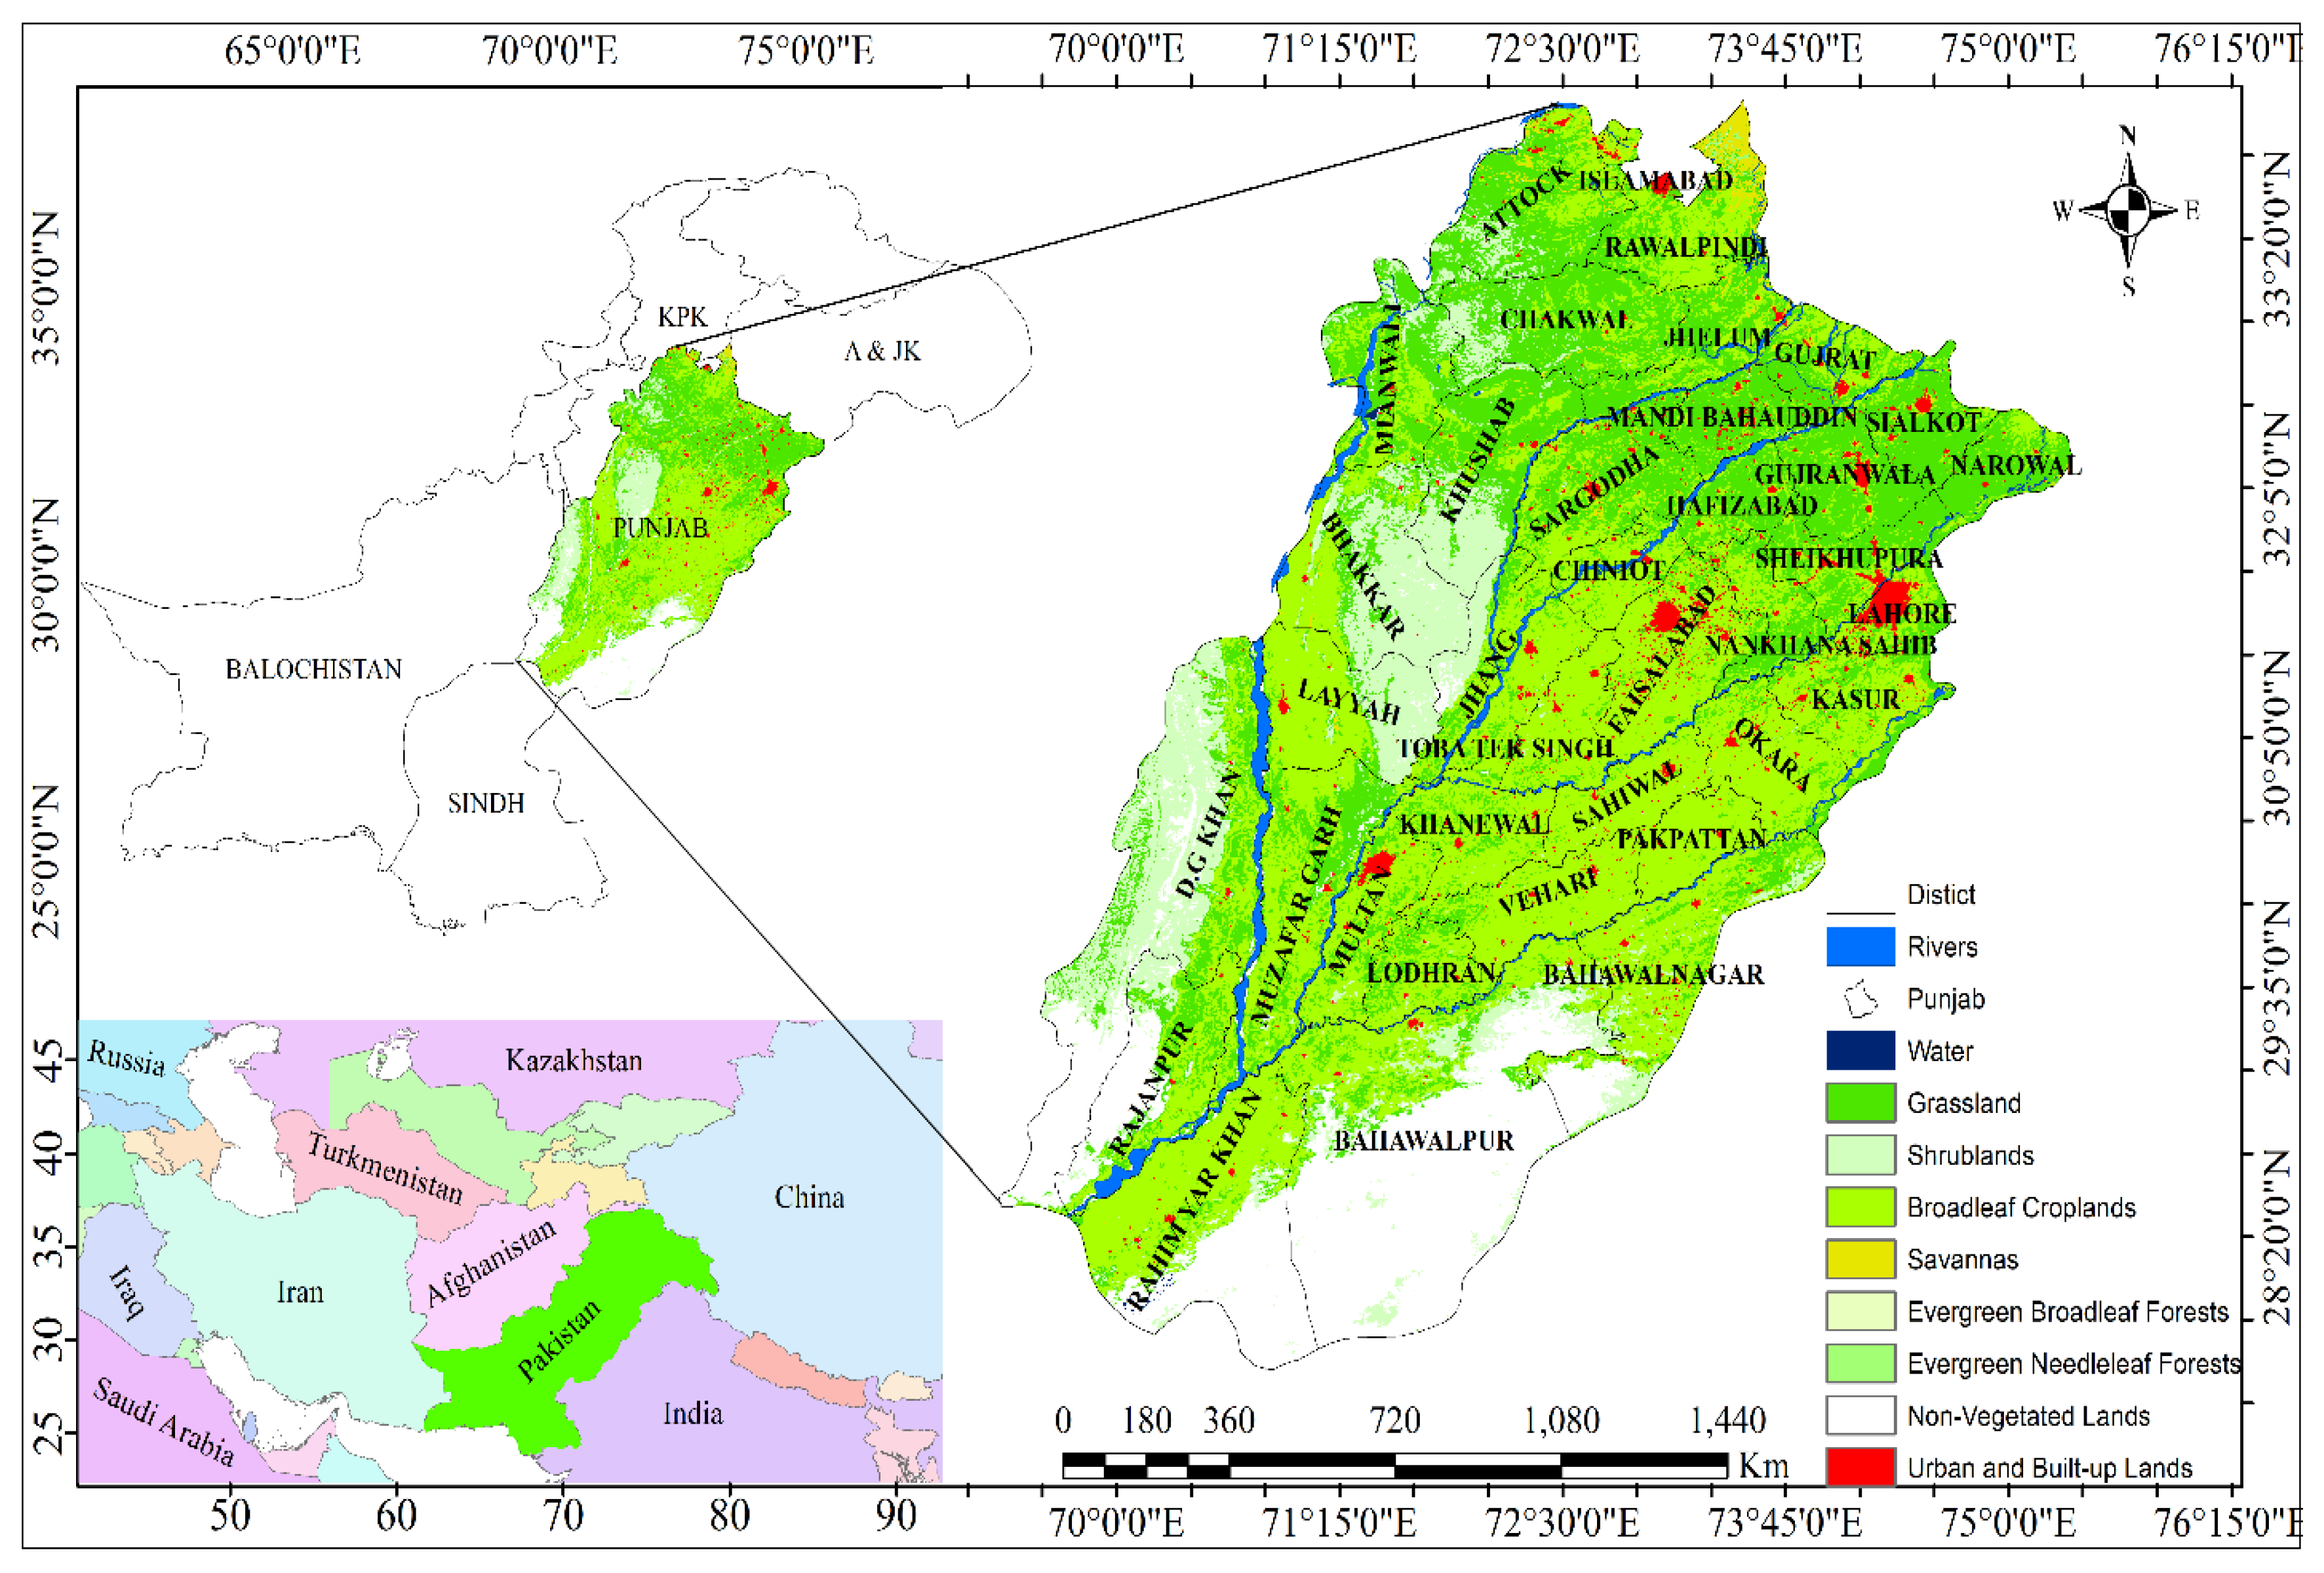
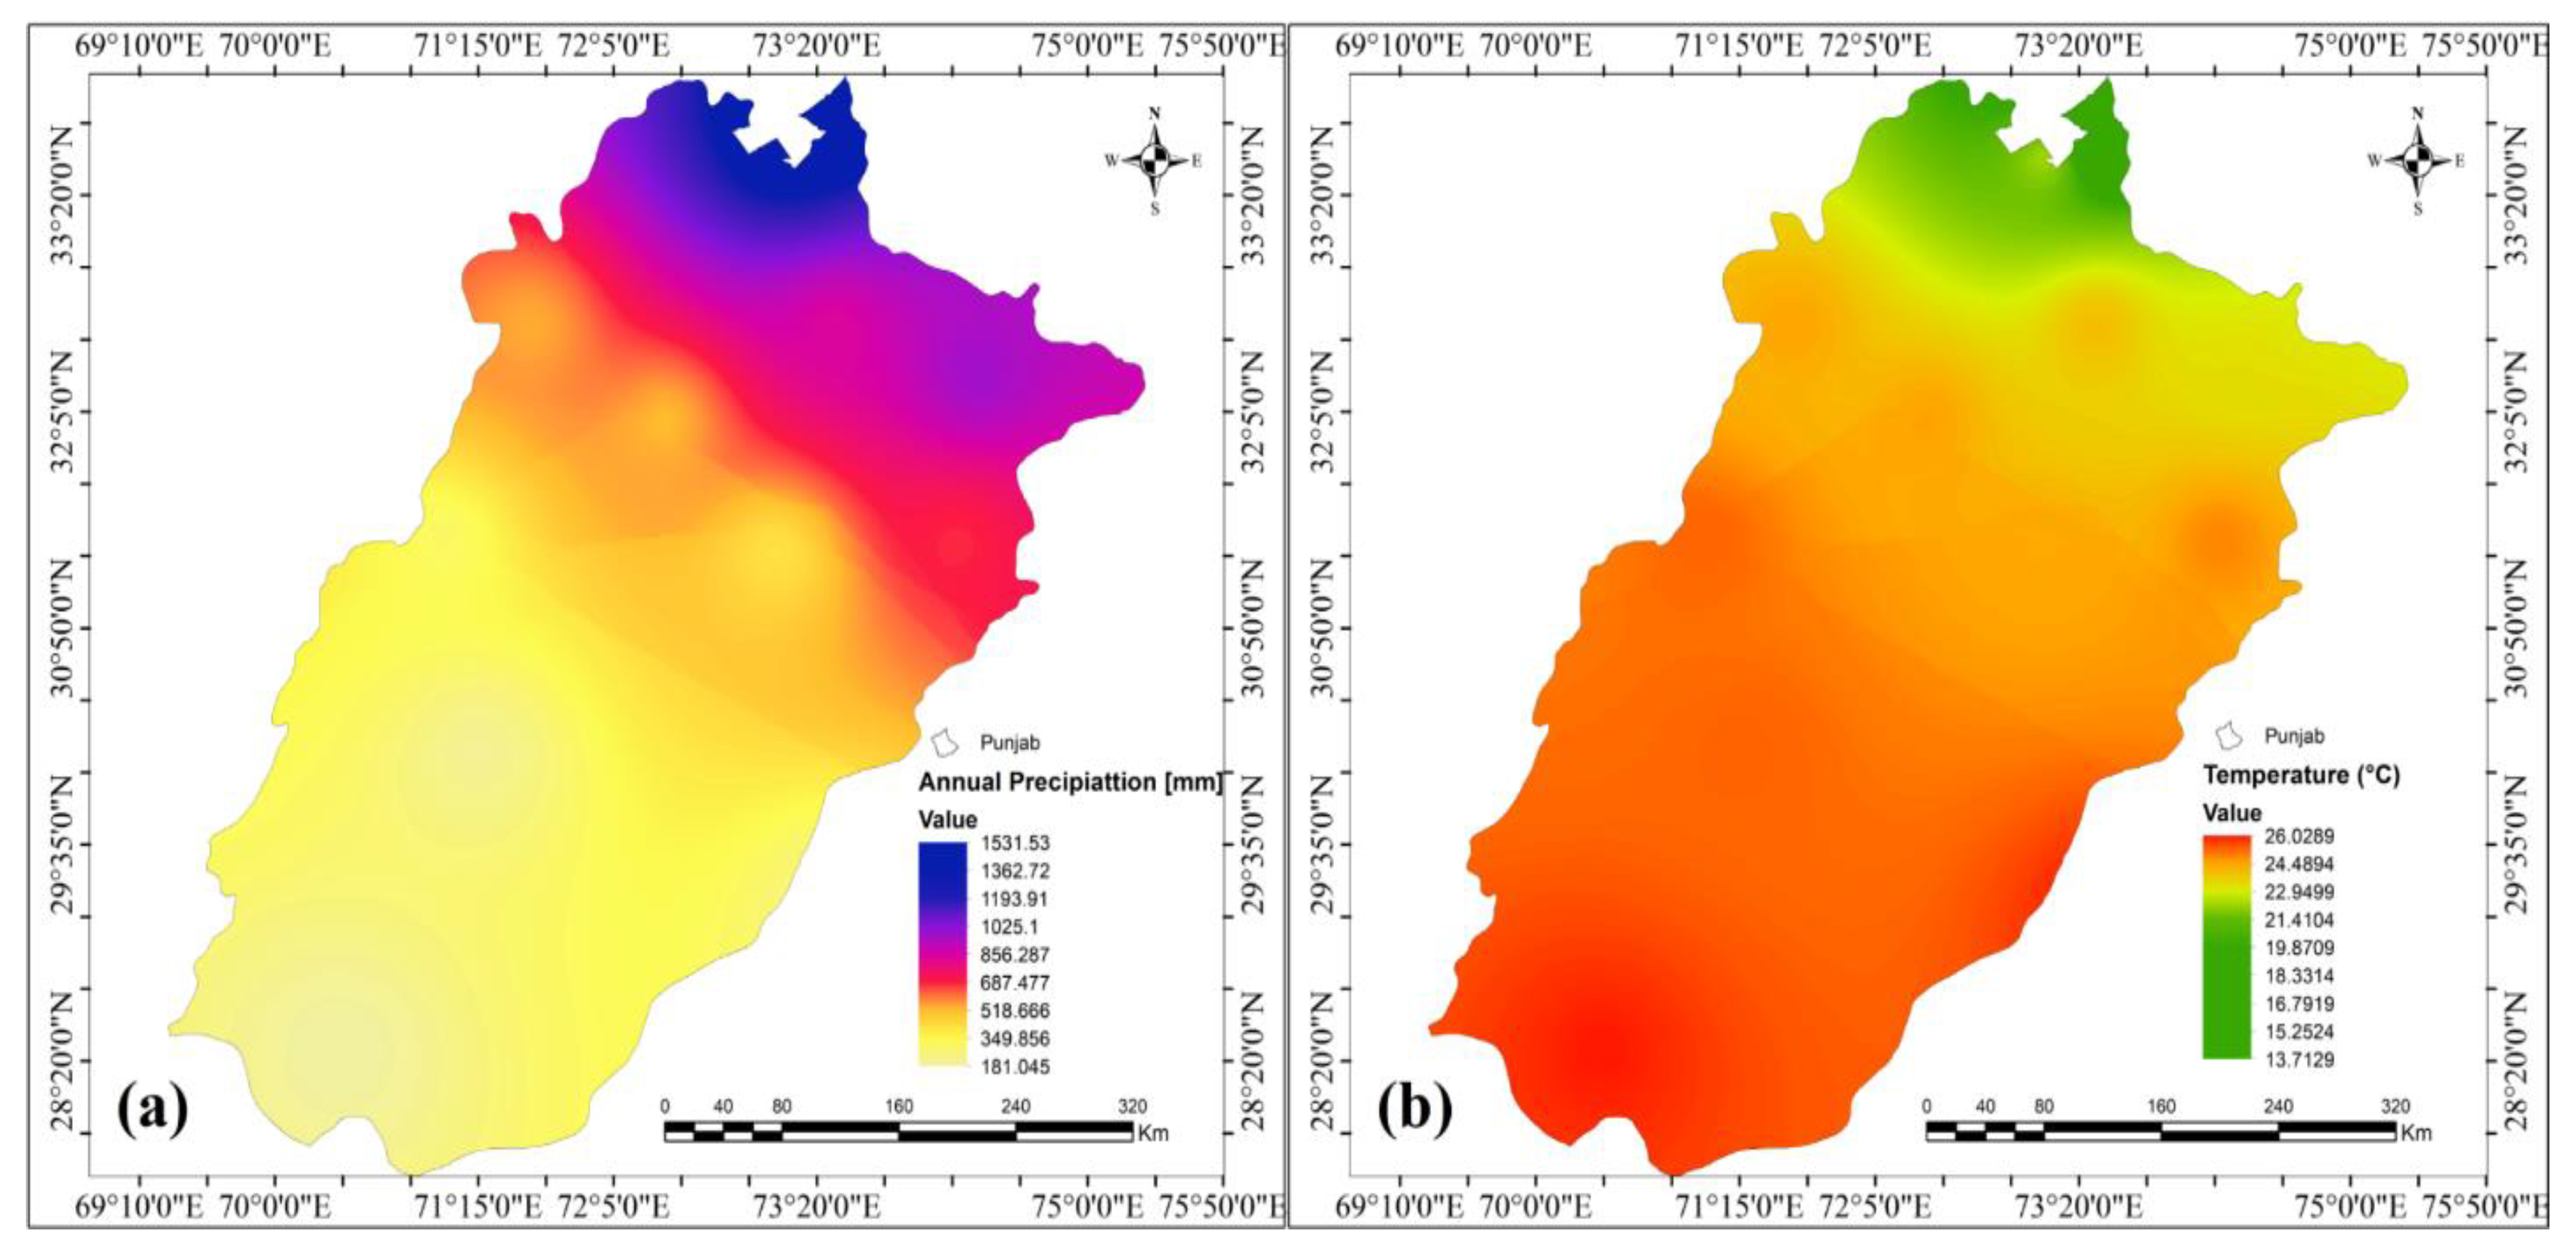
2.1. Study Area
2.2. Data Acquisition
2.3. Analyzing Vegetation Indices
2.3.1. Vegetation Indices
2.3.2. Mean Monthly and Annual VIs and Their Variability
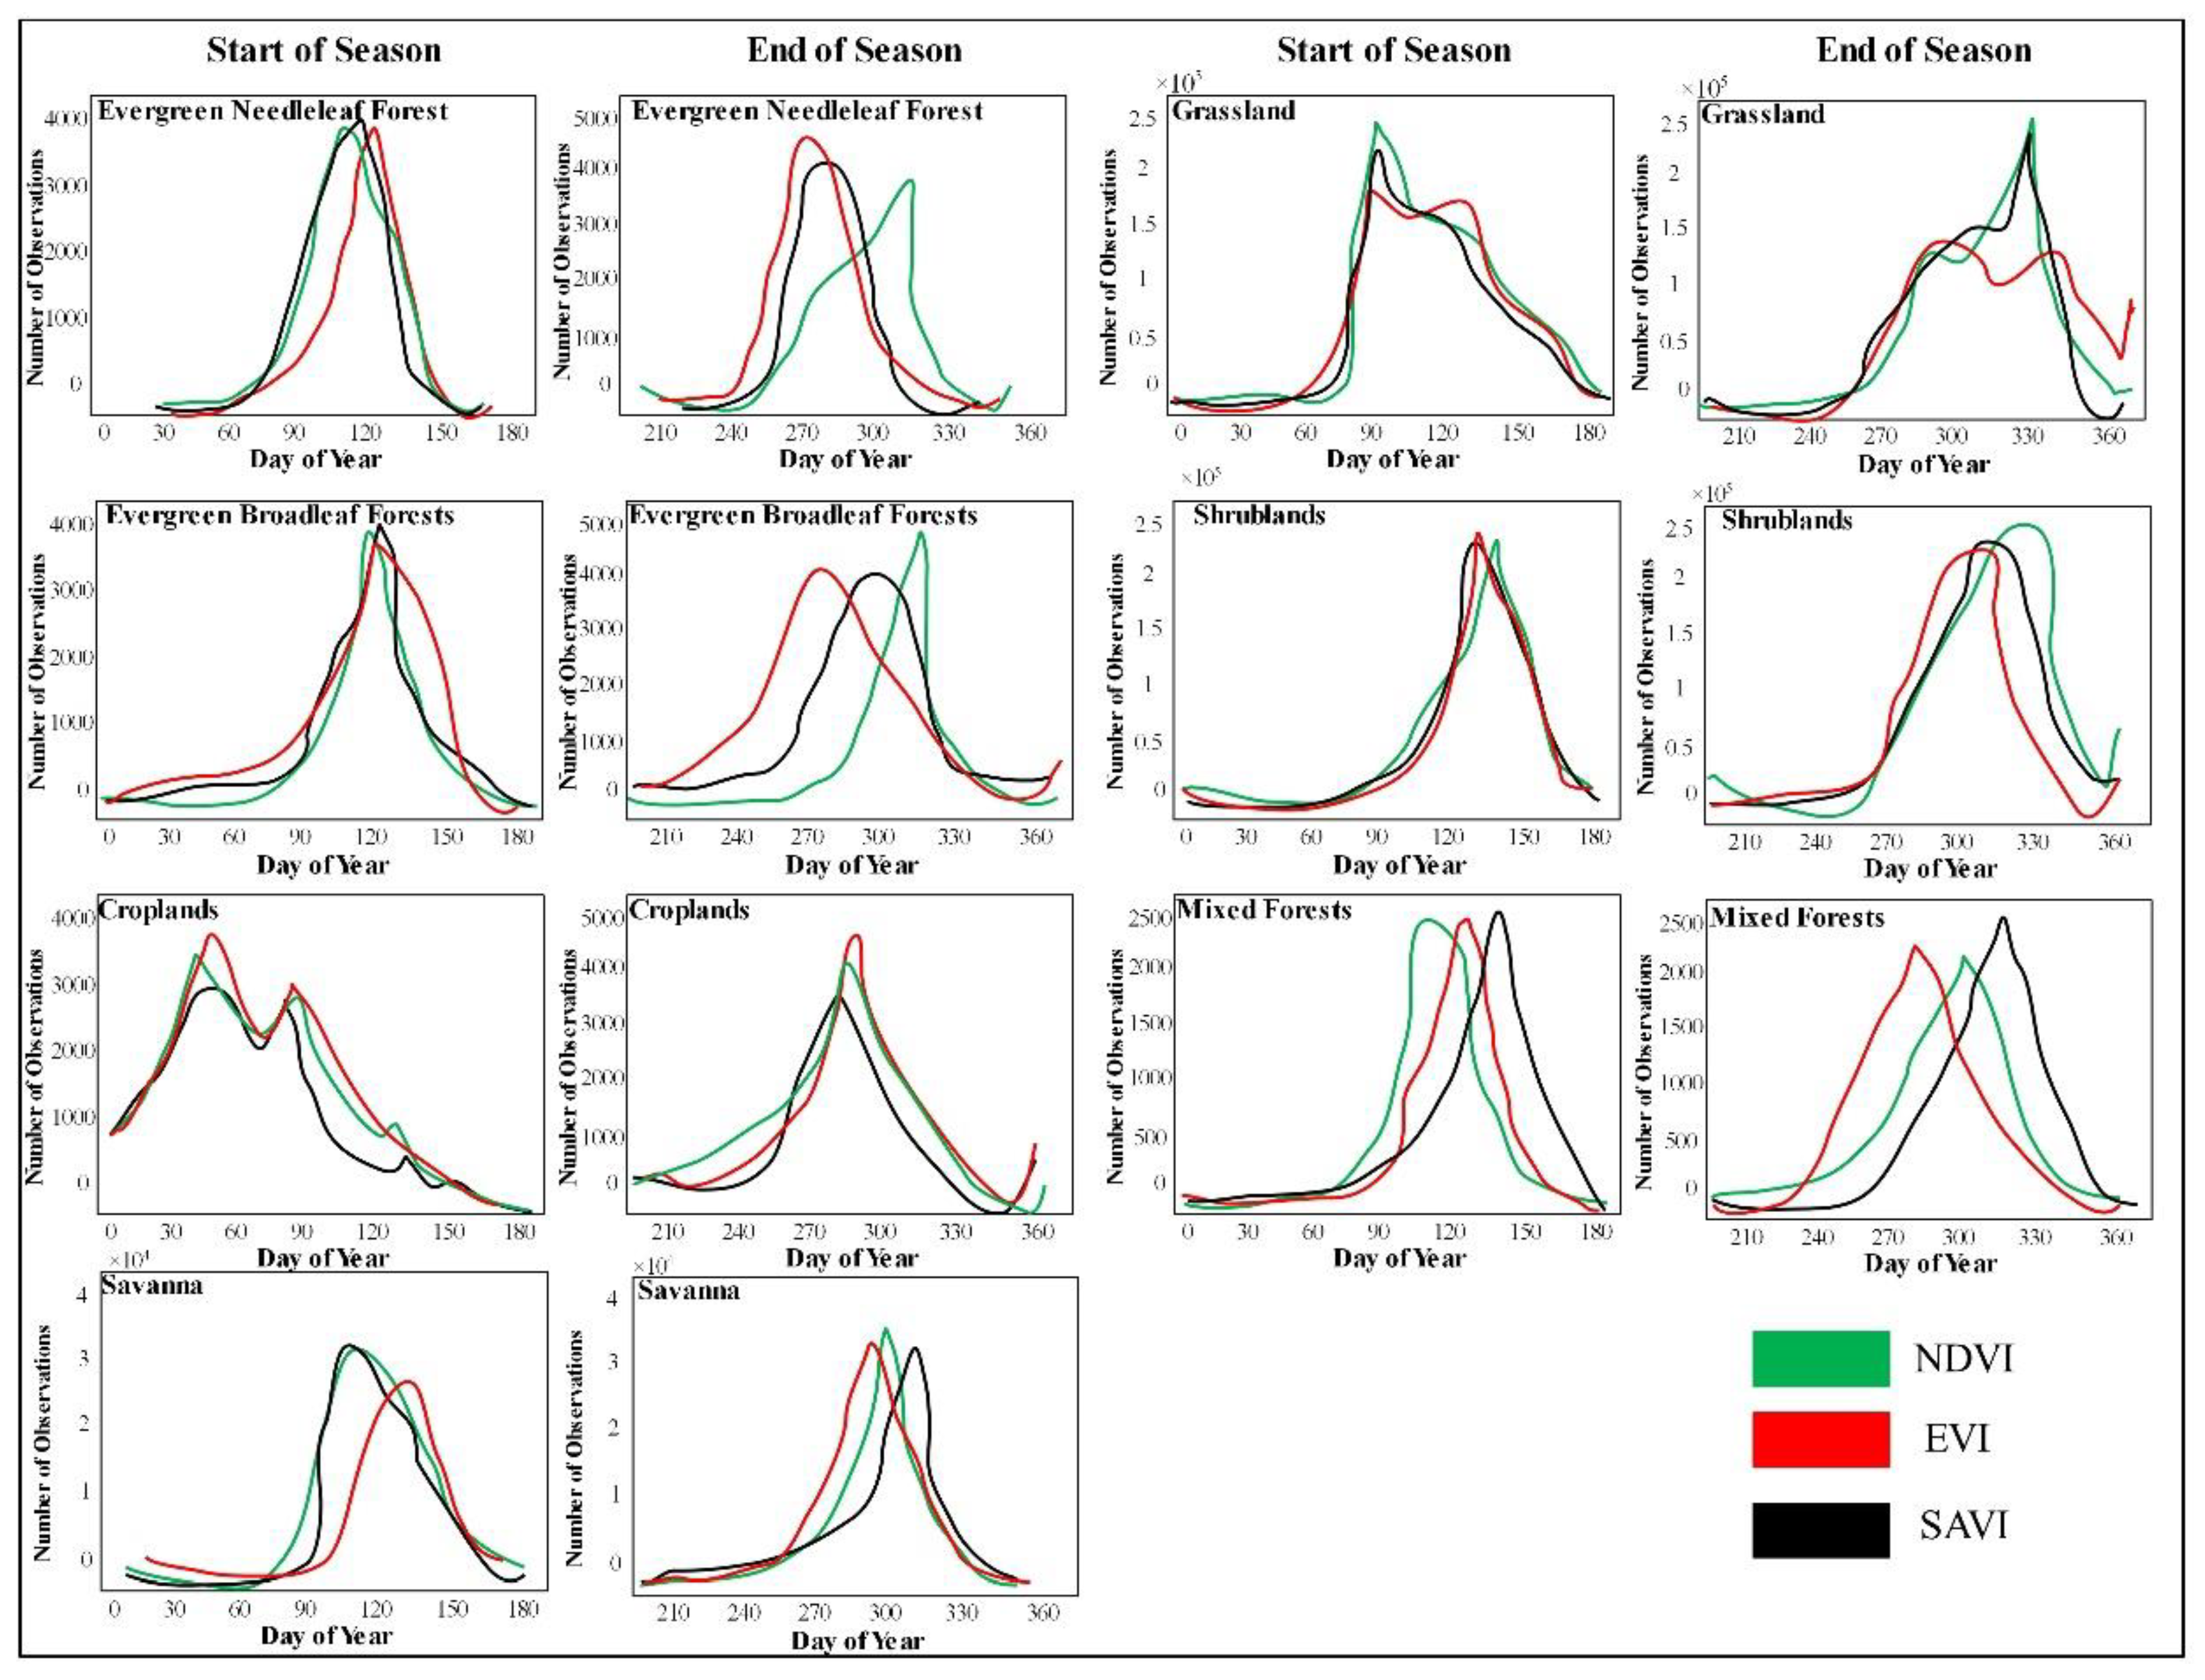
2.4. Detection of Phenological Metrics
3. Results
3.1. Vegetation Indices
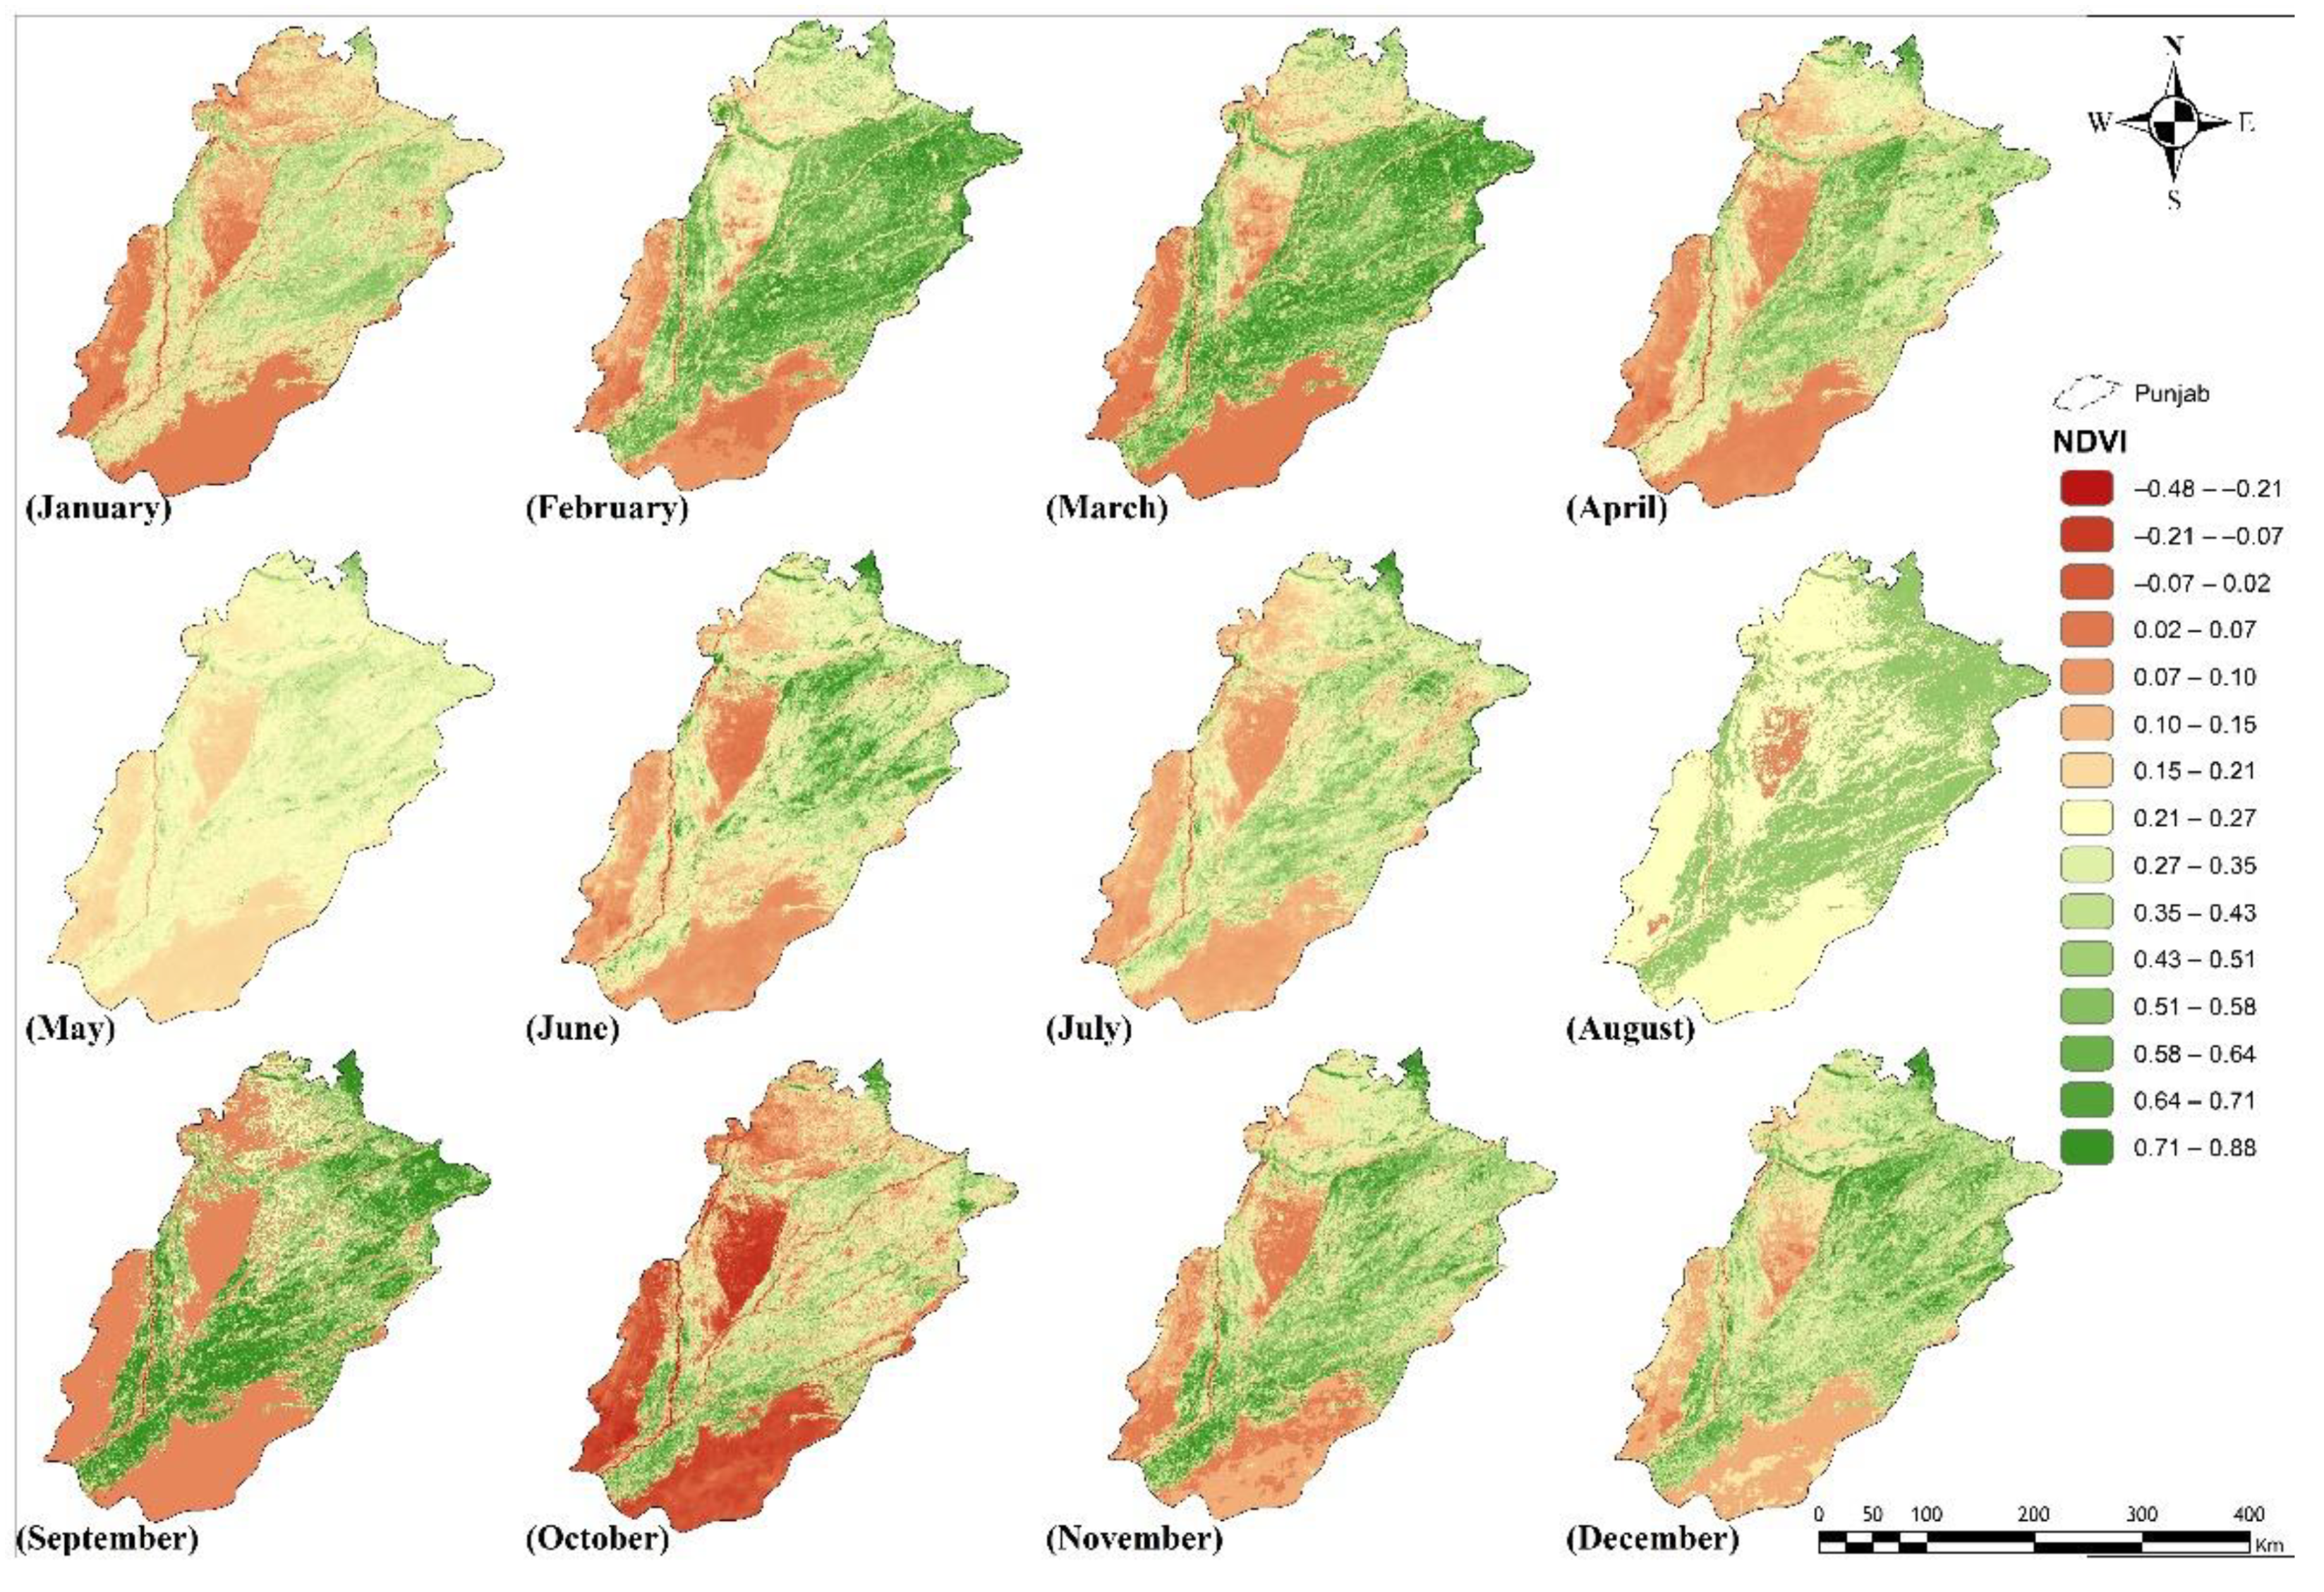
3.1.1. Mean Monthly VIs
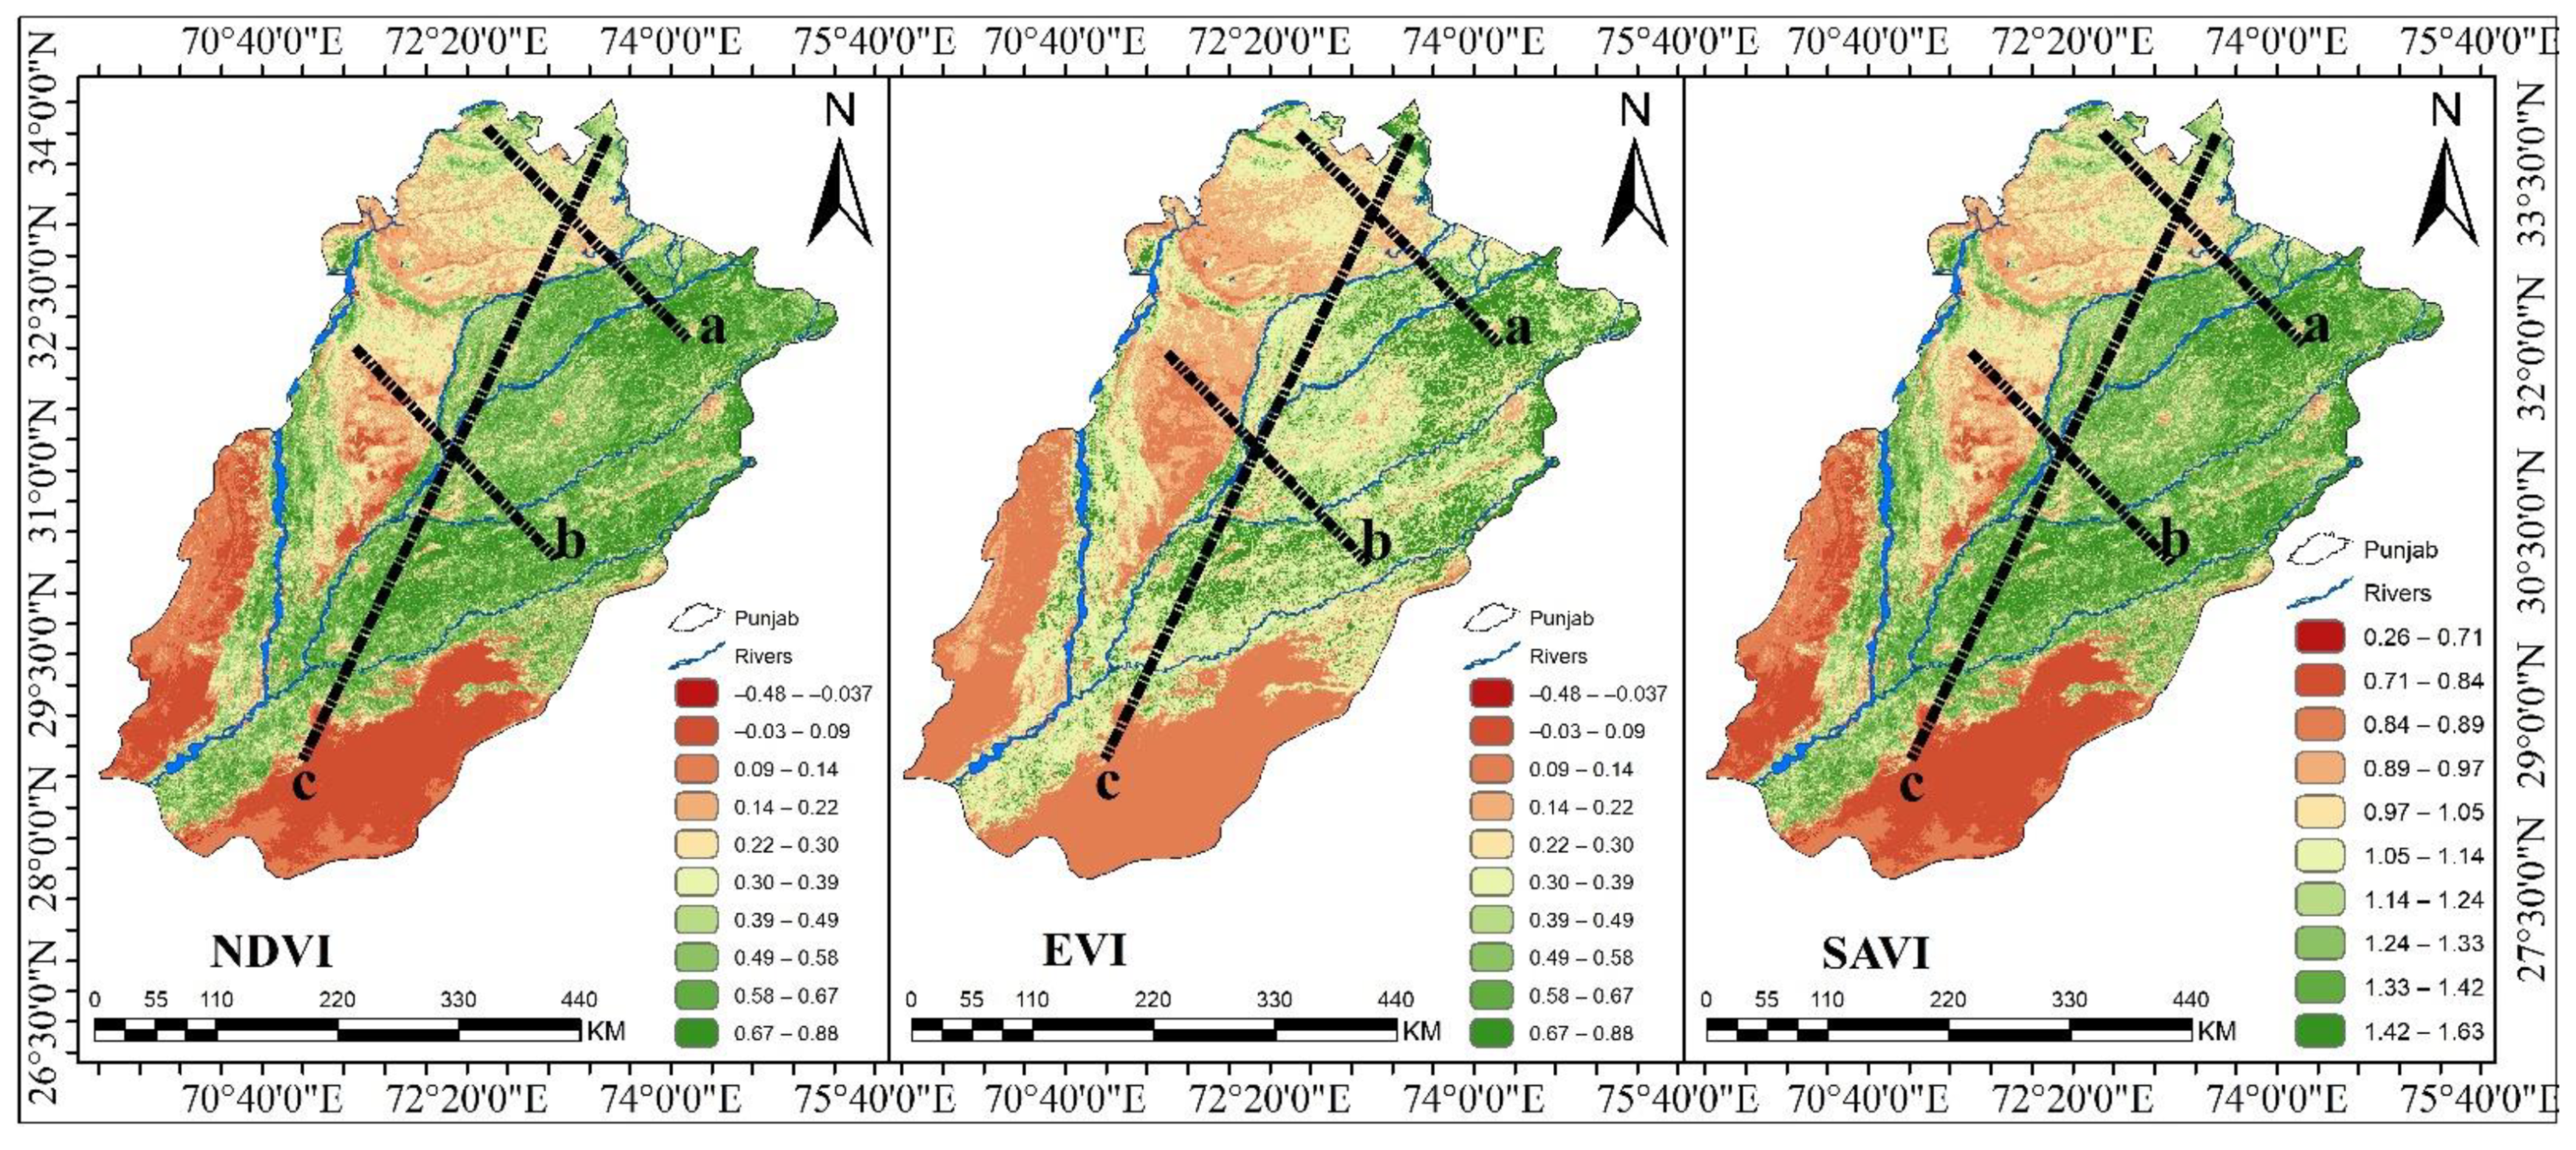
3.1.2. Mean Annual VIs
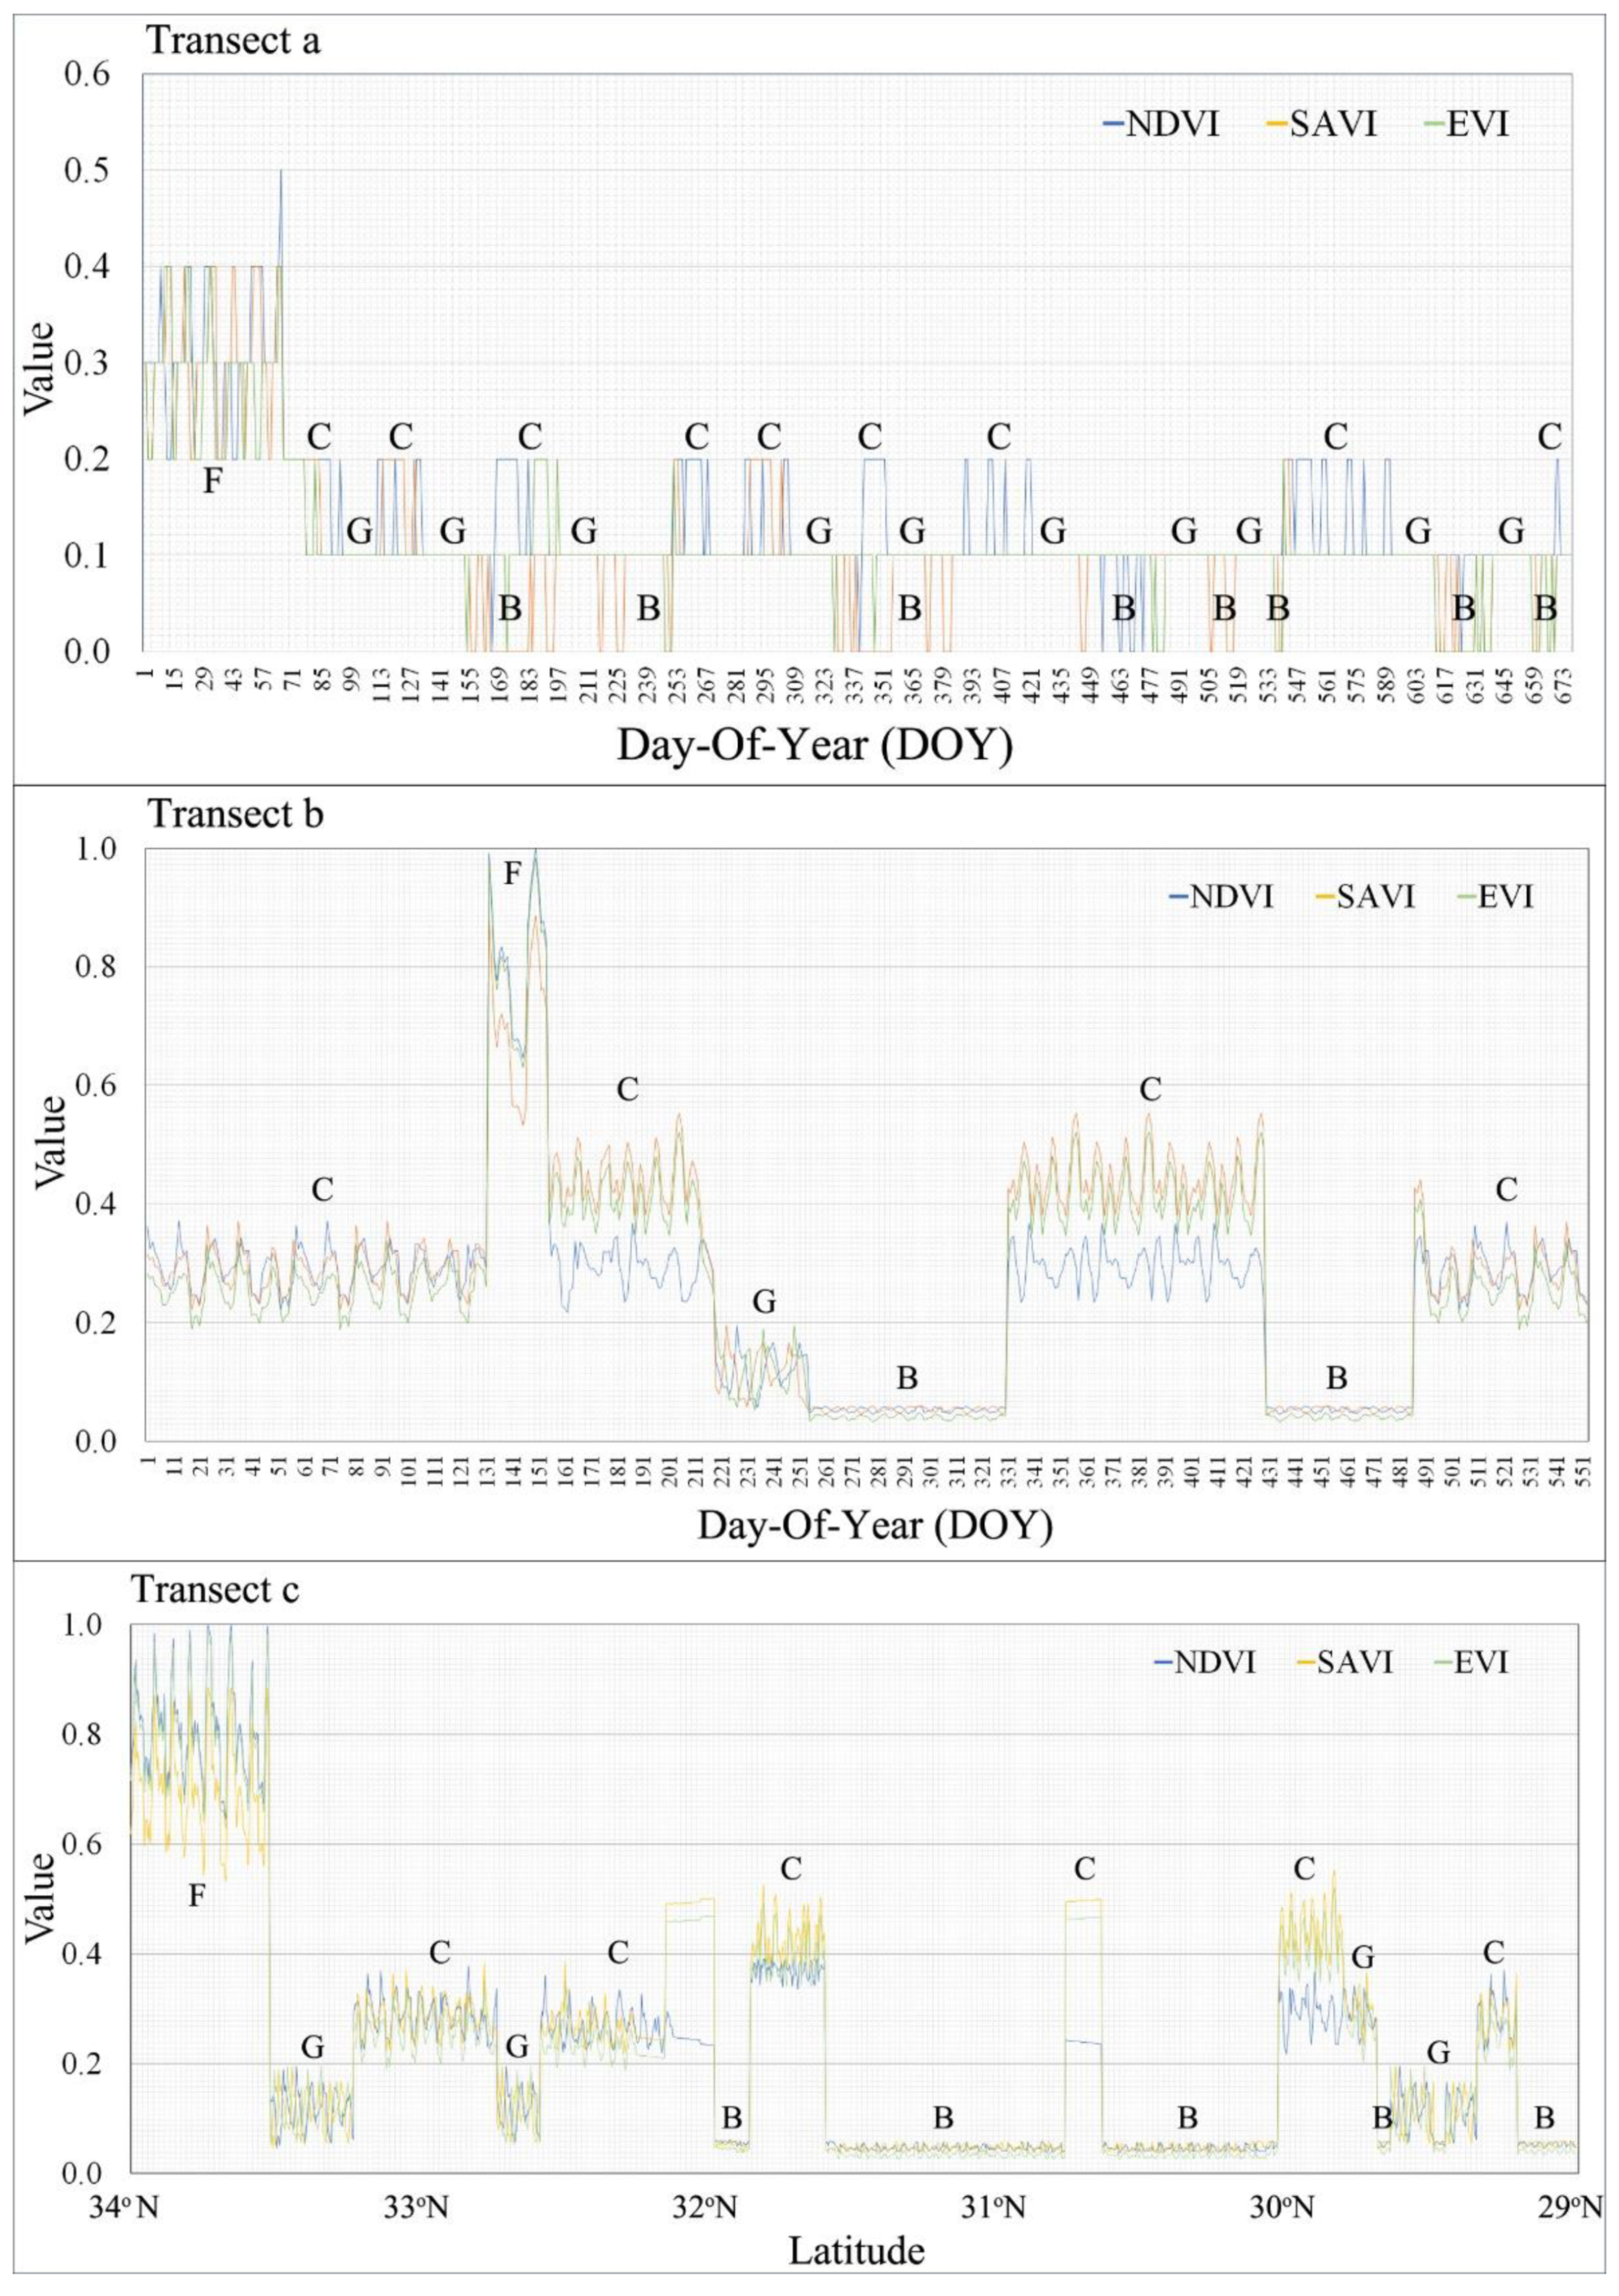
3.2. Phenological Metrics Detection
4. Discussion
4.1. VI Variability
4.2. Detection of Phenology Metrics
5. Conclusions
Author Contributions
Funding
Institutional Review Board Statement
Informed Consent Statement
Data Availability Statement
Acknowledgments
Conflicts of Interest
Abbreviations
| EVI2 | 2-band Enhanced Vegetation Index |
| AVHRR | Advanced Very High-Resolution Radiometer |
| AOI | Area-of-Interest |
| EVI | Enhanced Vegetation Index |
| GDVI | Generalized Differential Vegetation Index |
| GRVI | Green-Red-Vegetation-Index |
| GPP | Gross primary production |
| IGBP | International Geosphere-Biosphere Program |
| LAI | Leaf Area Index |
| MODIS | Moderate Resolution Imaging Spectroradiometer |
| MSAVI | Modified Soil Adjusted Vegetation Index |
| NBAR | Nadir Bidirectional Reflectance Distribution Function |
| NIR | Near-infrared |
| NDVI | Normalized Vegetation Difference Index |
| OSAVI | Optimized Soil Adjusted Vegetation Index |
| PMD | Pakistan Meteorological Department |
| PAR | Photosynthetically active radiation |
| SAVI | Soil Adjusted Vegetation Index |
| SD | Standard deviation |
| VIs | Vegetation indices |
References
- Sharifi, A.; Amini, J.; Pourshakouri, F. Development of an allometric model to estimate above-ground biomass of forests using MLPNN algorithm, case study: Hyrcanian forests of Iran. Casp. J. Environ. Sci. 2016, 14, 125–137. [Google Scholar]
- Reynolds, J.F.; Stafford Smith, D.M.; Lambin, E.F.; Turner, B.L.; Mortimore, M.; Batterbury, S.P.J.; Downing, T.E.; Dowlatabadi, H.; Fernández, R.J.; Herrick, J.E.; et al. Ecology: Global desertification: Building a science for dryland development. Science 2007, 316, 847–851. [Google Scholar] [CrossRef] [Green Version]
- Herrmann, S.M.; Anyamba, A.; Tucker, C.J. Recent trends in vegetation dynamics in the African Sahel and their relationship to climate. Glob. Environ. Chang. 2005, 15, 394–404. [Google Scholar] [CrossRef]
- Wessels, K.J.; Prince, S.D.; Malherbe, J.; Small, J.; Frost, P.E.; VanZyl, D. Can human-induced land degradation be distinguished from the effects of rainfall variability? A case study in South Africa. J. Arid Environ. 2007, 68, 271–297. [Google Scholar] [CrossRef]
- Gibbes, C.; Southworth, J.; Waylen, P.; Child, B. Climate variability as a dominant driver of post-disturbance savanna dynamics. Appl. Geogr. 2014, 53, 389–401. [Google Scholar] [CrossRef]
- Seaquist, J.W.; Hickler, T.; Eklundh, L.; Ardö, J.; Heumann, B.W. Disentangling the effects of climate and people on Sahel vegetation dynamics. Biogeosci. Discuss. 2008, 5, 3045–3067. [Google Scholar] [CrossRef]
- Tariq, A.; Shu, H.; Kuriqi, A.; Siddiqui, S.; Gagnon, A.S.; Lu, L.; Linh, N.T.T.; Pham, Q.B. Characterization of the 2014 Indus River Flood Using Hydraulic Simulations and Satellite Images. Remote Sens. 2021, 13, 2053. [Google Scholar] [CrossRef]
- Zhou, L.; Tucker, C.J.; Kaufmann, R.K.; Slayback, D.; Shabanov, N.V.; Myneni, R.B. Variations in northern vegetation activity inferred from satellite data of vegetation index during 1981 to 1999. J. Geophys. Res. Atmos. 2001, 106, 20069–20083. [Google Scholar] [CrossRef]
- Morisette, J.T.; Richardson, A.D.; Knapp, A.K.; Fisher, J.I.; Graham, E.A.; Abatzoglou, J.; Wilson, B.E.; Breshears, D.D.; Henebry, G.M.; Hanes, J.M.; et al. Tracking the rhythm of the seasons in the face of global change: Phenological research in the 21st century. Front. Ecol. Environ. 2009, 7, 253–260. [Google Scholar] [CrossRef] [Green Version]
- Goetz, S.J.; Prince, S.D. Modelling Terrestrial Carbon Exchange and Storage: Evidence and Implications of Functional Convergence in Light-use Efficiency. Adv. Ecol. Res. 1999, 28, 57–92. [Google Scholar] [CrossRef]
- Yan, C.Z.; Wang, T.; Han, Z.W.; Qie, Y.F. Surveying sandy deserts and desertified lands in north-western China by remote sensing. Int. J. Remote Sens. 2007, 28, 3603–3618. [Google Scholar] [CrossRef]
- Hazaymeh, K.; Hassan, Q.K.; Hazaymeh, K.; Hassan, Q.K. Remote sensing of agricultural drought monitoring: A state of art review. AIMS Environ. Sci. 2016, 3, 604–630. [Google Scholar] [CrossRef]
- Wilson, N.R.; Norman, L.M.; Villarreal, M.; Gass, L.; Tiller, R.; Salywon, A. Comparison of remote sensing indices for monitoring of desert cienegas. Arid L. Res. Manag. 2016, 30, 460–478. [Google Scholar] [CrossRef] [Green Version]
- Ghaderizadeh, S.; Abbasi-Moghadam, D.; Sharifi, A.; Zhao, N.; Tariq, A. Hyperspectral image classification using a hybrid 3D-2D convolutional neural networks. IEEE J. Sel. Top. Appl. Earth Obs. Remote Sens. 2021, 14, 7570–7588. [Google Scholar] [CrossRef]
- Weiss, J.L.; Gutzler, D.S.; Coonrod, J.E.A.; Dahm, C.N. Long-term vegetation monitoring with NDVI in a diverse semi-arid setting, central New Mexico, USA. J. Arid Environ. 2004, 58, 249–272. [Google Scholar] [CrossRef]
- Tucker, C.J.; Pinzon, J.E.; Brown, M.E.; Slayback, D.A.; Pak, E.W.; Mahoney, R.; Vermote, E.F.; El Saleous, N. An extended AVHRR 8-km NDVI dataset compatible with MODIS and SPOT vegetation NDVI data. Int. J. Remote Sens. 2005, 26, 4485–4498. [Google Scholar] [CrossRef]
- Fensholt, R.; Sandholt, I. Evaluation of MODIS and NOAA AVHRR vegetation indices with in situ measurements in a semi-arid environment. Int. J. Remote Sens. 2005, 26, 2561–2594. [Google Scholar] [CrossRef]
- Wu, W. The Generalized Difference Vegetation Index (GDVI) for dryland characterization. Remote Sens. 2014, 6, 1211–1233. [Google Scholar] [CrossRef] [Green Version]
- Huete, A. Overview of the radiometric and biophysical performance of the MODIS vegetation indices. Remote Sens. Environ. 2002, 83, 195–213. [Google Scholar] [CrossRef]
- Huete, A.R.; Jackson, R.D.; Post, D.F. Spectral response of a plant canopy with different soil backgrounds. Remote Sens. Environ. 1985, 17, 37–53. [Google Scholar] [CrossRef]
- Huete, A.R. A soil-adjusted vegetation index (SAVI). Remote Sens. Environ. 1988, 25, 295–309. [Google Scholar] [CrossRef]
- Qi, J.; Chehbouni, A.; Huete, A.R.; Kerr, Y.H.; Sorooshian, S. A modified soil adjusted vegetation index. Remote Sens. Environ. 1994, 48, 119–126. [Google Scholar] [CrossRef]
- Rondeaux, G.; Steven, M.; Baret, F. Optimization of soil-adjusted vegetation indices. Remote Sens. Environ. 1996, 55, 95–107. [Google Scholar] [CrossRef]
- Mumtaz, F.; Tao, Y.; De Leeuw, G.; Zhao, L.; Fan, C.; Elnashar, A.; Bashir, B.; Wang, G.; Li, L.L.; Naeem, S.; et al. Modeling spatio-temporal land transformation and its associated impacts on land surface temperature (LST). Remote Sens. 2020, 12, 2987. [Google Scholar] [CrossRef]
- Richardson, A.D.; Black, T.A.; Ciais, P.; Delbart, N.; Friedl, M.A.; Gobron, N.; Hollinger, D.Y.; Kutsch, W.L.; Longdoz, B.; Luyssaert, S.; et al. Influence of spring and autumn phenological transitions on forest ecosystem productivity. Philos. Trans. R. Soc. B Biol. Sci. 2010, 365, 3227–3246. [Google Scholar] [CrossRef] [Green Version]
- Tariq, A.; Shu, H. CA-Markov Chain Analysis of Seasonal Land Surface Temperature and Land Use Landcover Change Using Optical Multi-Temporal Satellite Data of Faisalabad, Pakistan. Remote Sens. 2020, 12, 3402. [Google Scholar] [CrossRef]
- Motohka, T.; Nasahara, K.N.; Miyata, A.; Mano, M.; Tsuchida, S. Evaluation of optical satellite remote sensing for rice paddy phenology in monsoon Asia using a continuous in situ dataset. Int. J. Remote Sens. 2009, 30, 4343–4357. [Google Scholar] [CrossRef]
- Motohka, T.; Nasahara, K.N.; Oguma, H.; Tsuchida, S. Applicability of Green-Red Vegetation Index for remote sensing of vegetation phenology. Remote Sens. 2010, 2, 2369–2387. [Google Scholar] [CrossRef] [Green Version]
- Nagai, S.; Saitoh, T.M.; Kobayashi, H.; Ishihara, M.; Suzuki, R.; Motohka, T.; Nasahara, K.N.; Muraoka, H. In situ examination of the relationship between various vegetation indices and canopy phenology in an evergreen coniferous forest, Japan. Int. J. Remote Sens. 2012, 33, 6202–6214. [Google Scholar] [CrossRef]
- Zainab, N.; Tariq, A.; Siddiqui, S. Development of Web-Based GIS Alert System for Informing Environmental Risk of Dengue Infections in Major Cities of Pakistan. Geosfera Indones. 2021, 6, 77. [Google Scholar] [CrossRef]
- Rocha, A.V.; Shaver, G.R. Advantages of a two band EVI calculated from solar and photosynthetically active radiation fluxes. Agric. For. Meteorol. 2009, 149, 1560–1563. [Google Scholar] [CrossRef]
- Bannari, A.; Morin, D.; Bonn, F.; Huete, A.R. A review of vegetation indices. Remote Sens. Rev. 1995, 13, 95–120. [Google Scholar] [CrossRef]
- Rodríguez-Moreno, V.M.; Bullock, S.H. Vegetation response to hydrologic and geomorphic factors in an arid region of the Baja California Peninsula. Environ. Monit. Assess. 2014, 186, 1009–1021. [Google Scholar] [CrossRef] [PubMed] [Green Version]
- Sjöström, M.; Ardö, J.; Eklundh, L.; El-Tahir, B.A.; El-Khidir, H.A.M.; Hellström, M.; Hellström, M.; Seaquist, J. Evaluation of satellite based indices for gross primary production estimates in a sparse savanna in the Sudan. Biogeosciences 2009, 6, 129–138. [Google Scholar] [CrossRef] [Green Version]
- Ghaderpour, E.; Vujadinovic, T. The Potential of the Least-Squares Spectral and Cross-Wavelet Analyses for Near-Real-Time Disturbance Detection within Unequally Spaced Satellite Image Time Series. Remote Sens. 2020, 12, 2446. [Google Scholar] [CrossRef]
- Walker, J.; de Beurs, K.; Wynne, R.H. Phenological response of an Arizona dryland forest to short-term climatic extremes. Remote Sens. 2015, 7, 10832–10855. [Google Scholar] [CrossRef] [Green Version]
- Hird, J.N.; McDermid, G.J. Noise reduction of NDVI time series: An empirical comparison of selected techniques. Remote Sens. Environ. 2009, 113, 248–258. [Google Scholar] [CrossRef]
- Tariq, A.; Shu, H.; Siddiqui, S.; Imran, M.; Farhan, M. Monitoring Land Use And Land Cover Changes Using Geospatial Techniques, A Case Study Of Fateh Jang, Attock, Pakistan. Geogr. Environ. Sustain. 2021, 14, 41–52. [Google Scholar] [CrossRef]
- Qasim, M. Determinants of Farm Income and Agricultural Risk Management Strategies: The Case of Rain-Fed Farm Households in Pakistan’s Punjab; Kassel University Press: Kassel, Germany, 2012; Volume 3, ISBN 9783862192984. [Google Scholar]
- Khan, A.; Hansen, M.; Potapov, P.; Adusei, B.; Pickens, A.; Krylov, A.; Stehman, S. Evaluating Landsat and RapidEye Data for Winter Wheat Mapping and Area Estimation in Punjab, Pakistan. Remote Sens. 2018, 10, 489. [Google Scholar] [CrossRef] [Green Version]
- Busetto, L.; Zwart, S.J.; Boschetti, M. Analysing spatial–temporal changes in rice cultivation practices in the Senegal River Valley using MODIS time-series and the PhenoRice algorithm. Int. J. Appl. Earth Obs. Geoinf. 2019, 75, 15–28. [Google Scholar] [CrossRef]
- Tariq, A.; Riaz, I.; Ahmad, Z. Land surface temperature relation with normalized satellite indices for the estimation of spatio-temporal trends in temperature among various land use land cover classes of an arid Potohar region using Landsat data. Environ. Earth Sci. 2020, 79, 1–15. [Google Scholar] [CrossRef]
- Mohamed, N.; Bannari, A. The Relationship between Vegetation and Rainfall in Central Sudan. Int. J. Remote Sens. Appl. 2016, 6, 30. [Google Scholar] [CrossRef]
- Imran, M.; Basit, I.; Khan, M.R.; Ahmad, S.R. Analyzing the Impact of Spatio-Temporal Climate Variations on the Rice Crop Calendar in Pakistan. Int. J. Biol. Life Agric. Sci. 2018, 12, 177–184. [Google Scholar] [CrossRef]
- Friedl, M.A.; Sulla-Menashe, D.; Tan, B.; Schneider, A.; Ramankutty, N.; Sibley, A.; Huang, X. MODIS Collection 5 global land cover: Algorithm refinements and characterization of new datasets. Remote Sens. Environ. 2010, 114, 168–182. [Google Scholar] [CrossRef]
- Matsushita, B.; Yang, W.; Chen, J.; Onda, Y.; Qiu, G. Sensitivity of the Enhanced Vegetation Index (EVI) and Normalized Difference Vegetation Index (NDVI) to topographic effects. Sensors 2007, 7, 2636–2651. [Google Scholar] [CrossRef] [PubMed] [Green Version]
- Gu, Y.; Hunt, E.; Wardlow, B.; Basara, J.B.; Brown, J.F.; Verdin, J.P. Evaluation of MODIS NDVI and NDWI for vegetation drought monitoring using Oklahoma Mesonet soil moisture data. Geophys. Res. Lett. 2008, 35. [Google Scholar] [CrossRef] [Green Version]
- Huete, A.R.; Jackson, R.D. Soil and atmosphere influences on the spectra of partial canopies. Remote Sens. Environ. 1988, 25, 89–105. [Google Scholar] [CrossRef]
- Jensen, J. Introductory Digital Image Processing: A Remote Sensing Perspective, Third Edition. Environ. Eng. Geosci. 1996, 13, 89–90. [Google Scholar] [CrossRef]
- Shah, S.H.I.A.; Yan, J.; Ullah, I.; Aslam, B.; Tariq, A.; Zhang, L.; Mumtaz, F. Classification of Aquifer Vulnerability by Using the DRASTIC Index and Geo-Electrical Techniques. Water 2021, 13, 2144. [Google Scholar] [CrossRef]
- Jönsson, P.; Eklundh, L. TIMESAT—A program for analyzing time-series of satellite sensor data. Comput. Geosci. 2004, 30, 833–845. [Google Scholar] [CrossRef] [Green Version]
- Wang, C.; Fritschi, F.B.; Stacey, G.; Yang, Z. Phenology-based assessment of perennial energy crops in North American tallgrass prairie. Ann. Assoc. Am. Geogr. 2011, 101, 742–751. [Google Scholar] [CrossRef]
- Lu, L.; Kuenzer, C.; Guo, H.; Li, Q.; Long, T.; Li, X. A novel land cover classification map based on a modis time-series in Xinjiang, China. Remote Sens. 2014, 6, 3387–3408. [Google Scholar] [CrossRef] [Green Version]
- Liu, J.; Zhang, W.; Liu, T. Monitoring recent changes in snow cover in Central Asia using improved MODIS snow-cover products. J. Arid Land 2017, 9, 763–777. [Google Scholar] [CrossRef]
- Wilson, A.M.; Parmentier, B.; Jetz, W. Systematic land cover bias in Collection 5 MODIS cloud mask and derived products—A global overview. Remote Sens. Environ. 2014, 141, 149–154. [Google Scholar] [CrossRef]
- Samanta, A.; Ganguly, S.; Myneni, R.B. MODIS enhanced vegetation index data do not show greening of amazon forests during the 2005 drought. New Phytol. 2011, 189, 11–15. [Google Scholar] [CrossRef] [PubMed]
- Kremer, R.G.; Running, S.W. Community type differentiation using NOAA/AVHRR data within a sagebrush-steppe ecosystem. Remote Sens. Environ. 1993, 46, 311–318. [Google Scholar] [CrossRef]
- Schmidt, H.; Karnieli, A. Remote sensing of the seasonal variability of vegetation in a semi-arid environment. J. Arid Environ. 2000, 45, 43–59. [Google Scholar] [CrossRef] [Green Version]
- Lu, L.; Wang, C.; Guo, H.; Li, Q. Detecting winter wheat phenology with SPOT-VEGETATION data in the North China Plain. Geocarto Int. 2014, 29, 244–255. [Google Scholar] [CrossRef]
- Zhang, X.; Friedl, M.A.; Schaaf, C.B. Global vegetation phenology from Moderate Resolution Imaging Spectroradiometer (MODIS): Evaluation of global patterns and comparison with in situ measurements. J. Geophys. Res. Biogeosci. 2006, 111, 1–14. [Google Scholar] [CrossRef]
- Shang, R.; Liu, R.; Xu, M.; Liu, Y.; Dash, J.; Ge, Q. Determining the start of the growing season from MODIS data in the Indian Monsoon Region: Identifying available data in the rainy season and modeling the varied vegetation growth trajectories. Remote Sens. 2018, 10, 122. [Google Scholar] [CrossRef] [Green Version]
- Jones, M.O.; Kimball, J.S.; Jones, L.A.; McDonald, K.C. Satellite passive microwave detection of North America start of season. Remote Sens. Environ. 2012, 123, 324–333. [Google Scholar] [CrossRef]
- Hmimina, G.; Dufrêne, E.; Pontailler, J.Y.; Delpierre, N.; Aubinet, M.; Caquet, B.; de Grandcourt, A.; Burban, B.; Flechard, C.; Granier, A.; et al. Evaluation of the potential of MODIS satellite data to predict vegetation phenology in different biomes: An investigation using ground-based NDVI measurements. Remote Sens. Environ. 2013, 132, 145–158. [Google Scholar] [CrossRef]


| S. No | Data | Spatial Resolution | Time Period | Source |
|---|---|---|---|---|
| 01 | MOD13Q1 | 250 | 2000–2019 | https://lpdaacsvc.cr.usgs.gov/appeears/ (accessed on 20 May 2020) |
| 02 | MCD12Q1 | 500 | 2019 | https://lpdaacsvc.cr.usgs.gov/appeears/ (accessed on 20 May 2020) |
| 03 | Rainfall data | 2000–2019 | http://www.pmd.gov.pk/ (accessed on 12 August 2020) | |
| 04 | Temperature data | 2000–2019 | http://www.pmd.gov.pk/ (accessed on 12 August 2020) |
| Vegetation Indices | Data Source | Formula | References |
|---|---|---|---|
| NDVI | https://lpdaacsvc.cr.usgs.gov/appeears/ (accessed on 20 May 2020) | [21,46,47] | |
| SAVI | https://lpdaacsvc.cr.usgs.gov/appeears/ (accessed on 20 May 2020) | [48,49] | |
| EVI | https://lpdaacsvc.cr.usgs.gov/appeears/ (accessed on 20 May 2020) | [19] |
| Metric | Definition |
|---|---|
| Start of the season | Time for which the left edge has increased to 30% of the seasonal amplitude measured from the left minimum level. |
| End of the season | Time for which the right edge has decreased to 30% of the seasonal amplitude measured from the right minimum level. |
| Percentage | NDVI | EVI | SAVI |
|---|---|---|---|
| 0–10% | 7.03 | 3.82 | 6.95 |
| 10–20% | 18.53 | 30.23 | 17.85 |
| 20–30% | 13.54 | 28.23 | 15.02 |
| 30–40% | 19.29 | 23.44 | 17.65 |
| >40% | 41.61 | 14.28 | 42.53 |
| S. No | Vegetation Classes | ||||||||||||
|---|---|---|---|---|---|---|---|---|---|---|---|---|---|
| Mean | SD | Mean | SD | Mean | SD | Mean | SD | Mean | SD | Mean | SD | ||
| 1 | Grassland | 120.3 | 33.4 | 116.9 | 28.3 | 118.4 | 29.5 | 293.8 | 28.7 | 313.4 | 27.8 | 290.2 | 40.7 |
| 2 | Evergreen Broadleaf Forests | 115.9 | 27.3 | 113.5 | 26.9 | 116.9 | 27.8 | 29.5 | 26.8 | 306.2 | 26.9 | 288.3 | 33.5 |
| 3 | Evergreen Needleleaf Forests | 116.5 | 28.3 | 111.2 | 23.5 | 111.9 | 22.3 | 286.4 | 23.4 | 308.9 | 27.7 | 280.3 | 27.2 |
| 4 | Shrublands | 140.3 | 26.8 | 133.8 | 22.9 | 135.8 | 23.5 | 310.3 | 27.9 | 330.5 | 27.8 | 307.5 | 34.8 |
| 5 | Cropland | 138.3 | 22.3 | 133.3 | 23.6 | 132.6 | 21.5 | 308.7 | 19.3 | 314.5 | 18.2 | 302.3 | 20.3 |
| 6 | Savanna | 123.3 | 33.2 | 121.5 | 18.3 | 121.5 | 17.4 | 302.3 | 15.6 | 309.5 | 15.2 | 299.5 | 39.5 |
| 7 | Mixed Forests | 126.3 | 17.9 | 121.3 | 14.3 | 118.3 | 12.3 | 299.7 | 16.9 | 315.3 | 14.4 | 286.5 | 26.2 |
Publisher’s Note: MDPI stays neutral with regard to jurisdictional claims in published maps and institutional affiliations. |
© 2021 by the authors. Licensee MDPI, Basel, Switzerland. This article is an open access article distributed under the terms and conditions of the Creative Commons Attribution (CC BY) license (https://creativecommons.org/licenses/by/4.0/).
Share and Cite
Hu, P.; Sharifi, A.; Tahir, M.N.; Tariq, A.; Zhang, L.; Mumtaz, F.; Shah, S.H.I.A. Evaluation of Vegetation Indices and Phenological Metrics Using Time-Series MODIS Data for Monitoring Vegetation Change in Punjab, Pakistan. Water 2021, 13, 2550. https://doi.org/10.3390/w13182550
Hu P, Sharifi A, Tahir MN, Tariq A, Zhang L, Mumtaz F, Shah SHIA. Evaluation of Vegetation Indices and Phenological Metrics Using Time-Series MODIS Data for Monitoring Vegetation Change in Punjab, Pakistan. Water. 2021; 13(18):2550. https://doi.org/10.3390/w13182550
Chicago/Turabian StyleHu, Pingbo, Alireza Sharifi, Muhammad Naveed Tahir, Aqil Tariq, Lili Zhang, Faisal Mumtaz, and Syed Hassan Iqbal Ahmad Shah. 2021. "Evaluation of Vegetation Indices and Phenological Metrics Using Time-Series MODIS Data for Monitoring Vegetation Change in Punjab, Pakistan" Water 13, no. 18: 2550. https://doi.org/10.3390/w13182550
APA StyleHu, P., Sharifi, A., Tahir, M. N., Tariq, A., Zhang, L., Mumtaz, F., & Shah, S. H. I. A. (2021). Evaluation of Vegetation Indices and Phenological Metrics Using Time-Series MODIS Data for Monitoring Vegetation Change in Punjab, Pakistan. Water, 13(18), 2550. https://doi.org/10.3390/w13182550