2.1. Environmental Settings and Data Availability
Mongolia is a landlocked territory covering about 1.6 million km
2, located in the heart of the Asian continent. Mongolia has borders with the Russian Federation in the north (3543 km long) and China in the south (4709 km) [
17]. Mongolia lies on a high plateau surrounded by mountain ridges in the transition zone between the Siberian taiga and the dry steppes and semi-deserts of central Asia. The country has a dry subarctic continental climate with long cold winters and short hot summers.
The average number of rainy days per year is 105–115. Annual average precipitation (
P) is generally low decreasing from the north (350–500 mm) to the south (less than 50 mm) [
17]. Maximum (almost 85%) seasonal
P occurs in summer [
8]. The average annual temperature ranges from −8 °C to +2 °C and is negative from October to March in most parts of the country [
17].
In this territory, 80% is pasture-land, 10% forest, 1% farmland, and 9% other types of land. Steppe vegetation is the most common in Mongolia and occupies about 83% of the territory [
18]. It lies mainly in the central part of the country, the transitional zone bordering the Gobi Desert to the south, and mountain taiga to the north. The steppe ecosystems are associated with the semi-arid and arid continental temperate climates of the region and are ecologically fragile and sensitive to climate change and anthropogenic disturbances [
19]. Perennial plants (50–90%) dominate the Mongolian steppe. The highest percentage of perennial plants occurs in the high-cold steppe. In contrast, the percentage of shrub, dwarf shrub, biennials, and annuals is minimum in the high-cold steppe and gradually increases in the desert steppe [
18]. About half of the Mongolian territory is mountainous with an average elevation of 1580 m a.s.l.; about 81% of its territory is above 1000 m and 19% below 1000 m [
17]. These mountains are divided into cool and dry types according to their formation of vertical vegetation range. Khentii, Khuvsgul, northwestern Mongolian Altai, Northern Khangai, and Khyangan are referred to as cool type mountains and comprise steppe vegetation. Southern Altai, Gobi Altai, Gobi, and Zuungar mountains are referred to as dry type with desert vegetation and high-cold steppe [
18].
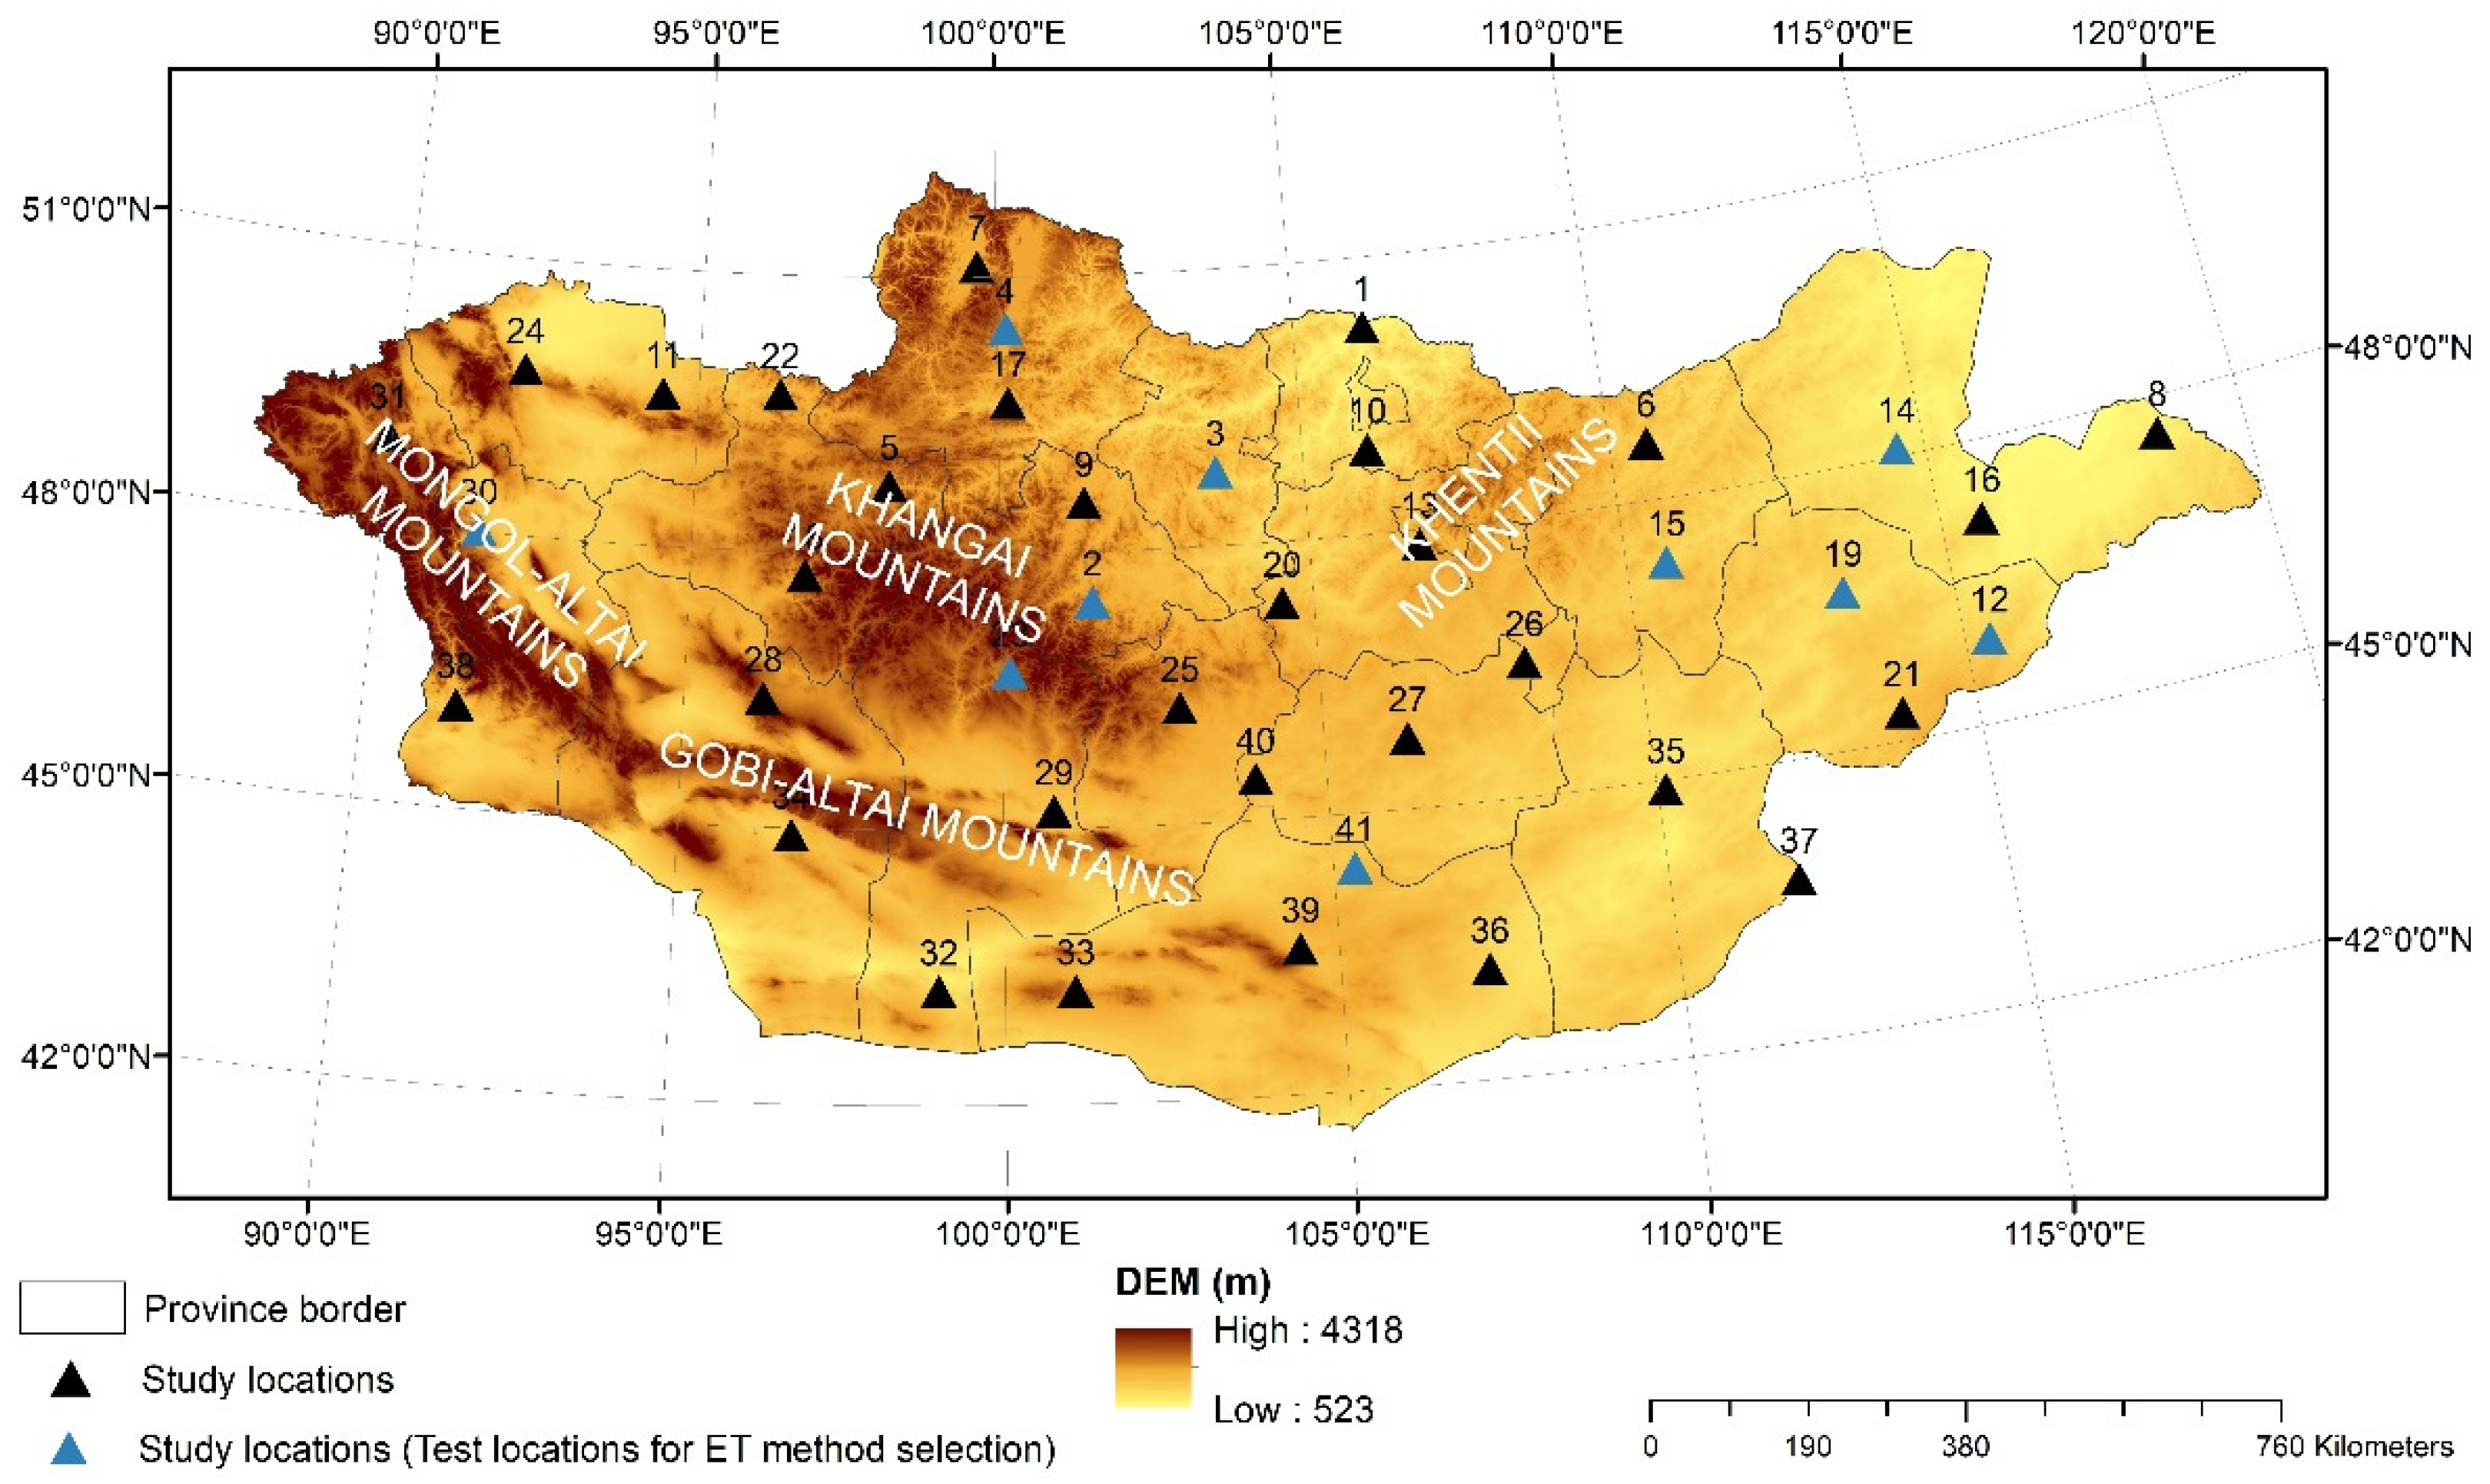
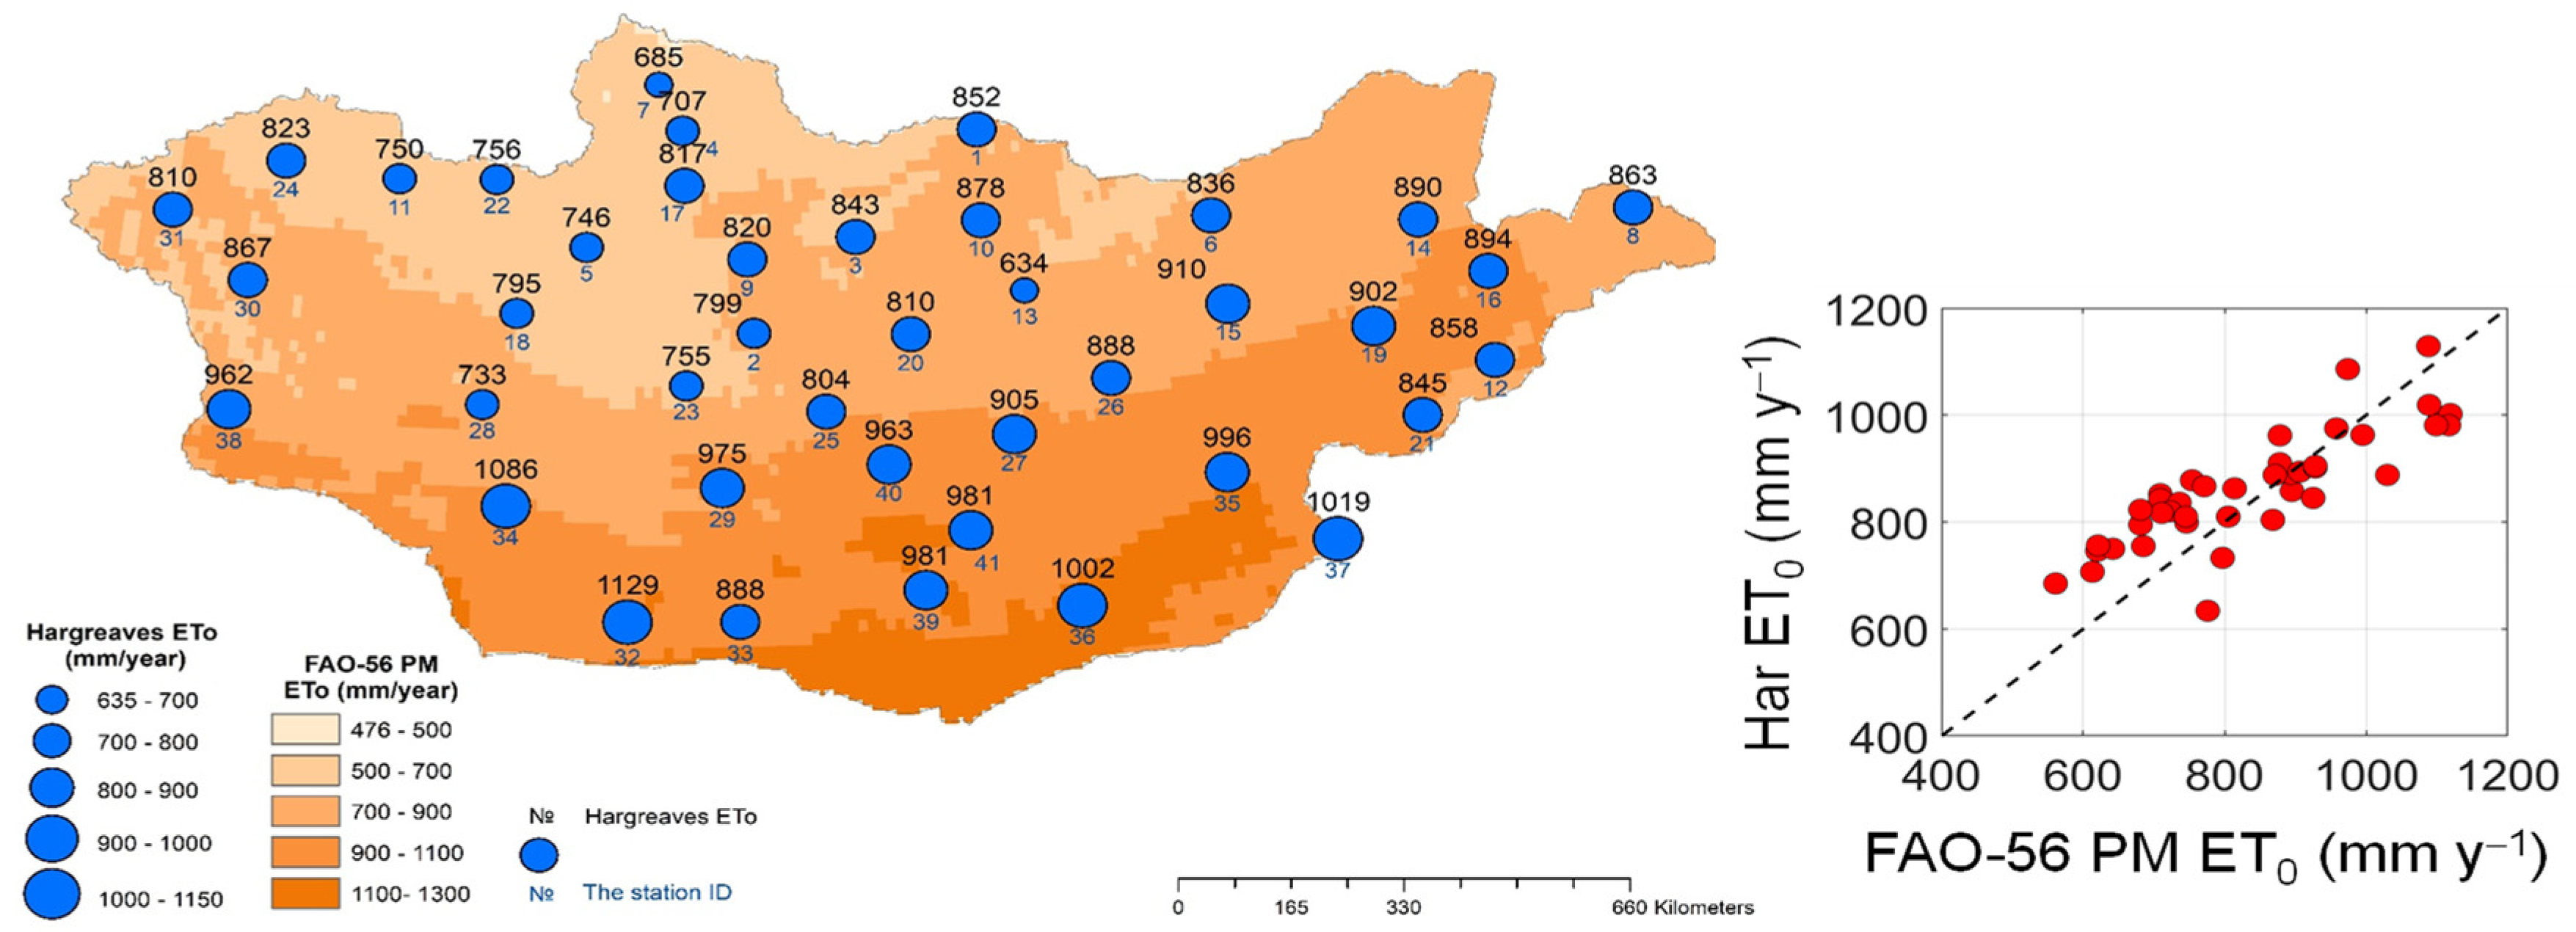
We identified a total of 41 locations relatively uniformly distributed across Mongolia with available weather data (
Figure 1). We specified that ten weather stations (blue triangles in
Figure 1) had a complete set of weather data, while the remaining 31 stations (black triangles) provided only
T and
P data. The study locations were chosen considering the density, physical geography, latitude and altitude, land use, climate class, and data availability.
The complete data set belonging to the ten weather stations will be exploited for estimating daily
ET0 with the FAO-56 PM equation and temperature-based equations (
Section 2.2.).
Table 1 shows information on data sources used in this study for all 41 study locations.
Daily
P data were retrieved from the National Agency of Meteorology and Environmental Monitoring (NAMEM) [
21].
T data at Khatgal weather station were validated with those obtained from the National Oceanic and Atmospheric Administration (NOAA) website [
22]. This comparison shows high correlation between remote-sensing and ground-truthing data (available in
Figure S1 in Supplemental Materials). Since the ground-based leaf area index (
LAI) measurements are highly variable in space and time, the estimates from the remotely sensed products were assumed valid and reliable and were not validated with ground-truth measurements [
24]. The
LAI monthly mean values were obtained from the Oak Ridge National Laboratory Distributed Active Archive Center (ORNL DAAC) website [
23] providing a global 0.25° × 0.25° gridded monthly mean
LAI over the period from August 1981 to August 2015. The data were derived from the Advanced Very High-Resolution Radiometer (AVHRR) Global Inventory Modeling and Mapping Studies (GIMMS), and the bi-weekly
LAI values were averaged for every month (
Figure S2 in Supplemental Materials). Due to the low vegetation cover, the
LAI in some parts of the Gobi Desert is unavailable. The inverse distance weighted interpolation tool was used in ArcGIS software (Esri, West Redlands, CA, USA) to estimate the weighted average of the
LAI values in the neighborhood of each processing cell. As it follows from the name, this method uses the inverse distance to each point when assigning weights. The monthly average values of
LAI extracted from the map at study locations are available (
Figure S3 in Supplemental Materials).
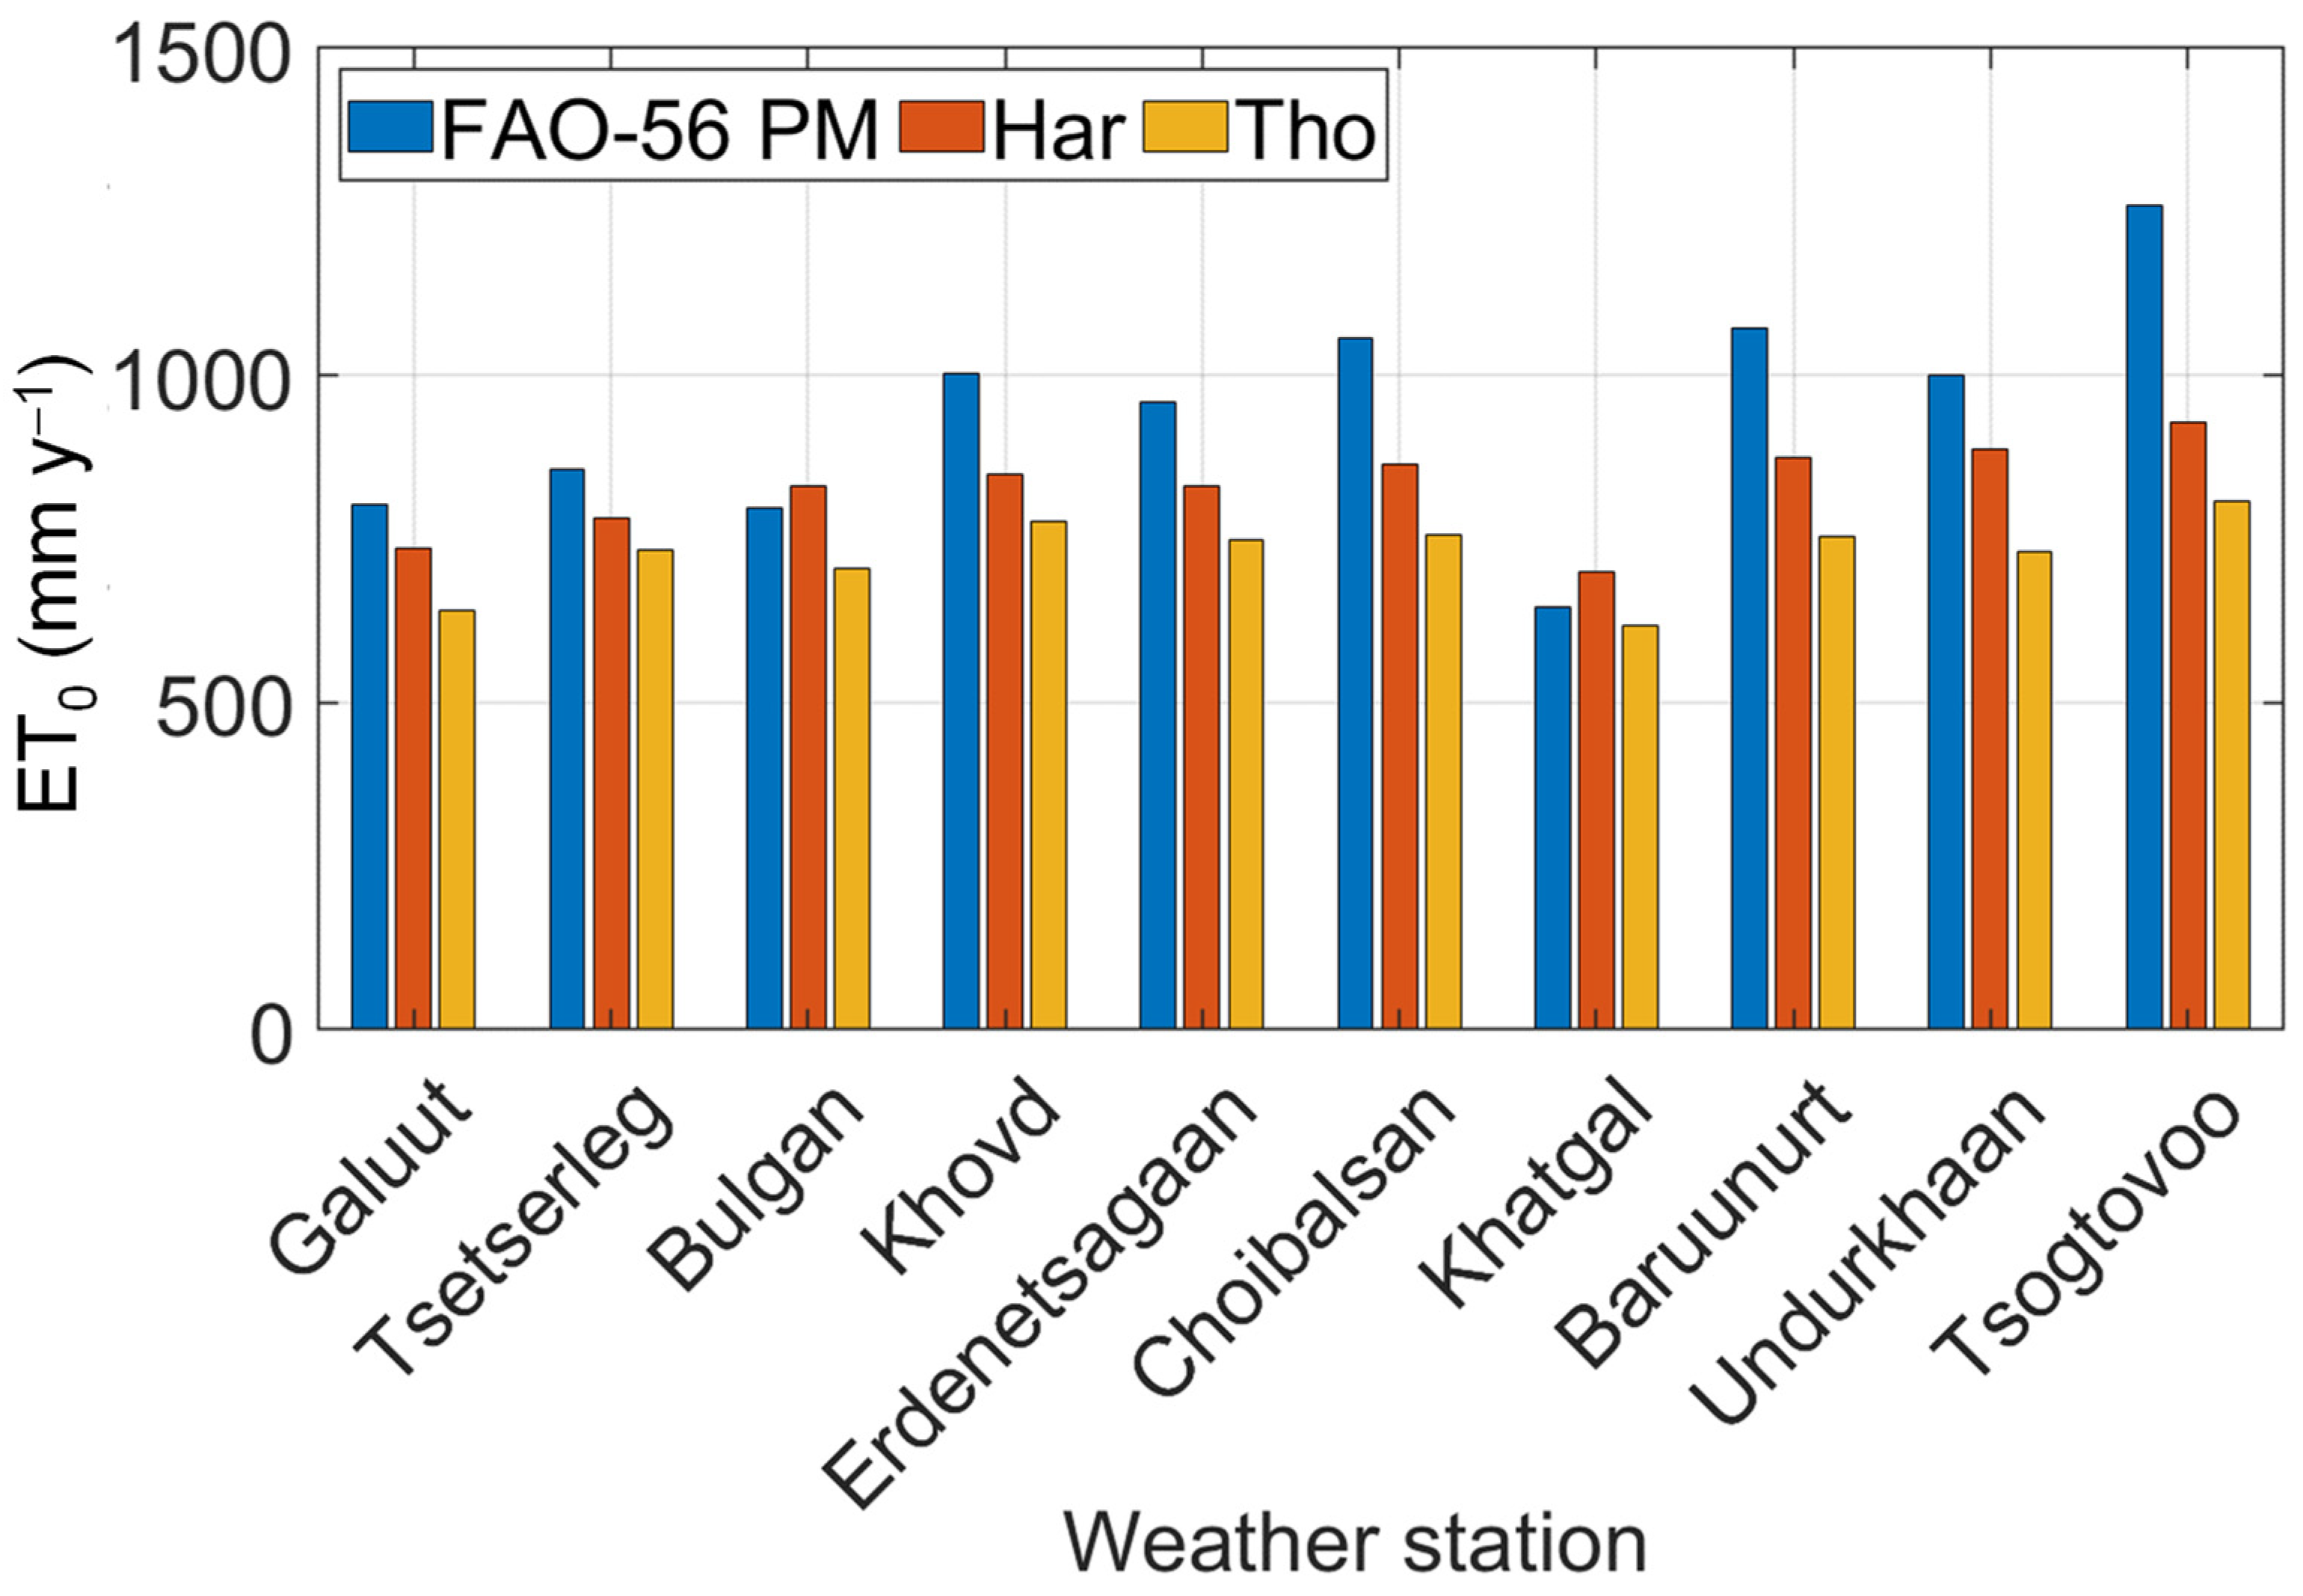
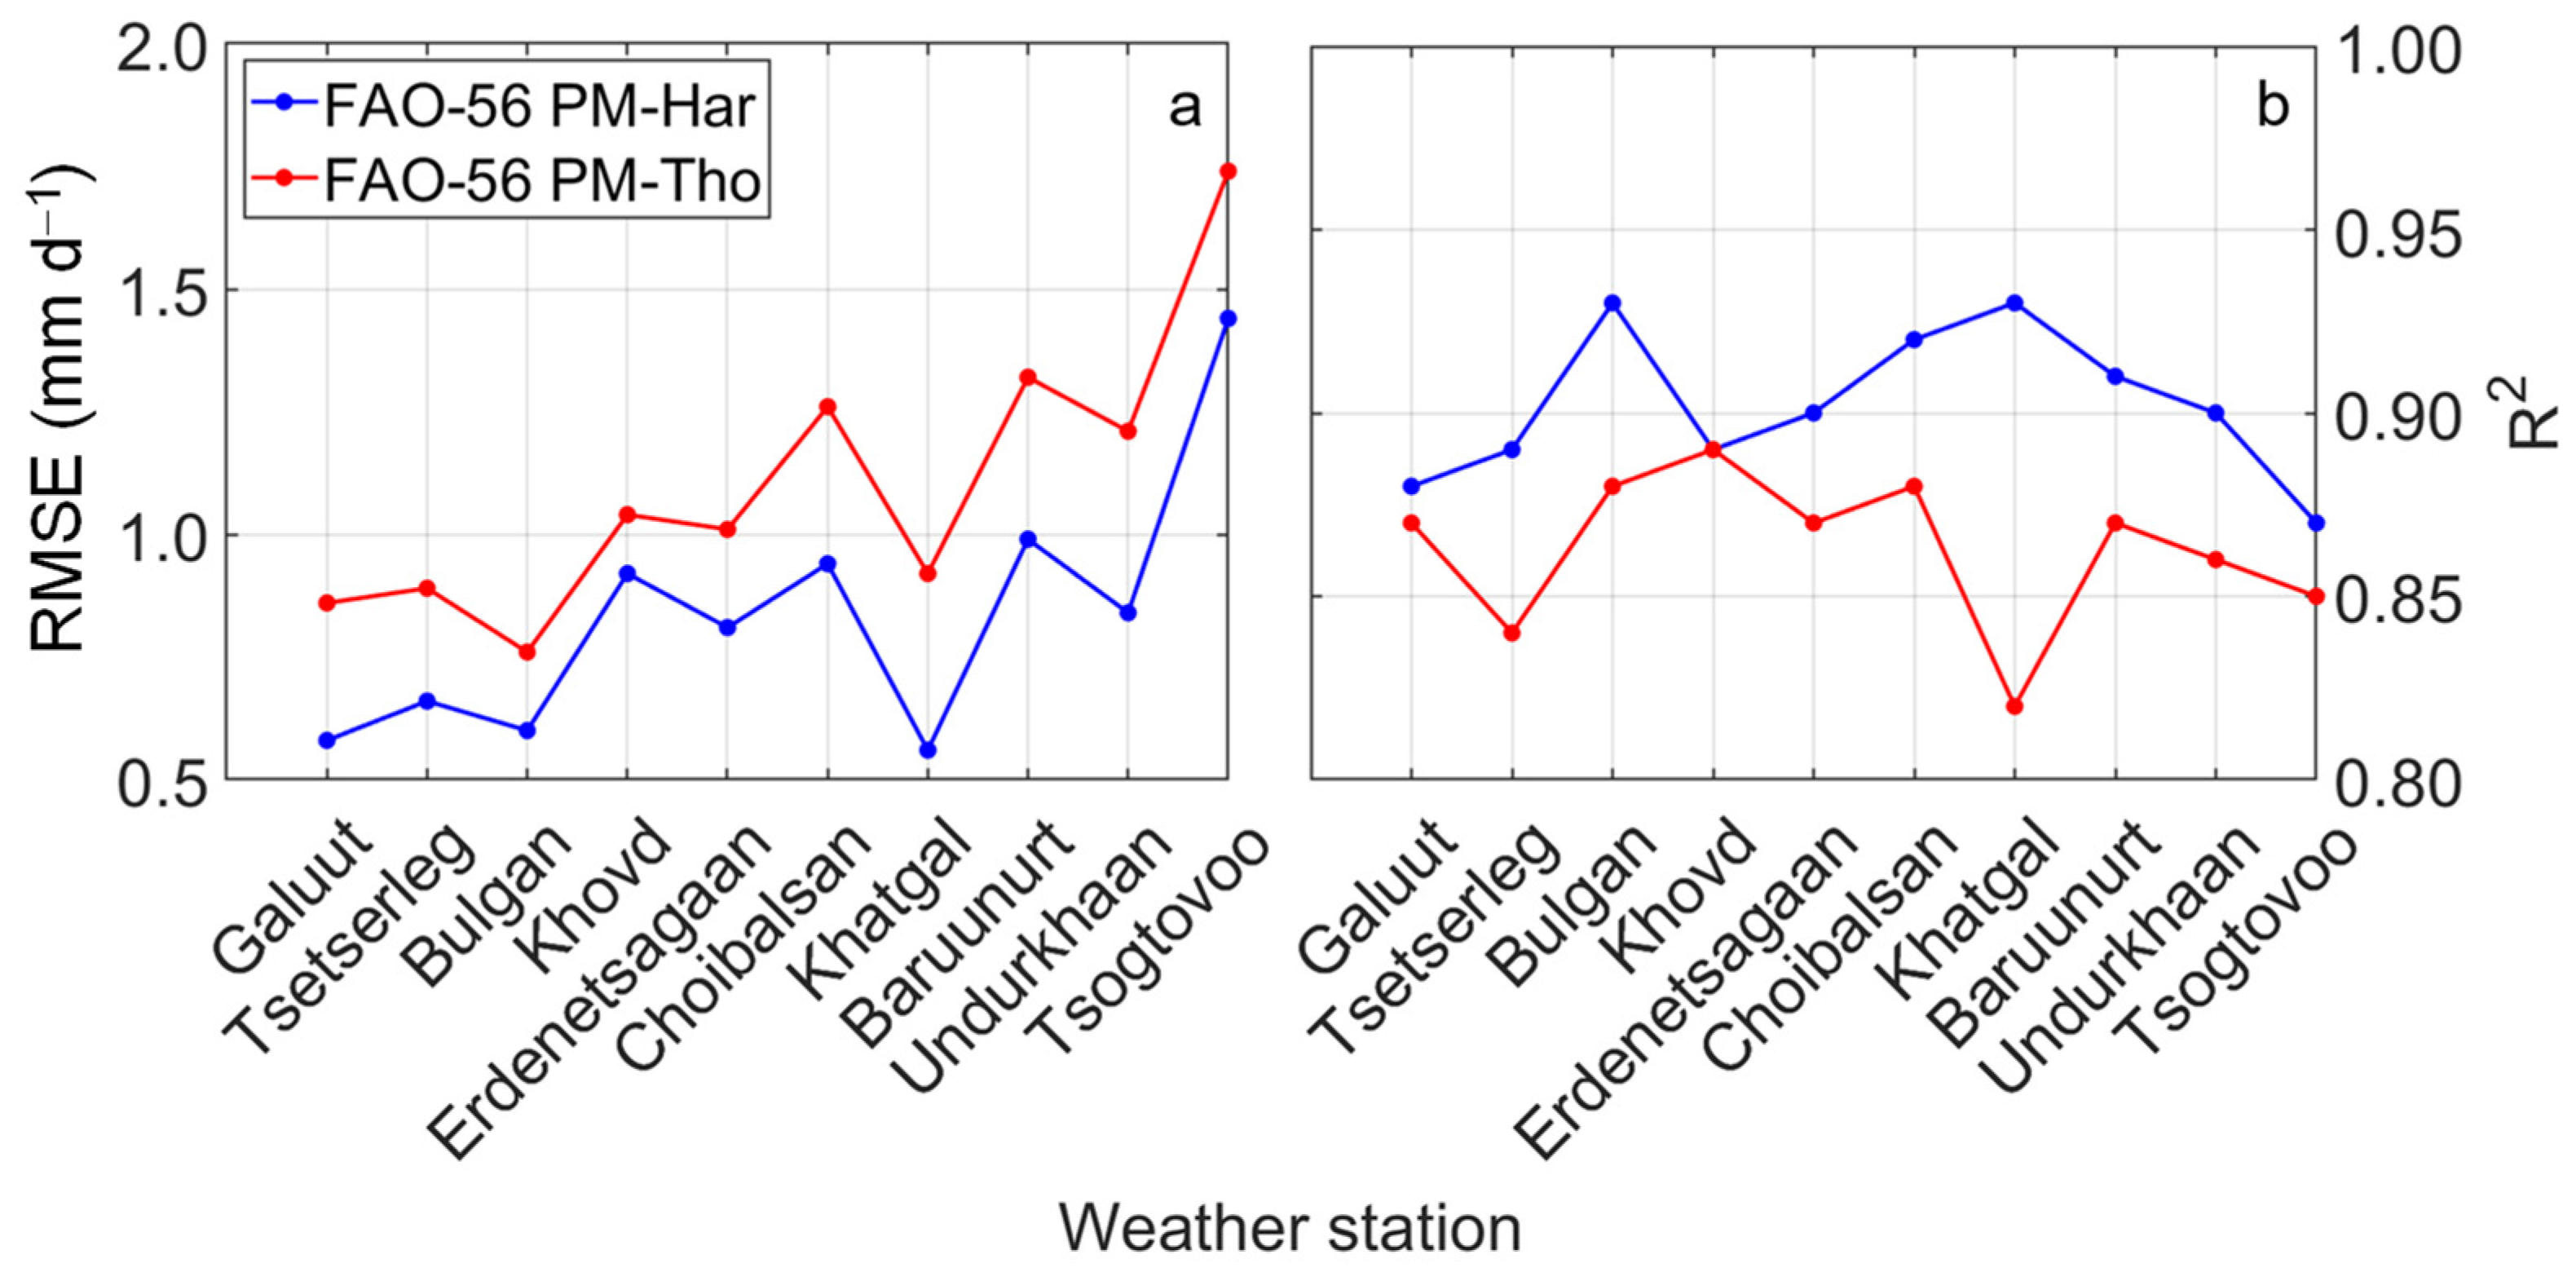
2.2. Prediction of Reference Evapotranspiration, ET0, and Biome-Specific Potential Evapotranspiration, ETp
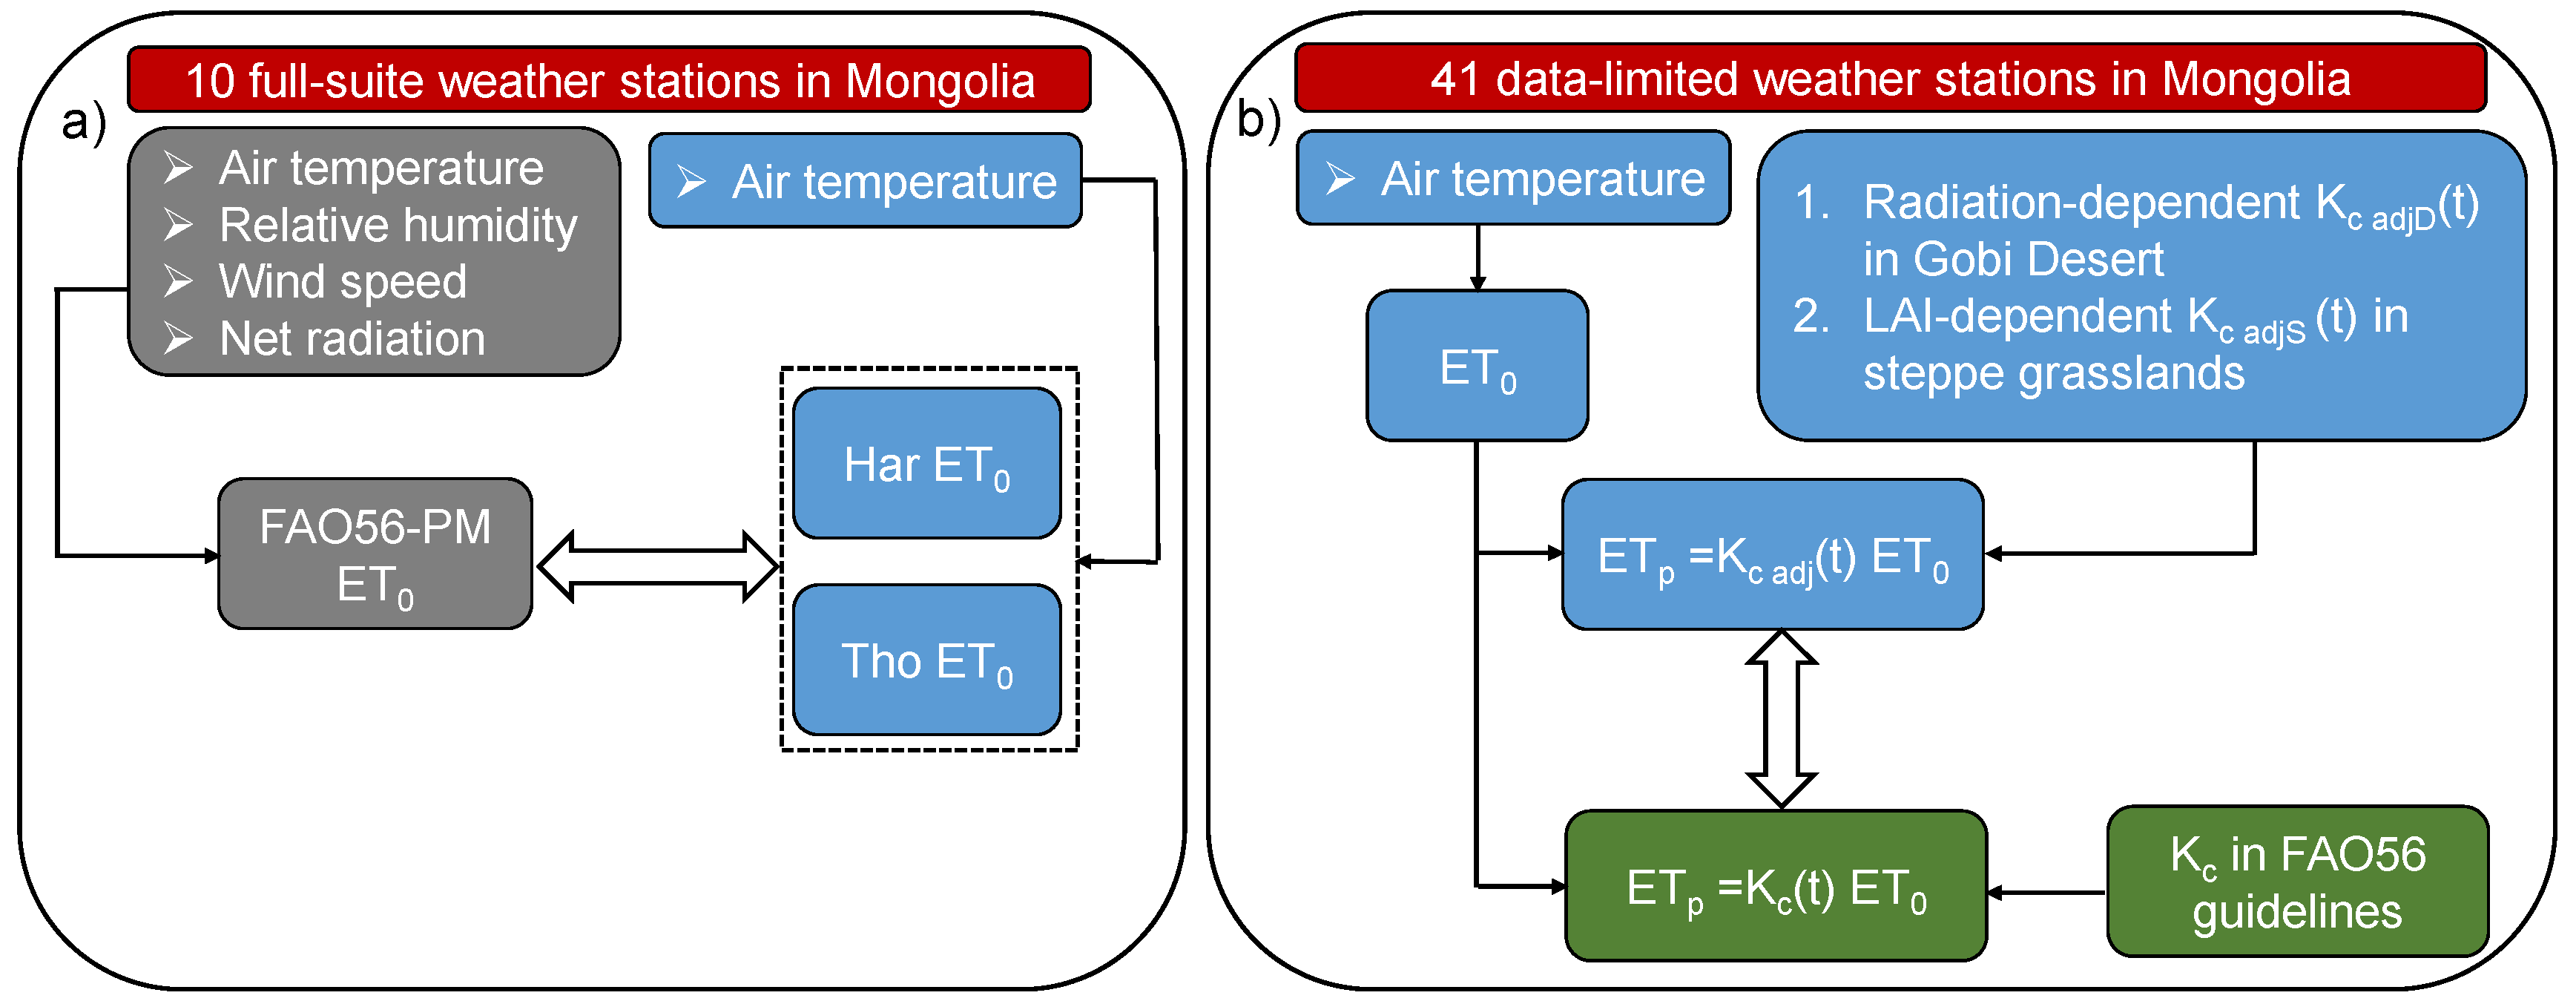
We considered two well-known limited-data-requirement equations to predict
ET0, namely, Hargreaves (Har) [
25] and Thornthwaite (Tho) [
26,
27]. We evaluated the prediction performance of Har and Tho equations by comparing these two methods with the FAO-56 PM equation by using a complete meteorological dataset at 10 weather stations [
28,
29,
30] and selected the best performing temperature method to estimate
ET0 (
Figure 2a).
The equations are reported in
Table 2, and we briefly report necessary input data for each equation. In the FAO-56 PM equation,
Rn is net radiation at plant surface (MJ m
−2 d
−1),
G is the soil heat flux density (MJ m
−2 d
−1),
T is air temperature (°C),
u2 is the wind speed at 2 m height above ground (m s
−1),
es and
ea are saturated and actual vapor pressures (kPa), Δ is the slope of the vapor pressure curve (kPa °C
−1), and
γ is the psychometric constant (kPa °C
−1). Net radiation is usually indirectly measured by a pyranometer. If a weather station lacks pyranometer data,
Rn can be estimated from the actual daily duration of bright sunshine (hours per day) [
2]. The term
G is computed as a fraction of
Rn, as suggested by [
2] for the reference crop. In the Har equation,
Ra is the extraterrestrial radiation expressed in mm d
−1 (obtained by multiplying MJ m
−2 d
−1 by 0.408),
Tm (°C),
Tmin (°C), and
Tmax (°C) represent mean, minimum, and maximum temperature, respectively. In the Tho equation, the value
I represents the annual heat index,
Tm represents
i-th month mean air temperature (°C), and
h depicts hours of sunlight (hours).
The daily maximum, minimum, mean temperature, relative humidity, and wind speed data were obtained from NAMEM [
21]. The hours of sunlight data were downloaded at the nearest available station [
31]. The terms
Ra and
Rn were indirectly estimated from the guidelines on missing climatic data from the FAO-56 report [
2].
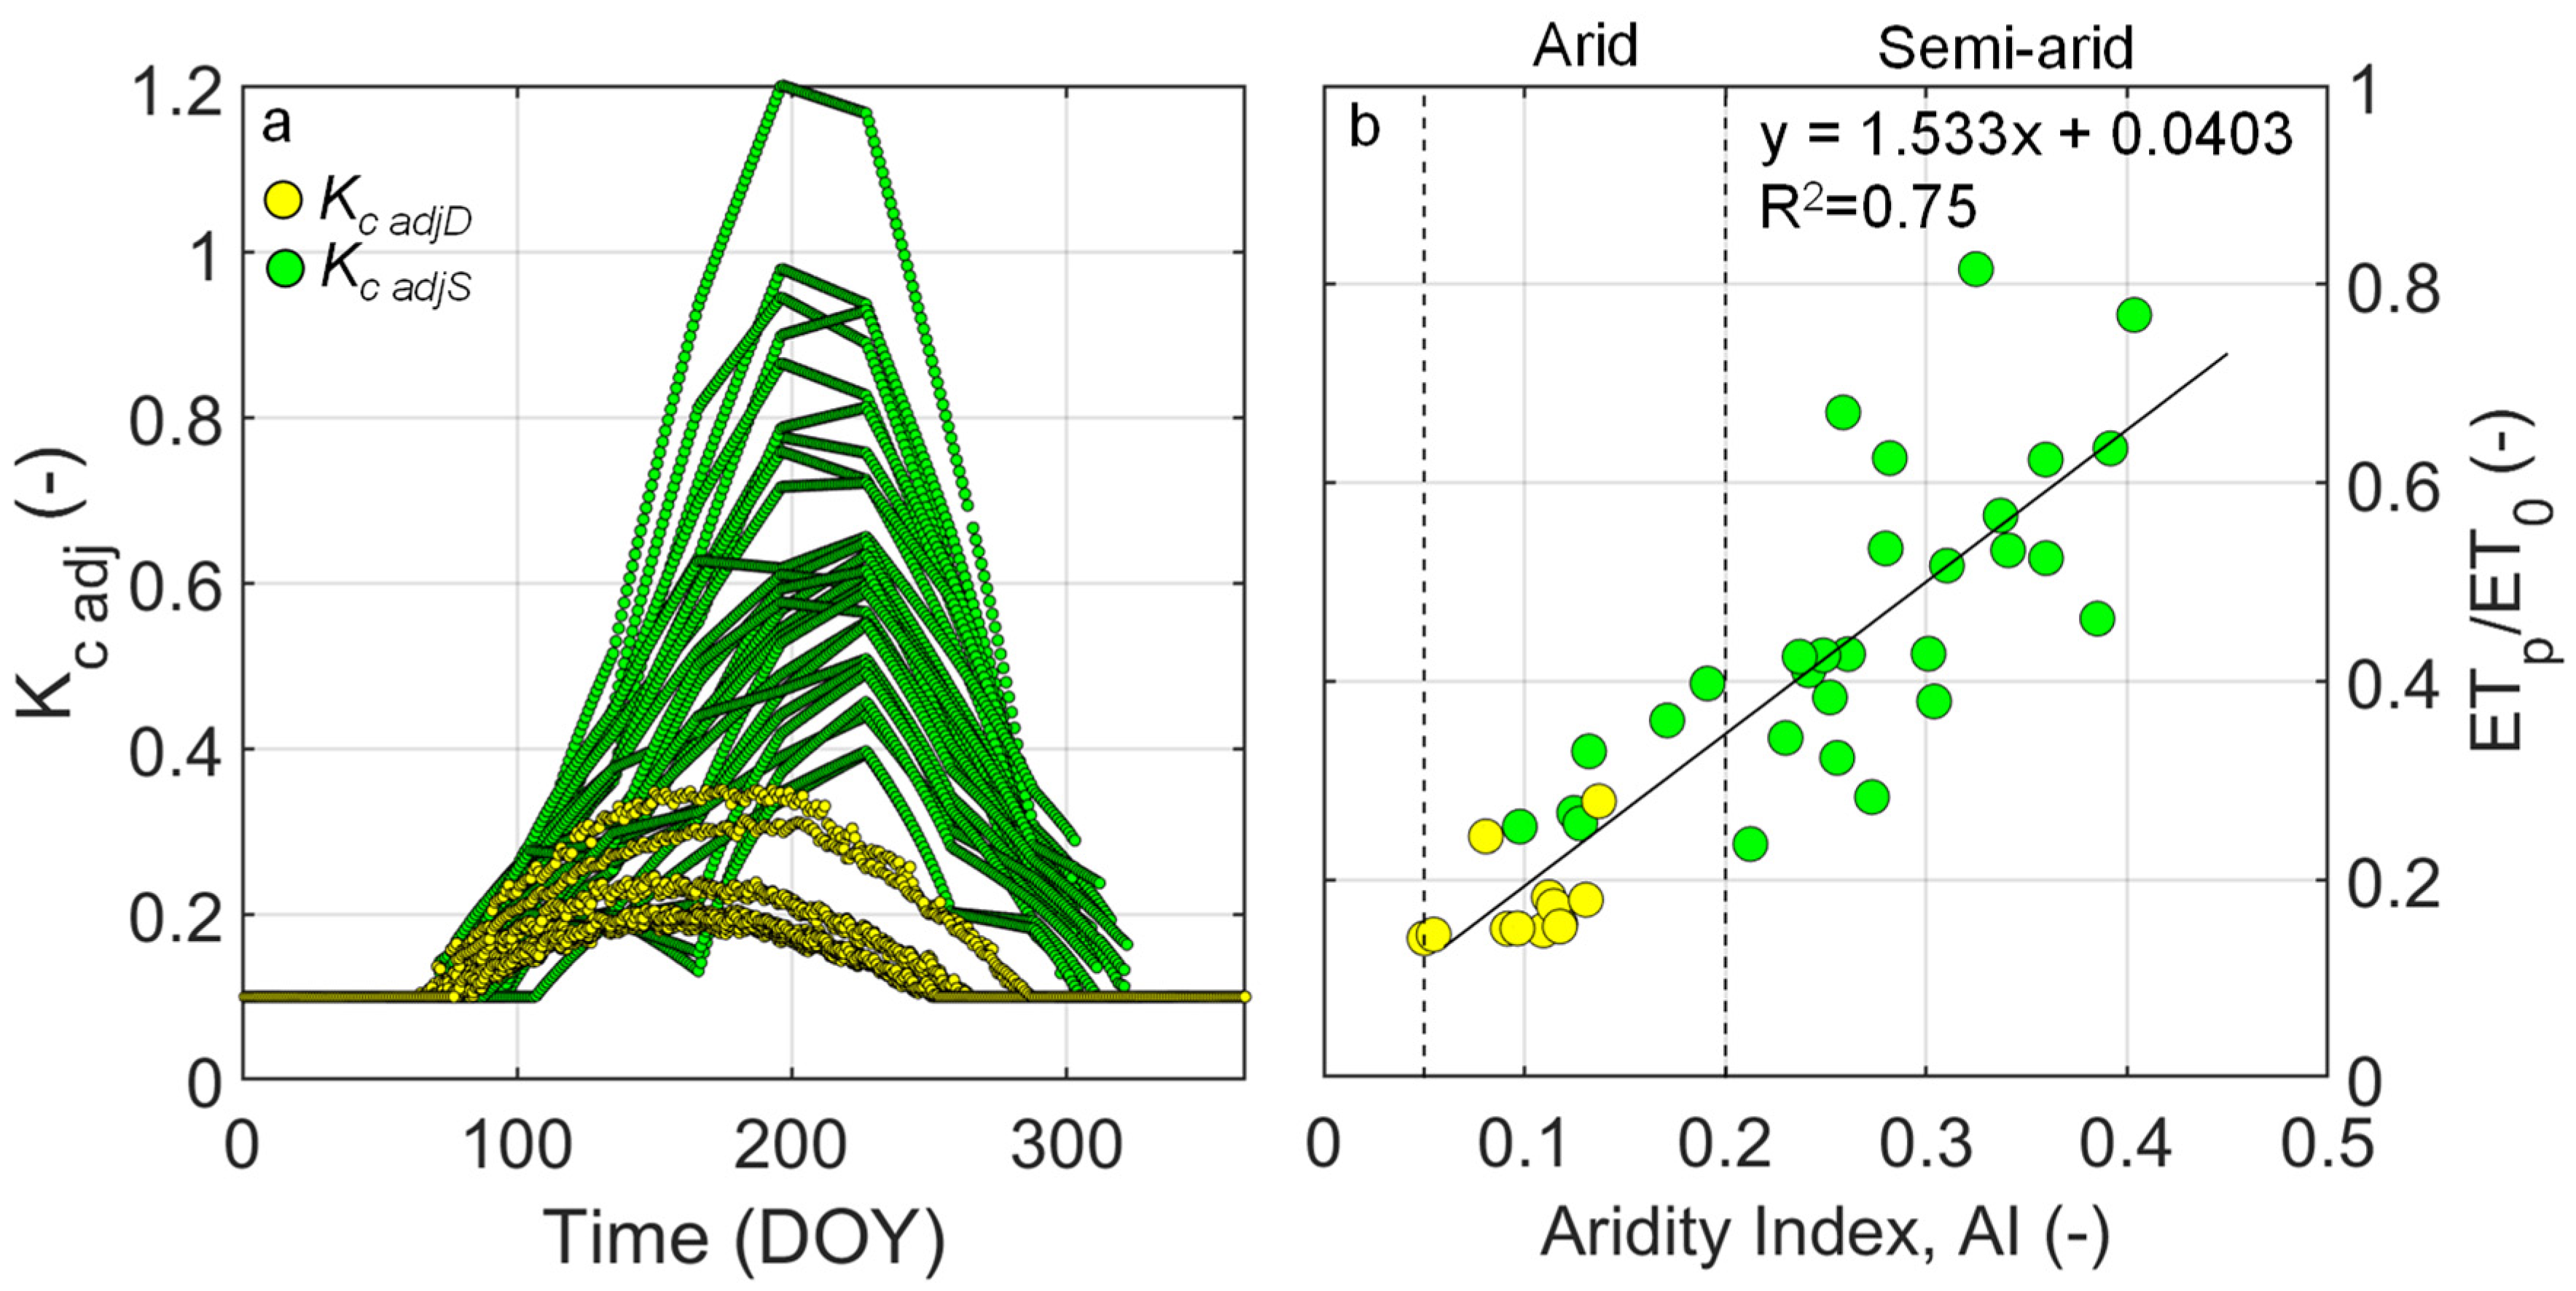
The FAO-based aridity index (
AI) is computed as the ratio between mean annual
P and
ET0 [
32] and will be used in our study. This index can be considered a proper indicator for climate classification in Mongolia.
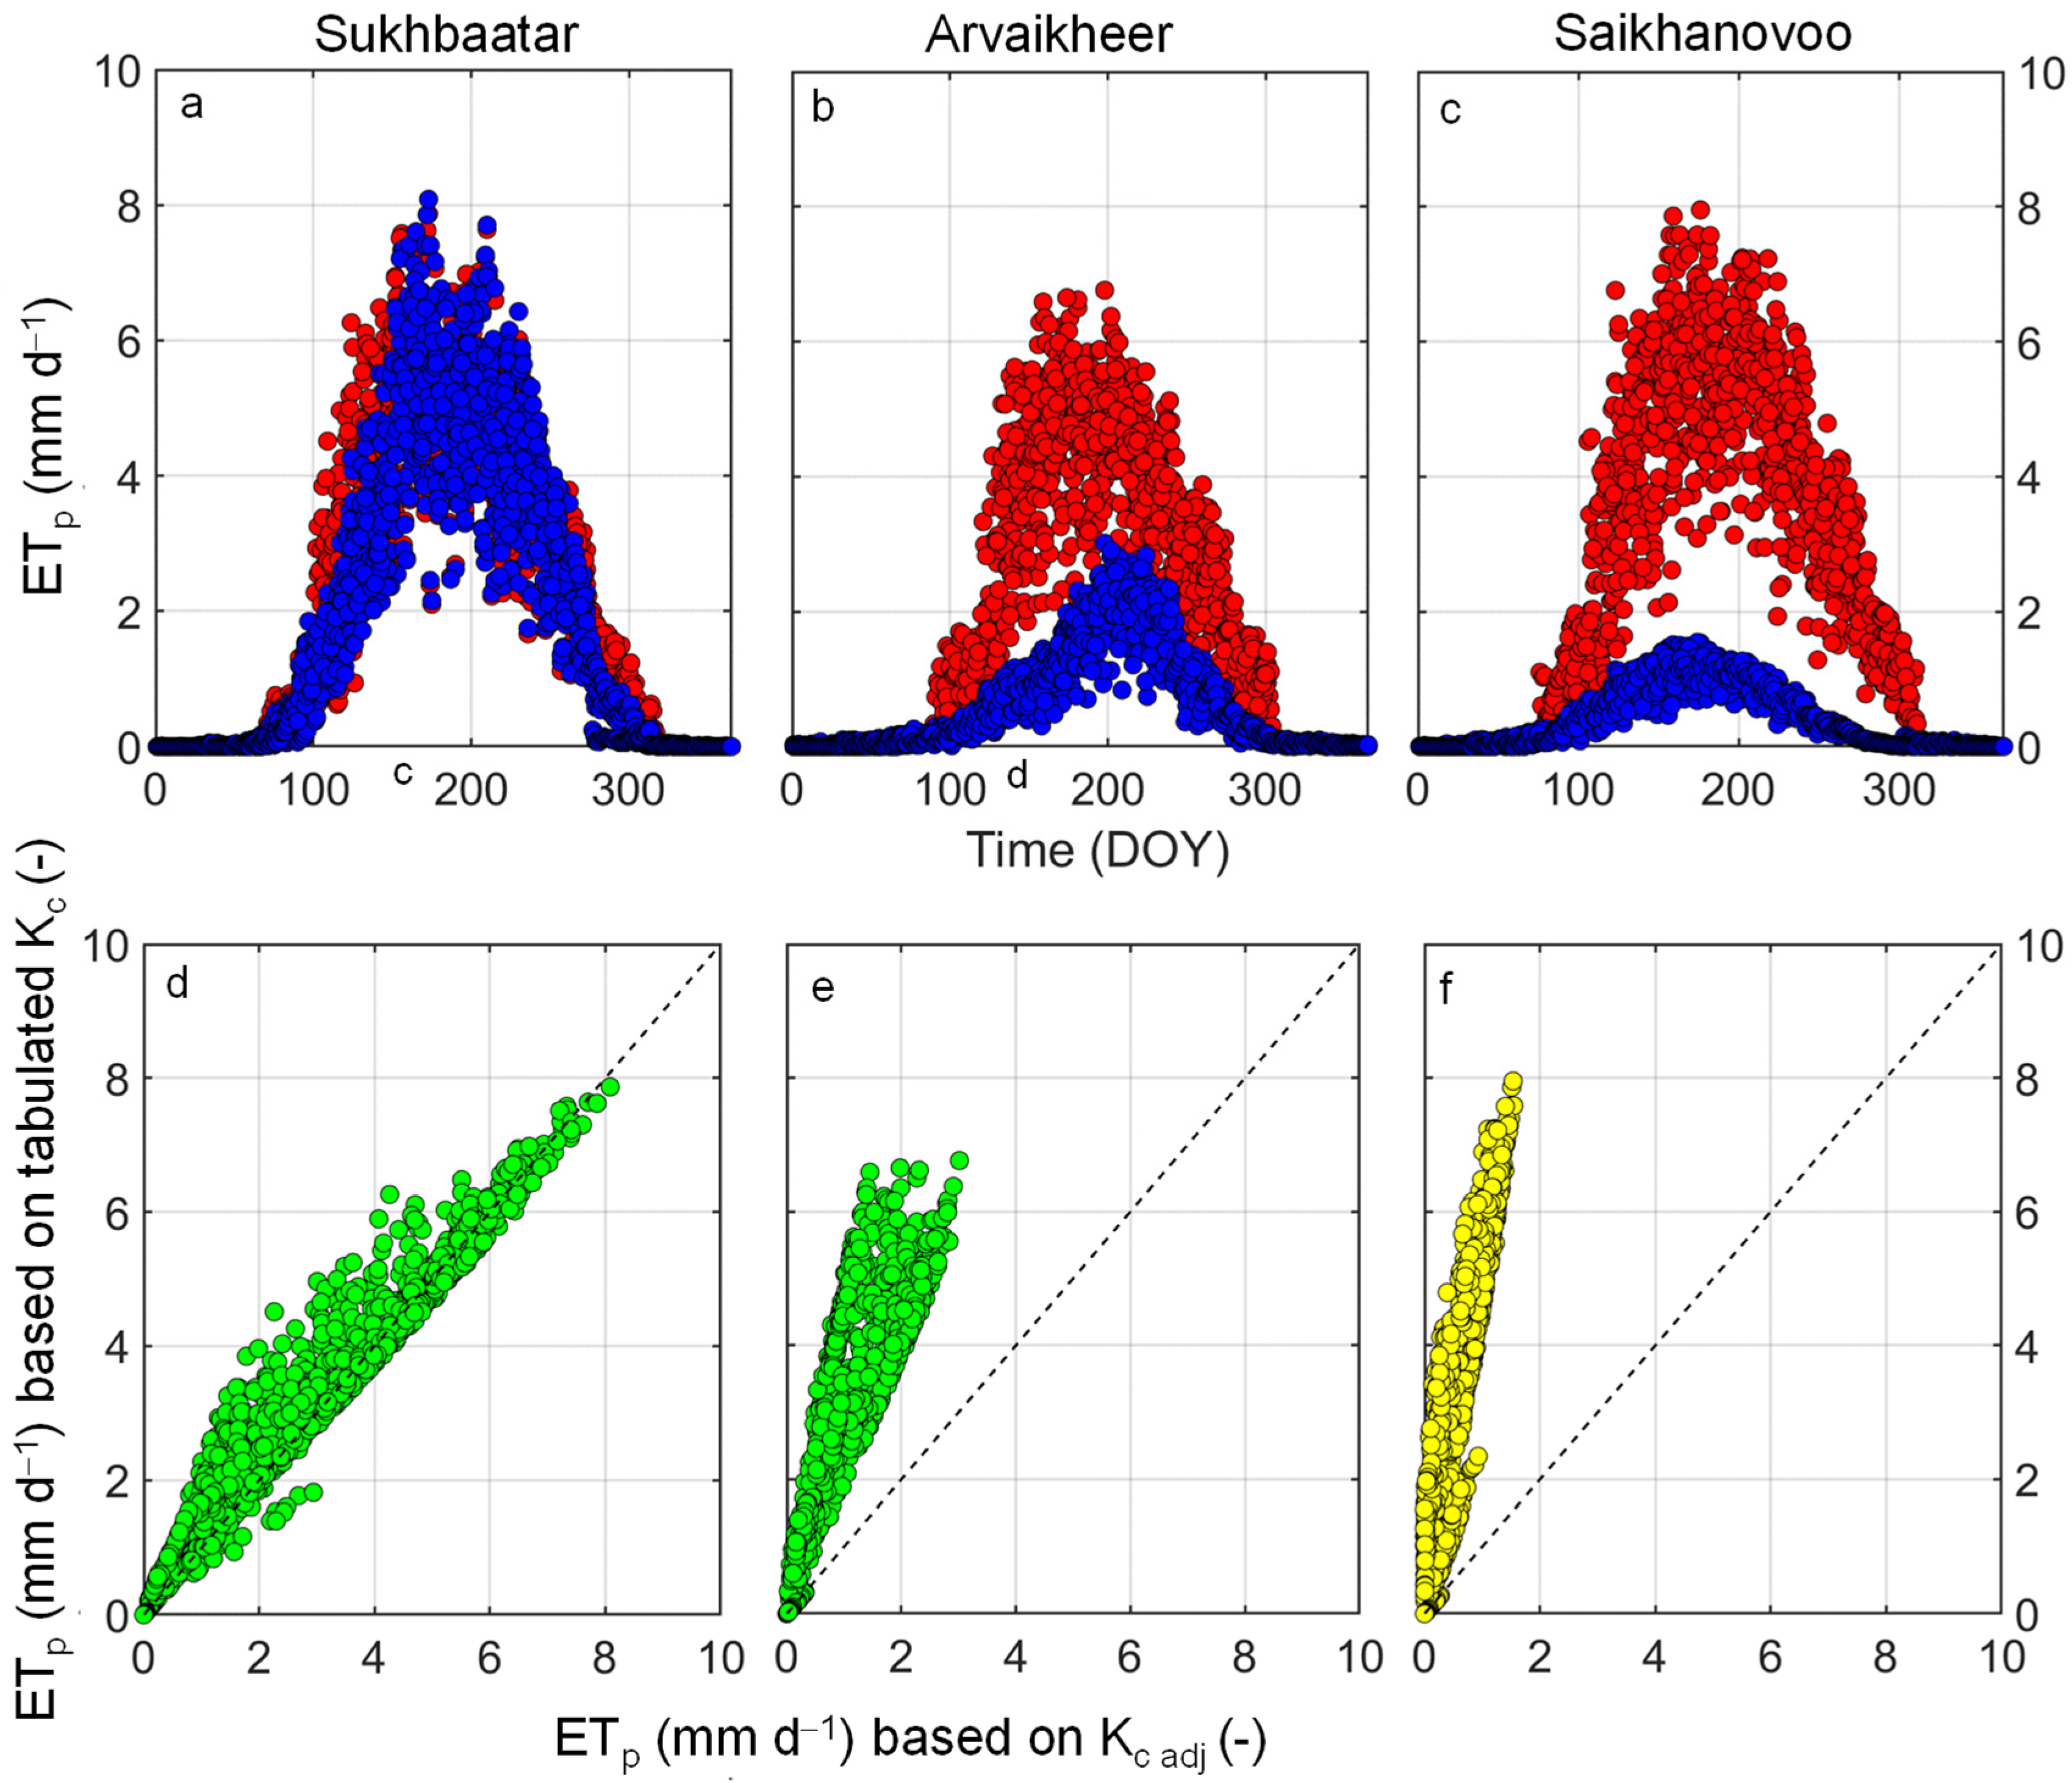
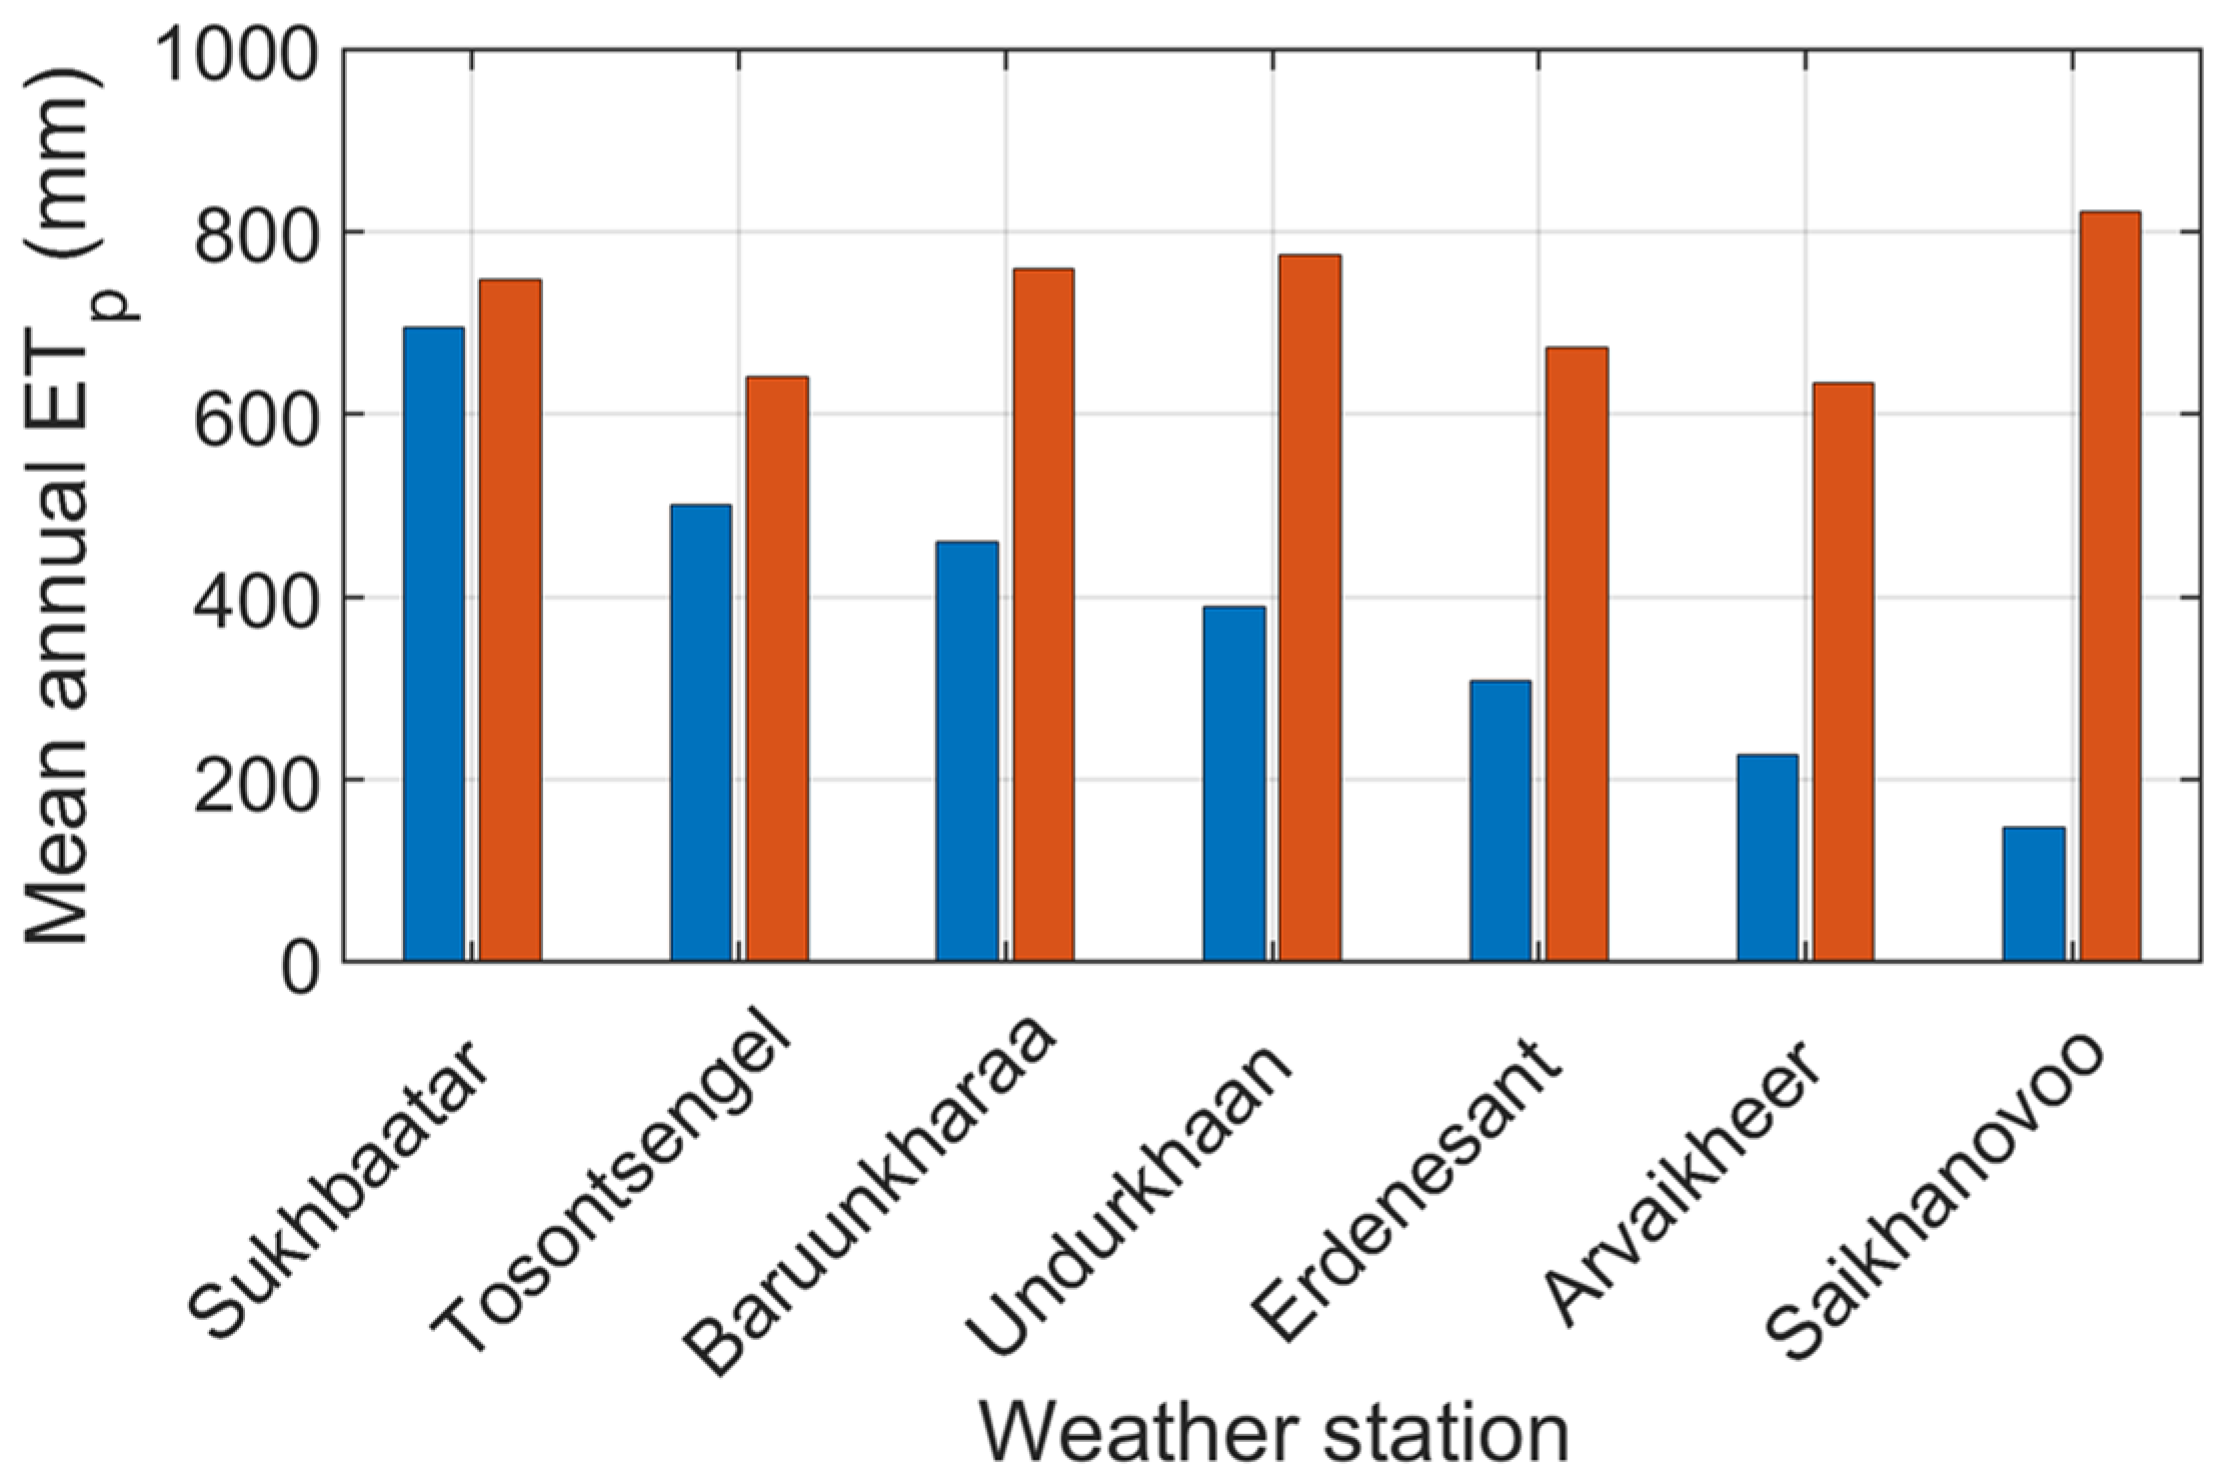
After selecting the best temperature model, daily
ET0 was calculated in all 41 study locations with easily accessible data. The crop coefficient considers plant characteristics, such as height, leaf area index, and leaf and stomata properties in order to convert the reference grass
ET0 into
ETp. These plant characteristics indeed influence the aerodynamic resistance, the albedo of crop-soil surface, and canopy resistance. The FAO-56 guidelines report [
2] tabulated
Kc values for crops, vegetables, forages, and fruit trees referring to a sub-humid climate with an average daytime minimum relative humidity of about 45% and with wind speeds averaging 2 m s
−1. These tabulated
Kc values under the abovementioned climatic conditions are not present in Mongolia. A study carried out in neighboring parts of Inner Mongolia [
12] across the border demonstrates that a developed
Kc for steppe in the arid and semi-arid zone is lower than the available
Kc value (grazing pasture) taken from the FAO-56 guidelines [
2]. The natural vegetation conditions in those climate zones have not been studied in-depth, unlike agricultural crops. Permanent monitoring stations are absent, and the exact vegetation condition in those arid, semi-arid areas is mostly unknown. Therefore, the use of guidelines to develop
Kc from FAO-56 report [
2] is fraught with uncertainties.
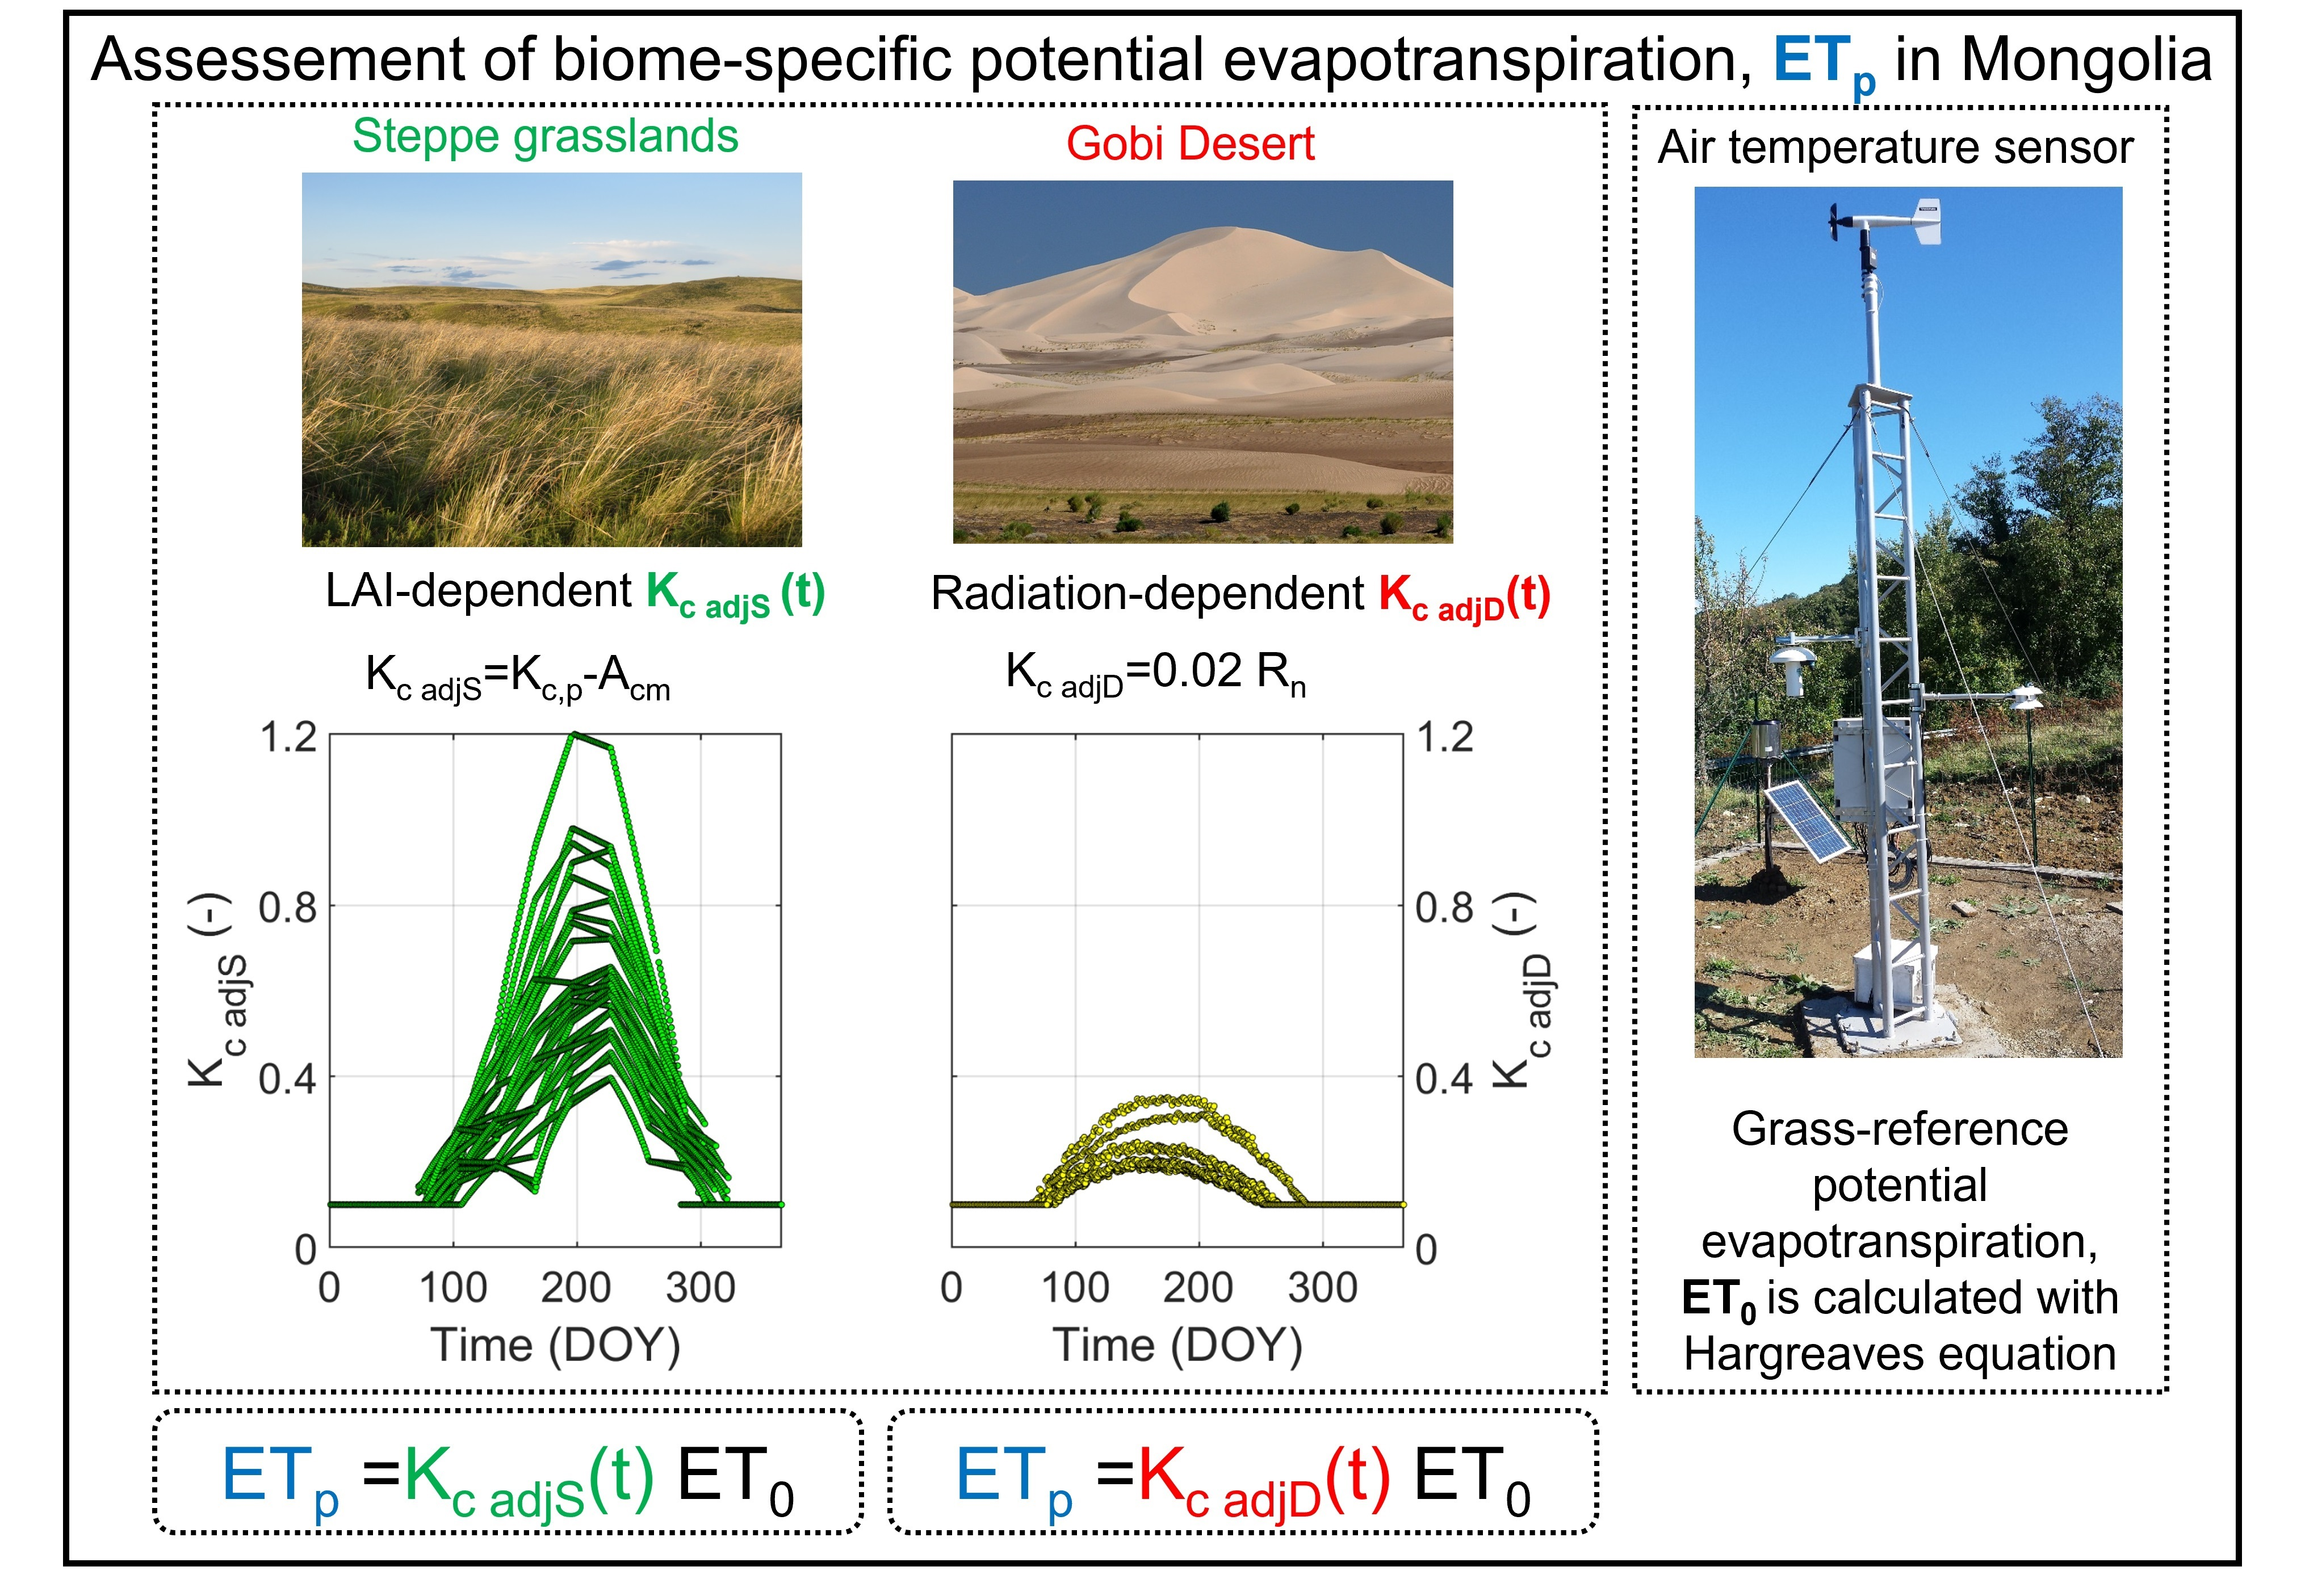
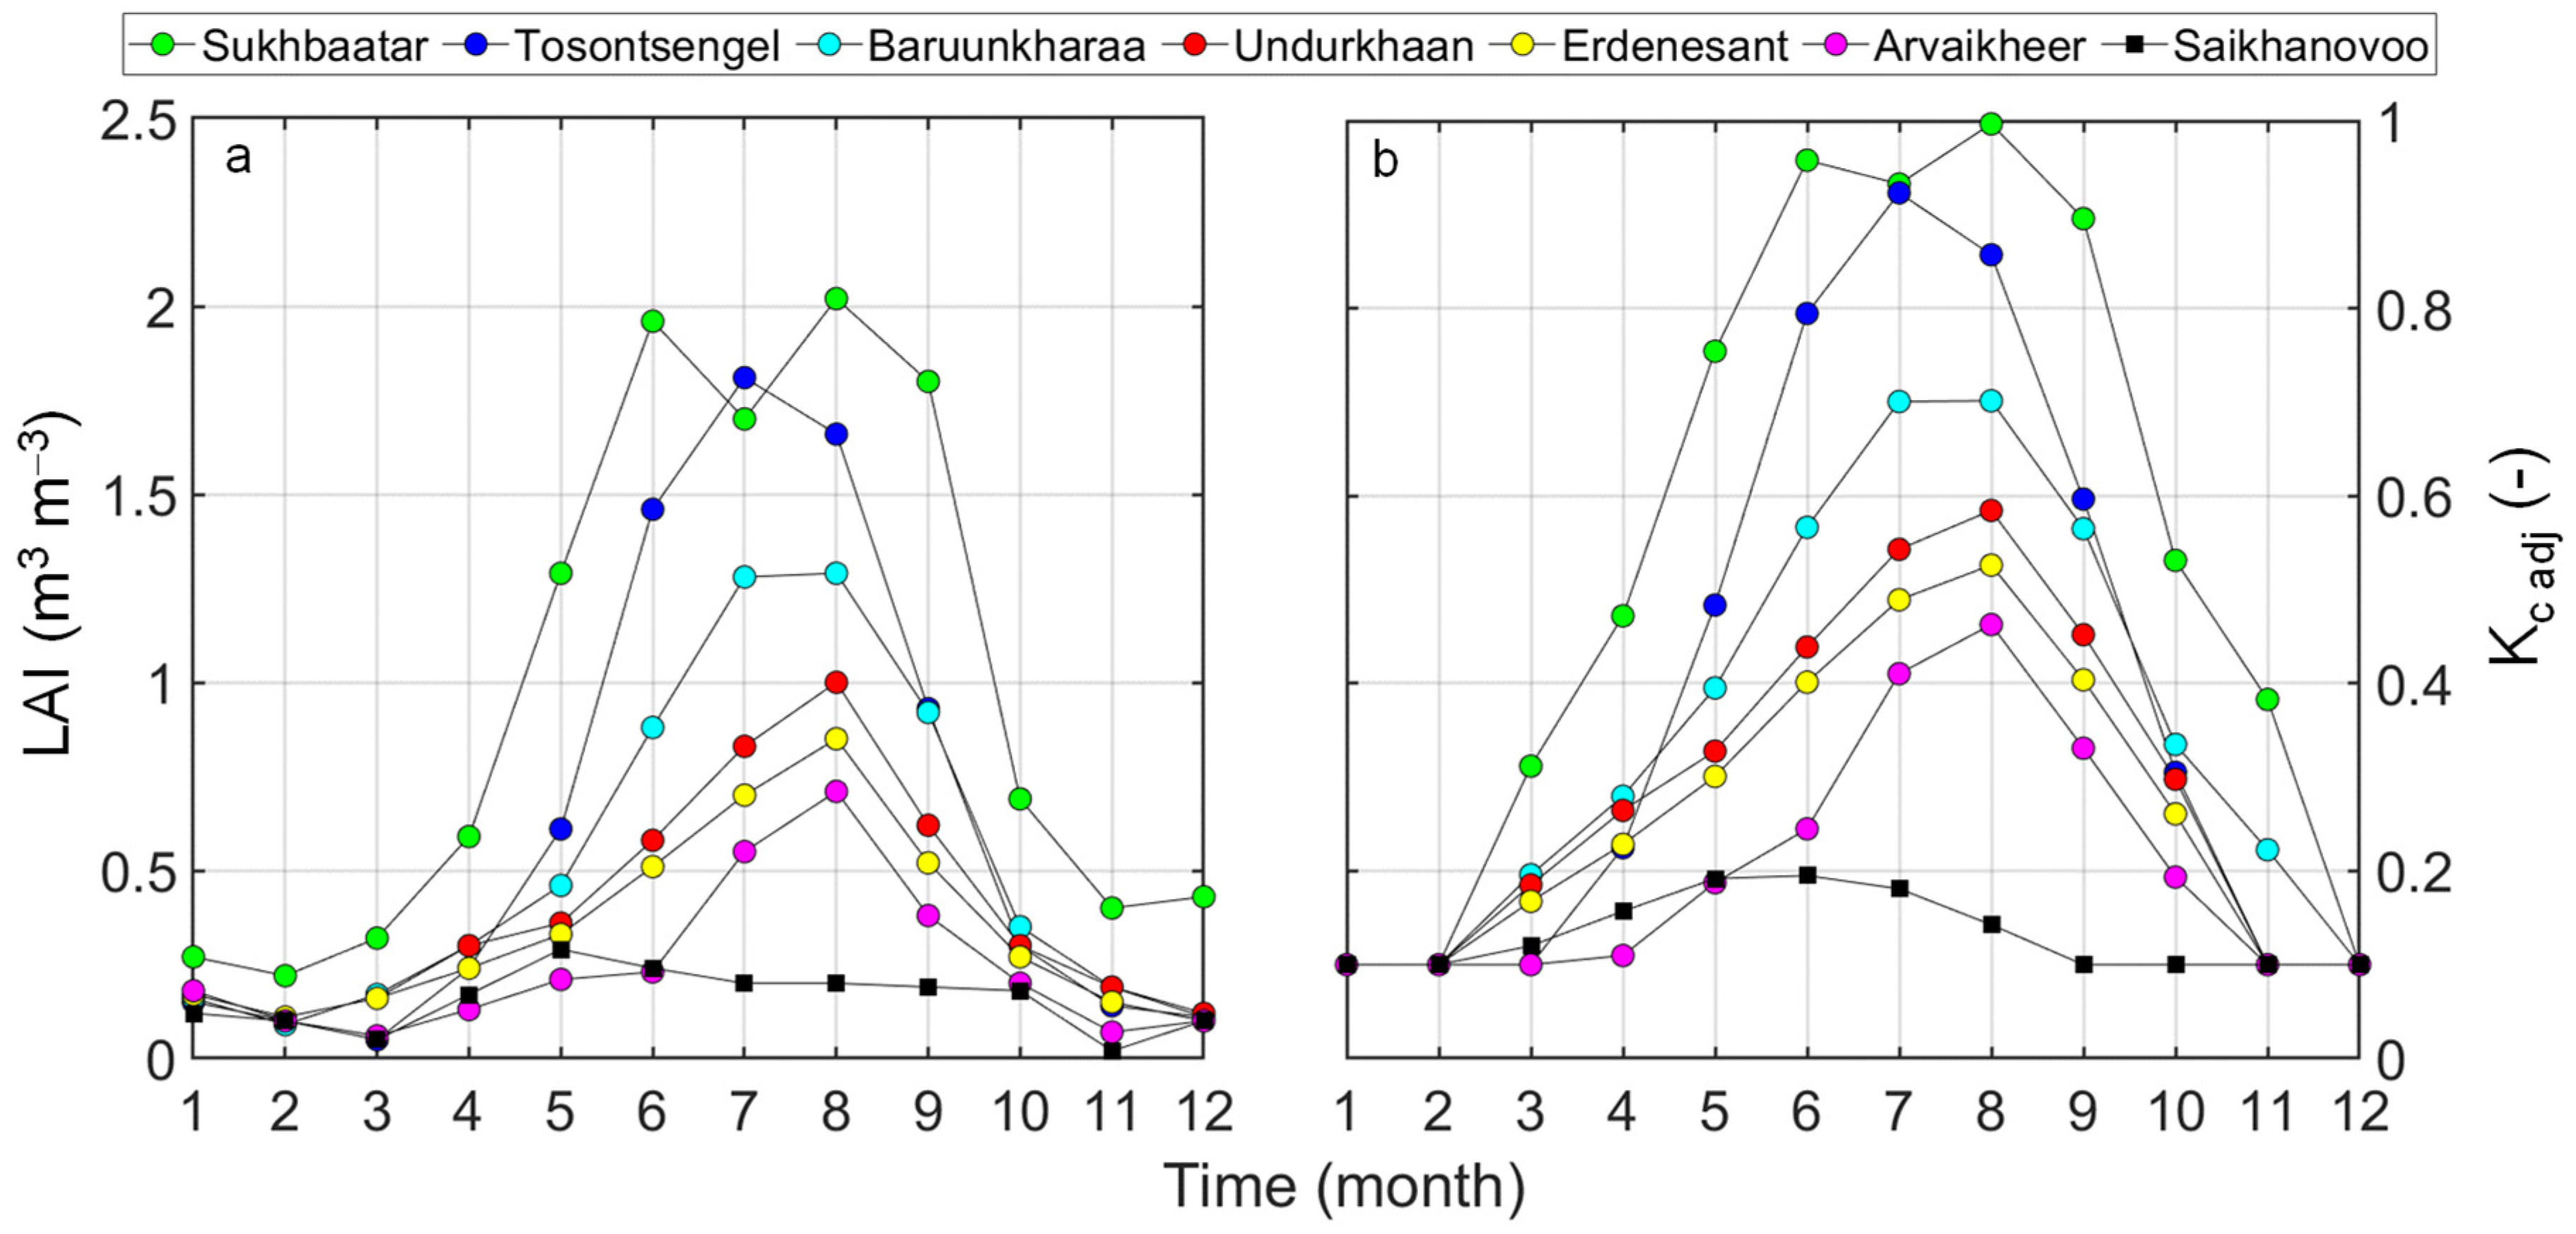
Nevertheless, the natural zones can be grouped into land cover zones of the Gobi Desert and the steppe (
Table A1 in
Appendix A). Then, different methods to develop
Kc based on different climate and phenological characteristics for those two zones were explored and implemented in our study (
Figure 2b). Previous studies have indicated that the
Kc values vary significantly during the growing season; therefore, it is impossible to assume
Kc as constant over time. This study attempts to propose a time-variant crop coefficient,
Kc adj, using easily-retrievable data, such as solar radiation or
LAI, and therefore,
ETp values can be obtained (
ETp =
ET0 ×
Kc adj) in study locations.
In the Gobi Desert ecosystem, the crop coefficient taken from the FAO-56 guidelines [
2] is not suitable due to scarce and sparse vegetation. The following simple relation is, therefore, used to estimate daily variations of the proposed crop coefficient [
12],
Kc adjD, based on the measurement of solar radiation:
where
Rn is net solar radiation.
In the steppe zone in Mongolia, similar studies are scarce, and there are no readily available approaches providing crop coefficients in the FAO-56 report [
2]. Some guidelines for (non-crop) grassland in arid climates require parameters such as vegetation height, air relative humidity, and wind speed, and their use is not straightforward. For example, the crop coefficient,
Kc,p, in a non-irrigated pasture site in Florida, USA [
33] ranged from 0.47 to 0.92 and could be presented by a linear function of leaf area index (
LAI):
where the empirical parameters are assumed as
a = 0.330 and
b = 0.451. However, the natural vegetation growth is subject to various constraints. Therefore, we propose to adapt the crop coefficient to steppe grassland (
Kc adjS) proposed by [
2] for sparse vegetation under local conditions:
where
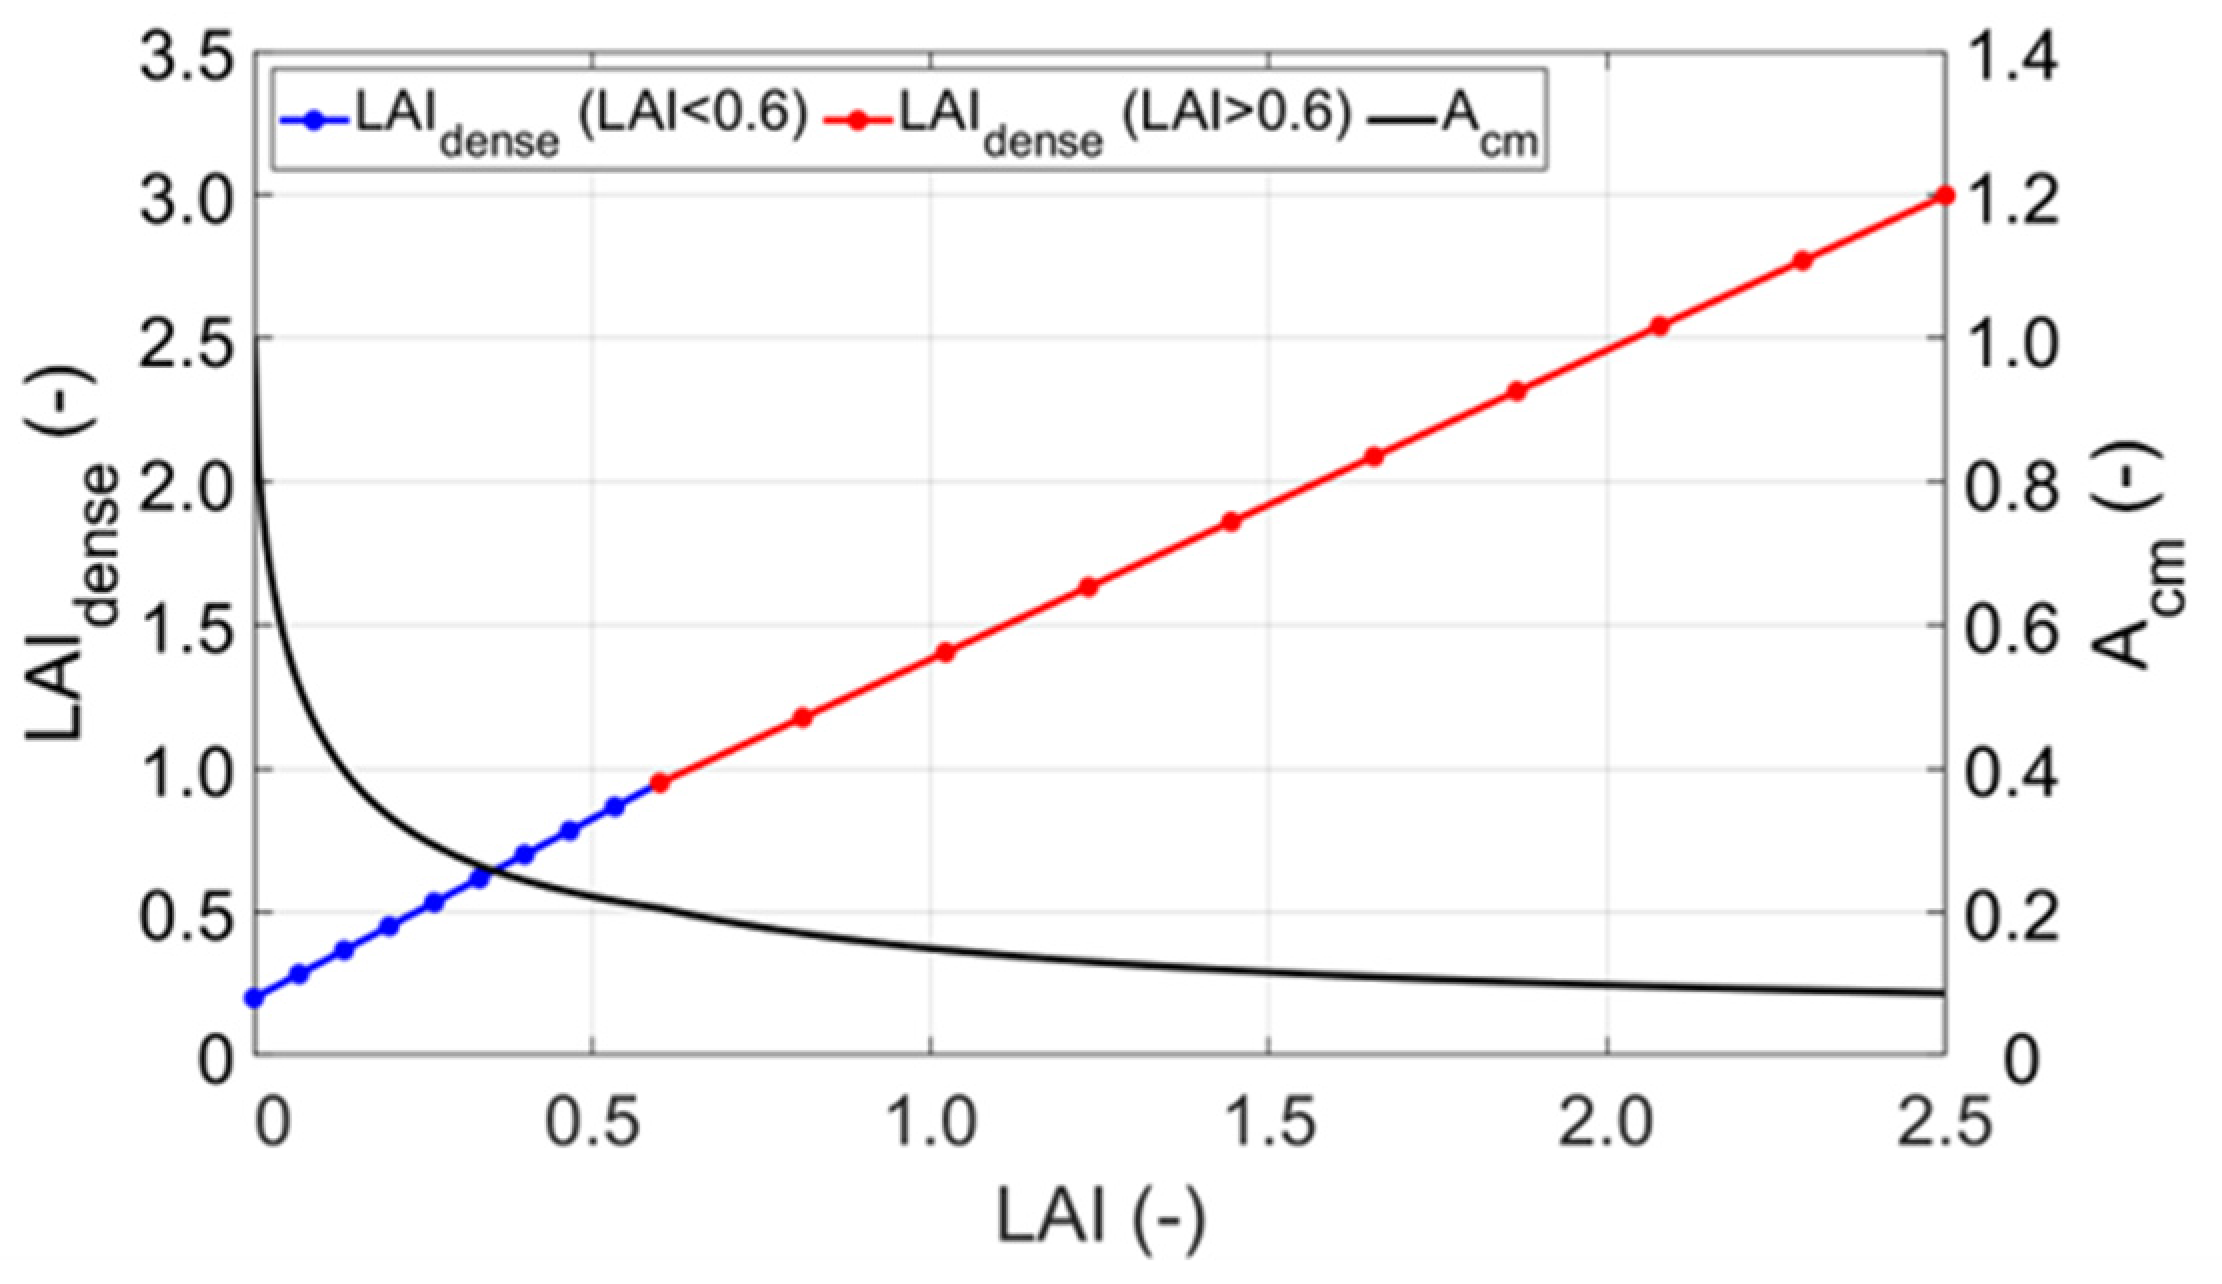
Acm is another empirical parameter given by the following equation:
where
LAIdense is the
LAI expected for the same crop under normal, standard crop management practices. The
LAIdense can be predicted from the ground cover ratio.
The same linear function could not be applied in all study locations throughout the steppe due to contrasting vegetation characteristics. After multiple attempts, the
LAIdense values in the steppe zone in study locations with higher-than-average
LAI values (
LAI > 0.6) and locations with lower-than-average values (
LAI < 0.6) were calculated using the following equations:
Figure 3 shows
Acm and
LAIdense as a function of
LAI.
By estimating
LAIdense from Equation (5), daily
Kc adjS and
Acm can be calculated in Equations (3) and (4), respectively, and therefore,
ETp values can be obtained (
ET0 ×
Kc adjS) in study locations belonging to the steppe zone in Mongolia. Grass pasture is assumed to be predominant in the steppe. The growing season of grass pasture is assumed to start seven days before recording 4 °C in spring for the last time until seven days after recording −4 °C in fall for the first time in all study locations. The crop coefficient in the dormant season is considered as 0.1 in all study locations by the guidance of [
2].
As indicated above, leaf area index
LAI plays a critical role in generating input data for modeling the water balance of the vadose zone. This parameter is used in Beer’s law, which partitions
ETp into potential evaporation,
Ep, and potential transpiration,
Tp [
34]:
where
SCF is the soil cover fraction (–), and
k is the radiation extinction constant (–), usually assumed to be equal to 0.463 as indicated by various studies, e.g., [
34,
35,
36].


