1. Introduction
River discharge data from watersheds are of significance in establishing a water resource management plan. Nevertheless, the continuous measurement of the flow discharge is challenging, and thus, the corresponding data can be determined by measuring the water stage with a rating curve, which is a regression curve to represent the relationship between the water stage and discharge. Although the simple form in which the rating curve is expressed as a power function is useful for hydrologic analysis when the gauging points satisfy the assumption of the rating curve, the river geomorphology changes continuously if a river hydraulic structure is installed to ensure flood control and water supply. Moreover, because river hydraulic structures are installed at key locations for water resource management, the relationship between the water stage and discharge becomes more complex with channel or section control.
Thus, estimating the discharge upstream of hydraulic structures is becoming increasingly important, as these data are essential to ensure reservoir operation and water resource management. Various studies have been conducted to estimate the discharge. Wesphal et al. [
1] proposed a looped rating curve considering unsteady flow characteristics, and Gergov and Karagiozova [
2] used the channel width as a variable for a rating curve to reproduce the non-linear relationship between the water stage and discharge. In addition, Retian and Petersen-Øverleir [
3] proposed a looped rating curve to consider unsteady flow characteristics based on the Ornstein–Uhlenbeck process.
However, these typical rating curves involve certain limitations in reflecting unsteady flow characteristics, backwater effects, and flow control in rivers because they are based on a one-to-one function in the form of a logistic regression curve. To solve these problems, several approaches such as those involving the stage-fall-discharge (SFD) relation [
4,
5,
6], hydraulic performance graph (HPG) [
7], or hydraulic modeling [
8,
9,
10] have been proposed.
The SFD approach, also known as the twin-gauge approach, was developed to represent the change in the water surface between two gauging stations [
4,
6,
11,
12]. Petersen-Øverleir and Retian [
6] proposed a method to estimate the parameters of the rating curve by considering the backwater effect based on the Bayesian approach. In their method, the parameters of the simplified hydraulic equation (rating curve) were estimated based on the Bayesian approach, with the prior and posterior probabilities based on their experience and measured data, respectively. Unlike a data-driven model or an artificial neural network (ANN) model, the rating curve with estimated parameters can be driven by the SFD, although the SFD approach is less physically representative compared to the former two approaches, because it is a stochastic method.
An HPG is composed of multiple hydraulic performance curves (HPCs), which represent the relation between the water stage and discharge under the backwater condition and unsteady flow, among other cases. Schmidt [
7] developed an HPG based on the shallow water equation, neglecting the acceleration term. When determining the flow discharge using an HPG, data regarding the predefined reference discharge, Froude number, actual pressure gradient and additional information regarding the cross-section are required. Thus, the HPG does not tend to represent the relationship between the water stage and discharge as a simple equation, as in the case of the general rating curve, which limits its practical application. Furthermore, compared to the SFD, the HPG requires more data and involves a more complex process to develop the relevant equation.
In the hydraulic modeling approach, a rating curve is established based on the result of a hydraulic model with a particle filter considering the uncertainties in the water stage and discharge [
8]. In addition, the looped rating curve based on unsteady flow characteristics can be identified considering the result of a two-dimensional hydraulic model. Lee and Kwon [
9] utilized a two-dimensional hydraulic model (RMA2) to examine the transition of the rating curve. Moreover, Lee and Gang [
10] tried to estimate the discharge and Manning’s n by applying the DWOPER model to the location in which the water stage is measured at three consecutive gauging stations. The hydraulic modeling approach involves the same limitation as that of the HPG approach, and thus a simple form of the stage–discharge relationship cannot be derived. Moreover, two-dimensional hydraulic modeling requires considerably larger amounts of data and effort compared to the other two methods.
Among these three approaches, the SFD is the most robust method in the practical sense because the simple form of the rating curve can be derived, which has been widely used in the relevant domain. However, the existing literature [
6] involves only a limited number of case studies of the SFD because its verification against reliable data is challenging. In this study, the SFD approach proposed by Petersen-Øverleir and Retian [
6] is applied to the region upstream of the Sejong weir in Korea, and the applicability of this approach is verified. Verification against reliable data is not trivial because this process is necessary to improve the reliability or investigate the limitation of methodology. Two sets of data, measured using an acoustic Doppler current profiler (ADCP) with floating objects and acoustic Doppler velocity meters (ADVMs) are used. ADVMs adopt the Doppler principle to measure the water velocities in a two-dimensional plane of stream. The river discharge can be converted from the stage, with the mean velocity measured using ADVMs. In general, ADVMs have an advantage over the typical rating curve in the respect of real-time base discharge data considering the unsteady flow characteristics and backwater effect. However, the costs for installation and maintenance, as well as technical issues for measurement of data calibration considering regional flow characteristics, are obstacles to the practical applications of ADVMs. The SFD approach is an attractive alternative because it considers backwater or unsteady flow effect with less cost as compared to ADVM. The performance of the SFD rating curve was compared with ADVM measurement data.
3. Study Area and Data
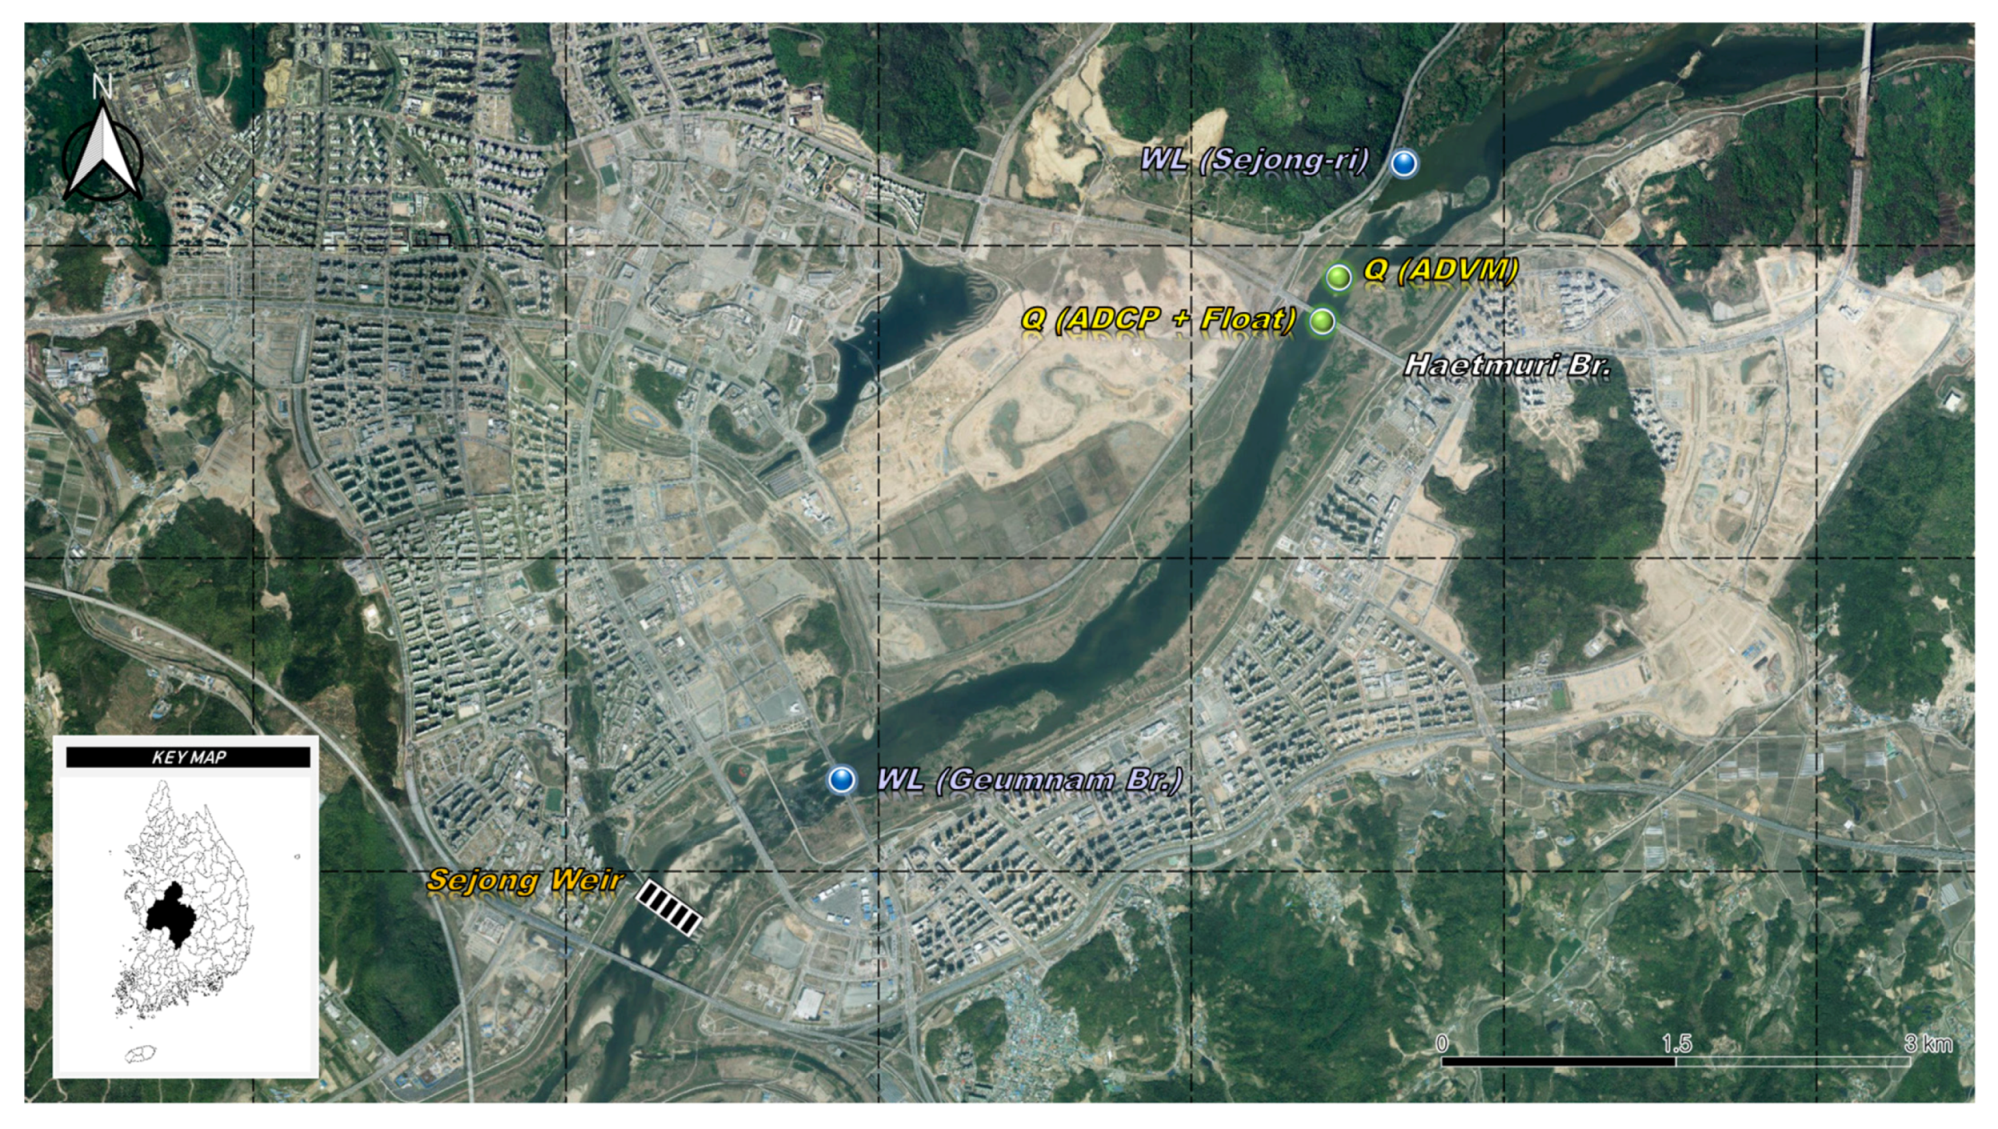
The study area is the upstream region of the Sejong weir located in the Geum River in Korea (
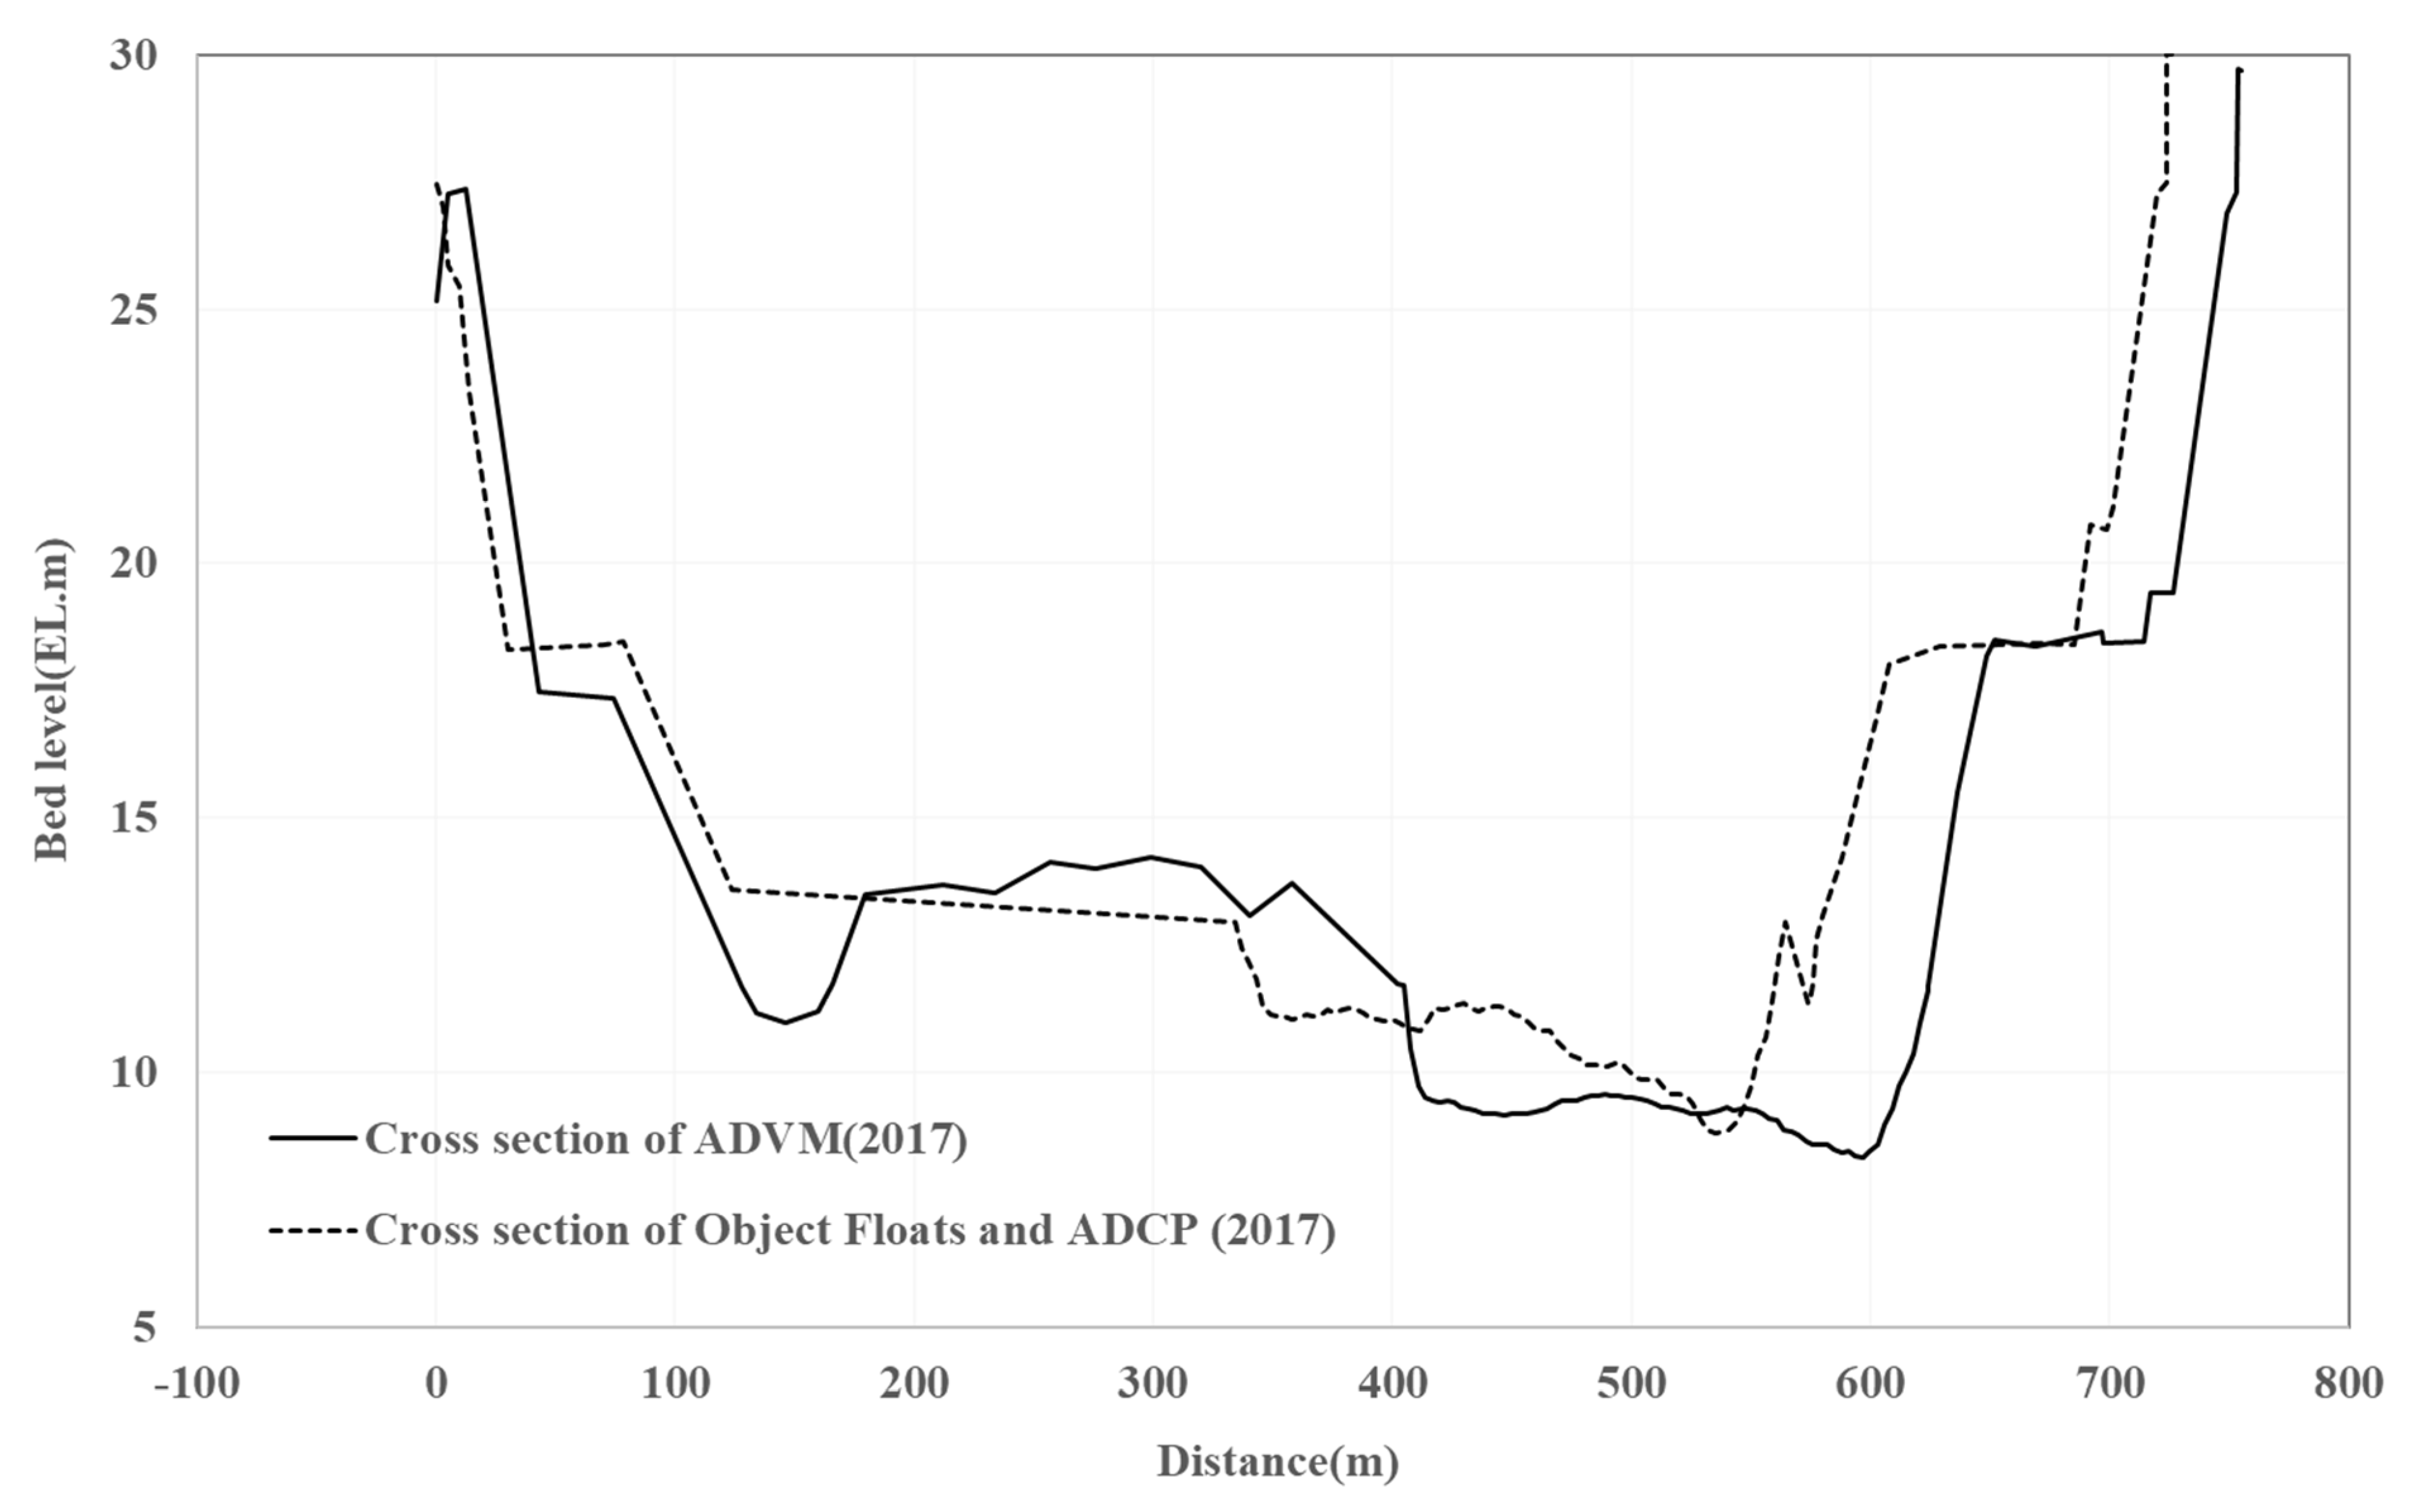
Figure 1). The river includes two water stage gauging stations that also measured the discharge. Specifically, the water stage is measured at Sejong-ri (upstream) and Geum nam Br., and the discharge is measured using ADVMs between Sejong-ri and Haetmuri Br. and an ADCP and floating objects at Haetmuri Br. As shown in
Table 1, Geum nam Br. is 1 km upstream of Sejong weir, and Sejong-ri is 4.5 km upstream of Geum nam Br. Therefore, the water stages of Geum nam Br. and Sejong-ri are considered as the downstream and upstream water stages in the proposed method, respectively. Because the water stages of Geum nam Br. and Sejong-ri are directly affected by the gate operation of the Sejong weir, conversion from the water stage to discharge through a typical rating curve cannot effectively consider the backwater effect. In addition,
Figure 2 shows the cross sections of measuring discharge using ADVM and ADCP or floating objects.
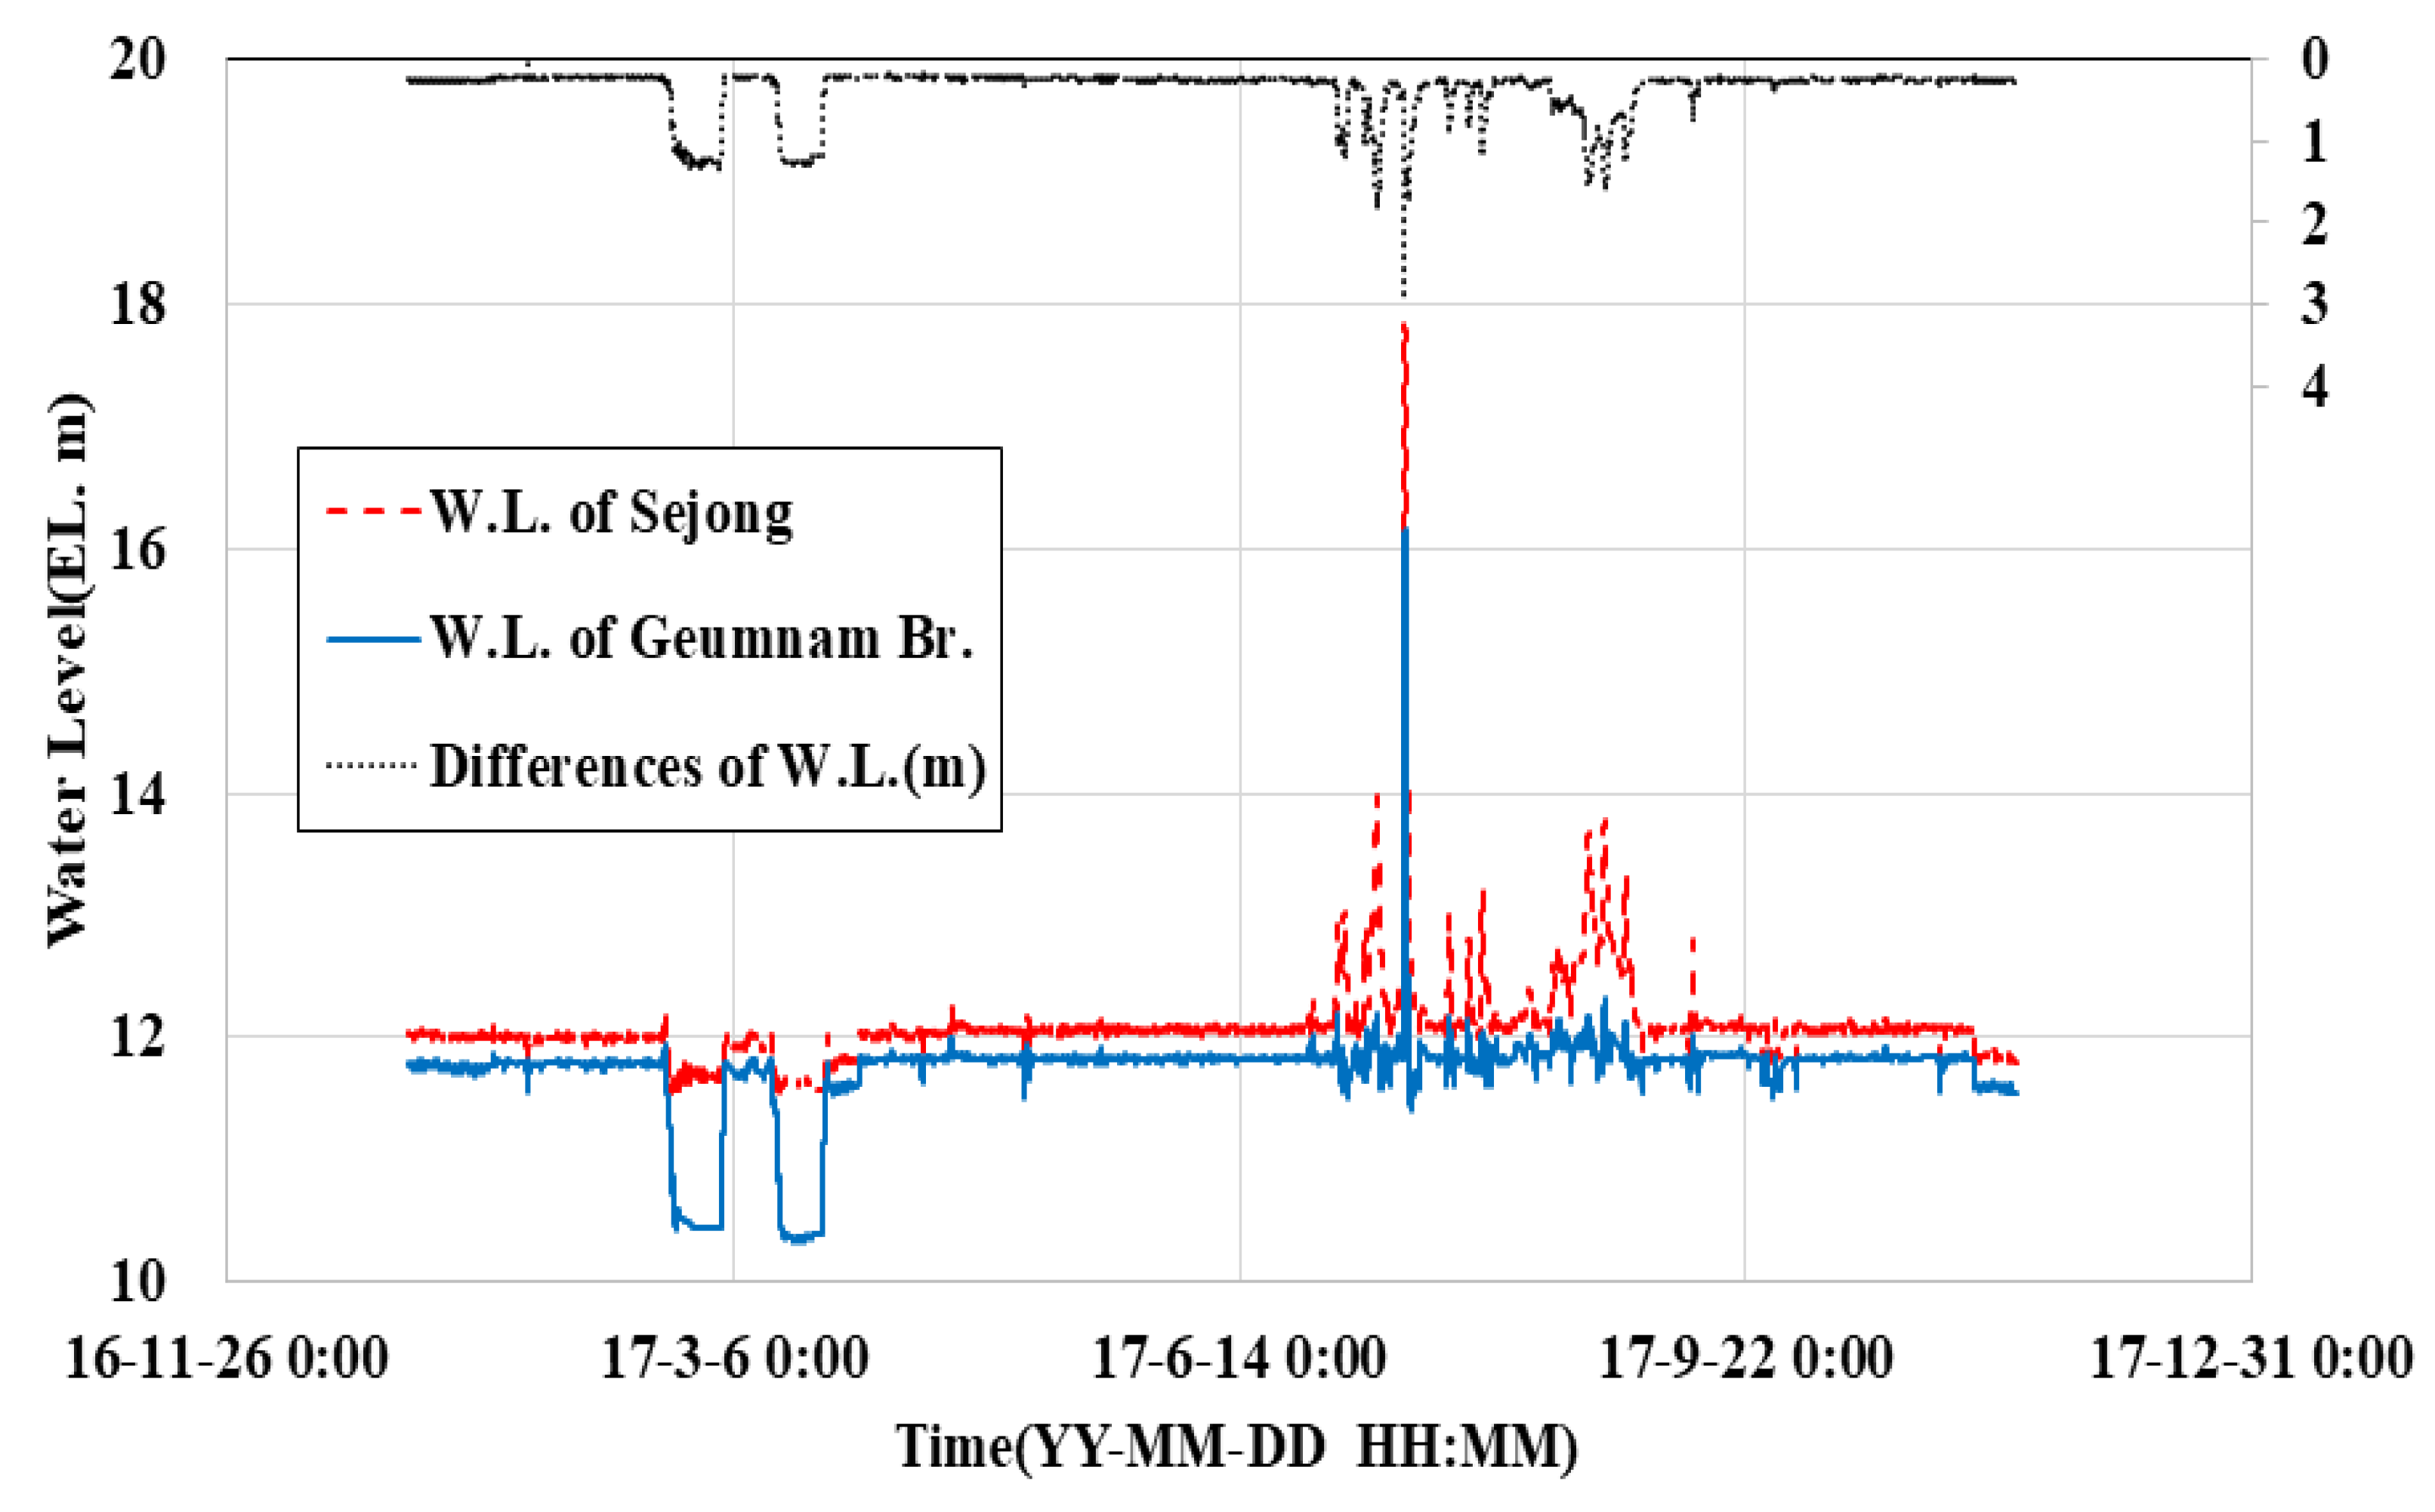
The gap in the water stages of Geum nam Br. and Sejong-ri in 2017 is shown in
Figure 3. The large differences in the water stages in March 2017 can be attributed to the gate operation of the Sejong weir, and the change in the discharge can be attributed to the sudden change in the flow velocity.
To apply the method, two sets of discharge data are used. The discharge for the first set is measured using floating objects (over 1000 m3/s, 14 data points) and the ADCP (under 1000 m3/s, 23 data points) at Geum nam Br. from 21 February 2017 to 14 November 2017. The water stage is the average value at the start time and end time of the discharge measurement at each water stage gauging station. These data are referred to as “ADCP data”. The second set of data are ADVM data obtained at 10 min intervals from 1 January 2017 to 14 November 2017. When applying the proposed method based on the Bayesian approach, the use of an excessive amount of data may lead to memory and computational problems. Therefore, the available data points (45,513) are reduced to 356 points by excluding certain data. (1) The data observed in July are only used since the largest flood occurred in July. (2) The data with discharge over 750 m3/s (3.23 m2/s, specific discharge) was used without data reduction. (3) Among the data with discharge under 750 m3/s, the data with water level change of less than 5 cm in time series was removed.
5. Conclusions
Several years ago, many hydraulic structures were installed in the major rivers in Korea. Consequently, the previously derived typical rating curves are no longer valid due to the backwater effect and operation of hydraulic structures. SFD rating curves represent an attractive alternative approach to the conventional rating curve in practical aspects because they derive a simple form of the equation, which is similar to the typical rating curve equation. In this study, the SFD approach proposed by Petersen-Øverleir and Retian [
6] is applied to the upstream region of the Sejong-weir in Korea, and the applicability of this approach is verified.
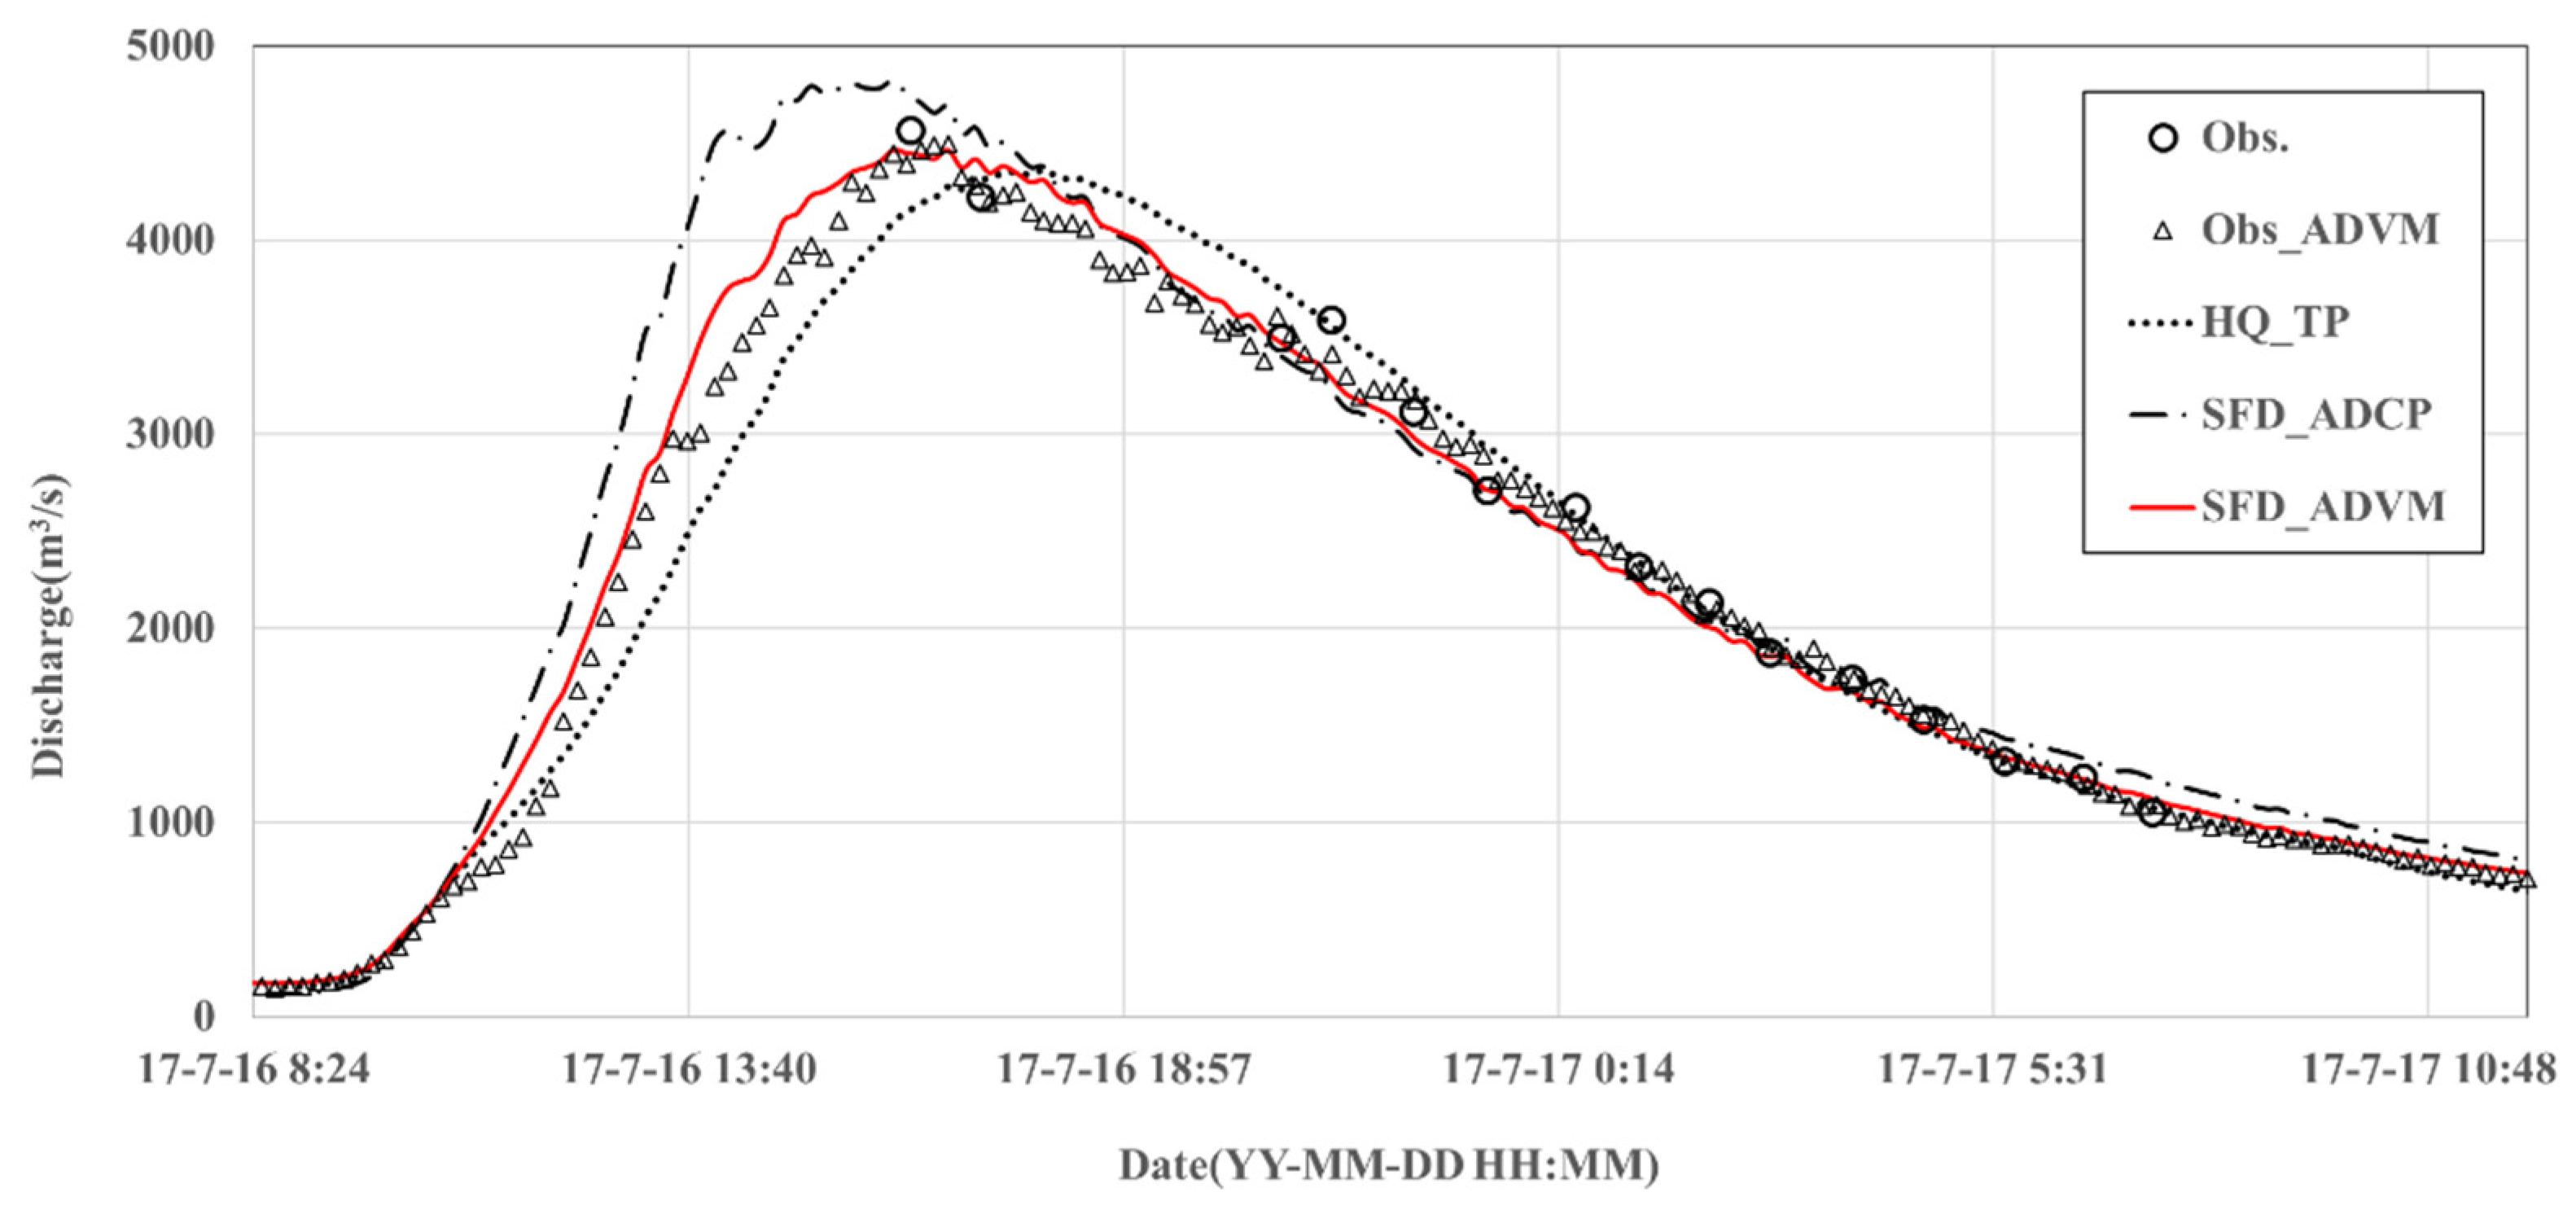
SFD rating curves are constructed using two sets of data pertaining to the ADCP and ADVM. Subsequently, the hydrographs reconstructed using the rating curves, SFD_ADCP, SFD_ADVM and the typical rating curve (HQ_TP), are compared with the ADCP and ADVM data. The hydrograph generated using SFD_ADVM is in agreement with the observed data. In contrast, a lag phenomenon can be observed in the hydrograph generated by HQ_TP, and the hydrograph generated using SFD_ADCP exhibits an overestimation tendency in the rising limb. The different patterns against the observed data can be attributed to the time difference at water level gauging stations and lack of observation data (ADCP). The results of the experiments confirmed that the SFD approach may be particularly useful when sufficient data are available to explain phenomena such as the variable backwater due to the hydraulic structure.
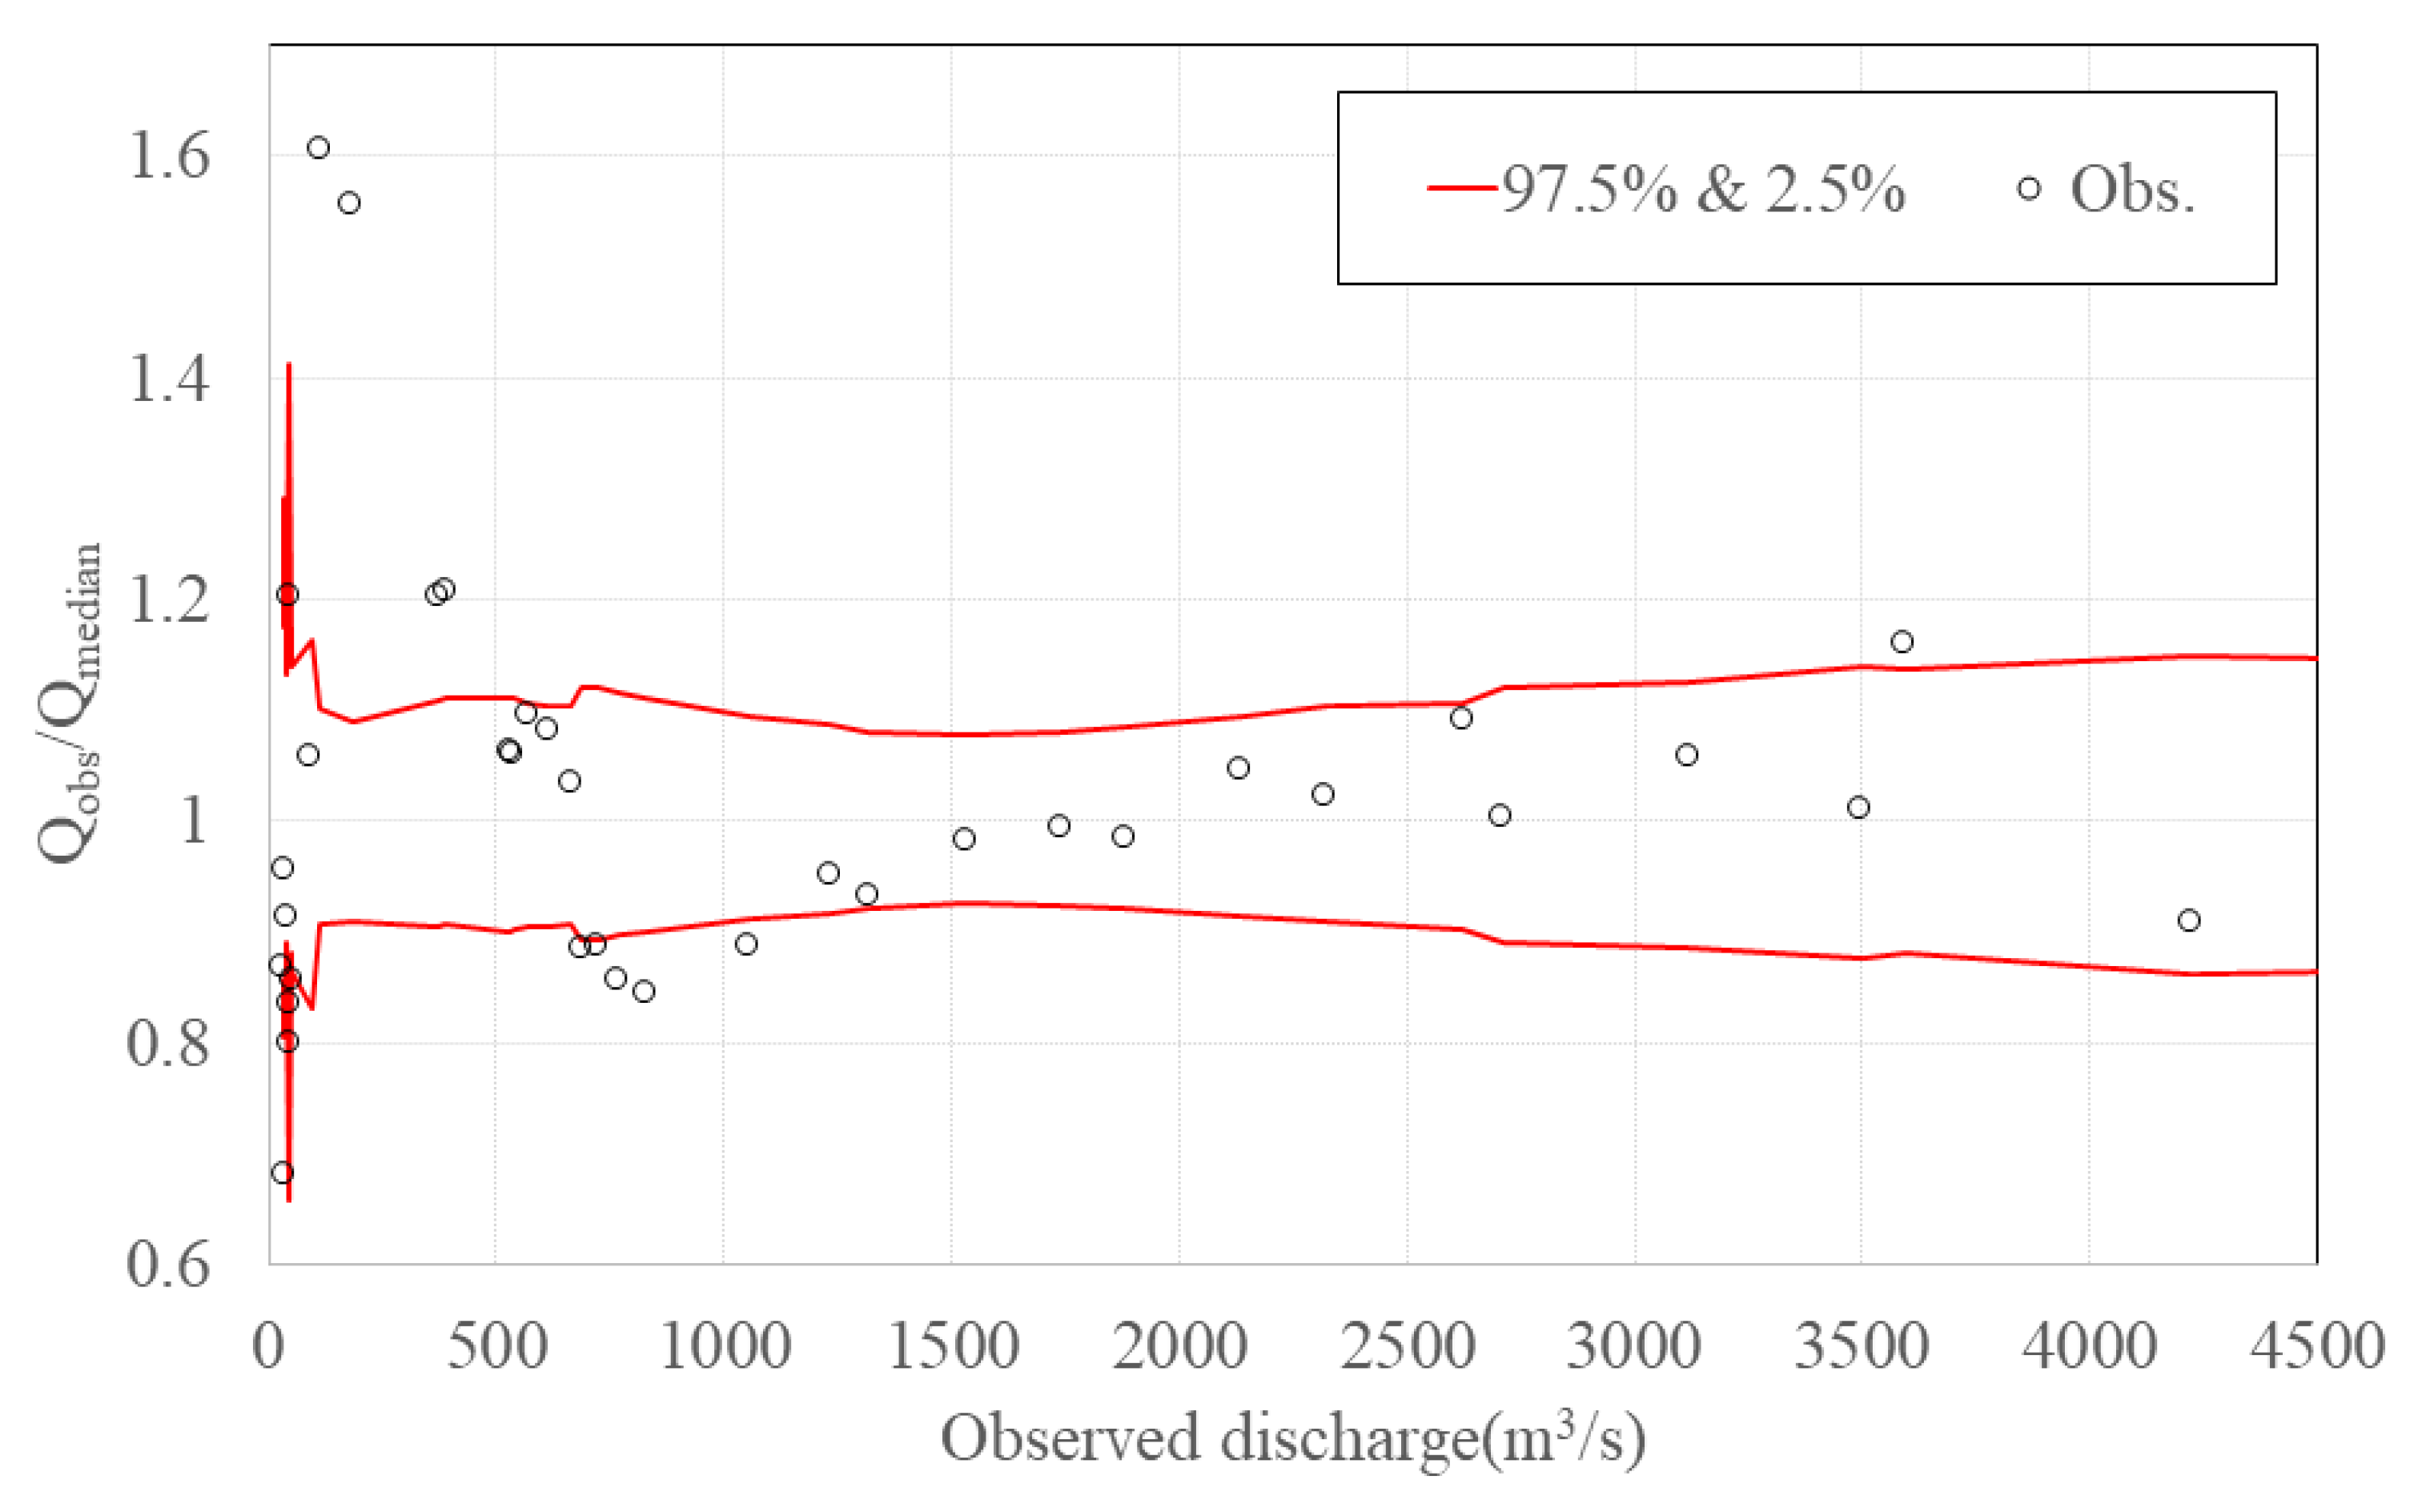
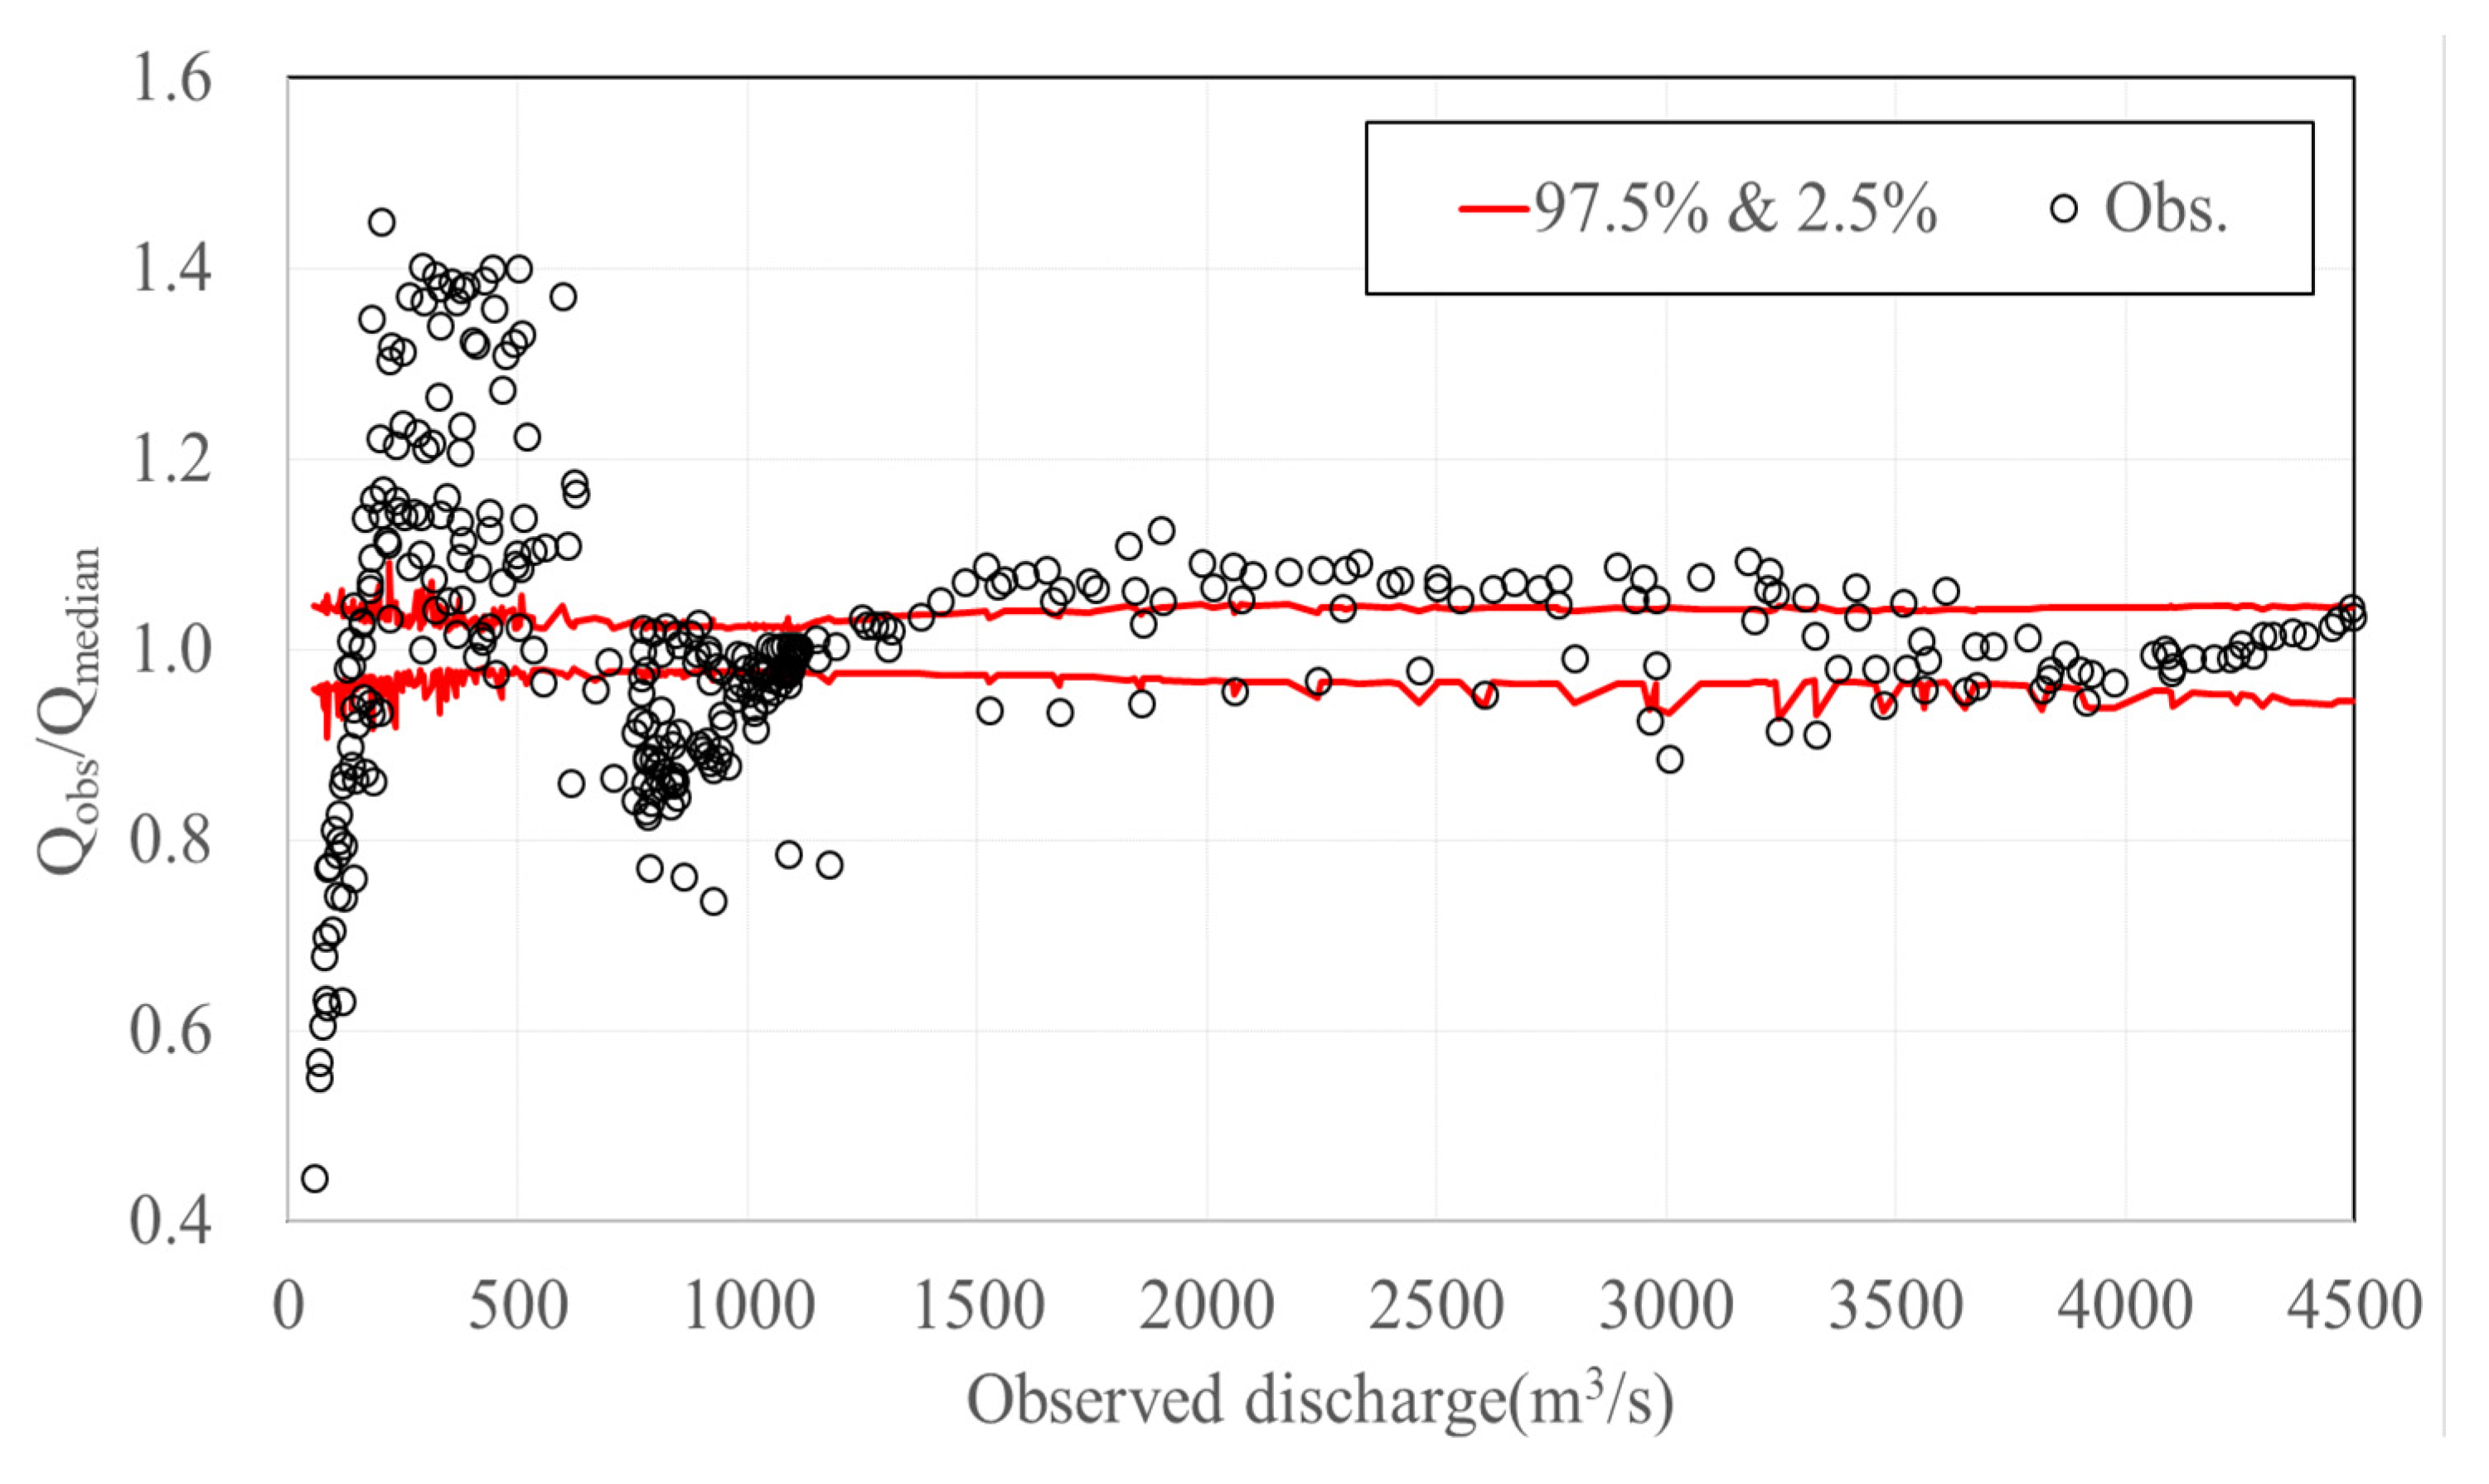
However, the SFD approach can not consider the effect of the gate operation, and thus, the adaptable distance from the hydraulic structure and the water level gauging station must be examined to apply this method. In this study, a criterion involving a value of approximately 1000 m3/s is considered to evaluate the influence of the gate operation and flow regime on the variable slope. This aspect is determined using the graph comparing the ratio of the median and observed discharge.
In practical applications, the simple formulation based on the SFD approach is of significance in estimating the reservoir inflow at the upstream hydraulic structure. Further research must be focused on the sampling, outlier detection, and parameter estimation for the SFD approach.


